
Industrial Performance of the Renewable Resources Industry in China

School of Economics and Management, North China Electric Power University, Beijing 102206, China
*
Author to whom correspondence should be addressed.
Sustainability 2015, 7(9), 11777-11798; https://doi.org/10.3390/su70911777
Submission received: 7 May 2015
/
Revised: 5 August 2015
/
Accepted: 6 August 2015
/
Published: 26 August 2015
Abstract
:Promoting the development of renewable resources industry is an effective way to solve the problems of resources shortage and environmental pollution in China. In this paper, studies have found that “market structure” and “ownership structure”, namely “double structure”, is an important explanatory variable that affects industrial performance according to the “structure-conduct-performance” paradigm. Literature reviews have shown that large state-owned enterprises are playing an important role in improving the industrial performance because of the advantage in technology and capital. However, this paper analyzed the performance of China’s renewable resource industry from two aspects—the overall industrial development and the listed companies, from which two conclusions have drawn: (1) Above a designated size, private enterprises have the greatest contribution, while the contribution of state-owned and foreign-funded enterprises is different; (2) The main reason for the high positive growth rate of total factor productivity between 2009 and 2013 is the rapid growth of technological progress such as the improvement of production processes and manufacturing skills, rather than the promotion of management, system, or polices.
1. Introduction
Environmental pollution and resource depletion are important issues constraining sustainable economic development. As an important resource, renewable resources receive more and more attention, and it is the same with related economic activities.
Recycling renewable resources is an effective way to achieve sustainable economic development. Now, the renewable resources industry has become the world’s fastest growing sunrise industry, and it has entered a mature stage in developed countries, playing an important role in saving resources and protecting the environment. The development of China’s economy and the rise of the recycling economy have brought both opportunities and challenges to the renewable resources industry. In order to push the development of renewable resource industry, growing importance has been attached to research on improving industry performance.
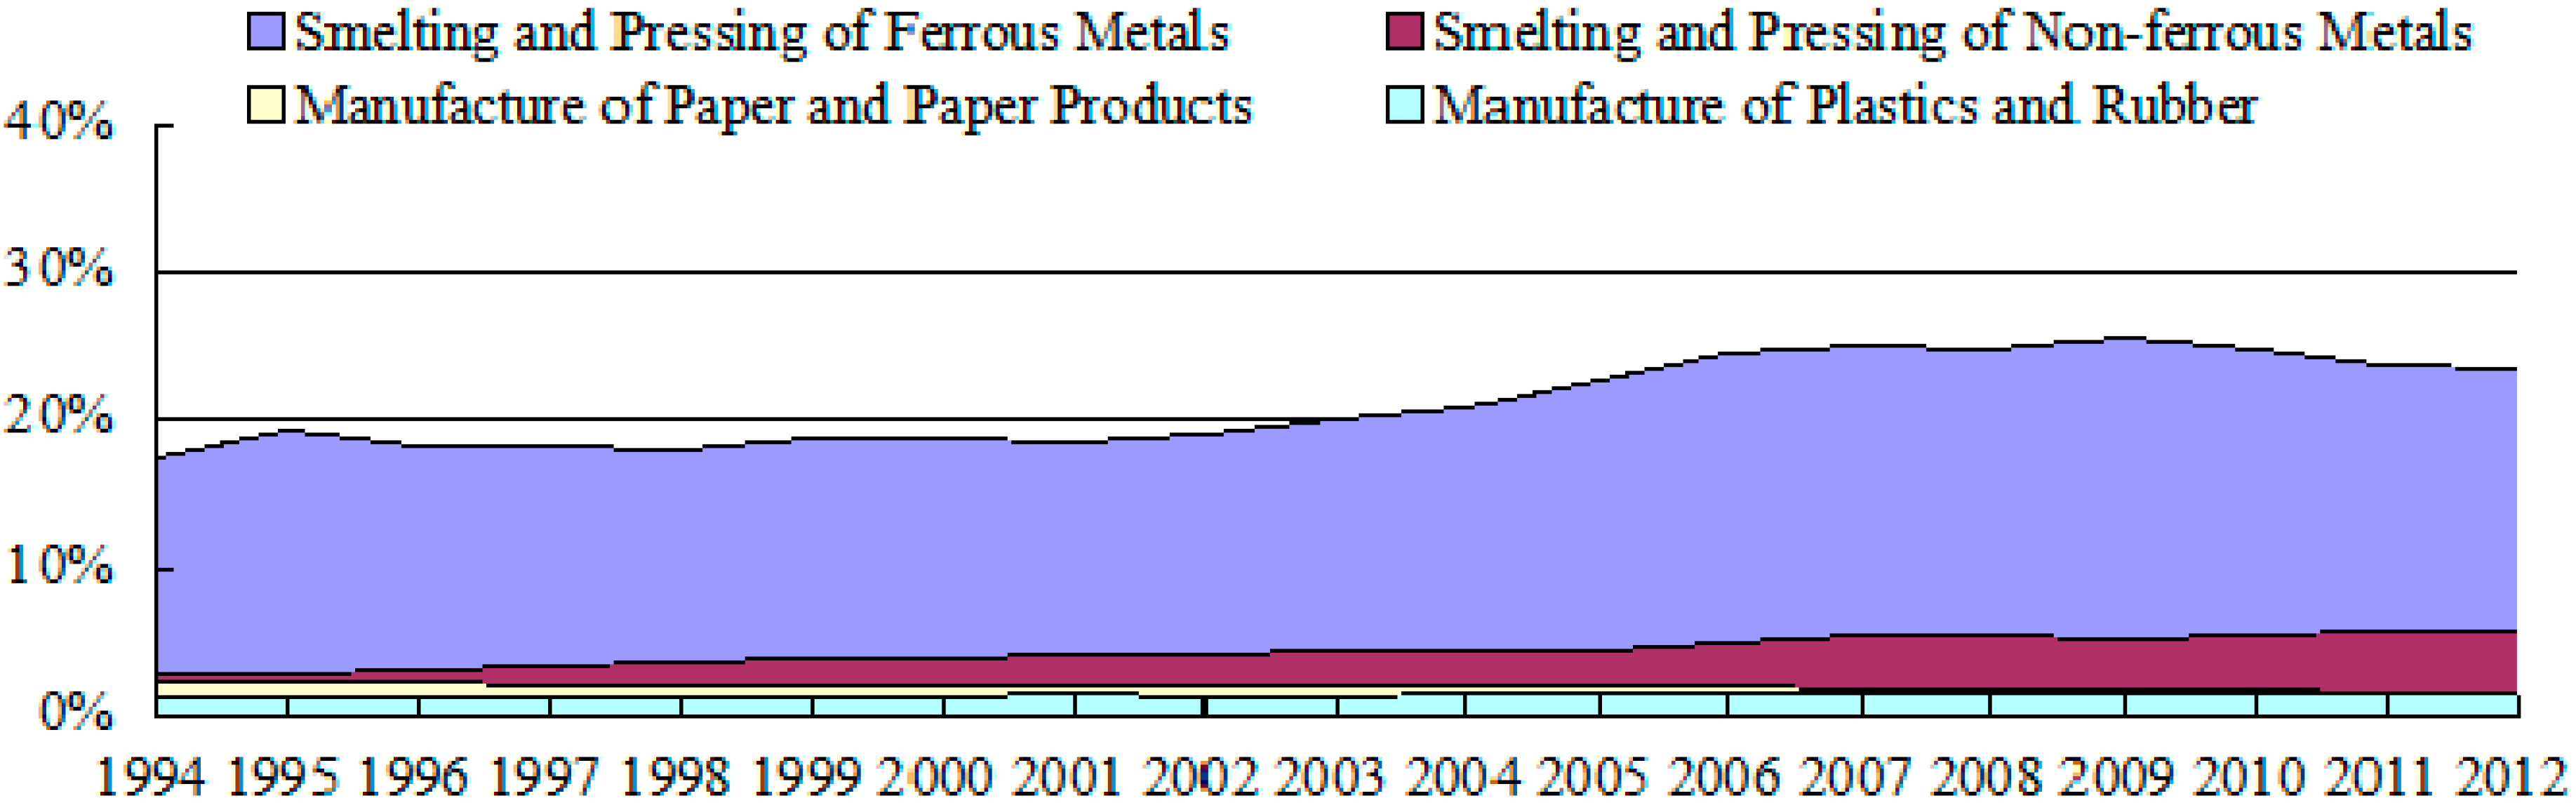
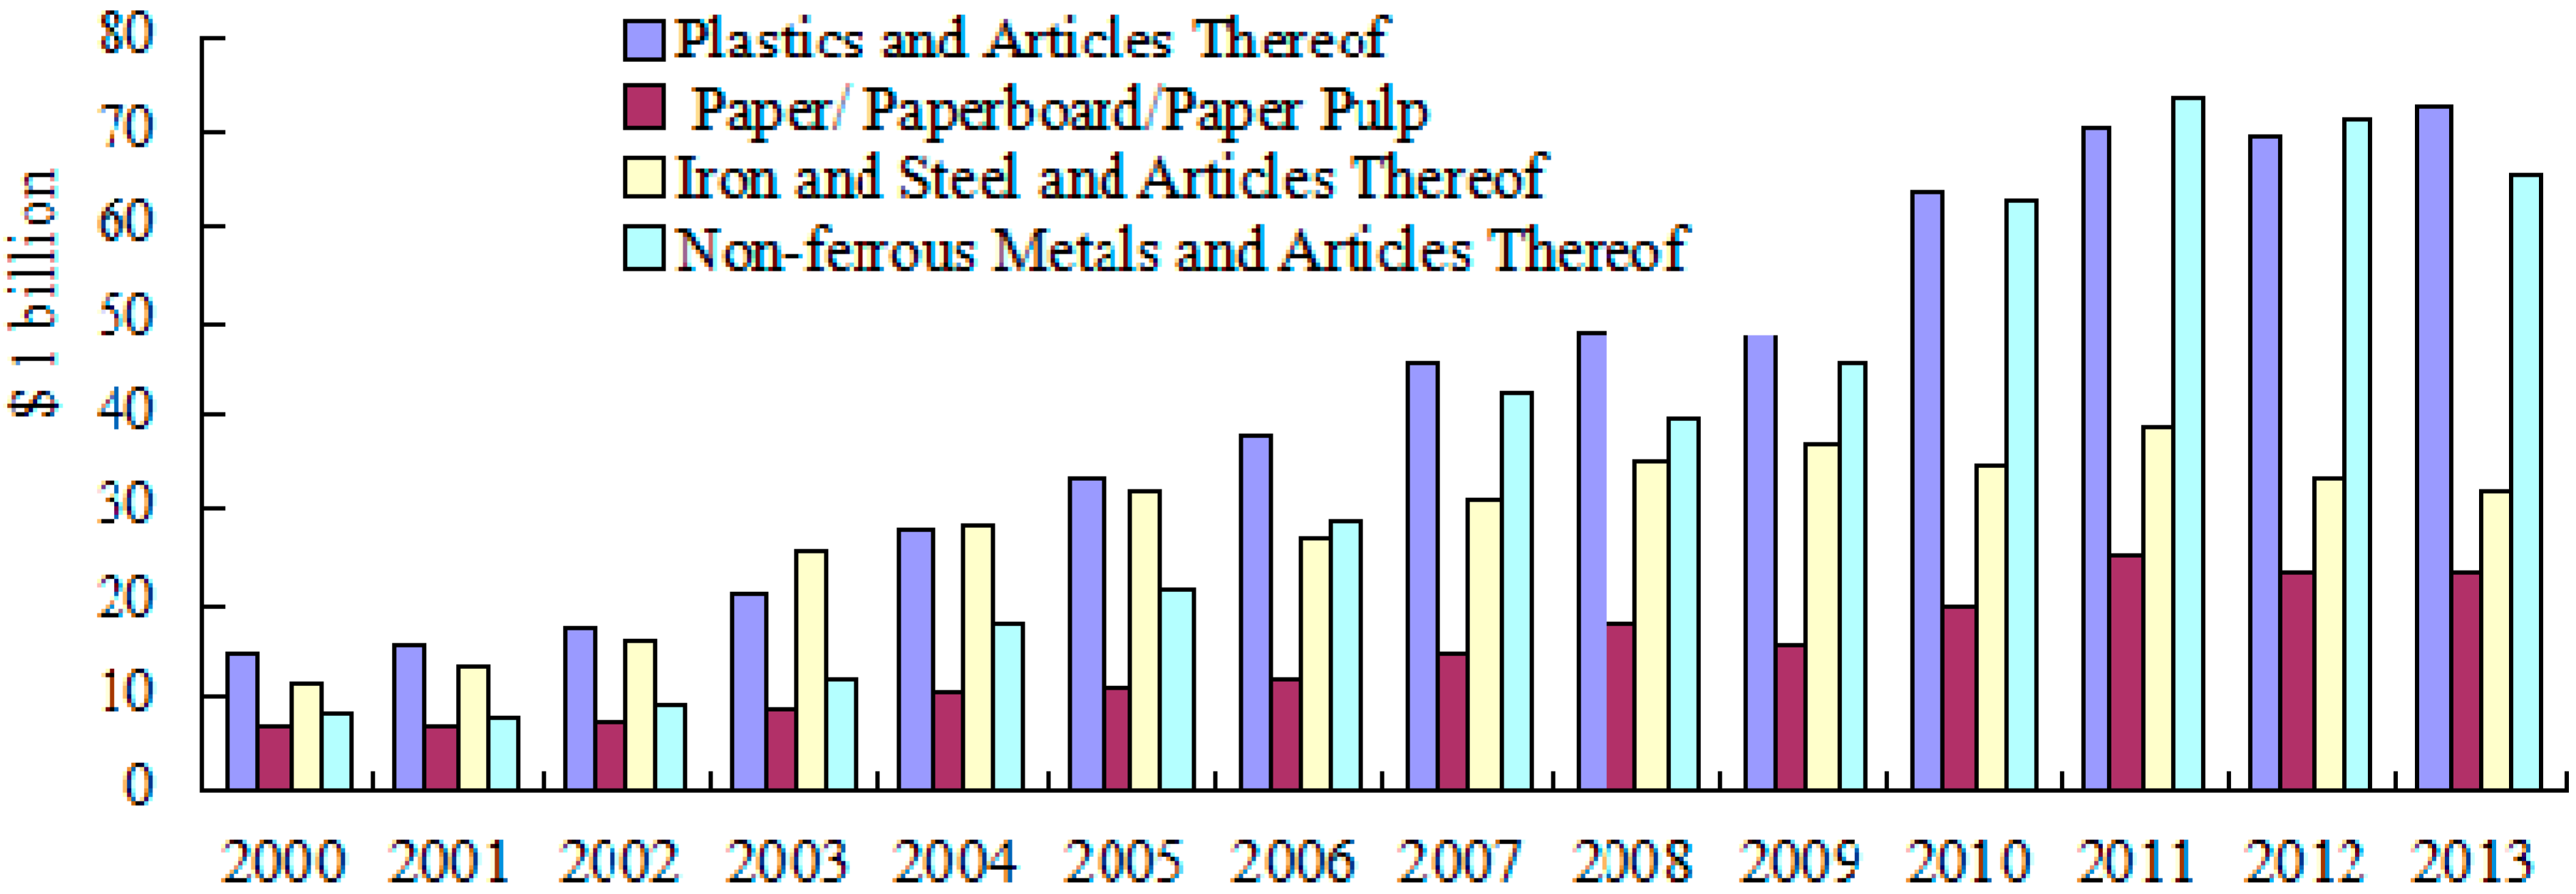
With China’s further economic development in recent years, constraints on resources and the environment become more serious, and it is more evident that resource shortages and environmental pollution pose a grave threat to economic and social development. China’s economic development has long followed the traditional extensive economic growth model, which features three high and one low (that is, high energy consumption, high pollution, high emissions, and low utilization), bringing resource depletion, environmental pollution, and other problems. For one thing, the production of products including iron and steel, nonferrous metals, paper, and plastics consumes a lot of energy, polluting the environment. Figure 1 shows that in recent years, the energy consumption of metal, paper, and plastic accounts for more than 30%; especially, the proportion of ferrous metal smelting and rolling processing in industry energy consumption is over 20% [1]. For another, China imports large quantities of these kinds of resources annually. Data show that total imports remain at around $200 billion, much of which belongs to plastic and non-ferrous metals; the total import of plastics and plastic products is $72.39 billion, and that of non-ferrous metals and non-ferrous metal products is $65.36 billion (Figure 2) [1]. Therefore, increasing the recycling of domestic waste and reducing the imports of raw materials can not only decrease energy consumption and improve the environment, but also achieve significant economic benefits.
Figure 1.
The proportion of different resource industries in China’s energy consumption (1994–2012) [1].
Figure 1.
The proportion of different resource industries in China’s energy consumption (1994–2012) [1].

Figure 2.
Revenues of China’s main imported resources (2000–2013) [1].
Figure 2.
Revenues of China’s main imported resources (2000–2013) [1].

The background reveals that researching the performance of the renewable resources industry is very important. Research on the renewable resources industry is helpful for the exploration of how this industry develops, and also helpful for reducing waste that gets into terminal processing and decreasing problems with land use and pollution. Research on the renewable resources industry not only has a demonstrable effect on the extensive economic growth model, but also helps change people’s vague understanding of the development of this industry. The renewable resources industry is a new sunrise industry in China, and its development and changes have distinctive Chinese characteristics, reflecting the evolution of our institutions, systems, and policies to some extent. Research on China’s renewable resource industry performance enables us to have a better understanding of the evolution of industrial policies and the features of the ownership structure system.
Domestic and foreign practices have shown that the recovery and utilization of renewable resources is an effective way to develop a “circular economy”. The development of the renewable resources industry is an effective and important way to solve such problems as resources depletion, energy shortages, and environmental pollution.
2. Literature Review
At present, scholars studying the renewable resources industry mainly focus on the development of renewable resources and their effect on environmental pollution, in order to solve the issues on resources utilization and minimization [2,3,4]. Policies also play an important role in the marketization process of the renewable resources industry [5,6,7,8,9].
There have been many studies on market structure, market behavior, and market performance based on the “structure-conduct-performance” (SCP) paradigm. William et al. [10] thought that as long as we maintain the complete freedom of the market, we can have good production efficiency and technological efficiency. Harold [11] found a positive correlation between market concentration and profitability, and also pointed out that the high profit margin in highly concentrated industries is the result of the production efficiency. Yin [12] and Qi [13] confirmed that industrial concentration has a significant positive correlation with economic performance indicators. Gale and Branch [14] concluded that the effect of the market share is more connected with profit margins. Marin and Siotis [15] argued that promoting industrial technology innovation is an important aspect on market performance. Xu et al. [16] pointed out that different industrial structures result in different industries’ performance and productivity. Tang [17] did empirical analysis on factors of industrial performance in China’s industries and found that the main factors are industrial market concentration and the density of cost of sales.
Many studies suggest that ownership structure has a significant effect on industrial performance. Oliver Hart et al. [18] and Shleifer [19] noted that, generally, private ownership is more suited to a competitive market than public ownership. Zuo et al. [20] found the rapid expansion of non-state enterprises dramatically changed the industrial production structure, and non-state enterprises have become the driving force of the rapid growth of China’s industrial output. Ng et al. [21] found an inverted u-shaped relationship between state ownership and performance. Not only is ownership structure found to affect performance, but also ownership concentration affects performance. Mei [22] found a firm profitability ratio of state-owned ownership is greater than that of a dispersed ownership structure because of the support from government policies. Knyazev et al. [23] did empirical analysis and found that in the short term, privatization of enterprises has a negative effect on performance, but the effect is positive in the long term. Liu [24] and Sun’s [25] empirical analysis shows that non-state-owned enterprises have good performance in a competitive market and the structure of state-owned property has a negative effect on industrial performance, while industry concentration and size variable have positive effects.
However, according to the above literature review, only a few studies focused on the industrial performance of the renewable resources industry. Therefore, this paper, whose topic is exploring the factors that affect the performance of Chinese industry, becomes more meaningful.
3. The Status Quo and Problems
3.1. Overall Situation
Development of the renewable resources industry is an effective and important way to solve China’s resource depletion, energy shortages, environmental pollution, and many other problems. As a basic national policy of China, the development and utilization of renewable resources has achieved success; the industry keeps expanding and the recycling system is gradually improving, especially after development of the renewable resources industry was set as the major strategic task of China’s “Eleventh Five-Year” period in 2006. At present, the number of China’s renewable resource recycling enterprises has reached more than 10 million; the number of recycling outlets is over 30,000 and the employees are about 18 million people [26].
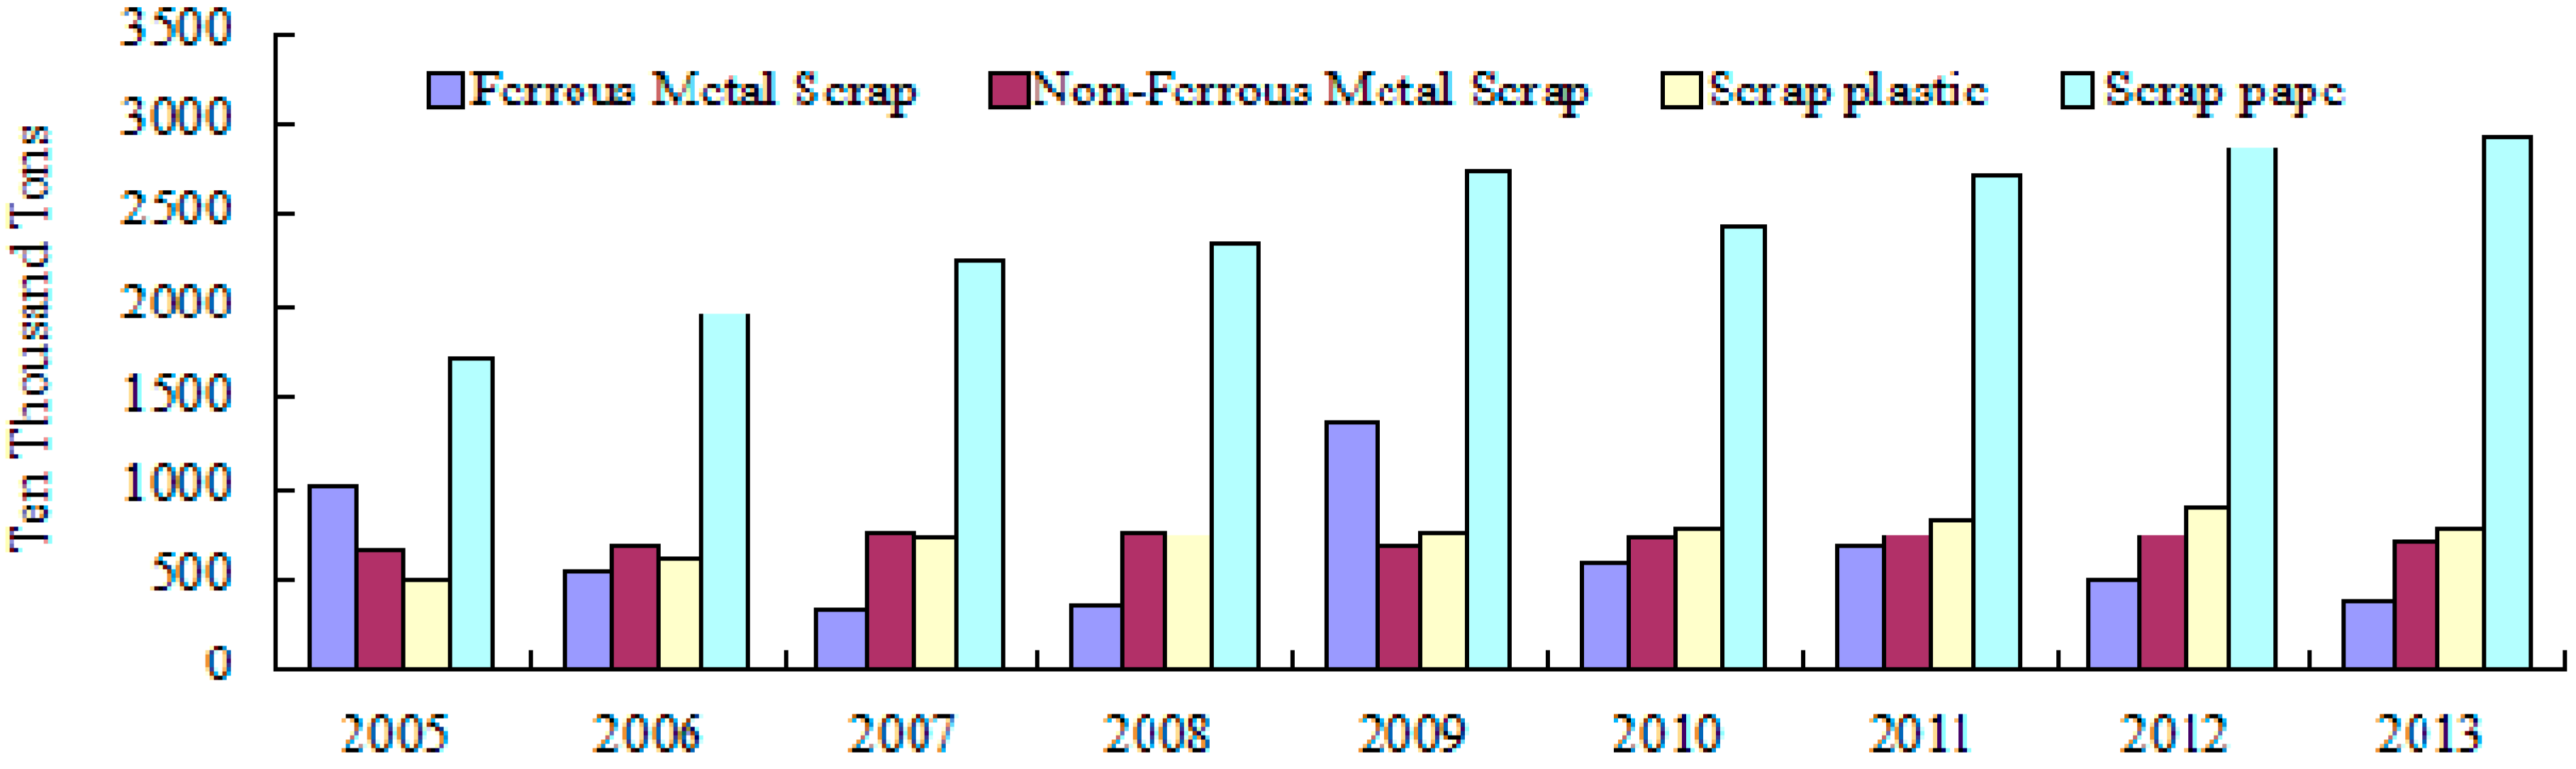
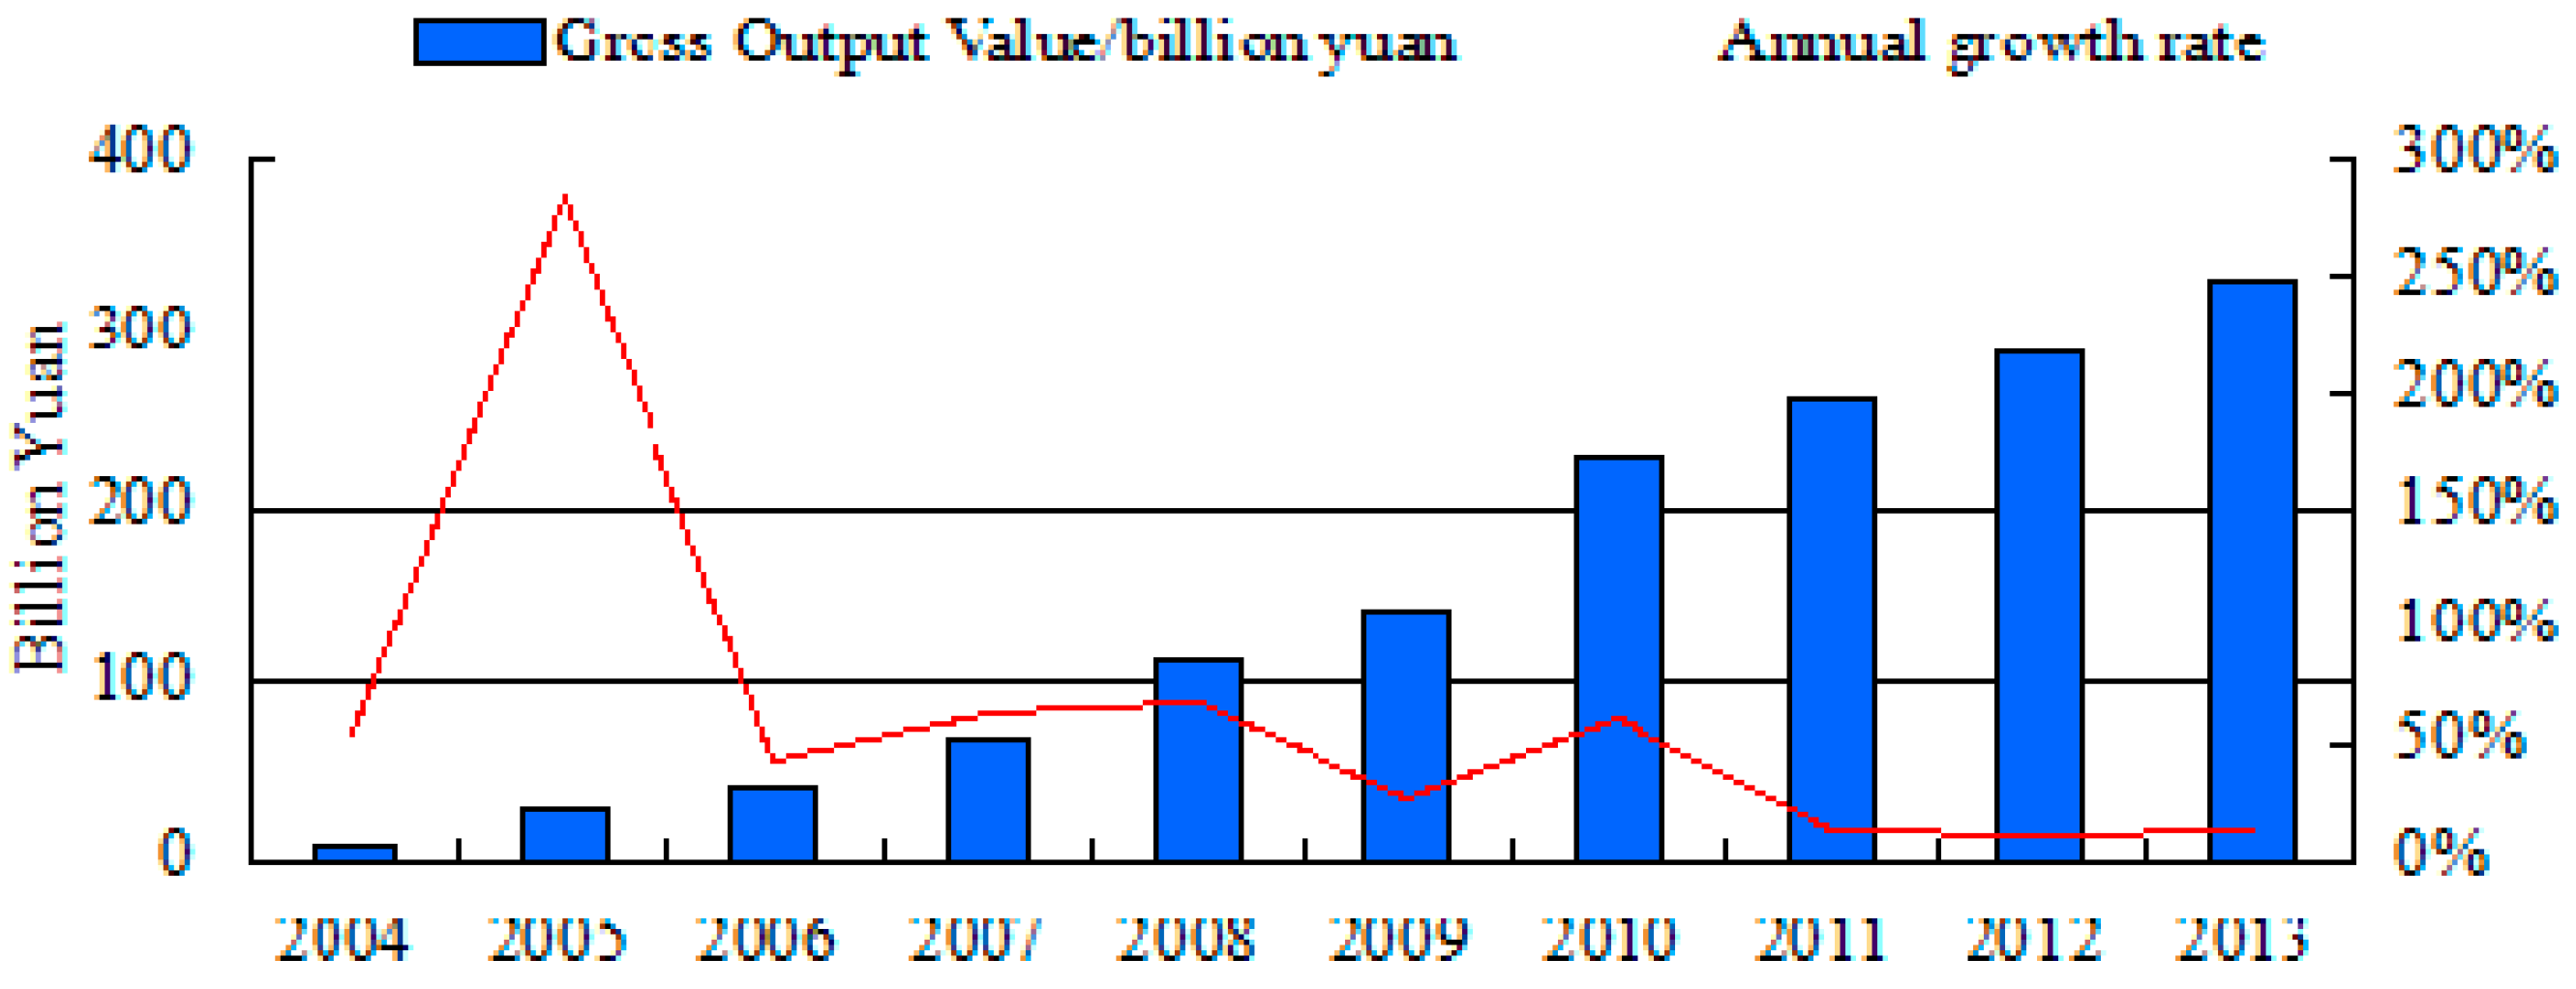
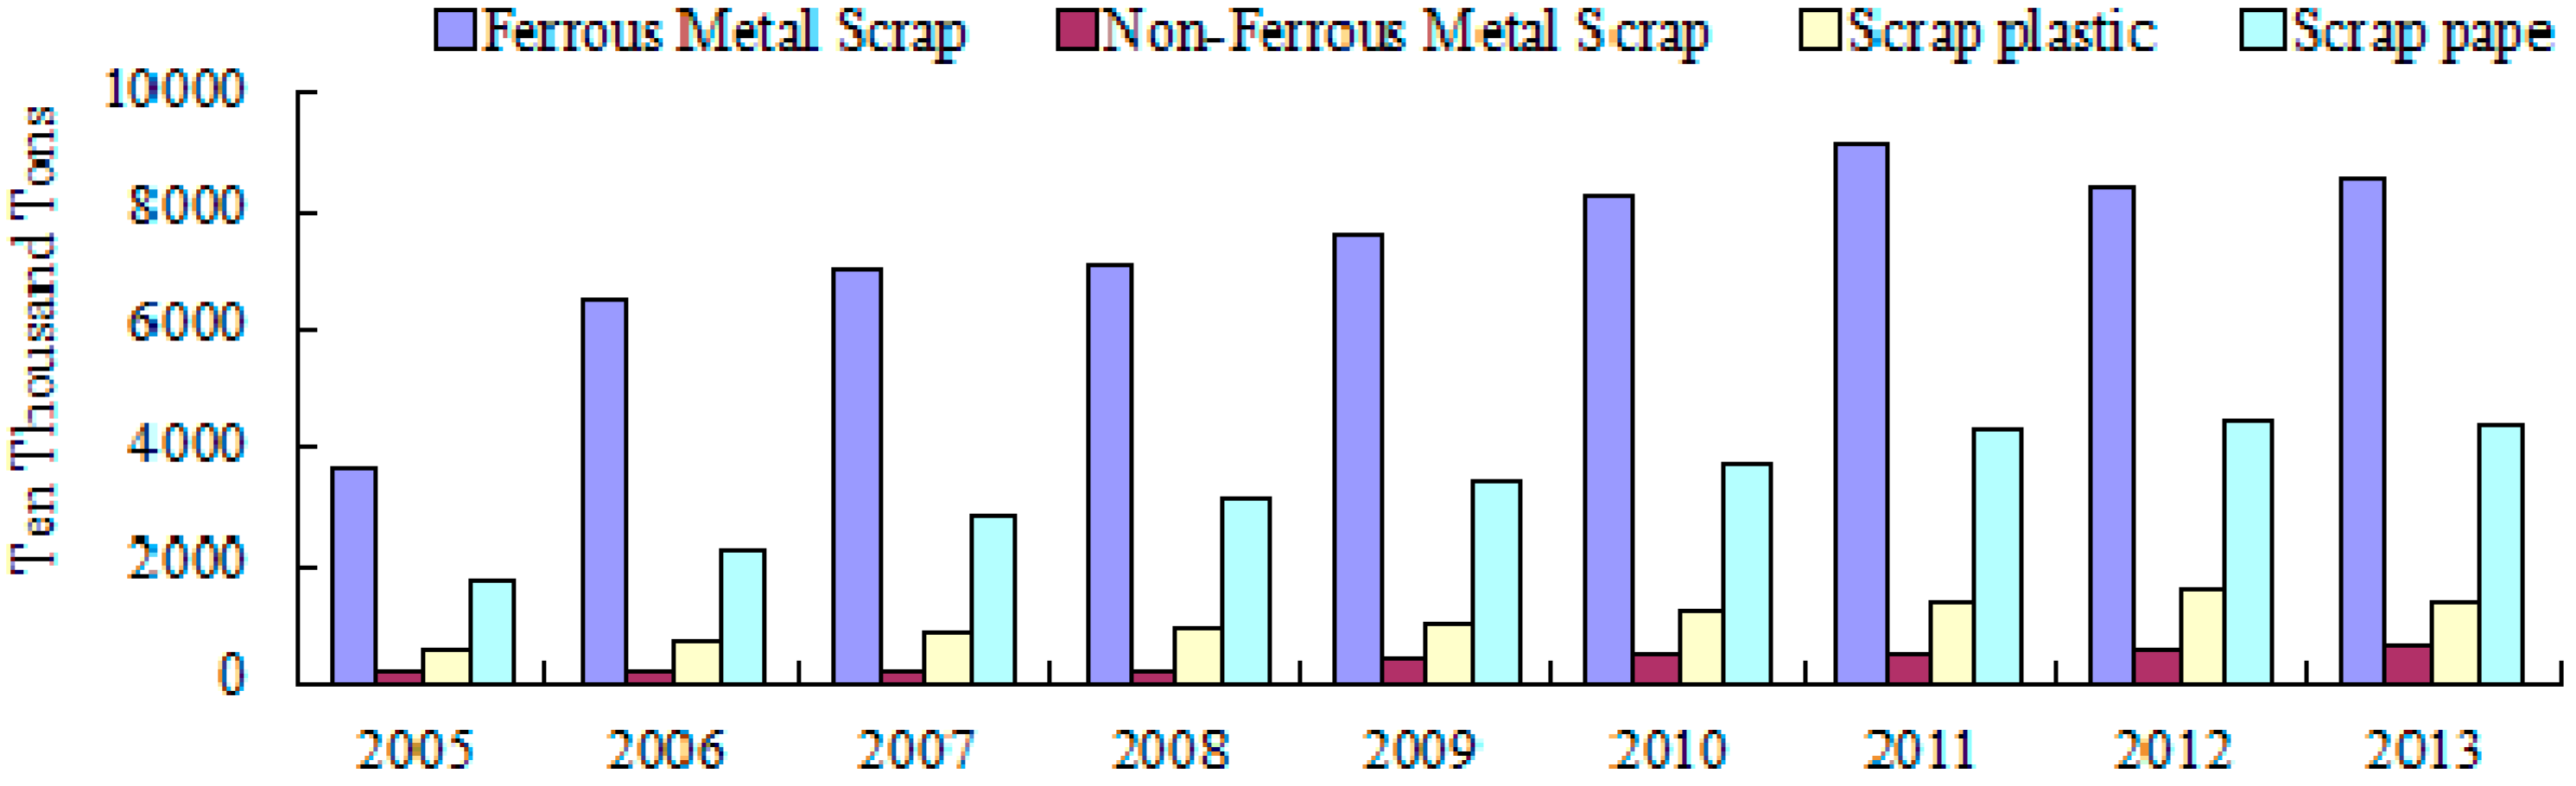
According to the data in the China Statistical Yearbook (2004–2014), the number of “all state and non-state-owned industrial enterprises above a designated size” of China’s renewable resources industry increased to 1274 in 2013 from 107 in 2003, and the gross value of industrial output rose from 4.99 billion Yuan (2003) to 330.66 billion Yuan (2013) (Figure 3, Figure 4 and Figure 5) [1]. “Non-state-owned industrial enterprises above a designated size” refers to enterprises whose total revenue is over 5 million RMB. Affected by macroeconomics, China’s total recycling volume of renewable resources and recovery value declined to different extents after 2012. In 2013, the total recovery volume of China’s major renewable resources (ferrous metal scrap, non-ferrous metal scrap, scrap plastics, scrap paper, scrap tires, electronic scrap, scrap car, scrap ship) reached 160 million tons, falling by 0.2% and 2.6% when compared with figures from 2012 and 2011, respectively; and the recovery value of major resources (487.11 billion Yuan) decreased by 11% and 6% from 2012 and 2011, respectively (Table 1) [26,27]. Total domestic recycling volume of ferrous metal scrap, non-ferrous metal scrap, scrap plastics, and scrap paper reached 148.75 million tons in 2013. Divided by years, the domestic recovery volume of these main four renewable resources can be ranged, from the highest to the lowest, as ferrous metal scrap, scrap paper, scrap plastics and non-ferrous metal scrap. In 2013, imports of these four kind of renewable resources totaled 47.79 million tons, and the total import of scrap paper (221.01 million tons) was the biggest between 2005 and 2013, followed by scrap plastics (66.05 million tons) and non-ferrous metal scrap (64.28 million tons), while the figure for ferrous metal scrap was the smallest at only 57.59 million tons (Figure 6).
Figure 3.
Number of industrial enterprises above a designated size (2004–2013) [1].
Figure 3.
Number of industrial enterprises above a designated size (2004–2013) [1].
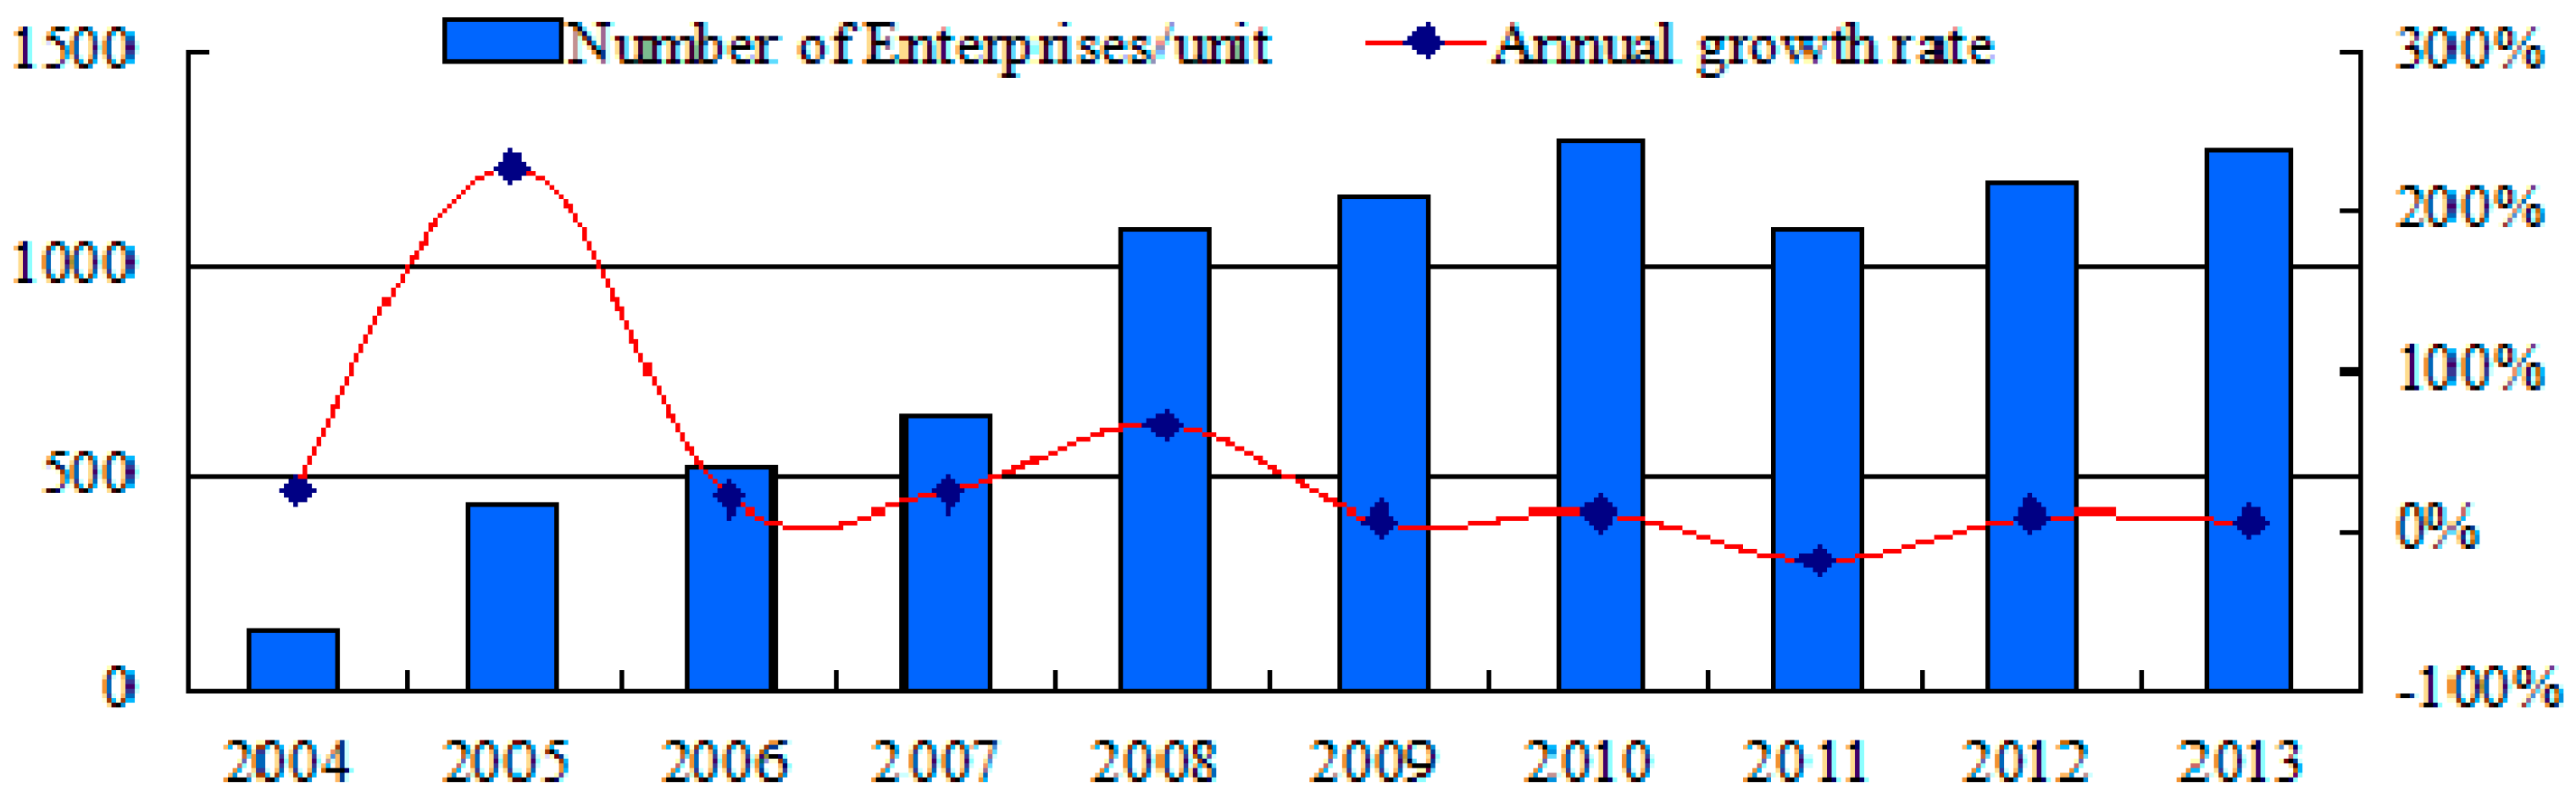
Figure 4.
Gross industrial output value of recycled resources (2004–2013) [1].
Figure 4.
Gross industrial output value of recycled resources (2004–2013) [1].


| Category | Volume (million tons) | Revenue (billion Yuan) | ||||
|---|---|---|---|---|---|---|
| Year | 2011 | 2012 | 2013 | 2011 | 2012 | 2013 |
| Ferrous Metal Scrap | 9100 | 8400 | 8570 | 274.1 | 222.6 | 192.8 |
| Non-Ferrous Metal Scrap | 455 | 530 | 562 | 88.9 | 102.7 | 99.6 |
| Scrap plastic | 1350 | 1600 | 1366 | 92.0 | 105.6 | 88.8 |
| Scrap paper | 4347 | 4472 | 4377 | 86.9 | 83.0 | 74.4 |
| Scrap tires | 329 | 370 | 375 | 7.9 | 8.9 | 7.6 |
| Electronic scrap | 371 | 191 | 264 | 11.9 | 5.7 | 7.0 |
| Scrap Ship | 225.2 | 255 | 250 | 6.3 | 6.4 | 6.0 |
| Scrap Car | 285 | 249 | 274 | 8.3 | 6.4 | 5.5 |
| Total (tons) | 16,462 | 16,067 | 16,038 | 576.4 | 541.3 | 481.7 |
3.2. Industrial Policy
As a sunrise industry, the renewable resources industry has its own vulnerability and commonweal, which determine that the development of this industry must rely on policy support. “The Law on Energy Conservation”, “Cleaner Production Promotion Law” (including revisions), and the “Circular Economy Promotion Law” are the foundation and guiding ideology of China’s current renewable resources industrial policy. Table 2 summarizes the laws and regulations relevant to the Chinese renewable resources industry (Table 2). Next, industrial policy will be described in terms of policy of fiscal subsidies, tax policy, and regulation policy.
| No. | Date | Laws and Regulations | Policy Types | Policy Points | Management Objects | |
|---|---|---|---|---|---|---|
| 1 | January 1998 | The Law on Energy Conservation | Guiding Policy | Save energy, improve energy efficiency, and protect and improve the environment | The whole industry | |
| 2 | May 2001 | Notice on VAT policy of waste recycling business | Tax Policy | Waste recycling companies are exempt from VAT | Recycling Systems | |
| 3 | January 2003 | Cleaner Production Promotion Law | Guiding Policy | Carry out the minimization and harmless of solid waste at the production stage | The whole industry | |
| 4 | April 2005 | Laws on the Prevention and Control of Environmental Pollution by Solid Wastes (Revision) | Regulation Policy | Clearly restrict the import of wastes, and ban importing solid wastes that cannot be used as raw materials or cannot be used harmless | Environmental protection areas | |
| 5 | April 2006 | Notice on the Implement of Constructing Pilots of Renewable Resources Recovery System | Regulation Policy & Fiscal Policy | Achieve the industrialization of renewable resources recycling | Recycling Systems | |
| 6 | April 2006 | Pollution Control Technology Policy of Waste Household Appliances and Electronic Equipment | Regulation Policy | Propose the 3R principle of WEEE (Waste Electrical and Electronic Equipment), and implement the principle of polluter responsibility | Recovery and utilization systems | |
| 7 | December 2006 | Guidance on Comprehensive Utilization of Resources during the Eleventh five-year Plan | Regulation Policy | Improve the industrialization level of renewable resources, and include the construction demonstration of recycling system in the key projects | Resource utilization systems | |
| 8 | May 2007 | Renewable Resources Recycling Management Methods | Regulation Policy | It is the first national regulation about the standardized management of the renewable resources recycling industry and it is an important policy basis specifically for the management of the recycling industry | Recovery and utilization systems | |
| 9 | January 2009 | Circular Economy Promotion Law | Guiding Policy | Promote “minimization, reuse and recycle”, and establish extended producer responsibility | The whole industry | |
| 10 | January 2009 | Notice on Renewable Resources Value-added Tax Policy | Tax Policy | Cancel VAT exemption policy for waste recycling and sales enterprises and implement VAT refund policy | Recycling Systems | |
| 11 | May 2010 | Notice on the Construction of “City Minerals” Demonstration Bases | Regulation Policy & Fiscal Policy | Built about 30 City Minerals demonstration bases. Promote the utilization of renewable resources. | Resource utilization systems | |
| 12 | January 2011 | Regulation of Waste Electrical and Electronic Equipment Recycling | Regulation Policy & Fiscal Policy | Forbid importing waste electrical and electronic equipment that the country has made a ban on, and prohibit the establishment of waste electrical and electronic equipment special fund | Recovery and utilization systems | |
| 13 | December 2011 | Guidance on Comprehensive Utilization of Resources during the Twelfth five-year Plan | Regulation Policy | Enhance the comprehensive utilization of industrial wastes and the recycling of renewable resources level | Resource utilization systems | |
| 14 | July 2012 | Cleaner Production Promotion Law (Revision) | Guiding Policy | Improve resources utilization efficiency, reduce the generation and emission of pollutants in the production process, and strengthen the funding of clean production and its technology | The whole industry | |
| 15 | January 2015 | Medium and Long-term Plan of Renewable Resources Recovery System Construction (2015–2020) | Regulation Policy & Fiscal Policy | Establish recycling systems, strengthen supervision of the industry and improve the recovery management systems | Recovery and utilization systems | |
3.2.1. Fiscal Subsidies Policy
Since the Ministry of Commerce launched a renewable resources recycling system pilot (No. 5) in 2006, three batches of 90 pilot cities have obtained support from central government special funds, and the Ministry of Commerce has constructed, renovated, and expanded 51,550 outlets, 341 points sorting centers, and 63 distribution markets, and supported the construction of 123 renewable resources recycling processing bases. The policy of fiscal subsidies plays a significant role in regulating renewable resources recovery markets, improving renewable resources recycling rates, and accelerating the construction of renewable resource recycling system.
The Chinese government launched a “home appliance old for new policy” in Beijing, Tianjin, Shanghai, and nine other pilot provinces and cities in June 2009. This policy not only provides consumers with subsidies when they trade appliances, but also helps appliance sales enterprises, recycling companies, and dismantling enterprises gain appliance subsidies, freight subsidies, and dismantling subsidies, respectively. Carrying out this policy expands domestic consumption demand, and it also increases regular recycling enterprises’ recovery volume of electronic waste (WEEE), thus enhancing those enterprises’ competitiveness, significantly improving the operating state of dismantling enterprises, improving efficiency of energy resources, and reducing environmental pollution. The sales volume of new appliances and recovery volume of old appliances during the period of policy implementation can be seen in Table 3.
| Date | Cumulative Sales of Home Appliances (×104 units) | Sales Amount (×109 Yuan) | Recycled Volume of old Home Appliances (×104 units) | Dismantling Volume of old Home Appliances (×104 units) |
|---|---|---|---|---|
| 1 Jun. 2009–30 Dec. 2009 | 360.2 | 140.9 | 402.6 | - |
| 31Dec. 2009–31 May 2010 | 1409.3 | 539.8 | 1479.8 | 865.5 |
| 1 Jun. 2010–9 Dec. 2010 | 3002.6 | 1126.9 | 3110.9 | - |
| 10 Dec. 2010–15 April 2011 | 4500 | 1700 | 4660 | 3000 |
| 16 Apr. 2011–30 Nov. 2011 | 8129.6 | 3004.2 | 8373.3 | 6621 |
Sources: Ministry of Commerce of the People’s Republic of China.
3.2.2. Tax Policy
Value-added tax policy is an important part of economic policies related to supporting the renewable resources industry. In May 2001, Chinese waste recycling enterprises’ sales of waste materials were made exempt from VAT. The implementation of this policy stabilizes the development of the recycling industry (Table 2, No. 2). However, due to tax loopholes, the “Notice on renewable resources value-added tax policy” implemented in January 2009 and abolished the renewable resources value-added tax preferential policy; however, there was a two-year transition period during which recycling companies that meet certain conditions are given a value-added tax refund according to certain percentages (70% in 2009, 50% in 2010) of their VAT sales of renewable resources (Table 2, No. 10). The implementation of this policy has a big impact on the renewable resources industry, particularly on larger waste processing enterprises. The reason is that small companies can evade VAT by paying a fixed tax, while larger regular enterprises are scavenger officers who do not have qualifications to invoice, non-operating agencies and organizations, and small salvage stations. For large-scale regular enterprises, no VAT invoices means no deduction of input tax, and the purchasing companies will need to pay the full VAT of 17%. That increase in cost severely restricts the performance of regular large-scale enterprises.
3.2.3. Regulation Policy
As the main law-making and administration body, the government plays an important role in industry regulation. The current management policies of the renewable resources industry in China can be grouped into five main areas: comprehensive regulations about renewable resources recycling and utilization, specialized management about renewable resources recycling system, solid waste management in the field of environmental protection, resources utilization, and waste import management (Table 2). Policies published in recent years play a leading role in regulating the renewable resources market, improving resources recovery and utilization systems, establishing a technology system for industrial development, and setting the standards for admittance into the industry.
3.3. Industrial Scale
Most of the enterprises of China’s renewable resources industry are small private enterprises. Over ninety-four percent of the more than 100,000 enterprises are privately owned and the number of enterprises whose annual sales are over one billion Yuan is less than 100. Next, we take three kinds of enterprises (the state-owned and state-holding industrial enterprises, private industrial enterprises, and “foreign” industrial enterprises) as research objects and analyze their industrial scale, economic efficiency, and performance levels, in order to avoid the limitations and drawbacks of a single indicator and reflect the performance of China’s renewable resources industry more comprehensively. The results are as follows.
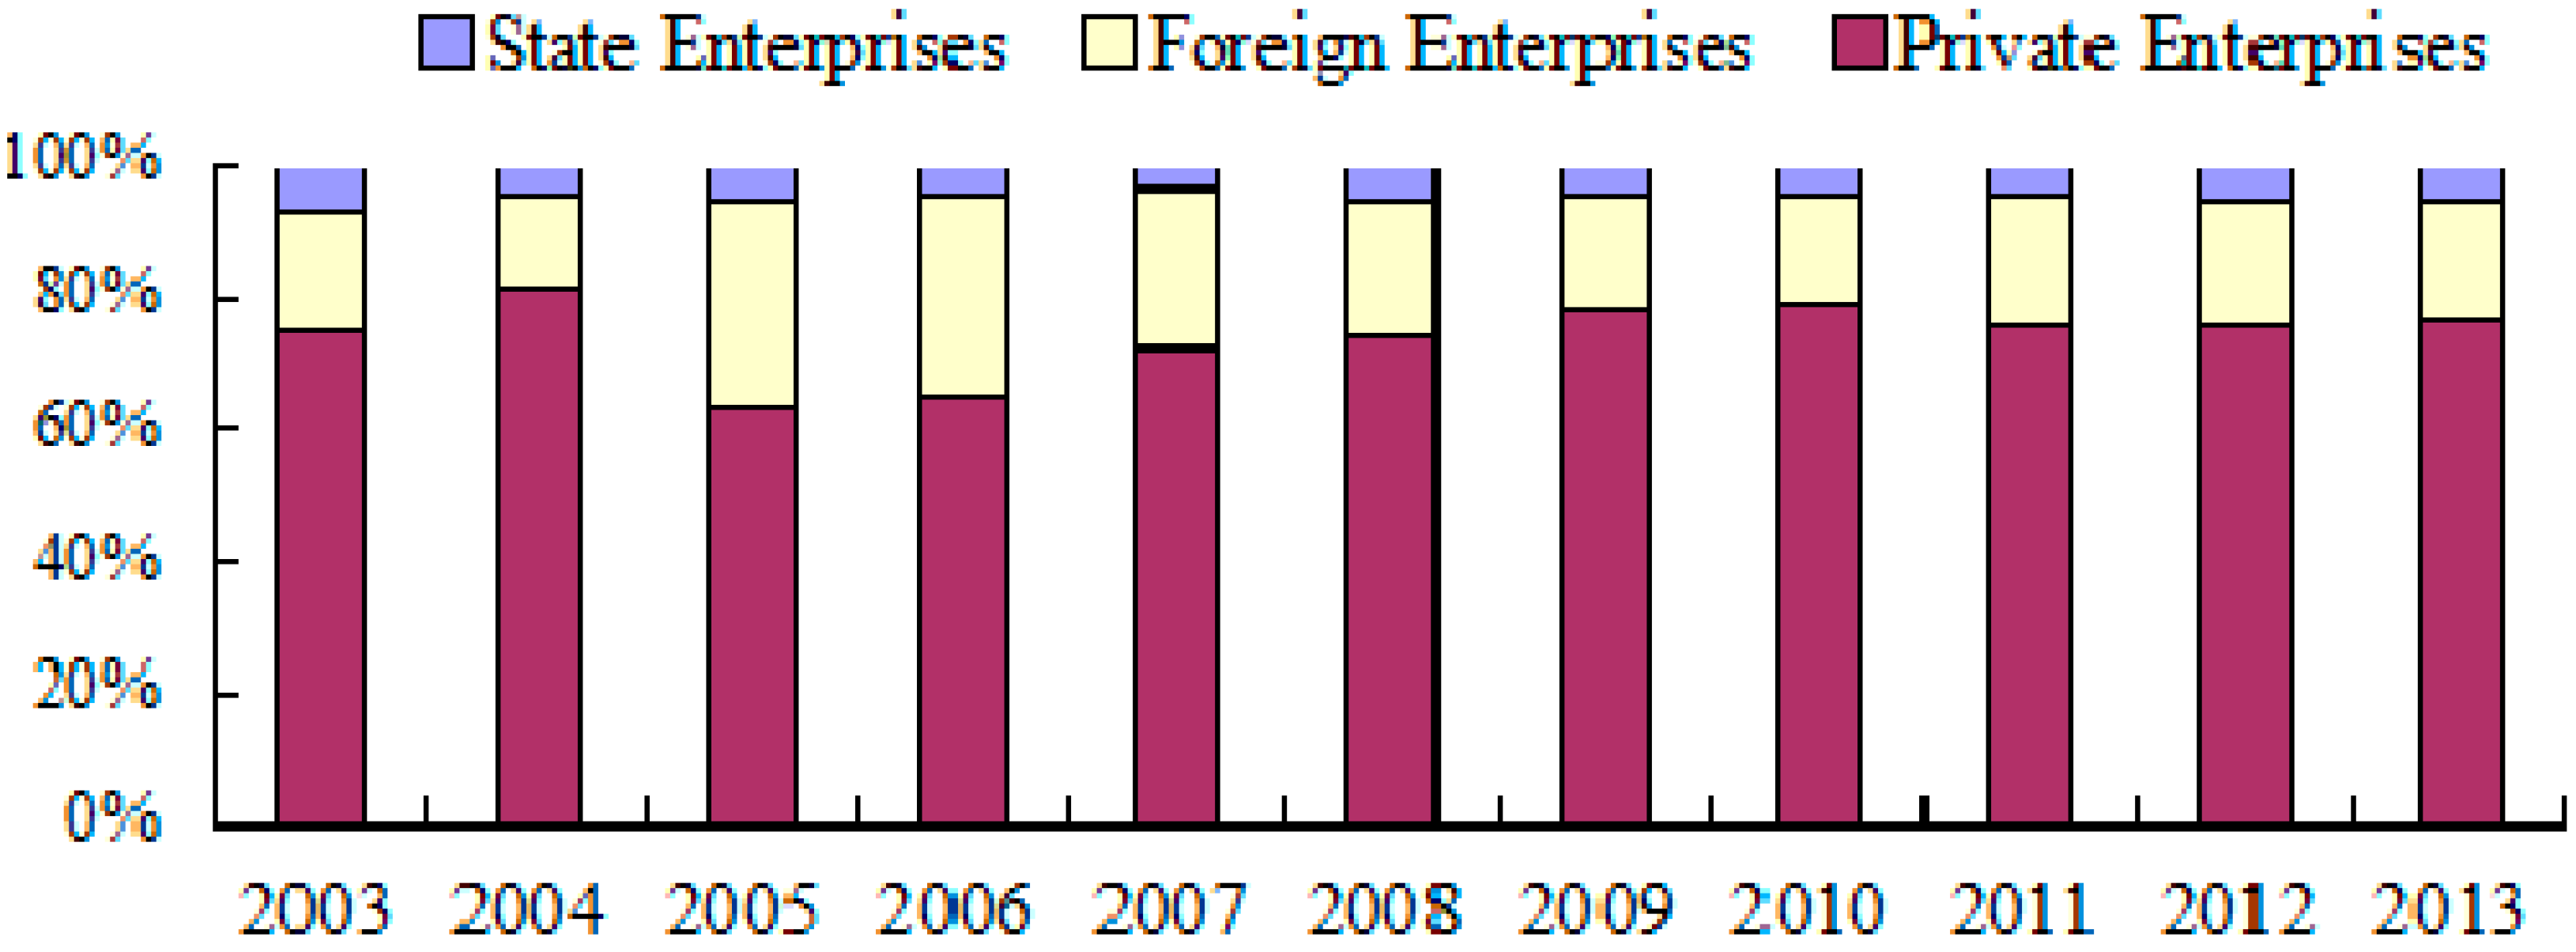
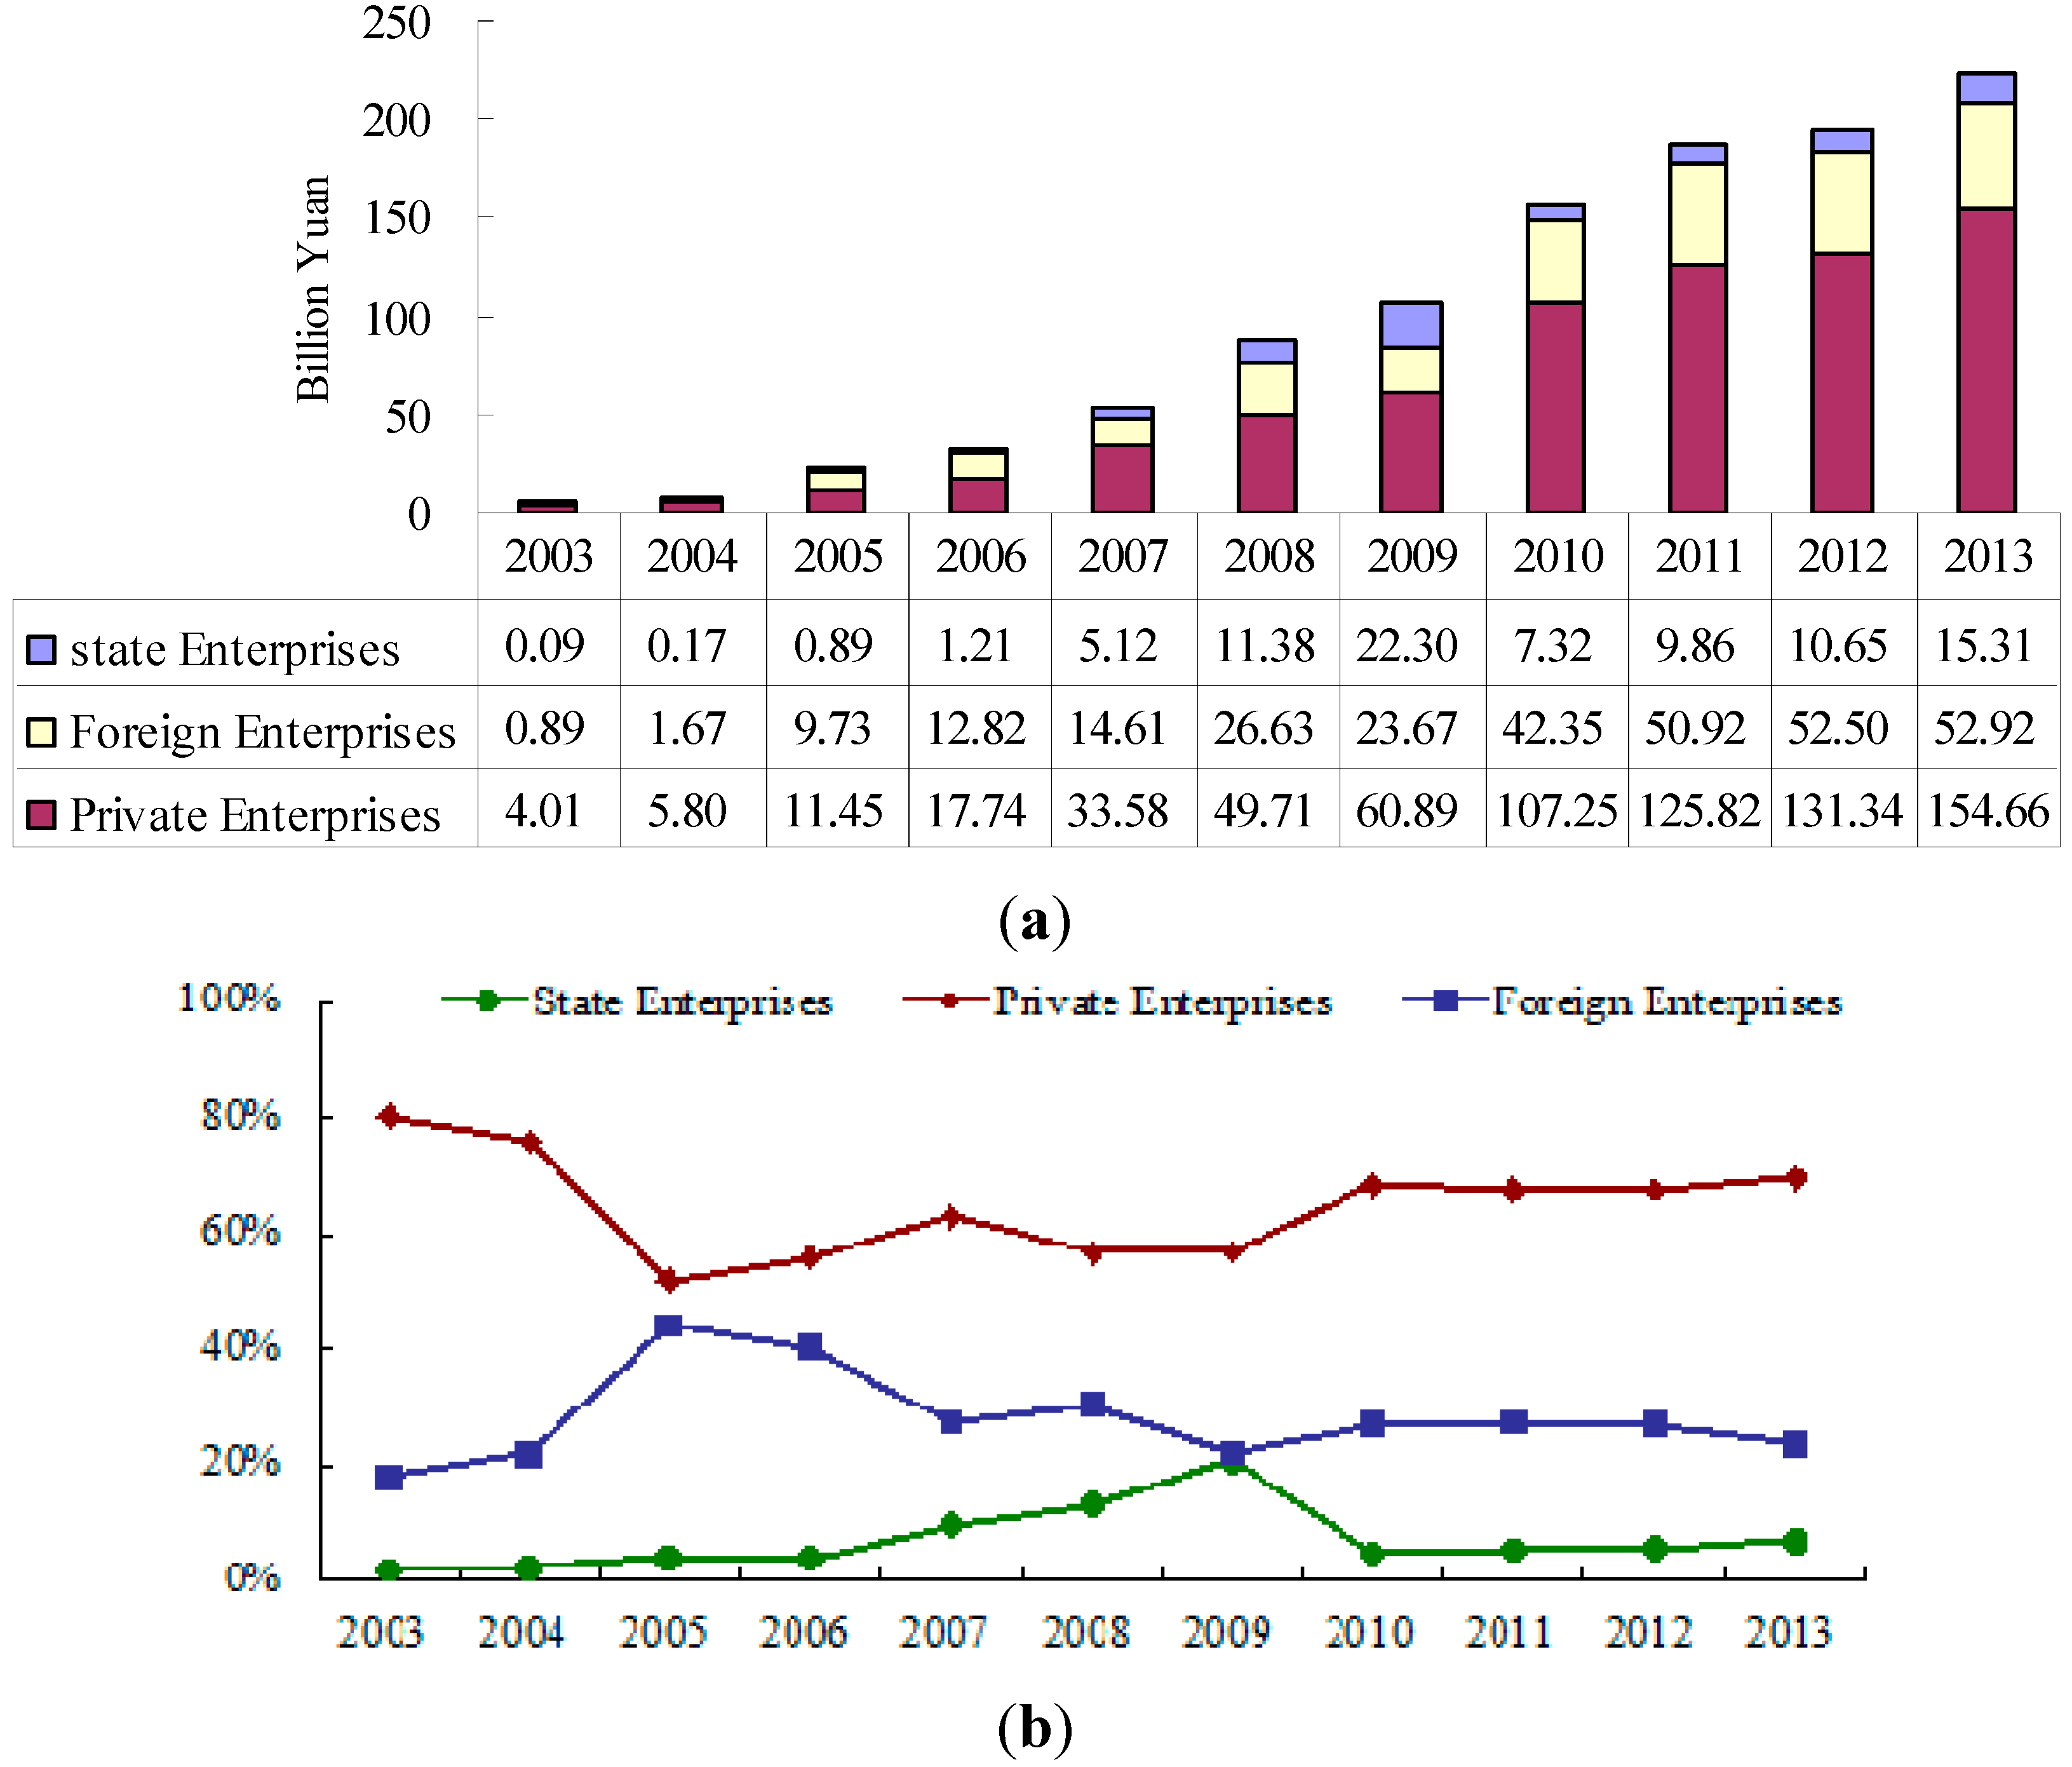
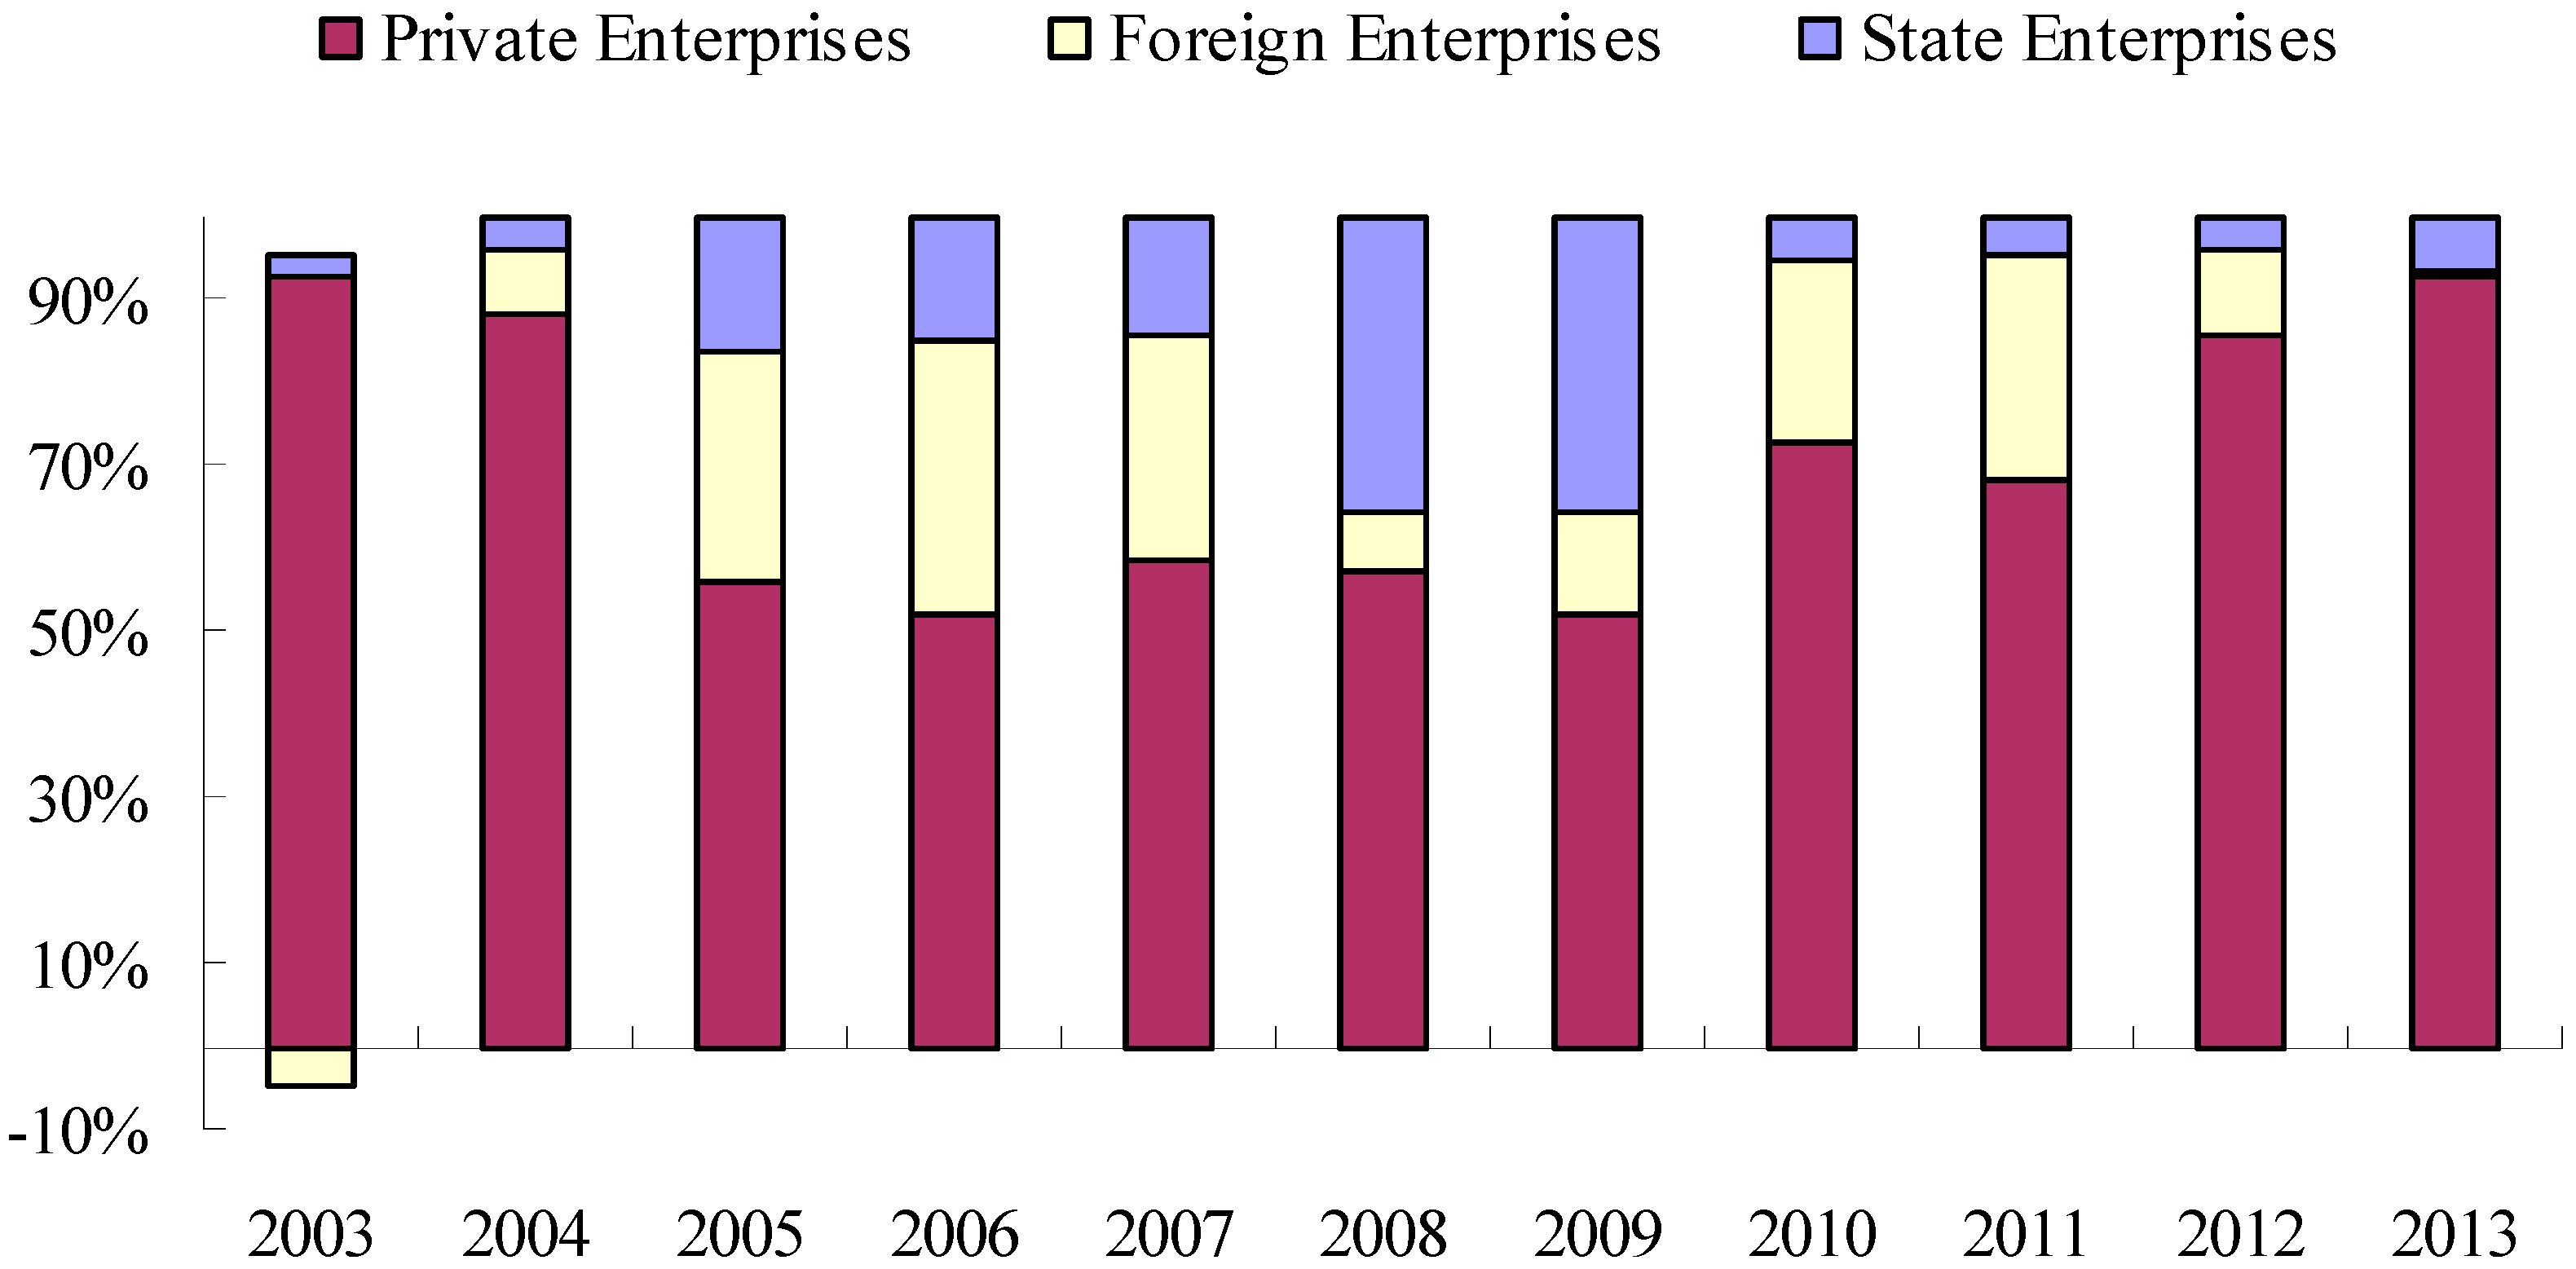
In the 21st century, the industrial scale of the three kinds of enterprises that have different ownership structures has increased significantly. As can be seen in Figure 7, between 2003 and 2013, the total number of state-owned, private, and foreign-funded enterprises increased from 127 in 2003 to 918 in 2013, with an average annual growth rate of 19.7%. The annual average percentage of private enterprises is about 74.7%, reflecting that private enterprises are the main force behind the renewable resources industry (Figure 7). It is shown in Figure 8a that private enterprises have the largest industrial output. They are followed by foreign-funded enterprises, and the figure for state-owned enterprises is the smallest. Figure 8b shows that the annual average percentage of private enterprises’ industrial output was up to 65% with a gradual increase. In contrast, the figure for foreign-funded enterprises was roughly 27% and declined in recent years. State-owned enterprises accounted for only a little part with a slight increase.
Figure 7.
Ownership proportions for enterprises (2003–2013) [1].
Figure 7.
Ownership proportions for enterprises (2003–2013) [1].

Figure 8.
(a) Industrial output of state-owned, private, and foreign-funded enterprises; (b) The industrial output proportion of different ownership enterprises (2009–2013) [1].
Figure 8.
(a) Industrial output of state-owned, private, and foreign-funded enterprises; (b) The industrial output proportion of different ownership enterprises (2009–2013) [1].

3.4. Economic Benefit
First, we examined the overall operating efficiency of the renewable resources industry. The following are the major economic indicators of industrial enterprises above a designated size.
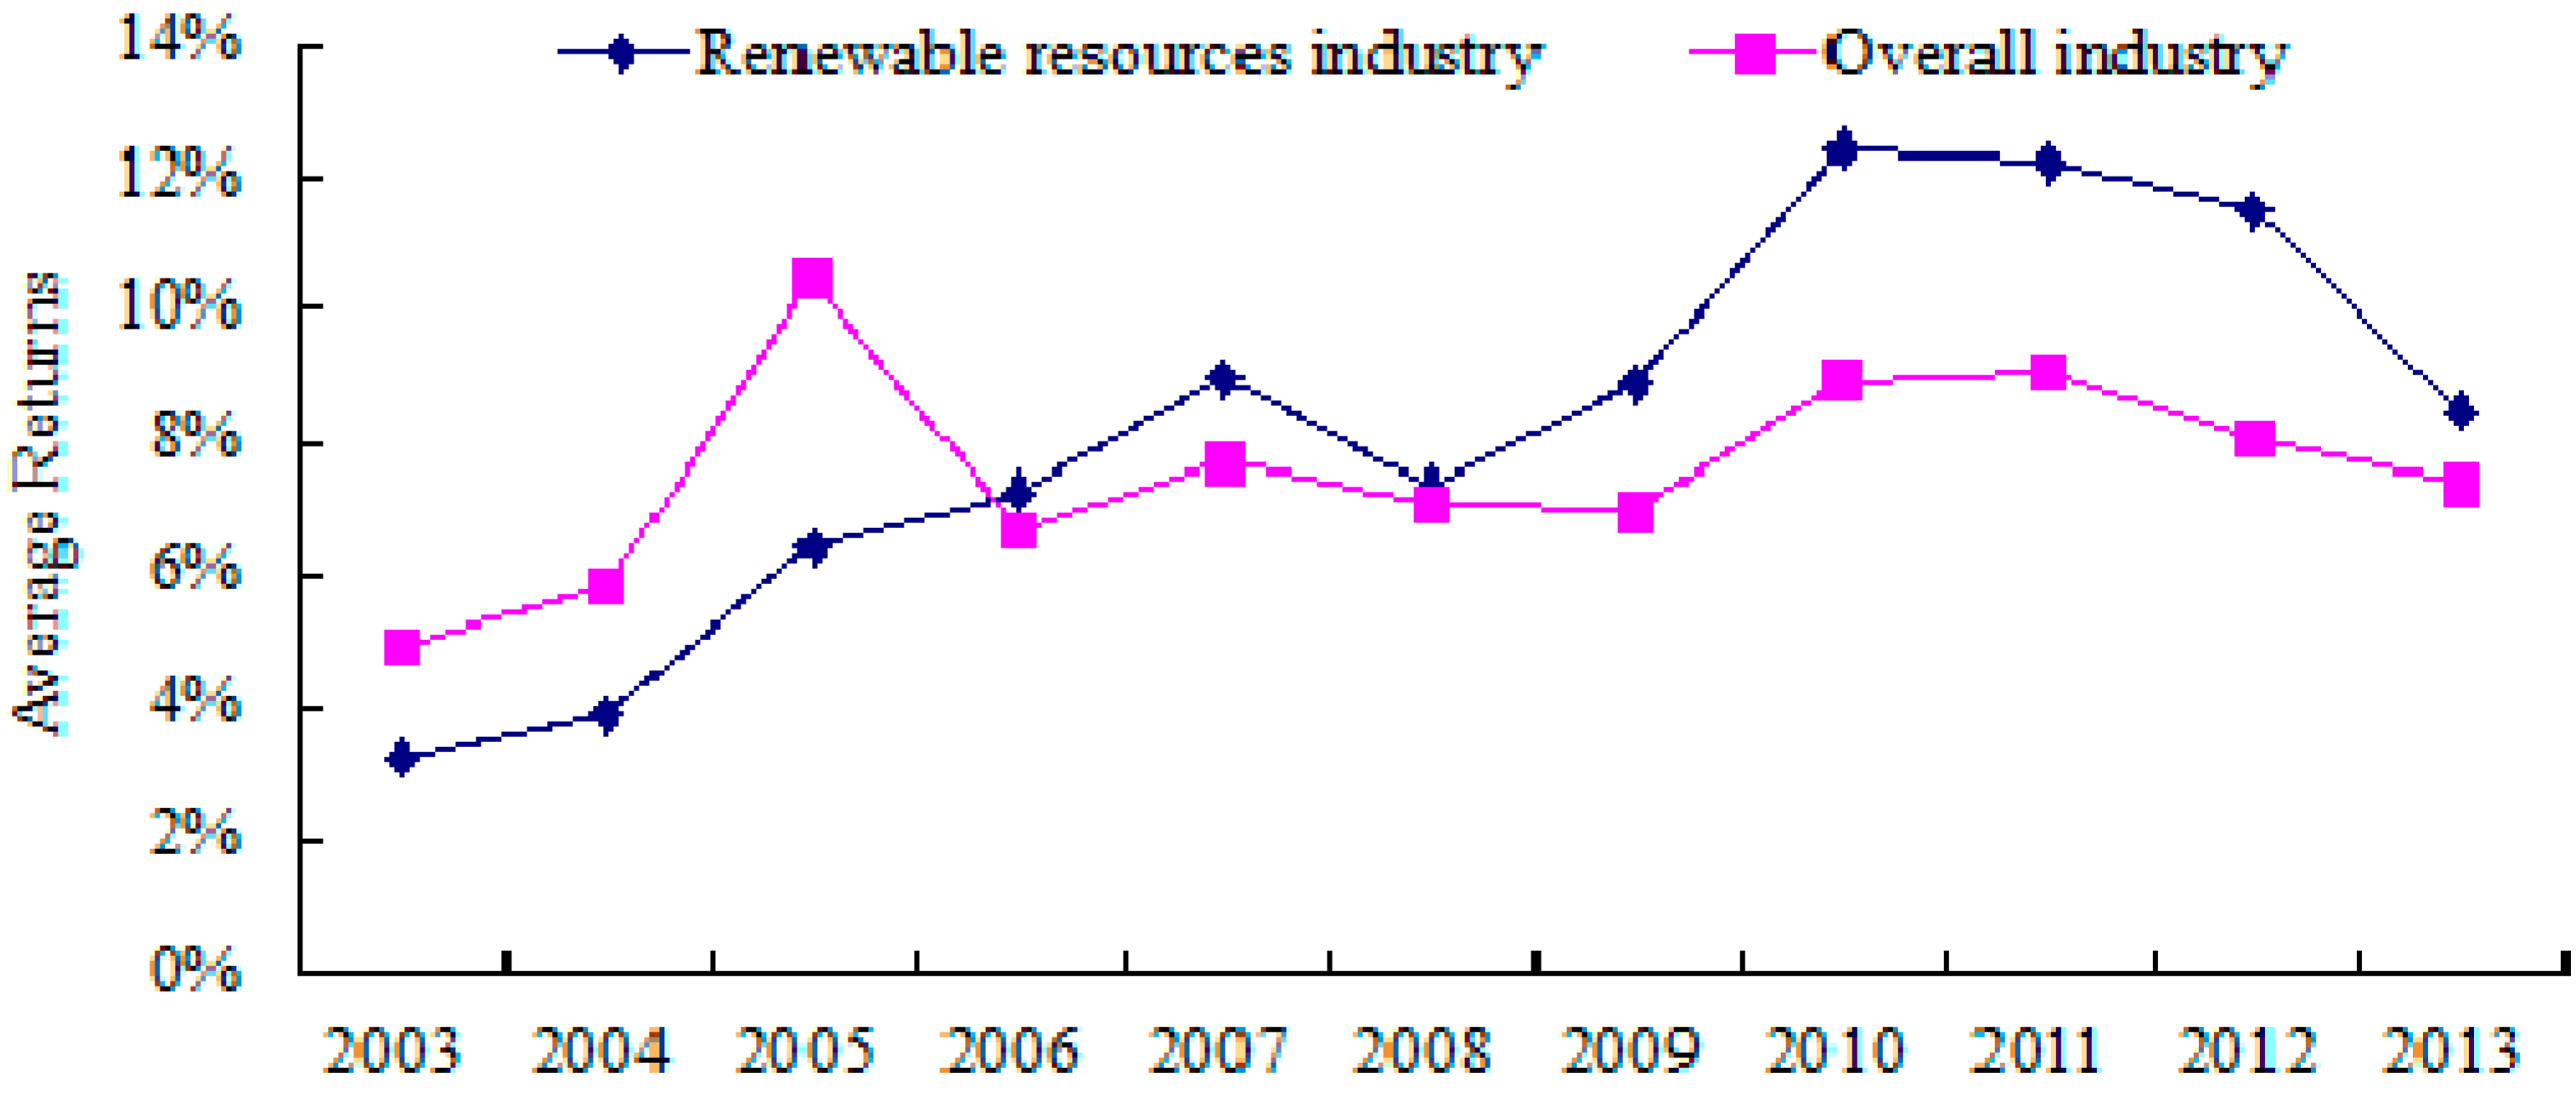
As we can see from Table 4, the four indicators of the renewable resources industry increased year by year from 2003 to 2013, except that the gross profit of 2013 declined. This indicates that the industry keeps a good development trend (Table 4). Figure 9 shows that the renewable resources industry has the same average return on assets as industry overall between 2003 and 2013; these two figures declined to their lowest value in 2008 and reached their peaks in 2010, after which they both had a downward tendency. This change reflects the fact that the 2008 financial crisis led to the Chinese economy stalling, and the government conducted a large-scale 4 trillion Yuan public investment in order to stimulate economic growth, contributing to China’s temporary economic recovery in 2009 and 2010. Return on assets of the renewable resources industry rose gradually and exceeded that of industry overall in 2006, after which it maintained a high profit rate. This positive outcome is due to China’s renewable resources industrial policies gradually taking effect (Table 2).
Table 4.
Major economic indicators of industrial enterprises above a designated size (One hundred million Yuan).
| Year | Prime Operating Revenue | Total Profits | Total Assets | Total Liabilities |
|---|---|---|---|---|
| 2003 | 50.89 | 0.84 | 26.03 | 17.76 |
| 2004 | 79.50 | 1.19 | 30.67 | 21.57 |
| 2005 | 281.67 | 8.13 | 126.37 | 81.90 |
| 2006 | 429.33 | 14.23 | 195.88 | 134.65 |
| 2007 | 682.51 | 24.44 | 272.27 | 180.66 |
| 2008 | 1158.33 | 40.31 | 548.95 | 370.43 |
| 2009 | 1453.06 | 66.29 | 746.30 | 507.41 |
| 2010 | 2381.77 | 114.88 | 923.56 | 613.19 |
| 2011 | 2645.28 | 160.57 | 1311.79 | 836.35 |
| 2012 | 2920.55 | 162.66 | 1412.02 | 678.74 |
| 2013 | 3340.04 | 132.08 | 1561.07 | 953.45 |
Sources: [1].
Figure 9.
Average returns on assets of the renewable resources industry and industry overall. Sources: Adapted from [1].
Figure 9.
Average returns on assets of the renewable resources industry and industry overall. Sources: Adapted from [1].

It can be seen in Figure 10 that the profit of private enterprises got a significant increase, growing from 2.49 billion Yuan in 2009 to 6.31 billion Yuan in 2010, while the figure of state-owned enterprises dived to 439 million Yuan in 2010 after it peaked at 1.72 billion Yuan in 2009. Such a huge difference among enterprises with different ownership is due to the fact that after the government canceled the VAT exemption policy for the renewable resources industry in 2009, the negative effects of the policy gradually influenced the outcome of corporate profits (Table 2). This also explains why the return on assets in this industry declined faster than that of the overall industry after 2011 to a certain extent (Figure 9).
Figure 10.
Proportion of profits of state-owned, private, and foreign enterprises [1].
Figure 10.
Proportion of profits of state-owned, private, and foreign enterprises [1].

3.5. Performance
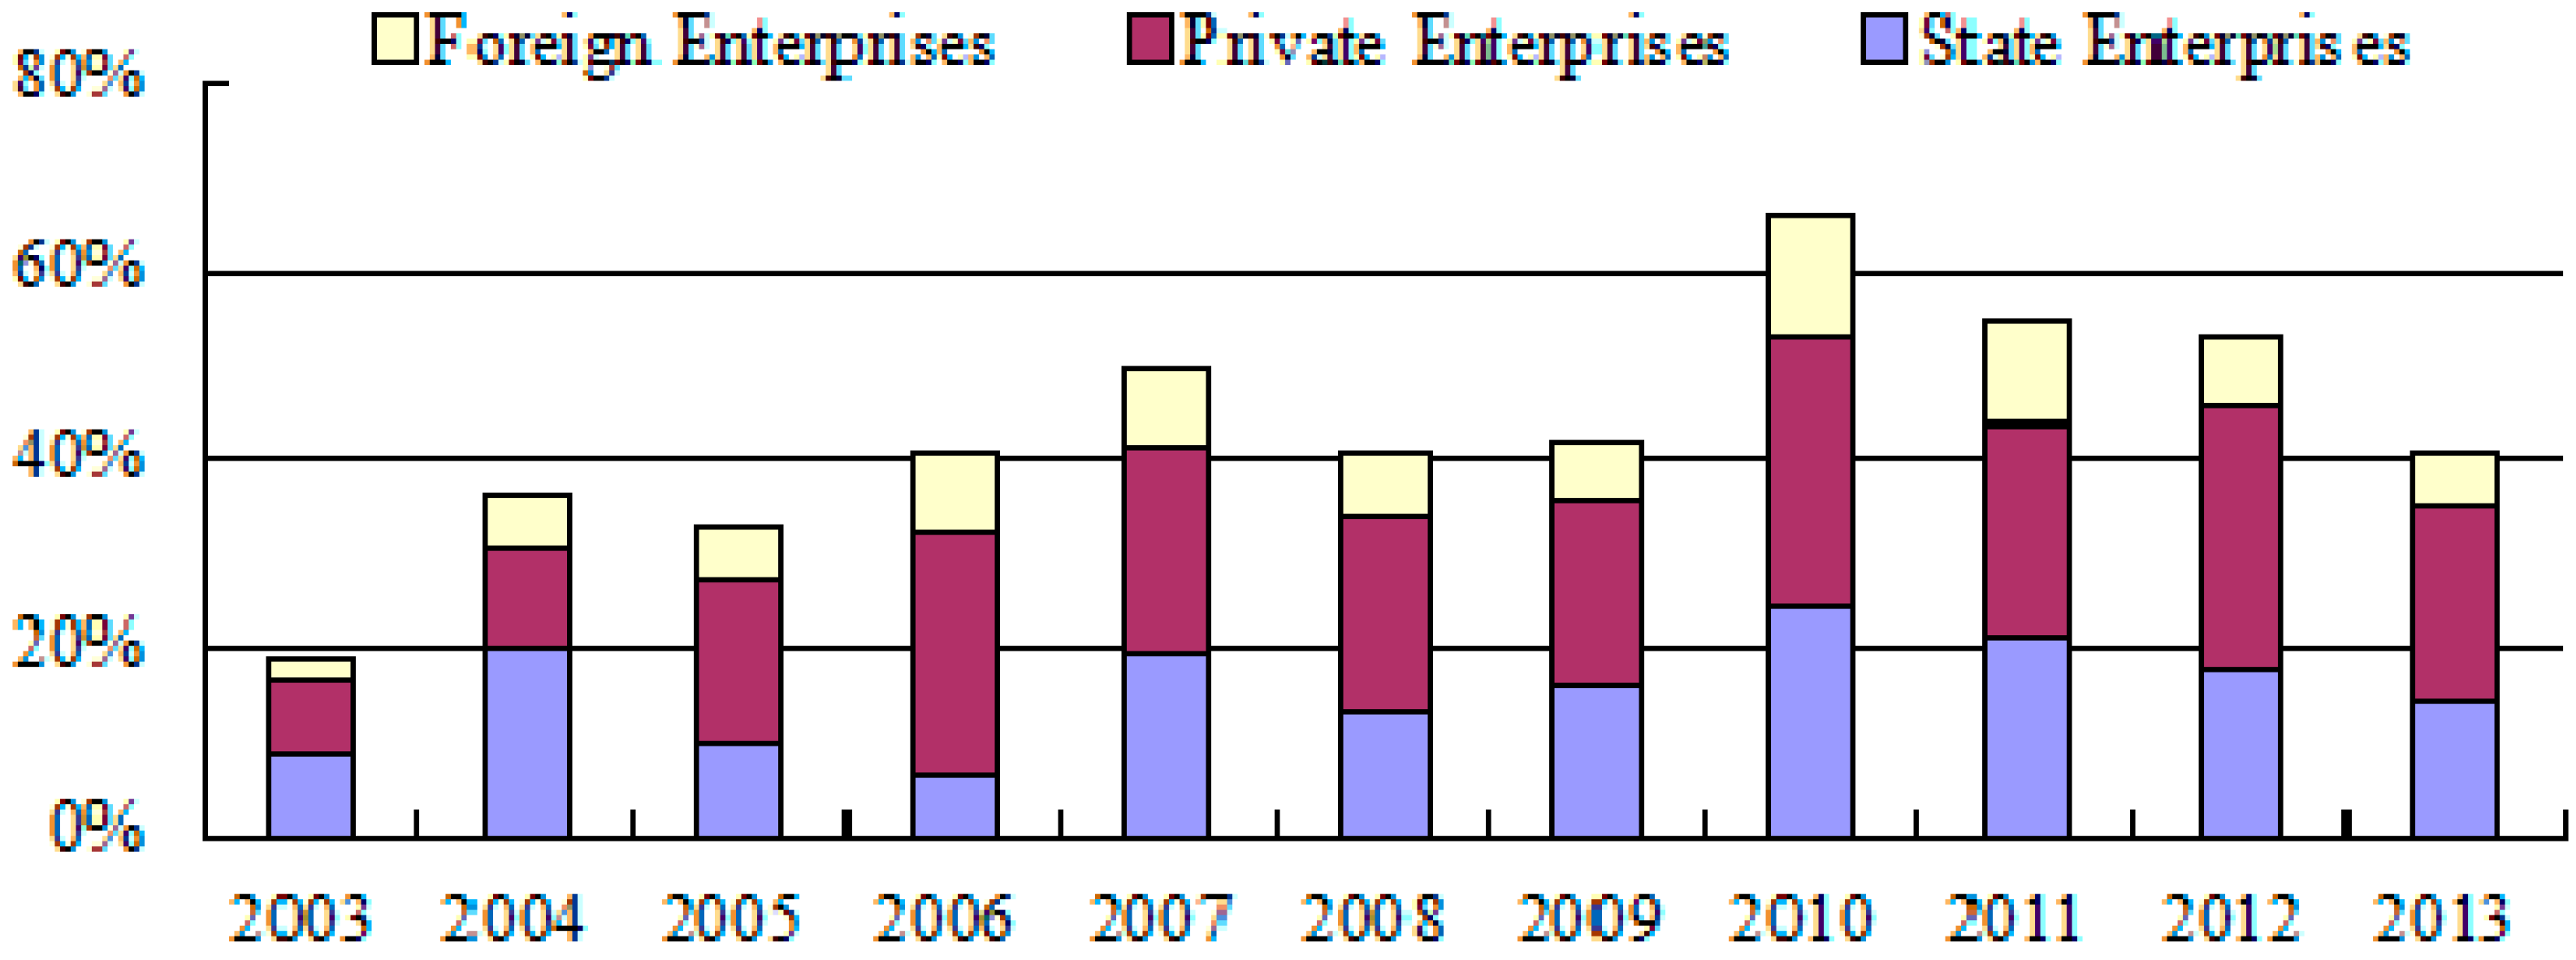
The total asset contribution rate and the ratio of profits to cost are important indicators to reflect industrial performance. The total asset contribution rate is the core indicator used for evaluating and assessing profitability of enterprises, and is also the reflection of enterprises’ performance and management. From the total asset contribution rates of 2003-2013, we can see that private enterprises had the strongest profitability, followed by state-owned enterprises, while foreign-funded ones were the weakest. Private enterprises had the strongest position after their profitability exceeded that of state-owned enterprises in 2005. From 2010 to 2013, the annual average total asset contribution rate of private enterprises was over 25%, the figure for state-owned enterprises dropped gradually from 24.03% in 2010 to 14.06% in 2013, and that for foreign-funded enterprises also witnessed a decline, from 12.74% to 5.90%, during this period (Figure 11). These changes indicated that, under the competitive market mechanism, the reasonableness of private enterprises’ renewable resources inventory as well as the precise control of product sales markets can make cash flow increases and enhances the asset investment efficiency.
Figure 11.
Total asset contribution rate of the renewable resources industry (2003–2013).
The ratio of profits to costs reflects not only the economic benefits of production costs and expenses enterprises invest but also the economic benefits of cost reduction. As can be seen in Figure 12, private enterprises exceeded state-owned enterprises in the ratio of profits to costs and ranked first after 2010; in contrast, that of state-owned enterprises fell sharply thereafter (Figure 12). The cancellation of the VAT exemption policy had a huge effect on large-scale state-owned enterprises (Section 3.2.2), because most of private enterprises are small-scale and have the cost advantage in competition with state-owned enterprises. Also, in the renewable resources industry, state-owned enterprises and private enterprises manufacture similar products to some extent, which contributes to the intense competition in the industry. In addition, state-owned enterprises have advantages in terms of scale, technology, capital, and talent, but competition is only involved in low-level homogeneous products, eventually resulting in Gresham’s law, namely a situation where big companies do worse than small businesses and are expelled from the market.
Figure 12.
Ratio of profits to industrial costs of the renewable resources industry (2003–2013).

The qualitative analysis of the performance indicators of the renewable resources industry, shown above, clearly shows that a renewable resources industry that considers private enterprises as an important part develops rapidly, but the whole performance is affected largely by the external macroeconomic environment and policies.
3.6. Problems
(1) Low utilization efficiency of renewable resources and serious secondary pollution.
The recovery rate of China’s renewable resources is low. According to estimates, the value of resources that can be recycled but are not recycled is up to a trillion Yuan, and the rate of resources utilization is less than 40%, while waste recovery rates of developed countries are often above 70%. In particular, recycling enterprises have only a small interest in low-profit renewable resources, such as glass, used batteries, and construction waste, resulting in serious loss of resources. A lot of renewable resources that are not recycle are thrown away, buried in landfills or incinerated directly, causing serious potential or actual contamination of air, soil, and groundwater. Because the industry concentration is not high, most recovery enterprises are diverse and dispersed, many companies mainly process primary products with low added value, the recycled amount of scale enterprises accounts for only 10%–20%, and the degree of scale operation needs to be improved, the recovery rate of China’s renewable resources is low [31].
(2) The renewable resources industry lacks market power.
Most of China’s renewable resources enterprises chose the recycling, dismantling, and simple manufacturing processes to operate and have low added value. Their production and supply depend on the needs of downstream resource utilization industries to a certain extent, but in the long run, they have a more disadvantageous position than downstream industries. The renewable resources market structure is close to perfect competition, and renewable resources enterprises have a smaller scale than downstream resource utilization enterprises, so renewable resources are constrained by the latter in sales volume and price—prices of renewable resources are much lower than that of initial resources, and the scope for profit is narrow.
(3) The market mechanism is not perfect, and lacks effective regulation.
Most members of the renewable resource recycling industry lack production technical standards, quality classification standards, and testing standards. With no clear, unified market access conditions, some small-scale enterprises with low technology and resource utilization rates enter the market and have a serious impact on the overall development of the renewable resources industry. The recycling, dismantling, and processing of the renewable resource industry chain develop fast, while sectors such as research and development and consulting services develop more slowly, and many technological achievements cannot be transformed into productivity. The current division of government administration sectors that relate to renewable resources is not reasonable, and there are problems such as separations of departments, overlapping functions, and institutional overlap. For example, recycling and comprehensive processing of waste and sound processing enterprises belong to different sectors; they lack unified management, and cannot establish regional specialization and integrated market systems in accordance with the needs of industrial development.
(4) The government does not have enough support and capital investment for renewable resources.
The technology and industrialization level of the renewable resources industry determines the degree of resource utilization. China invests very little in resource utilization projects, and there are no special funds supporting resource utilization and no long-term investment or equipment construction investment. Because of funding problems, it is hard to carry out some resource utilization projects with advanced technology and high economic and social benefits. From a legislative perspective, China has not had any basic laws about recycling of renewable resources since it systematically launched renewable resource utilization. The legal system lags behind.
4. Analysis of Industrial Performance
4.1. Overall Development of the Industry
4.1.1. Indices and Models
Data on the renewable resources industry first appeared in the China Statistical Yearbook in 2003, which means that there are minimal time series data. In order to increase the sample size and further analyze the effect of ownership structure (state-owned enterprises, private enterprises, and foreign investment enterprises) on overall industrial performance, we took the state-owned enterprises (denoted as STATE), private enterprises (denoted as PRI), and foreign-funded enterprises (denoted FOR) as cross-sectional data when selecting explanatory variables and explained variables. The cross-sectional data, together with the 2003–2013 time-series data, constitute panel data for the analysis of industrial performance.
In order to test the decisive factor affecting the industrial performance of China’s renewable resources industry, the main variables and indicators in the analysis are selected as follows (according to the theory of industrial organization):
- (1)
- Select the most two representative indices for measuring industrial performance (Pr): return on assets (PR1) and return on sales (PR2). The former reflects the ability of each unit of assets to create profits, while the latter mainly reflects the profitability per unit of sales in market competition.
- (2)
- Select MES to describe the economies of scale of market structure. Given that the scale of state-owned enterprises of China’s renewable resources industry is not the result of market competition efficiency choice, the large scale is not necessarily based on efficiency and cost advantages; instead, in spite of the small scale, many private enterprises have lower operating costs than large state-owned enterprises. We chose the indicator of enterprises’ average size, namely respective original prices of fixed assets of state-owned, private, and foreign enterprises and the overall ratio of enterprises of the renewable resources industry.
- (3)
- According to the analysis in Section 3, we chose indicator OWN, which has a significant impact on industrial performance. The ratios of actual capital and total industrial capital of the three kinds of enterprises’ respective companies were used to characterize the proportion in the industry, and a higher proportion means more extensive distribution in this industry.
- (4)
- According to the theory of industrial organization, enterprises’ business behaviors play an important role in industrial performance, so we selected the ratio of profits to cost, that is the ratio of total profits and total costs (selling expenses, management expenses and financial expenses), reflecting the economic benefits of enterprises’ investment.
According to the analysis above, the panel data model was employed:
where for i = 1,2…,N cross-section units and periods t = 1,2,…,T; C is the constant term; εit is a random disturbance term; Prit is the performance of enterprise i in year t; MES represents the minimum economies of scale; OWN denotes the industrial ownership structure; and RPC reflects the contribution per unit of operation costs to performance.
4.1.2. Results and Analysis
Panel unit root test. In order to avoid spurious regression, we selected individual intercepts and trends and did a panel unit root test on the raw data, finding that all the series are non-stationary except for OWN (see Table 5). Hence, do 1st difference on all variables and the results of the test show that the series are stationary, which means we can do a co-integration test.
| Variable | PR1 | PR2 | MES | OWN | RPC | |||||
|---|---|---|---|---|---|---|---|---|---|---|
| Testing Methods | Statistic | Prob. | Statistic | Prob. | Statistic | Prob. | Statistic | Prob. | Statistic | Prob. |
| LLC | −4.98 | 0.00 | −3.90 | 0.00 | −9.41 | 0.00 | −4.98 | 0.00 | −4.15 | 0.00 |
| IPS | −2.82 | 0.00 | −1.84 | 0.033 | −5.13 | 0.00 | −2.82 | 0.00 | −2.47 | 0.01 |
| ADF | 19.39 | 0.00 | 14.18 | 0.028 | 30.38 | 0.00 | 19.39 | 0.00 | 18.79 | 0.00 |
| PP | 19.53 | 0.00 | 10.60 | 0.101 | 34.08 | 0.00 | 19.53 | 0.00 | 22.41 | 0.00 |
Note: LLC, IPS, ADF and PP are four kinds of unit root test methods; LLC test (Levin-Lin-Chu test) is common unit root test method; IPS test (Im-Pesaran-Shin test) and ADF test (Augmented DF test) are individual unit root test methods; PP test: Phillips ad Perron test.
Panel co-integration test. After all variables were stationary at 1st difference, we did a co-integration test to test whether there was a long-term, stable relationship among the variables. We used the Kao Residual Co-integration test to test the relevant variables. In cases that contained the individual intercept term but no trend term and a lag period fix in period one, the Kao Residual Co-integration test rejected the original hypothesis that co-integration relationships do not exist among variables, under the significant level of 1%. Therefore, we can do regression on the panel data.
The set of panel data model. First, use the F-statistic to help select mixed effects models or pooled regression models. The general expression of panel model is as follows:
where i = 1,2,…,N cross-section units and periods t = 1,2…,T, αit and βit are 1 × 1 and 1 × K vectors of constants that vary across i and t, respectively; Xit is a row 1 × K vectors of exogenous variables; εit is the error term; and K is the number of variables.
The null hypothesis was:
H2:
Under the condition of hypothesis H2, statistics F2 = 2.66. When the number of cross section N = 3, the number of explanatory variables K = 3, the time series T = 11, and significance level 5%, the computed statistics F(8.21) = 2.42. Because F2 = 2.66 > 2.42, it rejected H2, which means rejecting the hybrid model. Therefore, we could only choose from the random intercept model and the random effect mode. This paper finally chose the fixed effect random intercept model, based on the following two considerations: (1) the empirical analysis directly analyzed the sample data, rather than inferring overall effect through sampling data, so we usually choose the fixed effect regression model; and (2) when N is not greater than K, we cannot use Eviews6.0 to set random effect models. Hence, the fixed effect random intercept model can be represented as follows:
Panel regression results. Empirical analysis results of the fixed effect model are as follows:
where i is the number of panels, and Ci is the common coefficient intercept. Based on the fixed effect (See the Equations (4) and (5)), we can see that the three indicators (coefficients of minimum economies of scale, ownership structure, and cost contribution rate), which all have an important impact on industrial performance, were significant under the significant level of 5%. Take Equation (4) as an example and analyze the indices above: the elastic coefficient of minimum economies of scale to industrial performance is 0.063. That is to say, industrial performance increases by 0.063% when minimum economies of scale increase by 1%. Similarly, industrial performance increases by 0.03% and 0.01%, respectively, when the ownership structure and cost contribution rate increase by 1%. In other words, both Equations (2) and (3) show that minimum economies of scale make the greatest contribution to industrial performance, followed by the ownership structure and cost contribution rate.
C11 (state-owned enterprises) = −0.0063, C12 (private enterprises) = 0.01276, C13 (foreign-funded enterprises) = −0.0064; C21 (state-owned enterprises) = −0.0025, C22 (private enterprises) = 0.0055, C23 (foreign-funded enterprises) = −0.0030. In Equations (4) and (5), the sum of the intercept term of these three kinds of enterprises and the constant term reflect each fundamental, otherwise, known as the amplification effect of the increase of minimum economies of scale, the ownership structure, and cost contribution rate on the return on assets of renewable resources industry. In other words, the larger the intercept term, the larger the amplification effect, and vice versa. The analysis results of the fixed effect intercept term indicate that private enterprises make the greatest contribution to the renewable resources industry.
4.2. Listed Companies
4.2.1. Samples and Indicators
Taking into account the availability of data and trade restrictions of listed companies, this analysis selected 19 domestic listed companies (data for these 19 listed companies are derived from the annual reports of listed companies on Sina.com (2009–2013); Hong Kong-listed companies are not selected because the reporting period and the form of annual reports are different from those of the Shanghai Stock Exchange and the Shenzhen Stock Exchange) [32]. Among them are Grammy, whose main job is to recycle secondary metal and e-waste, and leading enterprises of the renewable resources industry such as Sound Environmental, which focuses on the disposal and recycling of city garbage and industrial solid waste. The overall efficiency of these companies reflects the overall performance of China’s renewable resources industry.
The selection of input-output variables: This paper selected four input indicators and two output indicators. Input indicators are: total assets, operating costs, total liabilities, and employees; Output indicators are: revenue and net profit. The total assets indicator means all assets that can bring economic benefits, so it can be seen as an input indicator. The operating cost is critical to evaluate the efficiency of an enterprise’s production and business activities; the total liability is closely related to profitability; and the number of employees reflects the input of enterprises’ human capital. The revenue is an important indicator to evaluate the business operation results and profitability, and the net profit is able to evaluate the enterprises’ performance more comprehensively.
4.2.2. Empirical Results and Analysis
The study uses the input/output data of 19 listed companies over the period 2009–2013 in order to measure the total factor productivity of Chinese renewable resources industries by using the DEA Malmquist index model.
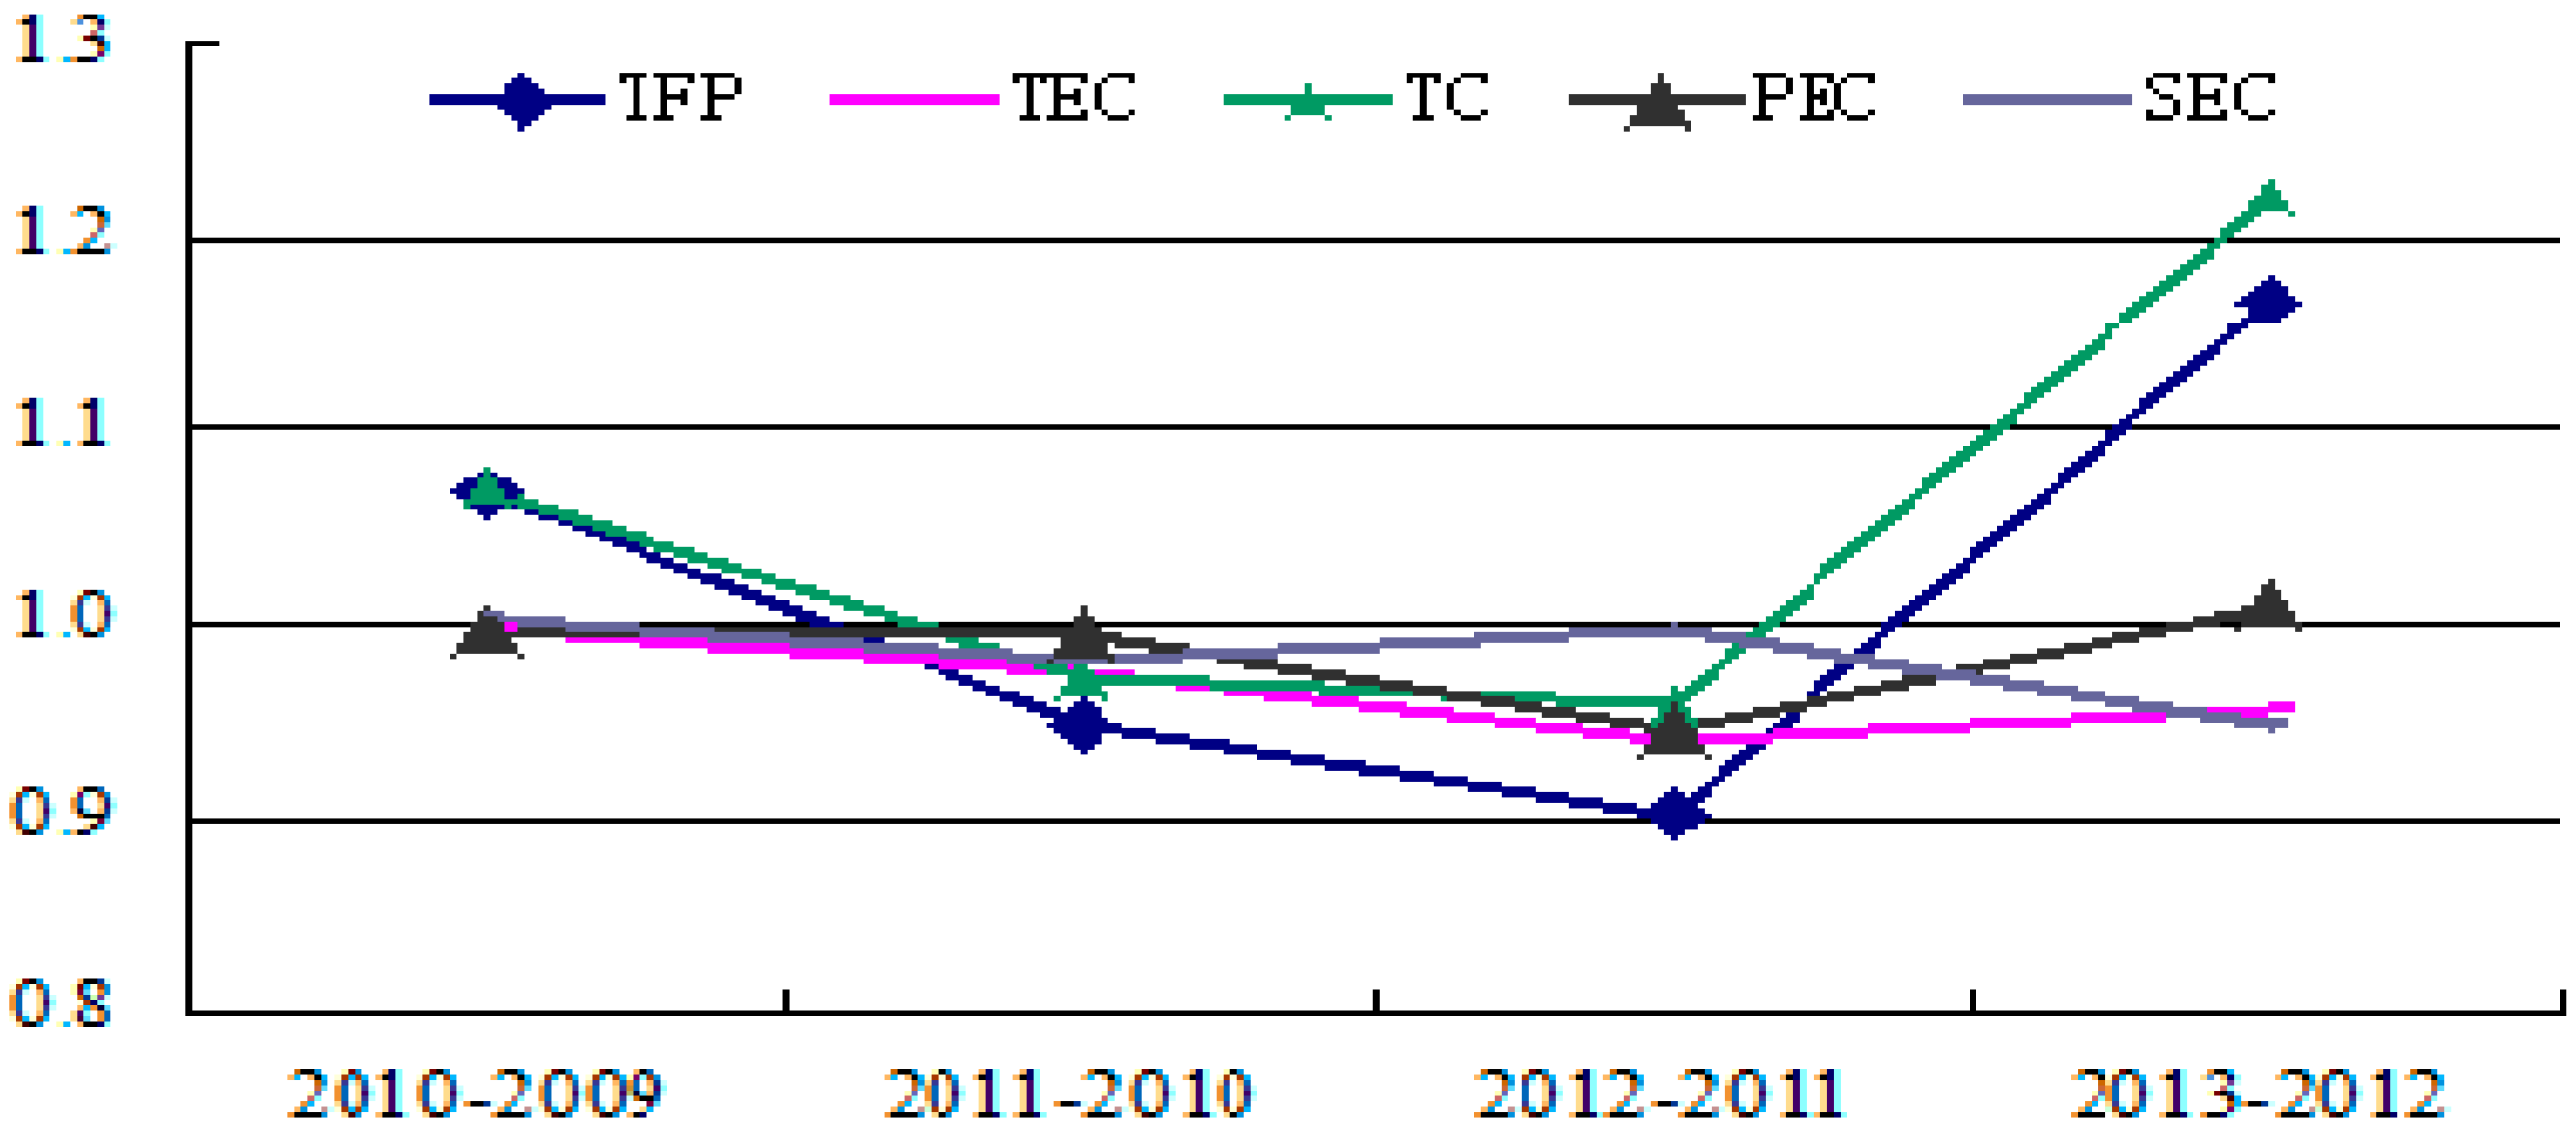
As can be seen in Table 6, the average growth rate of the renewable resources industry’s total factor productivity was 2.1%, and the average growth rate of technical progress was positive, at 5.5%; the average growth rate of technical efficiency was −3.3%, and the rates of pure technical efficiency and scale efficiency were −1.5% and −1.8%, respectively. The results show that the positive growth of technical progress not only makes up for the decline in the rate of technical efficiency (including pure technical efficiency and scale efficiency), but also is far greater than the negative growth of technical efficiency, leading to a high positive growth rate of the total factor productivity between 2009 and 2013. That is to say, the high rise of the renewable resources industry’s total factor productivity in recent years is due to the rapid development of technology. Technological innovation means “hard” technical progress is greater than “soft” technical progress including management, systems, and policies. The following figure (Figure 13) further shows that the fluctuations of total factor productivity and technological progress are significant, while those of technical efficiency, pure technical efficiency, and scale efficiency are obviously small. The following things result in this situation: the renewable resources industry is a fast development sunrise industry in the 21st century; under the conditions of a low degree of market regulation, imperfect institutional measures, and low management, technical progress has much space to improve, while pure technical efficiency (accumulation of management efficiency and production experience) and scale efficiency (the ability and knowledge of formation and management of large enterprises) have to go through the accumulation of time and practice and then increase slowly.
| Year | TEC | PEC | SEC | TC | TFP |
|---|---|---|---|---|---|
| 2009–2010 | 0.998 | 0.995 | 1.003 | 1.069 | 1.067 |
| 2010–2011 | 0.974 | 0.994 | 0.98 | 0.972 | 0.947 |
| 2011–2012 | 0.941 | 0.945 | 0.996 | 0.958 | 0.901 |
| 2012–2013 | 0.956 | 1.009 | 0.948 | 1.222 | 1.168 |
| Average | 0.967 | 0.985 | 0.982 | 1.055 | 1.020 |
TEC: technical efficiency change; PEC: pure technical efficiency change; SEC: scale efficiency change; TC: technical progress change; TFP: Total factor productivity. The technical efficiency change can be further decomposed into the pure technical efficiency change and scale efficiency change, namely TEC = PEC × SEC and TFP = TEC × TC.
Figure 13.
Total factor productivity and its composition of the renewable resources industry (2009–2013).
Figure 13.
Total factor productivity and its composition of the renewable resources industry (2009–2013).
5. Conclusions and Policy Implications
As an important access to resources, the renewable resources industry is important for the sustainable development of the economy. This paper qualitatively analyzed the industry in terms of industrial scales, economic efficiency, and performance. The results show on the one hand that all indicators reflect that the industry has good development and the return on assets is higher than the overall expenditure of assets; on the other hand, private enterprises have become the leading force in the industry, while state-owned and foreign-funded enterprises develop slowly. In the quantitative analysis, this paper used panel data to analyze the industrial performance, and drew the conclusion that coefficients of minimum economies of scale, the ownership structure, and cost contribution rate have a positive effect on the performance. Compared with state-owned private enterprises and foreign-funded enterprises, private enterprises make the largest contribution. In order to reflect the performance more fully, this paper measured many efficiency indicators for 19 listed companies, and the results show that the high rise in the renewable resources industry’s total factor productivity is due to the rapid development of technology; however, technical efficiency needs to be improved.
The renewable resources industry is not only a public welfare industry, but also a low-profit industry. Therefore, in order to improve the utilization efficiency and industrialization level, the government should establish and perfect the laws related to renewable resources industry and make a stable fiscal tax subsidies policy. The government should also increase investment in research, enhance public education about the development of renewable resources, encourage enterprises to carry out research, promote resources recycling technology and technological innovation, and improve industrial technology efficiency. At the same time, the government should learn from foreign advanced production management, and make a performance evaluation system that takes into account the perspectives of society, economy, and the environment.
Acknowledgments
This paper is supported by “National Natural Science Foundation of China Project” (Grant No. 71273088, 71471058) and Science and technology project funding by State Grid Liaoning Electric Power Supply Limited Company (Grant No. 5222JJ14001F).
Author Contributions
Both authors contributed equally to the research design. Dong Zhou formulated the theoretical model and did the general write-up. Both authors read and approved the final manuscript.
Conflicts of Interest
The authors declare no conflict of interest.
References
- National Bureau of Statistics of the People’s Republic of China. China Statistical Yearbook. Available online: http://www.stats.gov.cn/tjsj/ndsj/ (accessed on 13 August 2015).
- Calo, F.; Parise, M. Waste management and problems of groundwater pollution in karst environments in the context of a post-conflict scenario: The case of Mostar (Bosnia Herzegovina). Habitat Int. 2009, 33, 63–72. [Google Scholar] [CrossRef]
- Genaidy, A.; Sequeira, R.; Tolaymat, T.; Kohler, J.; Rinder, M. Evidence-based integrated environmental solutions for secondary lead smelters: Pollution prevention and waste minimization technologies and practices. Sci. Total Environ. 2009, 407, 3239–3268. [Google Scholar] [CrossRef] [PubMed]
- Tao, J. Current Status and Management of Solid Waste Pollution in China. Environ. Sci. Manag. 2012, 37, 1–5. [Google Scholar]
- Li, W. The inefficiencies of market mechanism and policies to develop the recycling industry. Recycl. Resour. Cycl. Econ. 2007, 3, 1–4. [Google Scholar]
- Feng, H.; Zhang, J. Marketization Progress and Governmental Controls on Recycling Resources Industry. Resour. Ind. 2009, 11, 105–109. [Google Scholar]
- Loukil, F.; Rouached, L. Modeling packaging waste policy instruments and recycling in the MENA region. Resour. Conserv. Recycl. 2012, 69, 141–152. [Google Scholar] [CrossRef]
- Keramitsoglou, K.; Tsagarakis, K. Public participation in designing a recycling scheme towards maximum public acceptance. Resour. Conserv. Recycl. 2013, 70, 55–67. [Google Scholar] [CrossRef]
- Garnett, K.; Cooper, T. Effective dialogue: Enhanced public engagement as a legitimising tool for municipal waste management decision-making. Waste Manag. 2014, 34, 2709–2726. [Google Scholar] [CrossRef] [PubMed]
- William, J.; Panzar, J.; Willig, R. Contestable Markets and Theory of Industry Structure; Harcourt Brace Jovanovich: New York, NY, USA, 1982. [Google Scholar]
- Harold, D. Industry Structure, Market Rivalry, and Public Policy. J. Law Econ. 1973, 16, 1–9. [Google Scholar]
- Yin, X. Theory of China’s manufacturing industry concentration and the resource allocation efficiency. Econ. Res. J. 1996, 1, 1–20. [Google Scholar]
- Qi, Y. China’s industrial concentration and an empirical analysis of the relationship between economic performances. Manag. World 1998, 4, 99–106. [Google Scholar]
- Gale, B.T.; Branch, B.S. Concentration Versus Market Share: Which Determines Performance and Why Does it Matter? Antitrust Bull. 1982, 27, 83–103. [Google Scholar]
- Marin, P.L.; Siotis, G. Public policies towards Research Joint Venture: Institutional design and participants’ characteristics. Res. Policy 2008, 37, 1057–1065. [Google Scholar] [CrossRef]
- Xu, Z.; Yan, B. Industrial Structure and Performance in China Manufacture Sector: A Study Based on Correspondence Analysis. Mod. Econ. Sci. 2005, 27, 87–92. [Google Scholar]
- Tang, Y. The empirical analysis on the factors of China’s industry performance. China Econ. Stud. 2004, 4, 28–36. [Google Scholar]
- Hart, O.; Shleifer, A.; Vishny, R.W. The Proper Scope of Government: Theory and an Application to Prisons. Q. J. Econ. 1997, 112, 1126–1161. [Google Scholar] [CrossRef]
- Shleifer, A. State versus Private Ownership. J. Econ. Perspect. 1998, 12, 133–150. [Google Scholar] [CrossRef]
- Zuo, B.; Varela, O.; Hassan, K. Ownership and Performance in China Manufacturing Industry. J. Multinatl. Financ. Manag. 2002, 12, 61–78. [Google Scholar]
- Ng, A.; Yuce, A.; Chen, E. Determinants of state equity ownership, and its effect on value performance: China’s privatized firm. Pac. Basin Financ. J. 2009, 17, 413–443. [Google Scholar] [CrossRef]
- Mei, Y. State ownership and firm performance: Empirical evidence from Chinese listed companies. China J. Account. Res. 2013, 6, 75–87. [Google Scholar]
- Knyazev, A.; Knyazeva, D.; Stiglitz, J.E. Ownership change, institutional development and performance. J. Bank. Financ. 2013, 37, 2605–2627. [Google Scholar] [CrossRef]
- Liu, X. The Structure of Property Rights in the Chinese Transition Economy. Econ. Res. J. 2003, 1, 21–29. [Google Scholar]
- Sun, Z.; Wang, W. The influence of industrial ownership structure change on industry performance. Manag. World 2011, 8, 66–78. [Google Scholar]
- Ministry of Commerce of the People’s Republic of China Department of Circulation Industry Development. Industry analysis report Recycled Resources of China. 2014. Available online: http://wenku.baidu.com/link?url=IPXoYr2oI1gEAfbGhvOXpUQCR9G6VR51wUHcX1JZHNrzZDk5yV5EDs7eCRx389uFQ47lXLMa5pEbjKGQLz55nqUgrBKdNrmDgYqydtaOjzW (accessed on 20 June 2014).
- Department of Circulation Industry Development, Ministry of Commerce of the People’s Republic of China. Industry analysis report Recycled Resources of China. 2012. Available online: http://ltfzs.mofcom.gov.cn/article/date/201306/20130600172833.shtml (accessed on 24 June 2013). [Google Scholar]
- China National Resources Recycling Association (CRRA). Industry Development Report of Recycled Resources of China. 2006–2012; unpublished work. [Google Scholar]
- Chen, X.; Fu, J. The recycling situation and countermeasures of waste electrical and electronic equipment in China. Recycl. Resour. Cycl. Econ. 2009, 7, 34–38. [Google Scholar]
- Zhang, Y.; Feng, H.; Lu, M. Analysis on regulation policy of recycling industry in China. Recycl. Resour. Cycl. Econ. 2012, 11, 9–15. [Google Scholar]
- Liu, G.; Lu, S.; Li, X. Problem analysis and countermeasures to the development of China’s recycling industry. Inq. Econ. Issues 2012, 8, 64–69. [Google Scholar]
- Sina Finance. Available online: http://vip.stock.finance.sina.com.cn/q/go.php/vFinanceAnalyze/kind/mainindex/index.phtml (accessed on 12 August 2015).
© 2015 by the authors; licensee MDPI, Basel, Switzerland. This article is an open access article distributed under the terms and conditions of the Creative Commons Attribution license (http://creativecommons.org/licenses/by/4.0/).
Share and Cite
MDPI and ACS Style
Zhou, D.; Zhao, X. Industrial Performance of the Renewable Resources Industry in China. Sustainability 2015, 7, 11777-11798. https://doi.org/10.3390/su70911777
AMA Style
Zhou D, Zhao X. Industrial Performance of the Renewable Resources Industry in China. Sustainability. 2015; 7(9):11777-11798. https://doi.org/10.3390/su70911777
Chicago/Turabian StyleZhou, Dong, and Xingang Zhao. 2015. "Industrial Performance of the Renewable Resources Industry in China" Sustainability 7, no. 9: 11777-11798. https://doi.org/10.3390/su70911777