
Application of Environmental Input-Output Analysis for Corporate and Product Environmental Footprints—Learnings from Three Cases

Abstract
:1. Introduction
- RQ1: What are the Strengths and Weaknesses of the EIO Approach?
- RQ2: How Does Application of the EIO Approach Influence the Companies’ Environmental Agenda?
1.1. Case 1: Corporate Carbon Footprint Account of Three Danish Regional Healthcare Organisations
1.2. Case 2: EIO Analysis Used for Environmental Profit and Loss Accounting of Healthcare Company Novo Nordisk A/S
1.3. Case 3: Life Cycle Assessment of a Tanker Ship Operated by Shipping Company TORM A/S
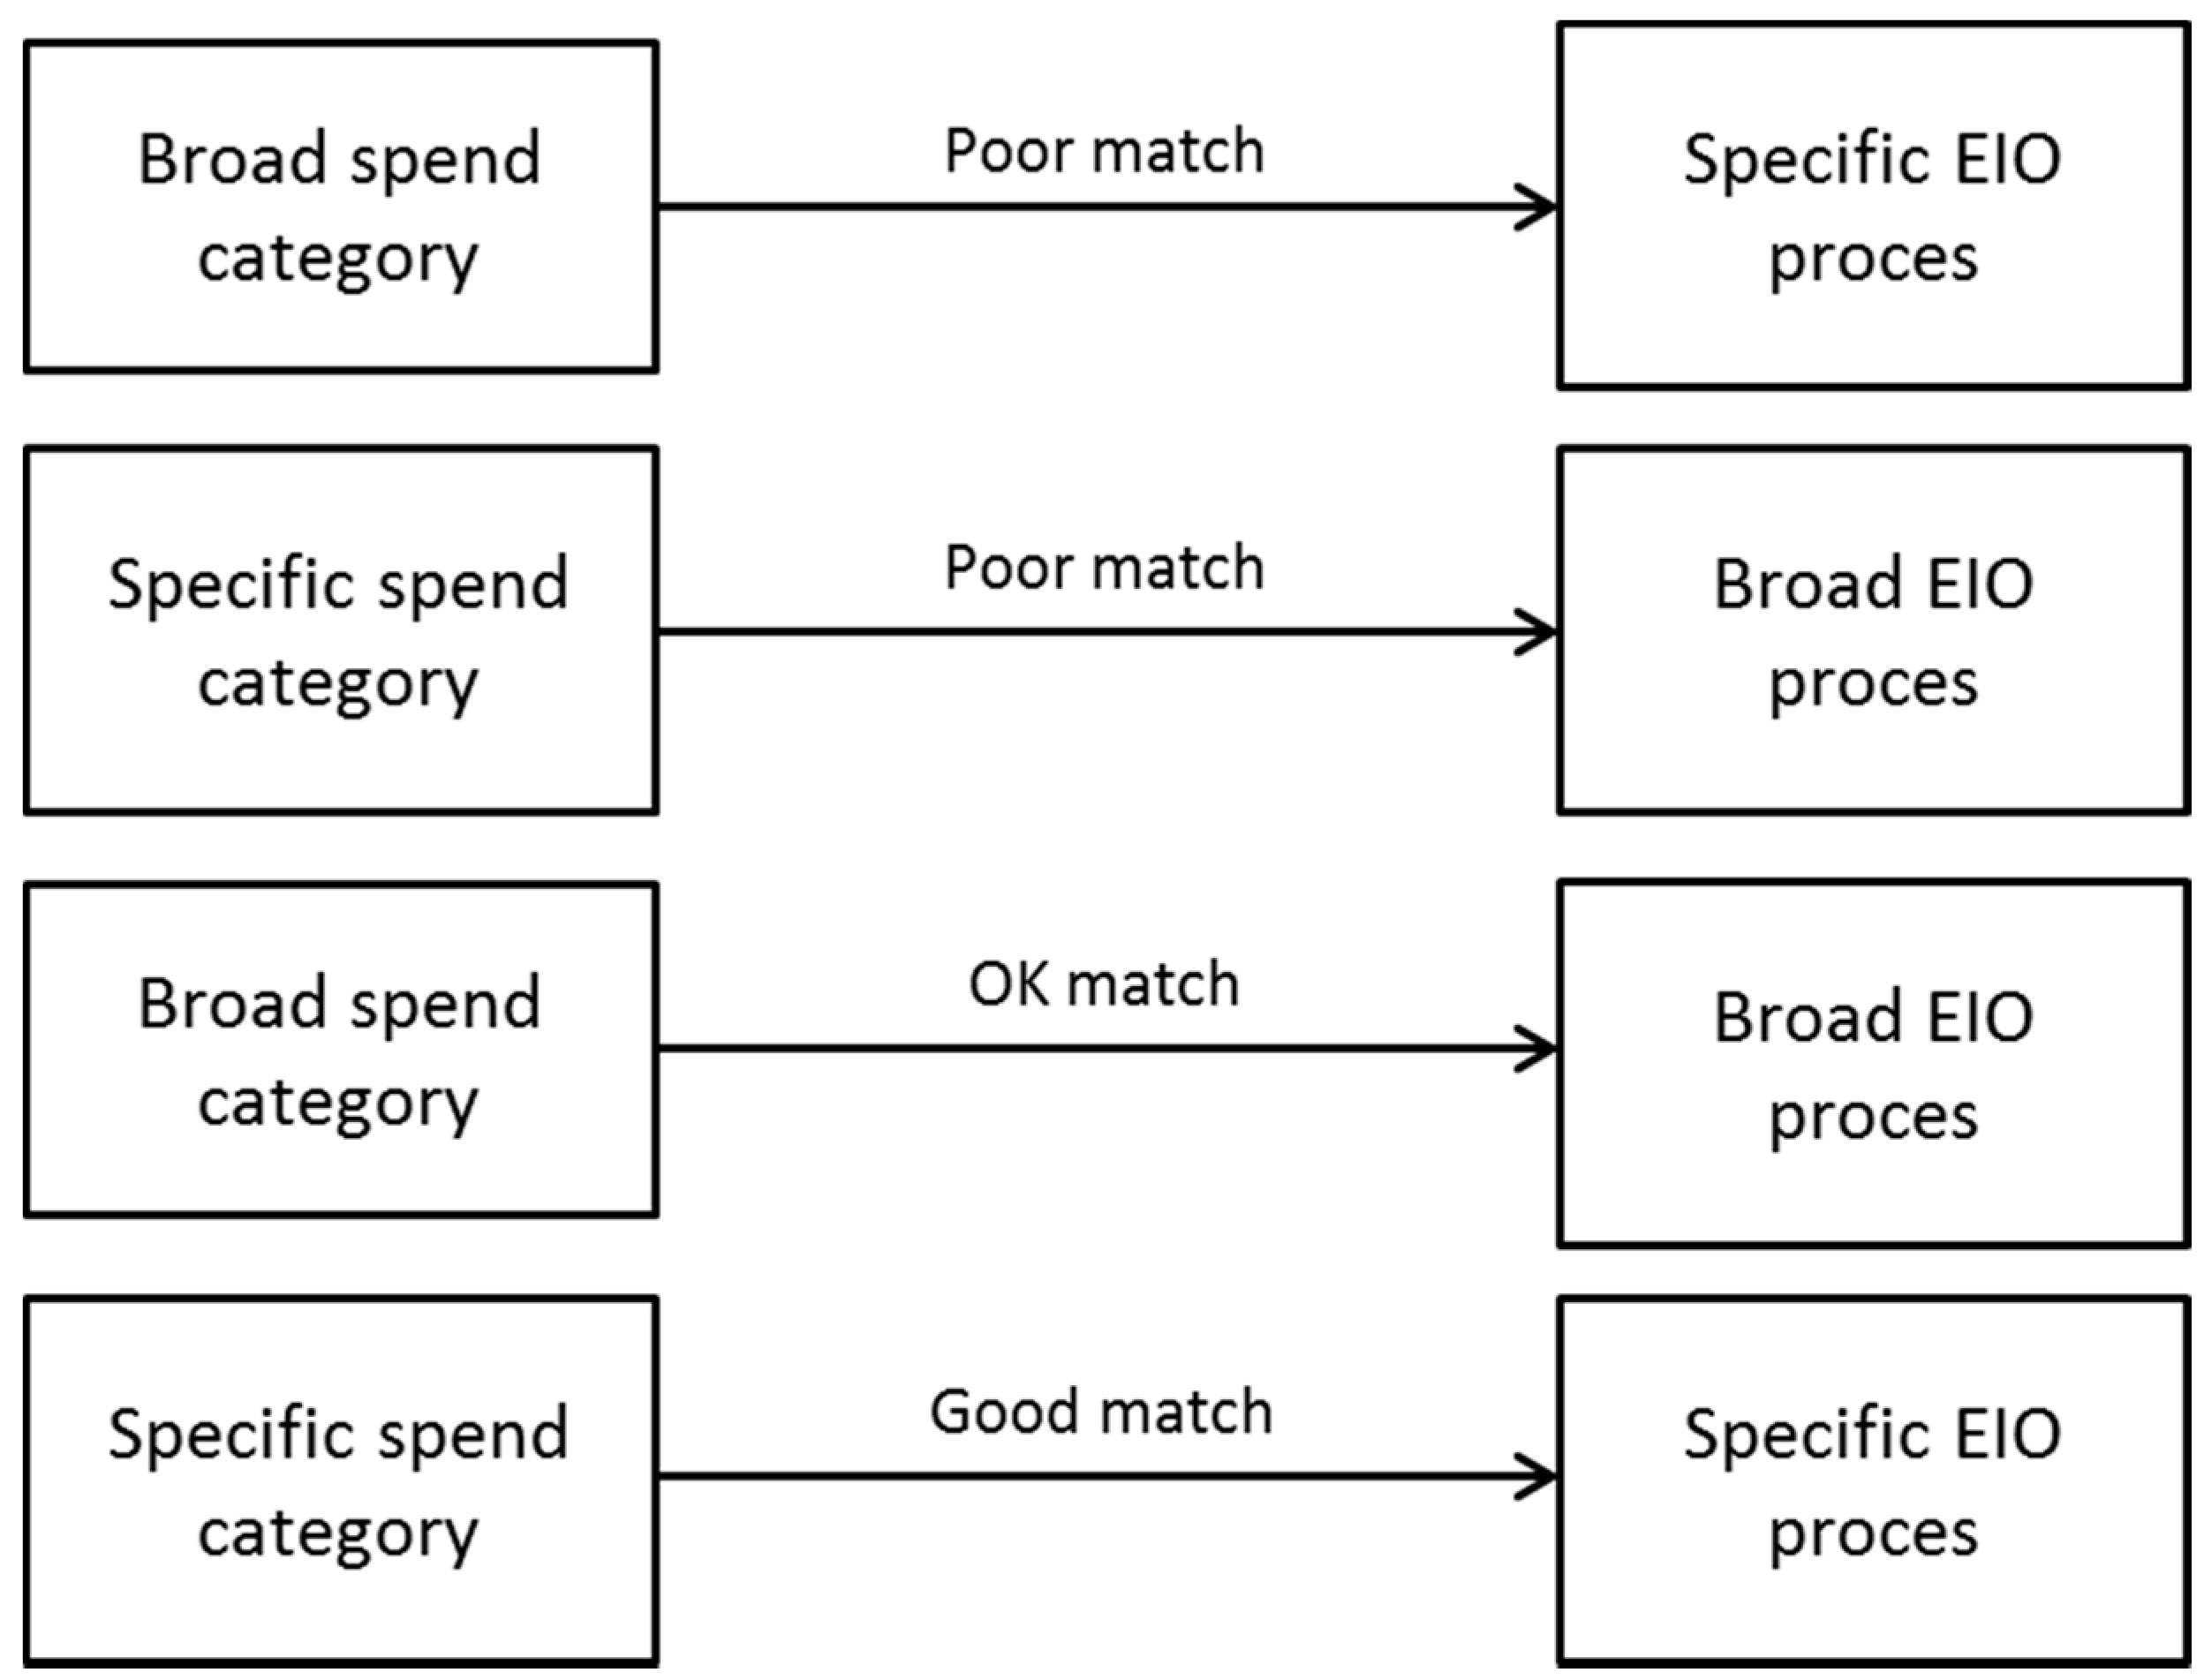
2. EIO Analysis
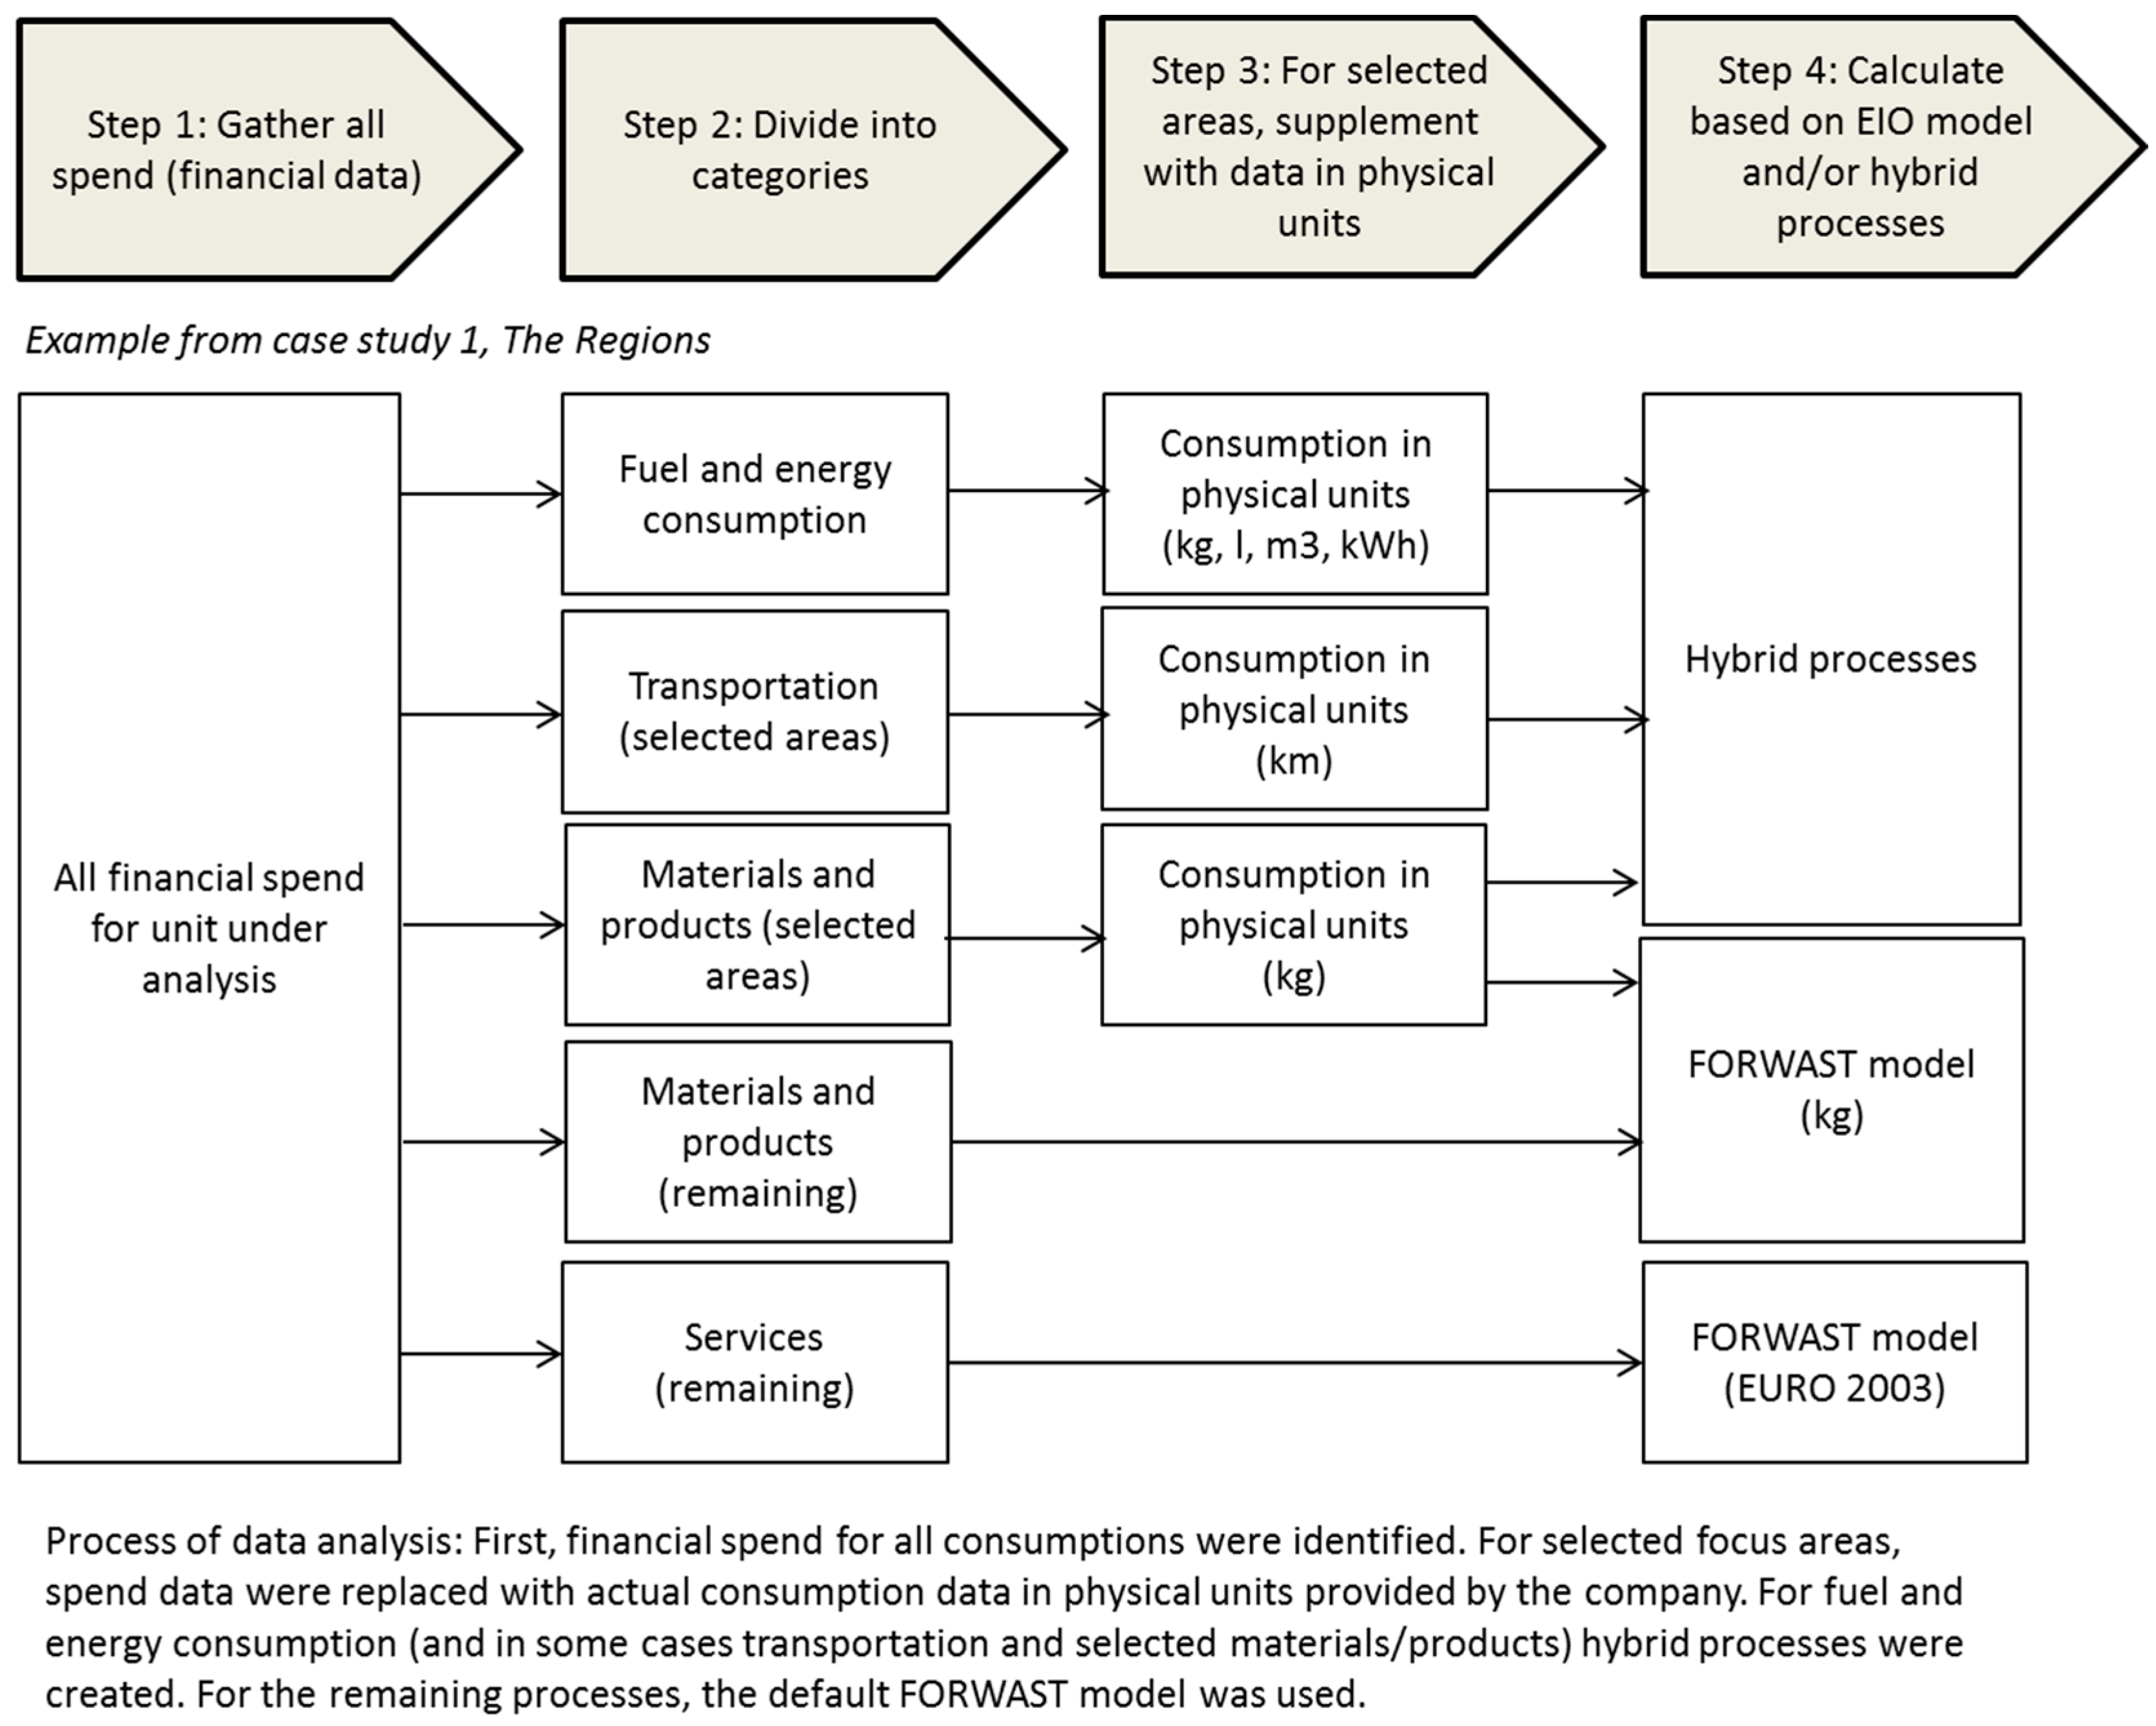
3. Applied Method
3.1. Hybrid Database FORWAST

| Modification | References for Documentation of the Improvements |
|---|---|
| Danish agriculture and food industry was further detailed. | Hermansen et al. (2010) [41] |
| More emissions were added: nitrate, phosphate. | Hermansen et al. (2010) [41] |
| More emissions were added: particles. | Kjær et al. (2011) [22] |
| Import to Denmark was divided into import from EU27 and from rest of the world (RoW). | Kjær et al. (2011) [22] |
| Land occupation was added as a resource input in the database. | Schmidt and Muñoz (2014) [42] |
| A model for indirect land use changes was embedded in the model. | Schmidt and Muñoz (2014) [42] |
3.2. Hybrid Modelling
3.3. Data Collection and Analysis
3.4. Follow-up and Evaluation
4. Case Study Results
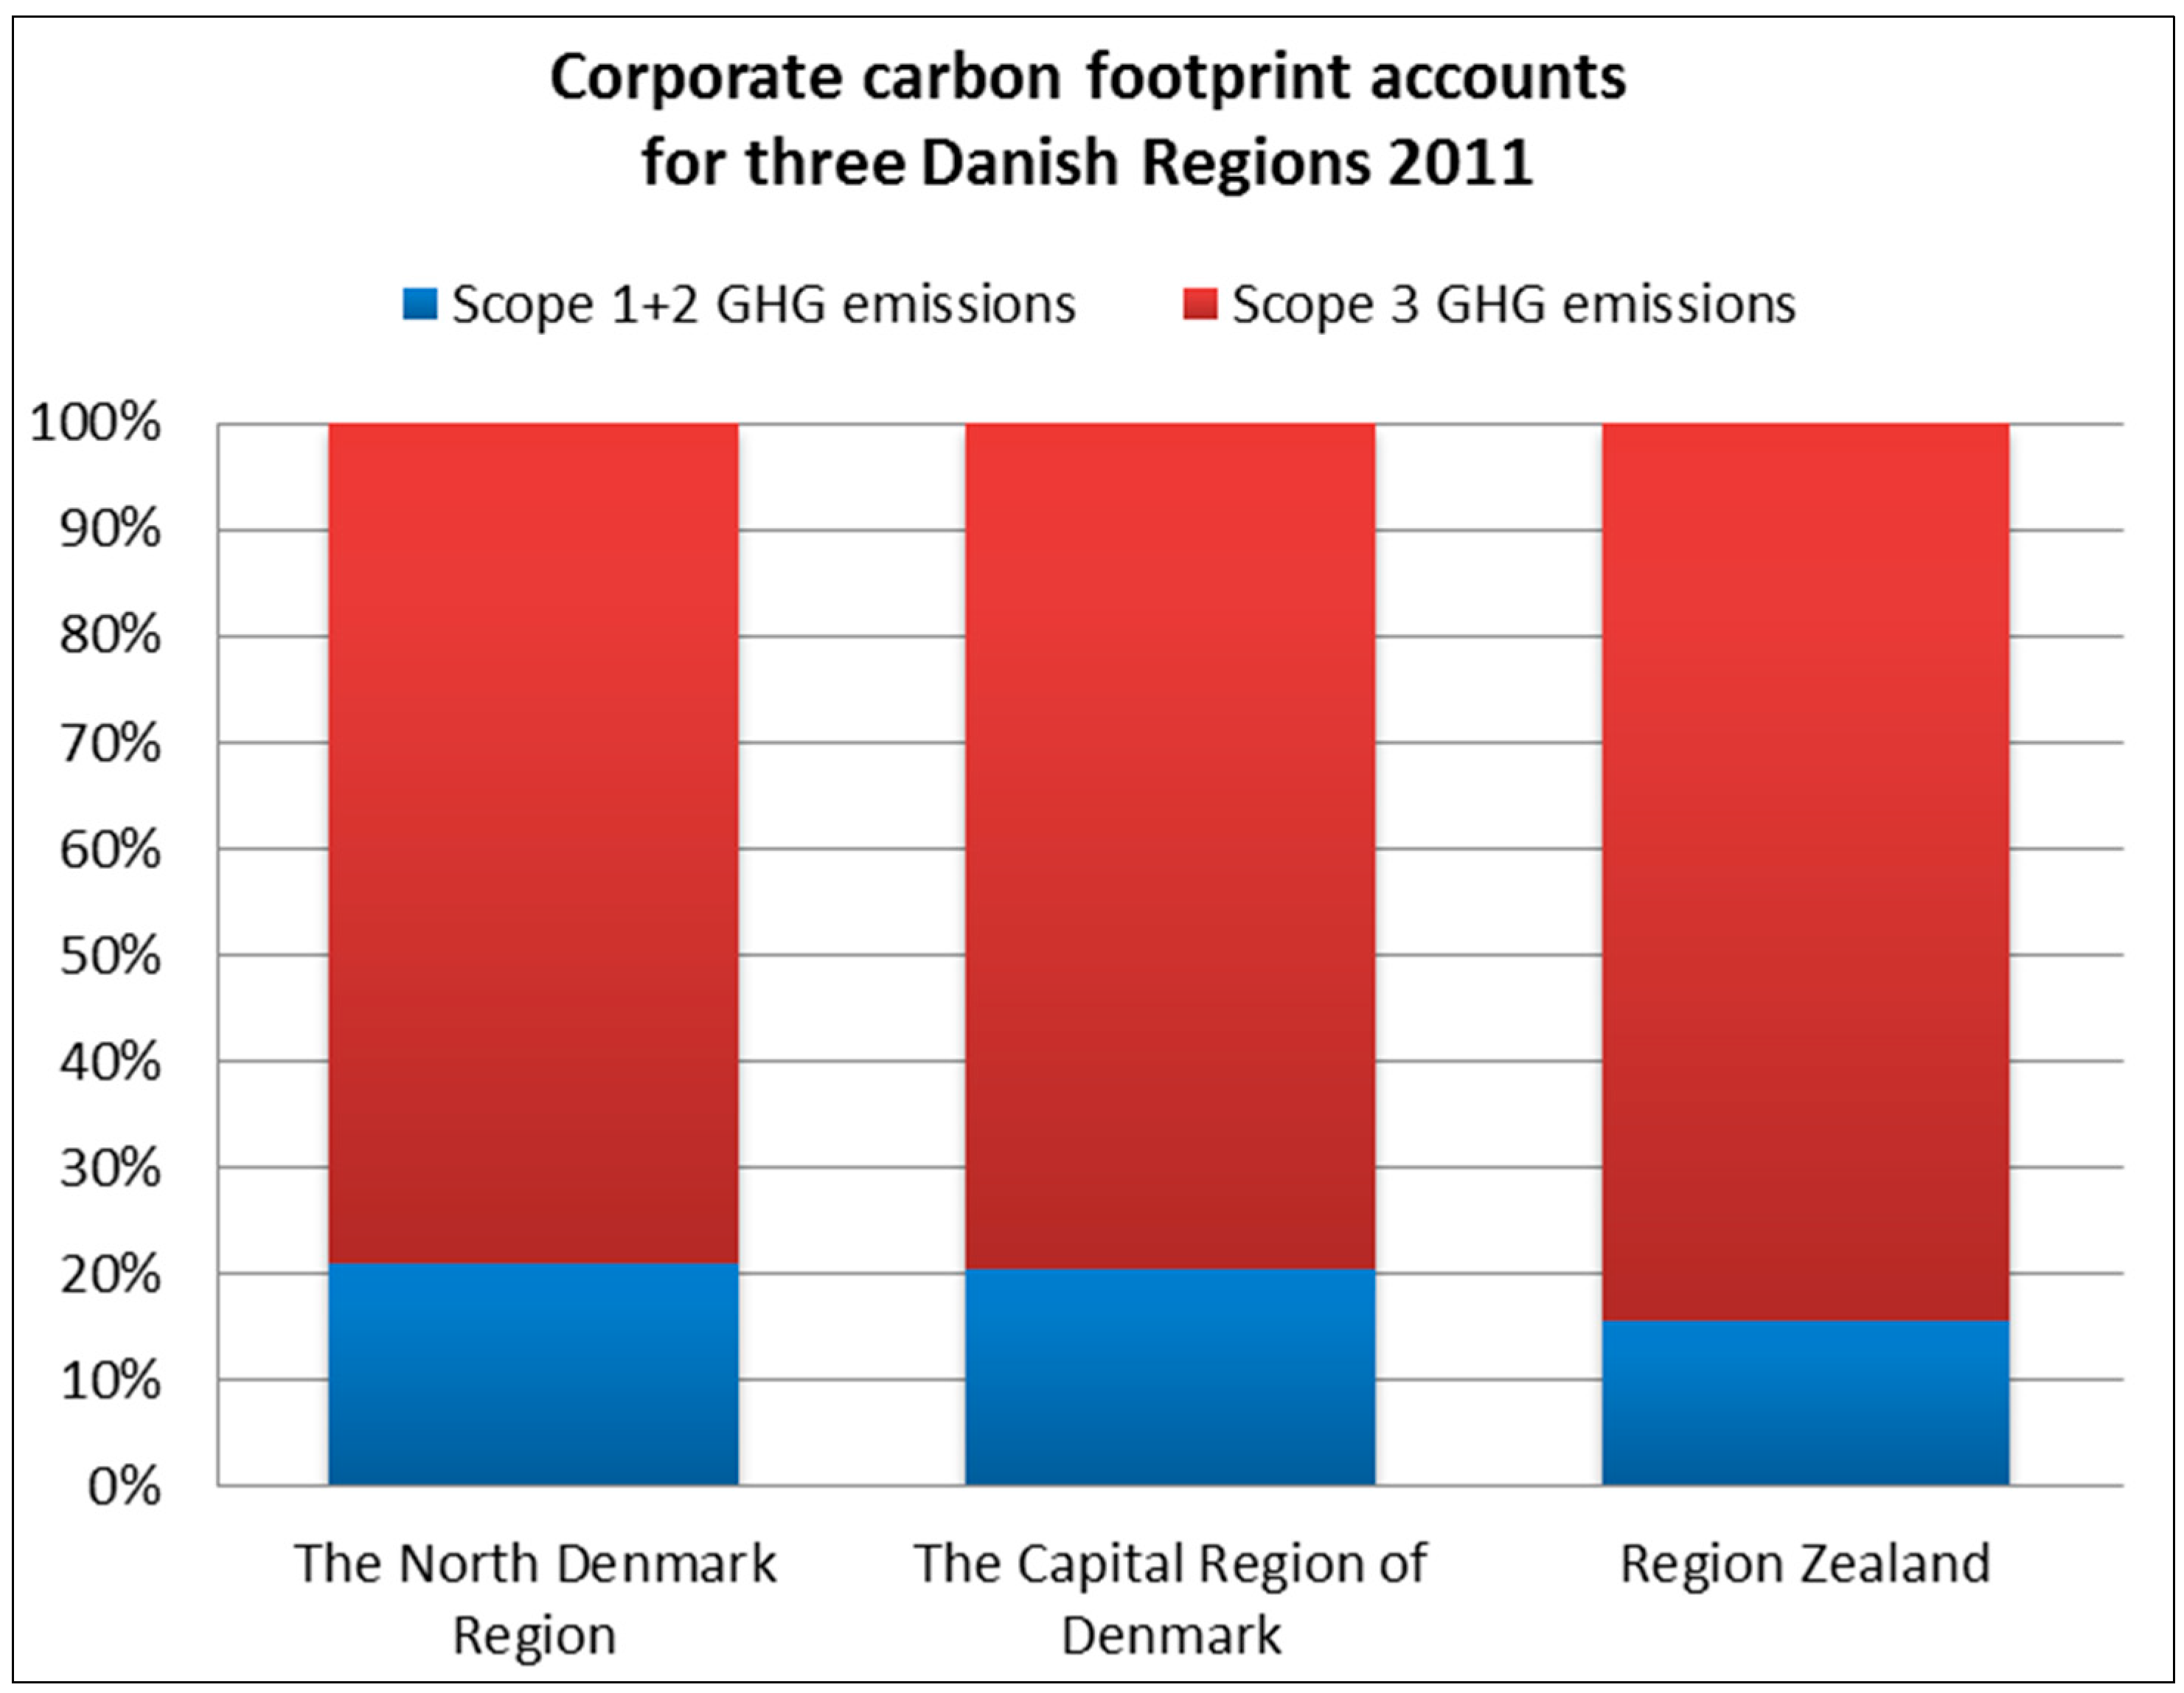
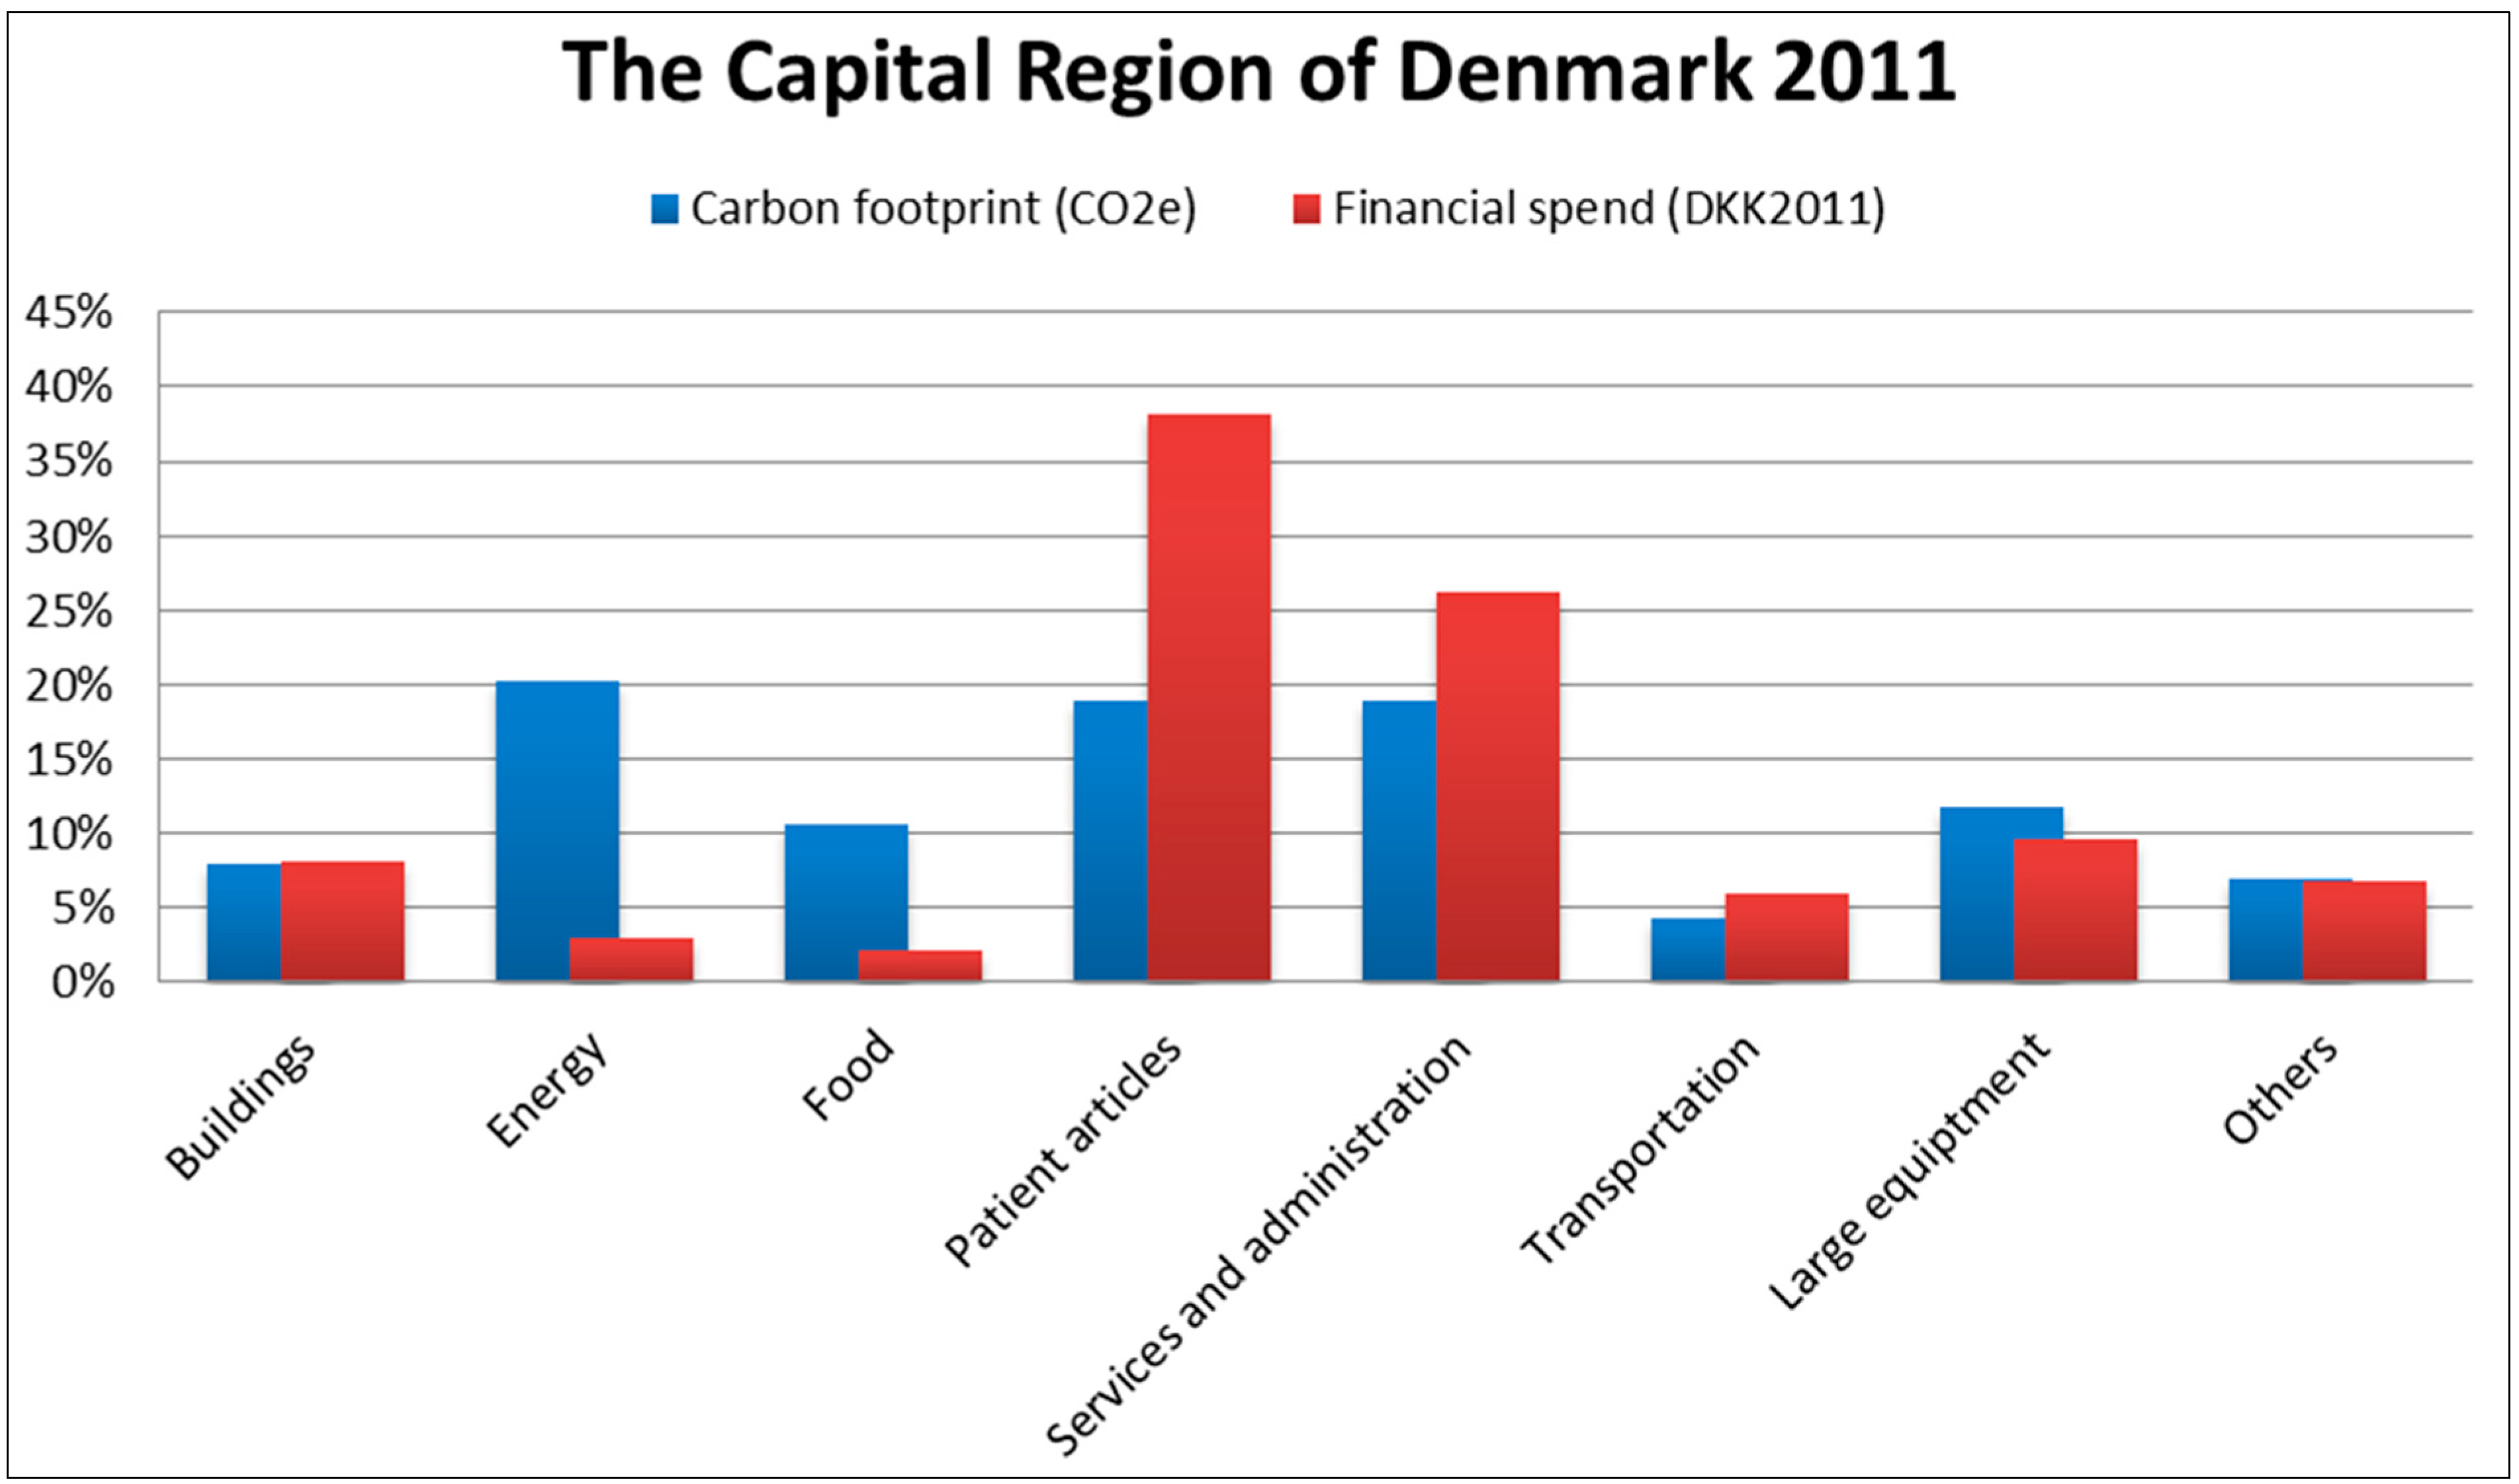
4.1. Case Study 1: Total Corporate Carbon Footprint Account of Three Danish Regional Healthcare Organisations

| KPI | 2007 | 2008 | 2009 | 2010 | 2011 | 2012 |
|---|---|---|---|---|---|---|
| t CO2e/employee | 17.4 | 18.2 | 17.1 | 16.5 | 14.7 | 14.6 |
| Kg CO2e/m2 | 323.6 | 347.0 | 351.9 | 344.1 | 302.5 | 302.3 |
| Kg CO2e/DKK | 67.8 | 63.3 | 60.9 | 61.1 | 56.8 | 53.2 |

- (1)
- CO2—effect (reduction potential)
- (2)
- Implementation costs
- (3)
- Organisational process
- (4)
- Branding effect
- (5)
- Data availability (to monitor improvements on a detailed level)
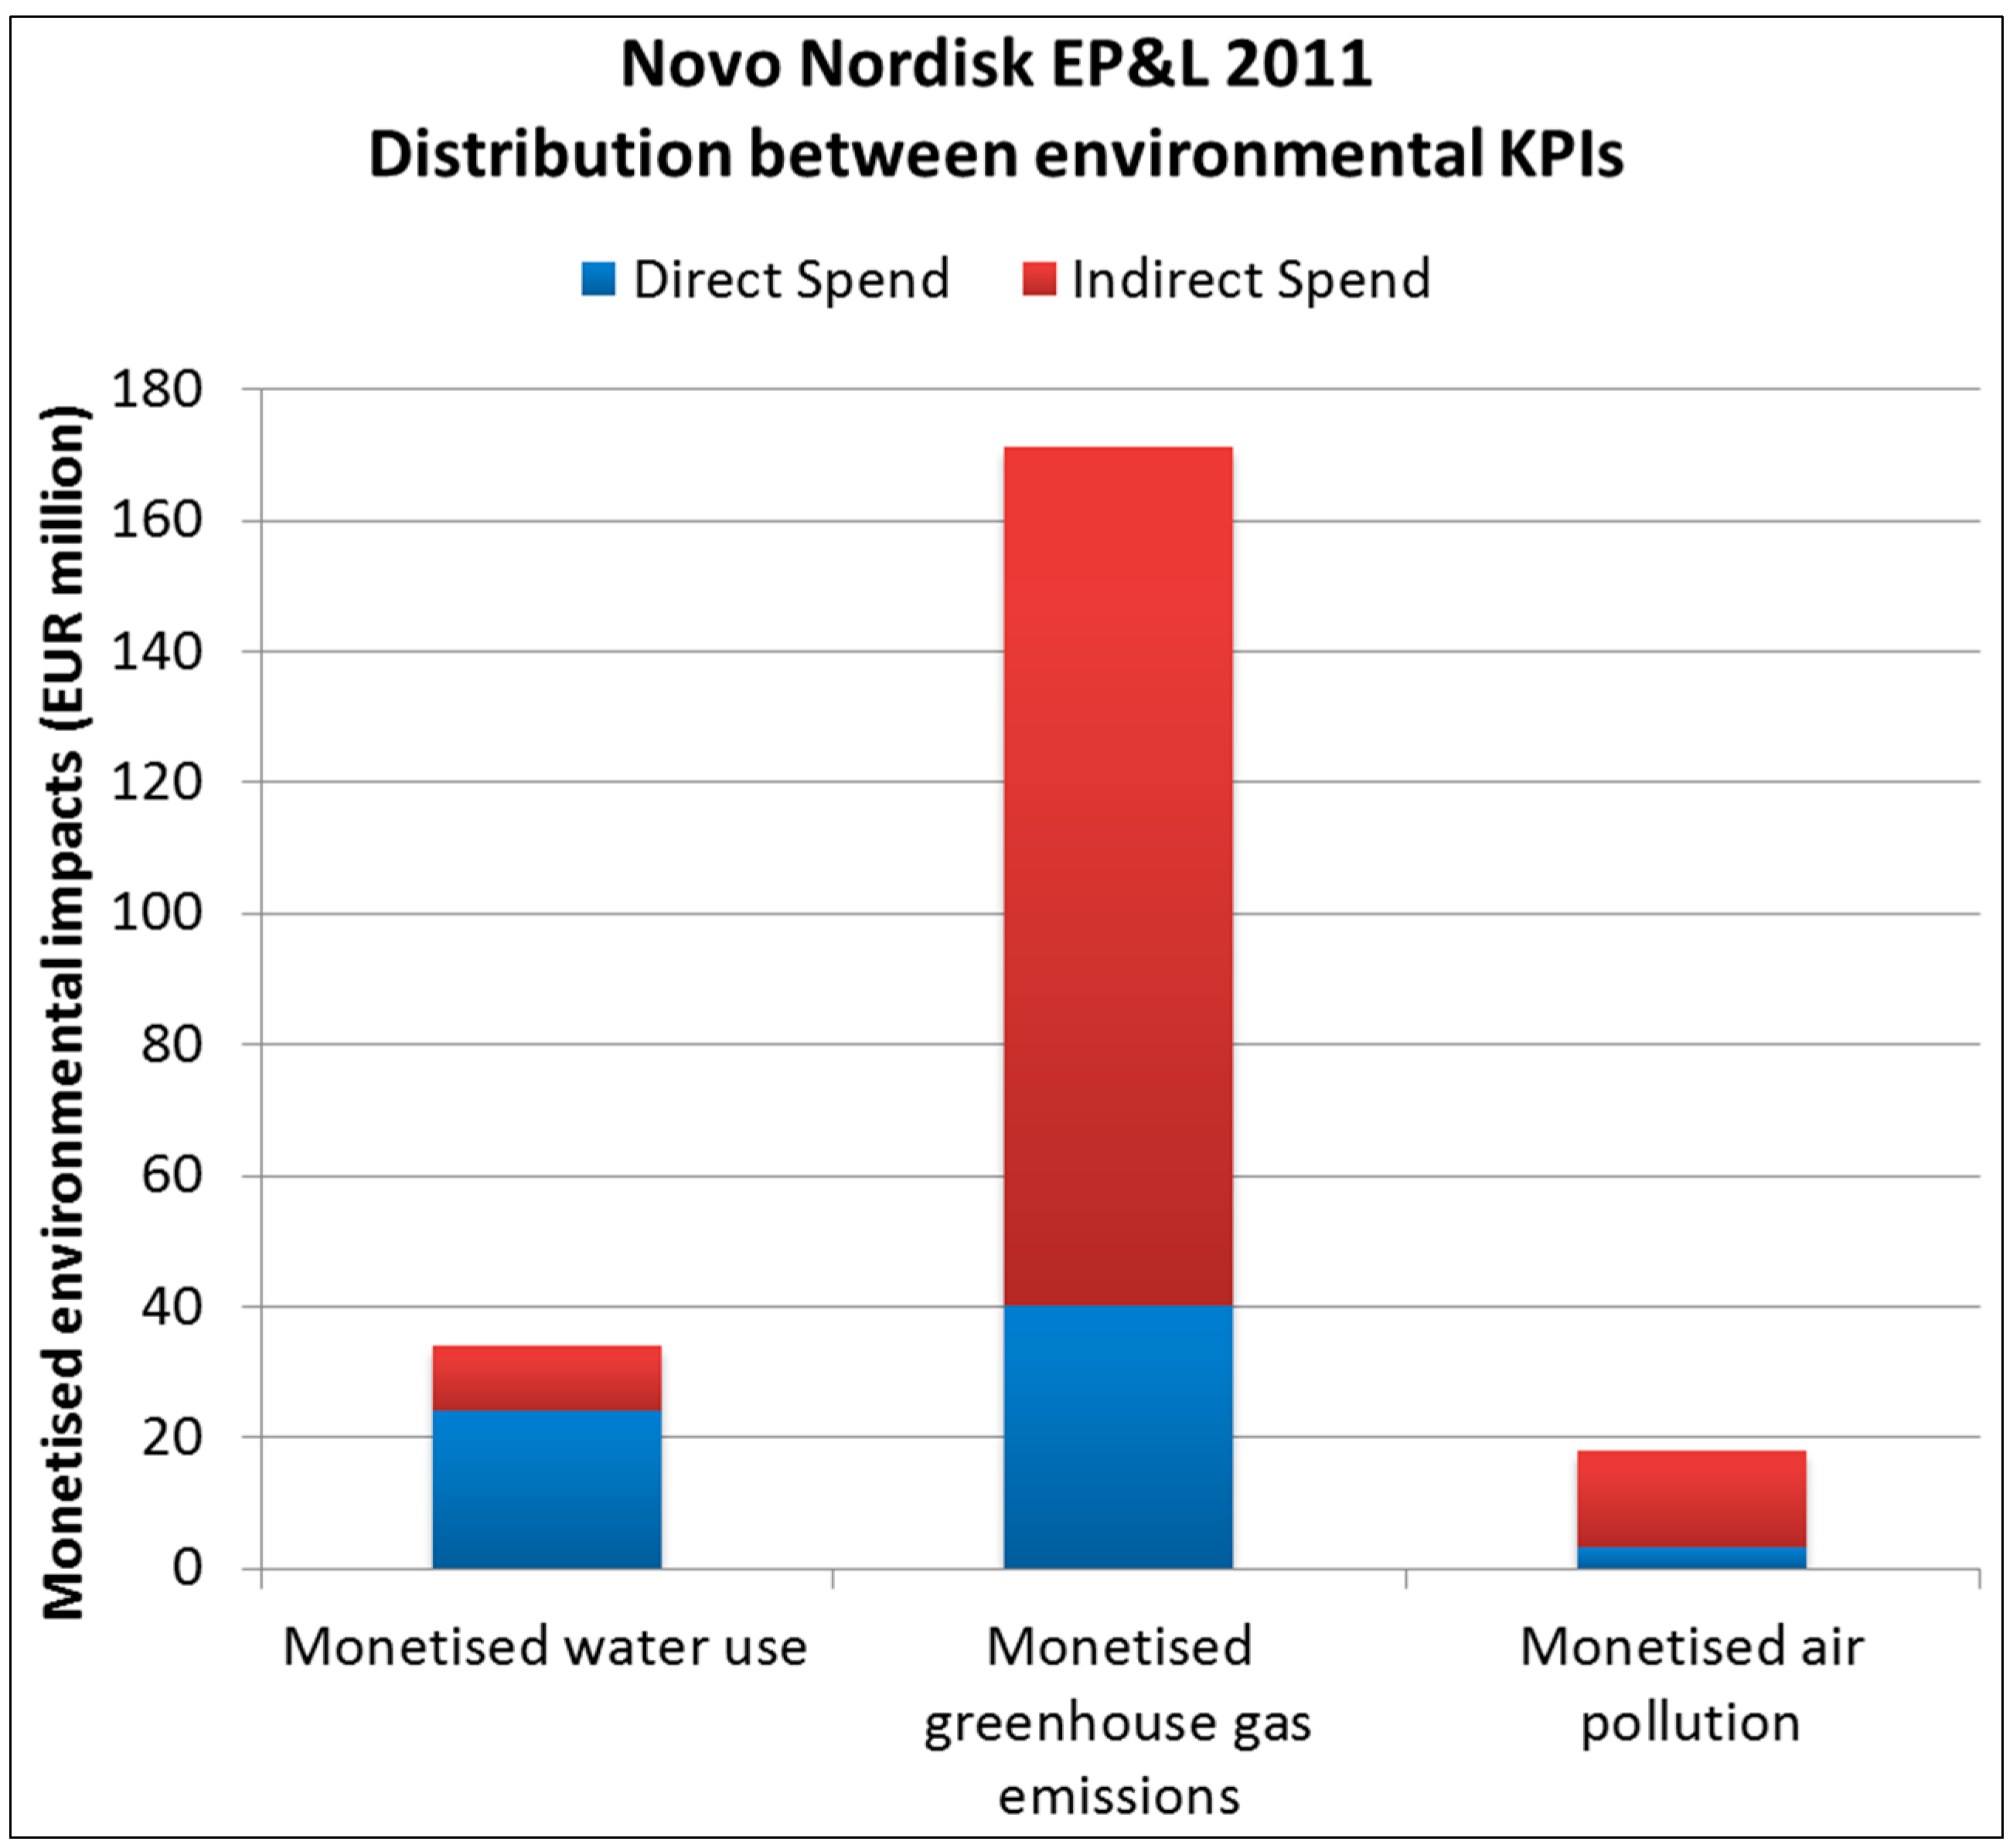
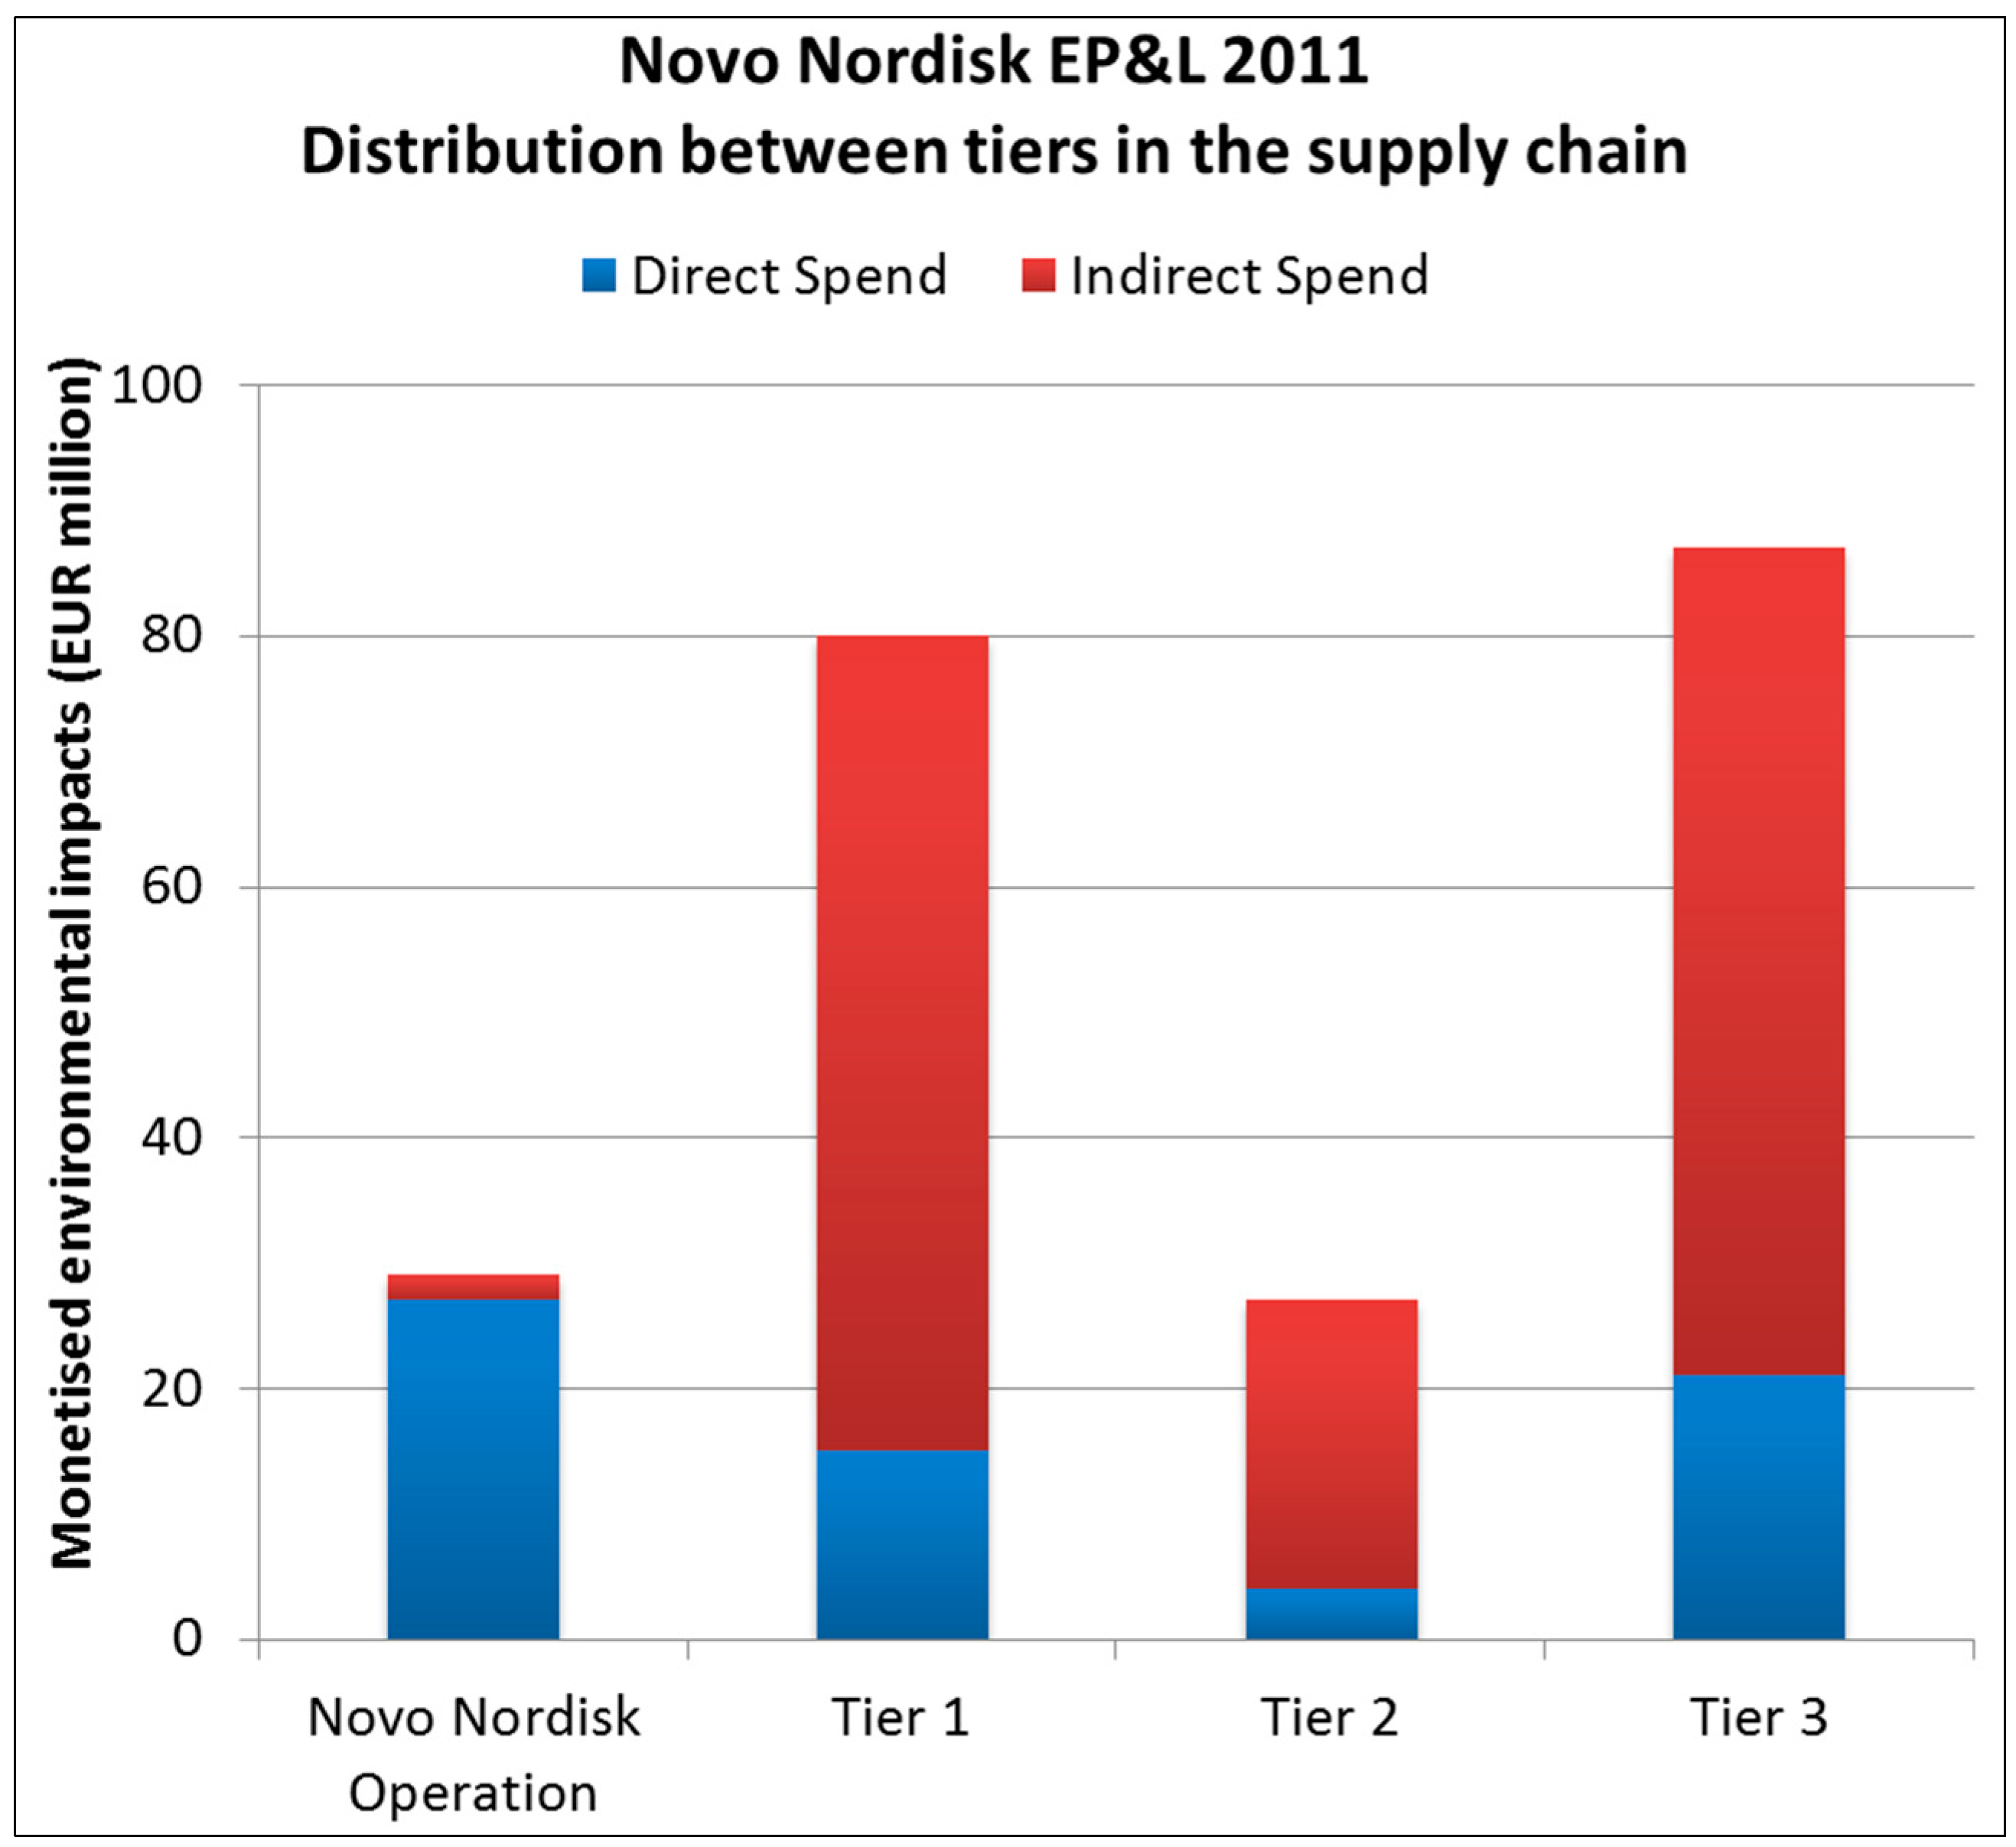
4.2. Case Study 2: Novo Nordisk Environmental Profit and Loss Account


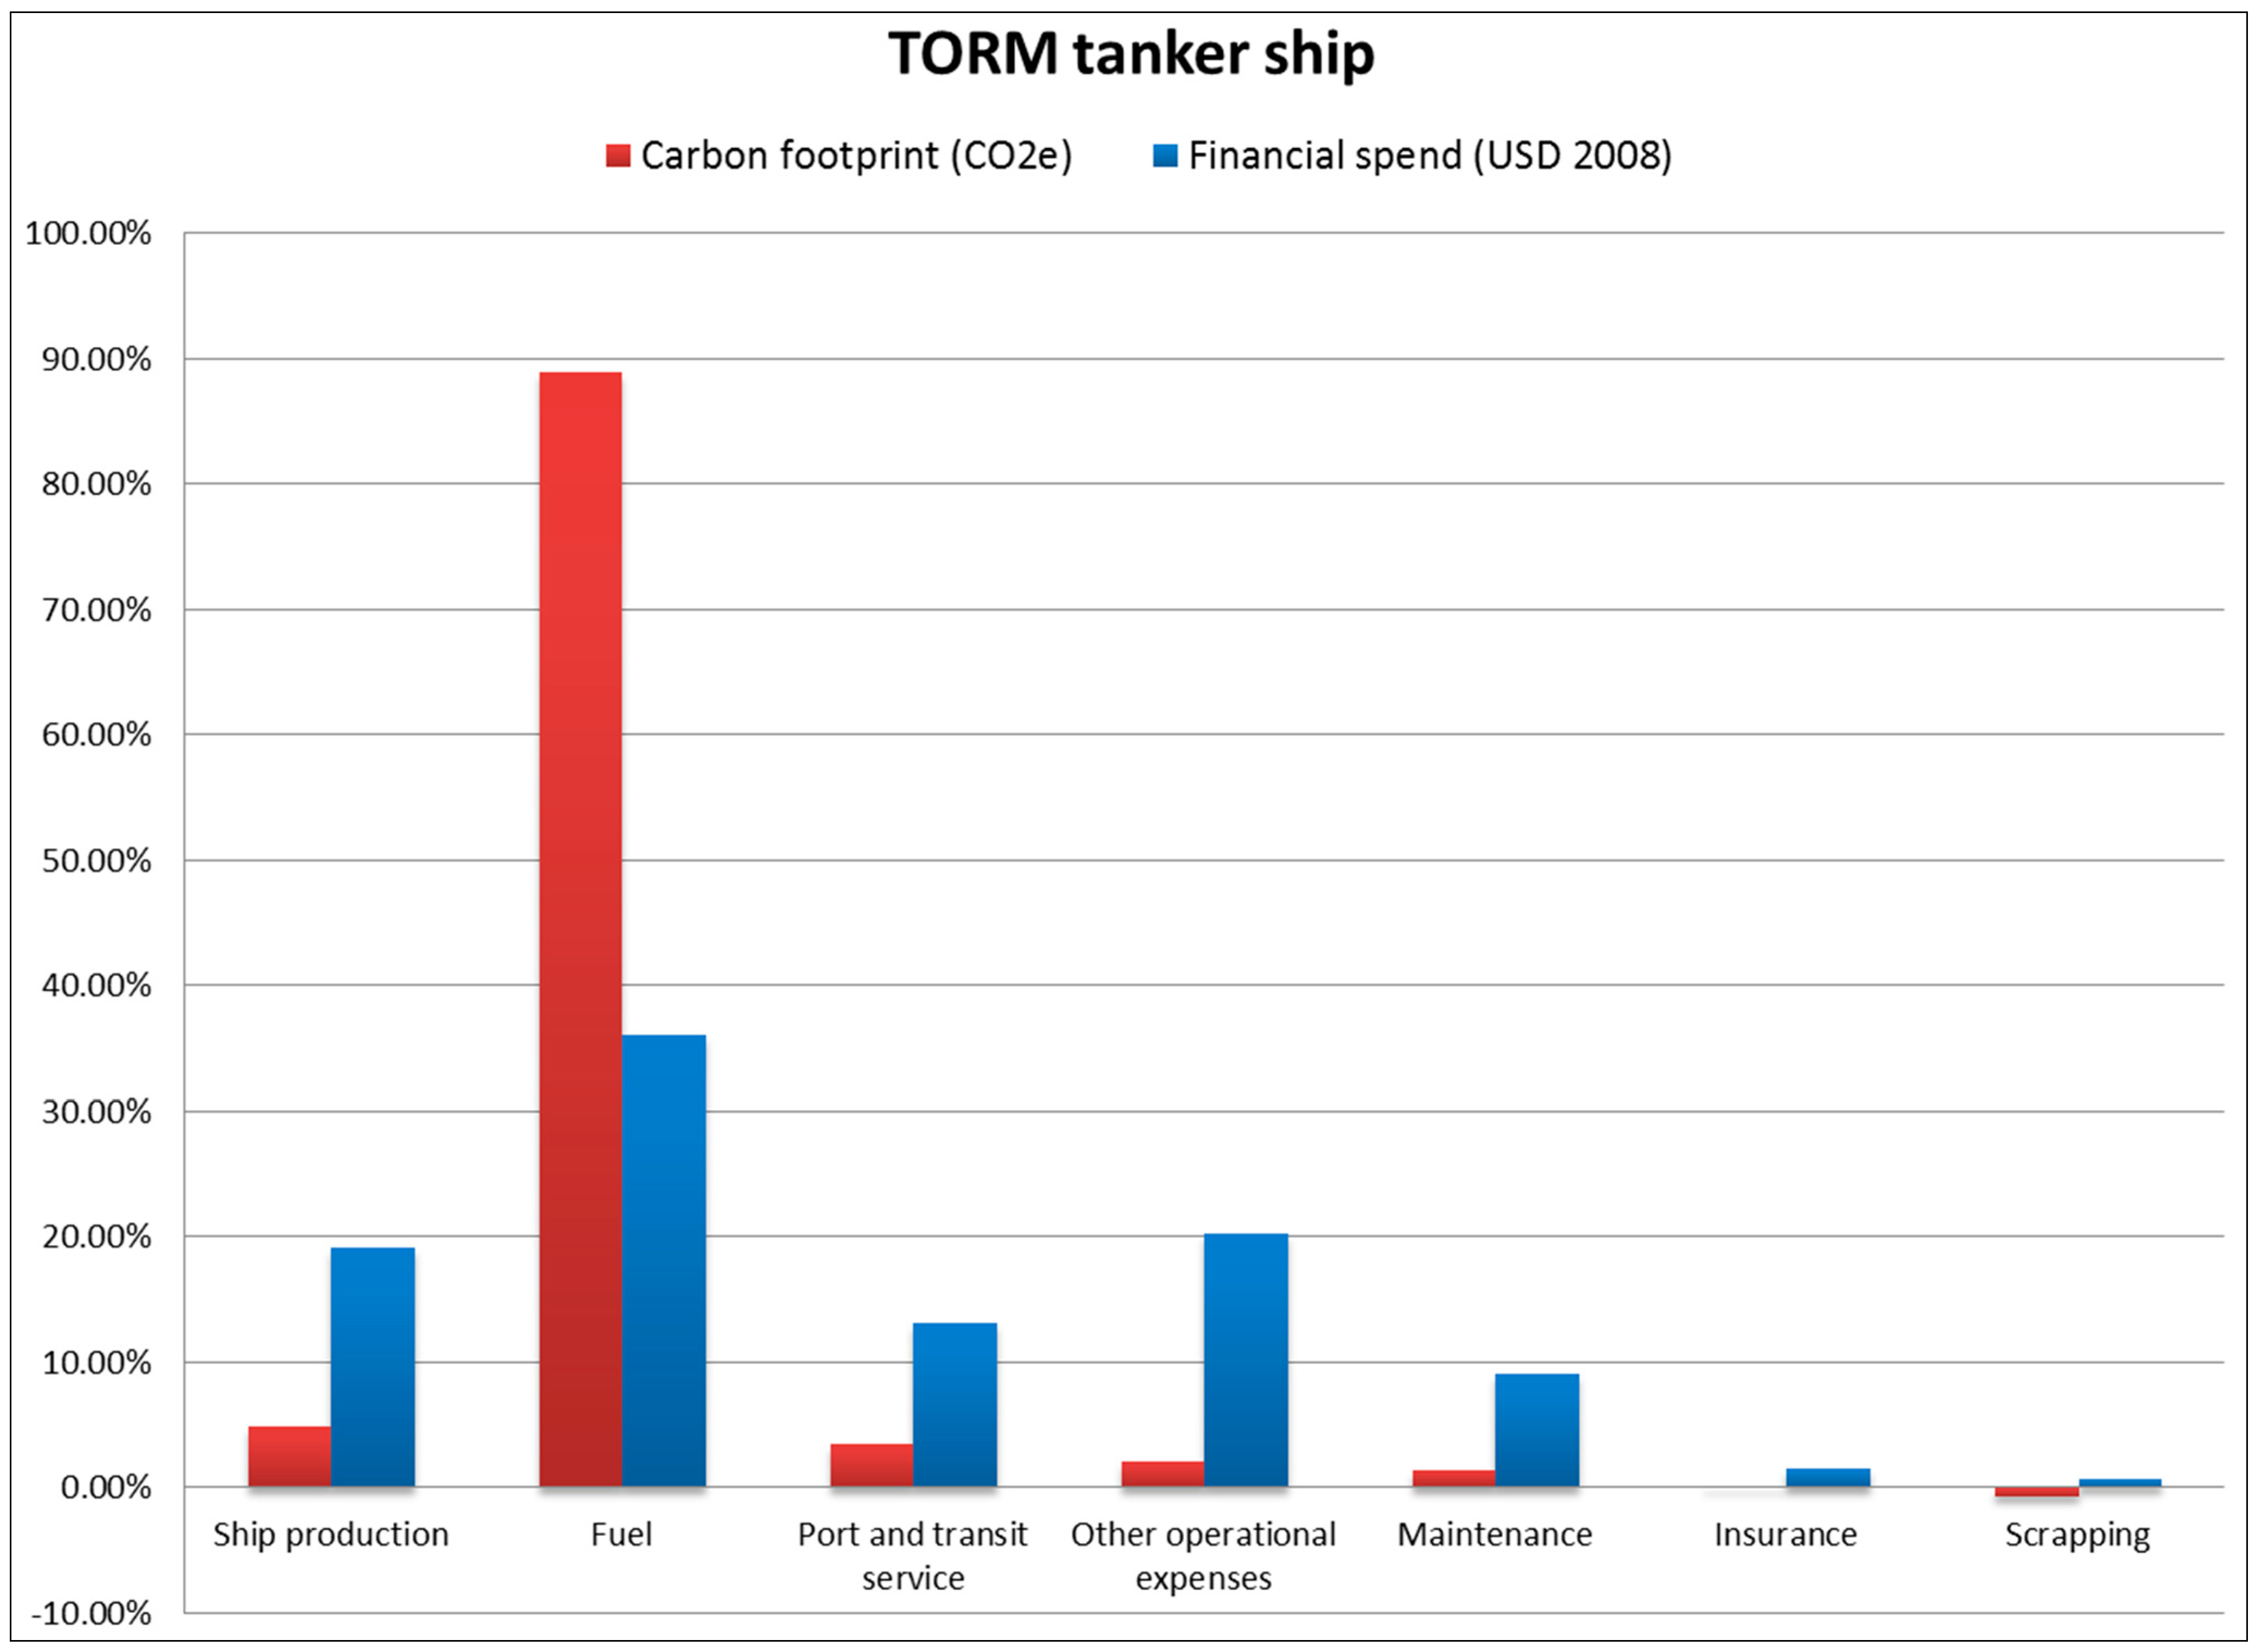
4.3. Case Study 3: Life Cycle Assessment of a Tanker Ship

5. Discussion
5.1. Uncertainty

5.2. Integrating Environmental Footprint Analysis with Strategic Actions
5.2.1. Impact Reduction Strategies
5.2.2. Integration with Green Supply Chain Management
6. Conclusions
RQ1: What Are the Strengths and Weaknesses of the EIO Approach?
- They should have a global scope, thus being multiregional to account for geographical differences.
- They should include the elementary flows needed to support what is of environmental concern.
- They should contain a wide range of both aggregated and disaggregated product groups/industry sectors in order to enable the best match with available data for the system being analysed.
RQ2: How Does Application of the EIO Approach Influence the Companies’ Environmental Agenda?
Acknowledgments
Author Contributions
Conflicts of Interest
References
- The Carbon Trust. Carbon Footprints in the Supply Chain: The Next Step for Business. Available online: http://www.carbontrust.com/resources/reports/footprinting/carbon-footprints-in-the-supply-chain-the-next-step-for-business (accessed on 28 April 2015).
- Huang, Y.A.; Lenzen, M.; Weber, C.L.; Murray, J.; Matthews, H.S. The role of input-output analysis for the screening of corporate carbon footprints. Econ. Syst. Res. 2009, 21, 217–242. [Google Scholar] [CrossRef]
- Larsen, H.N.; Solli, C.; Pettersena, J. Supply chain management—How can we reduce our energy/climate footprint? Energy Proc. 2012, 20, 354–363. [Google Scholar] [CrossRef]
- Junnila, S.I. Empirical comparison of process and economic input-output life cycle assessment in service industries. Environ. Sci. Technol. 2006, 40, 7070–7076. [Google Scholar] [CrossRef] [PubMed]
- Seuring, S.; Müller, M. From a literature review to a conceptual framework for sustainable supply chain management. J. Clean. Prod. 2008, 16, 1699–1710. [Google Scholar] [CrossRef]
- Kogg, B.; Mont, O. Environmental and social responsibility in supply chains: The practise of choice and inter-organisational management. Ecol. Econ. 2012, 83, 154–163. [Google Scholar] [CrossRef]
- Lenzen, M. An Outlook into a Possible Future of Footprint Research. J. Ind. Ecol. 2014, 18, 4–6. [Google Scholar] [CrossRef]
- Wiedmann, T. Editorial: Carbon footprint and input–output analysis—An introduction. Econ. Syst. Res. 2009, 21, 175–186. [Google Scholar] [CrossRef]
- Ewing, A.; Thabrew, L.; Perrone, D.; Abkowitz, M.; Hornberger, G. Insights on the use of hybrid life cycle assessment for environmental footprinting—A Case Study of an Inland Marine Freight Transportation Company. J. Ind. Ecol. 2011, 15, 937–950. [Google Scholar] [CrossRef]
- Matthews, H.S.; Small, M.J. Extending the boundaries of life-cycle assessment through environmental economic input-output models. J. Ind. Ecol. 2001, 4, 7–10. [Google Scholar] [CrossRef]
- Hendrickson, C.; Horvath, A.; Joshi, S.; Lave, L. Economic Input-Output Models for Environmental Life-Cycle Assessment. Environ. Sci. Technol. 1998, 32, 184–191. [Google Scholar] [CrossRef]
- Junnila, S. Life cycle management of energy-consuming products in companies using IO-LCA. Int. J. Life Cycle Assess. 2008, 13, 432–439. [Google Scholar] [CrossRef]
- Suh, S.; Lenzen, M.; Treloar, G.J.; Hondo, H.; Horvath, A.; Huppes, G.; Jolliet, O.; Klann, U.; Krewitt, W.; Moriguchi, Y.; et al. System boundary selection in life-cycle inventories using hybrid approaches. Environ. Sci. Technol. 2004, 38, 657–664. [Google Scholar] [CrossRef] [PubMed]
- Majeau-Bettez, G.; Strømman, A.H.; Hertwich, E.G. Evaluation of process- and input-output-based life cycle inventory data with regard to truncation and aggregation issues. Environ. Sci. Technol. 2011, 45, 10170–10177. [Google Scholar] [CrossRef] [PubMed]
- Lee, C.-H.; Ma, H.-W. Improving the integrated hybrid LCA in the upstream scope 3 emissions inventory analysis. Int. J. Life Cycle Assess. 2012, 18, 17–23. [Google Scholar] [CrossRef]
- Wiedmann, T.; Lenzen, M.; Barrett, J.R. Companies on the Scale—Comparing and Benchmarking the Sustainability Performance of Businesses. J. Ind. Ecol. 2009, 13, 361–383. [Google Scholar] [CrossRef]
- Suh, S.; Huppes, G. Missing inventory estimation tool using extended input-output analysis. Int. J. Life Cycle Assess. 2002, 7, 134–140. [Google Scholar] [CrossRef]
- Danish Regions. The Regions—in Brief. Available online: http://www.regioner.dk/in+english/publications+and+policy+papers/the+regions+in+denmark (accessed on 28 April 2015).
- Kjær, L.L.; Høst-madsen, N.K.; Skygebjerg, L.; Mikkelsen, K.D.; Jørgensen, R. Region Sjælland Klimaregnskab 2009–2011. Available online: http://www.niras.dk/temaer/klima/referencer/klimaregnskab-for-region-sjaelland-2009-11.aspx (accessed on 27 May 2015).
- Mikkelsen, K.D.; Madsen, N.K.H.; Szeler, A. Region Nordjylland Klimaregnskab 2007–2012. Available online: http://www.rn.dk/Om-Region-Nordjylland/KlimaRegion (accessed on 27 May 2015).
- Kjær, L.L.; Høst-Madsen, N.K.; Szeler, A.C.; Mikkelsen, K.D.; Jørgensen, R. Region Hovedstaden Klimaregnskab 2011. Available online: http://www.niras.dk/temaer/klima/klimaregnskab.aspx (accessed on 17 August 2015).
- Kjær, L.L.; Mikkelsen, K.D.; Madsen, N.K.H.; Schmidt, J.H. Metoderapport: Virksomheders klimaregnskab efter klimafodaftryksmetoden. Available online: http://lca-net.com/p/1867 (accessed on 27 May 2015).
- PPR/PUMA. PUMA’s Environmental Profit and Loss Account for the year ended 31 December 2010. Available online: http://glasaaward.org/wp-content/uploads/2014/01/EPL080212final.pdf (accessed on 27 May 2015).
- Høst-Madsen, N.K.; Damgaard, C.K.; Szeler, A.; Jørgensen, R.; McManamon, D.; Bullock, S.; Taylor, J.; Sireyjol, A.; Schmidt, J.H. Methodology report for Novo Nordisk’s environmental profit and loss account. Available online: http://www2.mst.dk/Udgiv/publications/2014/02/978-87-93178-03-8.pdf (accessed on 27 May 2015).
- Høst-Madsen, N.K.; Damgaard, C.K.; Szeler, A.; Jørgensen, R.; Mikkelsen, K.D.; McManamon, D.; Bullock, S.; Taylor, J.; Sireyjol, A.; Schmidt, J.H. Novo Nordisk’ s environmental profit and loss account. Available online: http://www2.mst.dk/Udgiv/publications/2014/02/978-87-93178-02-1.pdf (accessed on 27 May 2015).
- Novo Nordisk. Our Triple Bottom Line. Available online: http://www.novonordisk.com/sustainability/how-we-manage/the-triple-bottom-line.html (accessed on 27 May 2015).
- Armstrong, V.N. Vessel optimisation for low carbon shipping. Ocean. Eng. 2013, 73, 195–207. [Google Scholar] [CrossRef]
- Kjær, L.L.; Pagoropoulos, A.; Hauschild, M.; Birkved, M.; Schmidt, J.H.; McAloone, T.C. From LCC to LCA Using a Hybrid Input Output Model—A Maritime Case Study. Proc. CIRP 2015, 29, 474–479. [Google Scholar] [CrossRef] [Green Version]
- Leontief, W. Quantitative input-output relations in the economic system of the United States. Rev. Econ. Stat. 1936, 18, 105–125. [Google Scholar] [CrossRef]
- Hendrickson, C.T.; Lave, L.B.; Matthews, H.S. Environmental Life Cycle Assessment of Goods and Services: An. Input-Output Approach; Resources for the Future: Washington, DC, USA, 2006. [Google Scholar]
- Lenzen, M. Errors in Conventional and Input-Output—Based Life-Cycle Inventories. J. Ind. Ecol. 2001, 4, 127–148. [Google Scholar] [CrossRef]
- Minx, J.C.; Wiedmann, T.; Wood, R.; Peters, G.P.; Lenzen, M.; Owen, A.; Scott, K.; Barrett, J.; Hubacek, K.; Baiocchi, G.; et al. Input–Output Analysis and Carbon Footprinting: An Overview of Applications. Econ. Syst. Res. 2009, 21, 187–216. [Google Scholar] [CrossRef]
- Suh, S.; Nakamura, S. Five years in the area of input-output and hybrid LCA. Int. J. Life Cycle Assess. 2007, 12, 351–352. [Google Scholar] [CrossRef]
- Finnveden, G.; Hauschild, M.Z.; Ekvall, T.; Guinée, J.; Heijungs, R.; Hellweg, S.; Koehler, A.; Pennington, D.; Suh, S. Recent developments in Life Cycle Assessment. J. Environ. Manag. 2009, 91, 1–21. [Google Scholar] [CrossRef] [PubMed]
- Wiedmann, T. A review of recent multi-region input–output models used for consumption-based emission and resource accounting. Ecol. Econ. 2009, 69, 211–222. [Google Scholar] [CrossRef]
- Suh, S. Input-output and hybrid life cycle assessment. Int. J. Life Cycle Assess. 2003, 8, 257. [Google Scholar] [CrossRef]
- Deng, L.; Babbitt, C.W.; Williams, E.D. Economic-balance hybrid LCA extended with uncertainty analysis: Case study of a laptop computer. J. Clean. Prod. 2011, 19, 1198–1206. [Google Scholar] [CrossRef]
- Crawford, R.H. Validation of a hybrid life-cycle inventory analysis method. J. Environ. Manag. 2008, 88, 496–506. [Google Scholar] [CrossRef] [PubMed]
- Weidema, B.P.; Ekvall, T.; Heijungs, R. Guidelines for application of deepened and broadened LCA. Deliverable D18 of work package 5 of the CALCAS project. Available online: http://lca-net.com/publications/show/guidelines-applications-deepened-broadened-lca/ (accessed on 27 May 2015).
- FORWAST. Available online: http://forwast.brgm.fr/ (accessed on 1 June 2015).
- Hermansen, J.E.; Kristensen, I.S.; Nguyen, T.L.T.; Weidema, B.; Dalgaard, R.; Andersen, M.S. Pilotprojekt—Samfundsmæssig effekt af miljøforbedrende tiltag i jordbruget. Available online: http://lca-net.com/p/1312 (accessed on 28 April 2015).
- Schmidt, J.H.; Muños, I. The carbon footprint of Danish production and consumption—Literature review and model calculations. Available online: http://www.ens.dk/sites/ens.dk/files/klima-co2/klimaplan-2012/VidenOmKlima/_dk_carbon_footprint_20140305final.pdf (accessed on 28 April 2015).
- WBCSD. WRI Corporate value chain (scope 3) accounting and reporting standard—Supplement to the GHG Protocol Corporate Accounting and Reporting Standard. Available online: http://www.ghgprotocol.org/standards/scope-3-standard (accessed on 27 May 2015).
- CDP. Driving sustainable economies. Available online: https://www.cdp.net/en-US/Pages/HomePage.aspx (accessed on 28 April 2015).
- PPR. An Expert Review of the Environmental Profit and Loss Account—What the Experts say: The Way Forward. Available online: http://www.kering.com/sites/default/files/e-pl-review_final-for_publicationwebsitefinal_final_1.pdf (accessed on 27 May 2015).
- Suh, S. Are services better for climate change? Environ. Sci. Technol. 2006, 40, 6555–6560. [Google Scholar] [CrossRef] [PubMed]
- Jira, C.F.; Toffel, M.W. Engaging Supply Chains in Climate Change. Manuf. Serv. Oper. Manag. 2013, 15, 559–577. [Google Scholar] [CrossRef]
- Plambeck, E.L. Reducing greenhouse gas emissions through operations and supply chain management. Energy Econ. 2012, 34, S64–S74. [Google Scholar] [CrossRef]
- Wood, R.; Stadler, K.; Bulavskaya, T.; Lutter, S.; Giljum, S.; de Koning, A.; Kuenen, J.; Schütz, H.; Acosta-fernández, J.; Usubiaga, A.; et al. Global sustainability accounting—Developing EXIOBASE for multi-regional footprint analysis. Sustainability 2015, 7, 138–163. [Google Scholar] [CrossRef] [Green Version]
- Schmidt, J.H. Full Integration of LCA with Other Assessment Tools—New Application Areas and Harmonized Modelling Approaches. In Proceedings of the SETAC Europe 24th Annual Meeting, Basel, Switzerland, 11–15 May 2014; Available online: http://lca-net.com/publications/show/full-integration-lca-assessment-tools-new-application-areas-harmonized-modelling-approaches/ (accessed on 3 June 2015).
© 2015 by the authors; licensee MDPI, Basel, Switzerland. This article is an open access article distributed under the terms and conditions of the Creative Commons Attribution license (http://creativecommons.org/licenses/by/4.0/).
Share and Cite
Kjaer, L.L.; Høst-Madsen, N.K.; Schmidt, J.H.; McAloone, T.C. Application of Environmental Input-Output Analysis for Corporate and Product Environmental Footprints—Learnings from Three Cases. Sustainability 2015, 7, 11438-11461. https://doi.org/10.3390/su70911438
Kjaer LL, Høst-Madsen NK, Schmidt JH, McAloone TC. Application of Environmental Input-Output Analysis for Corporate and Product Environmental Footprints—Learnings from Three Cases. Sustainability. 2015; 7(9):11438-11461. https://doi.org/10.3390/su70911438
Chicago/Turabian StyleKjaer, Louise Laumann, Niels Karim Høst-Madsen, Jannick H. Schmidt, and Tim C. McAloone. 2015. "Application of Environmental Input-Output Analysis for Corporate and Product Environmental Footprints—Learnings from Three Cases" Sustainability 7, no. 9: 11438-11461. https://doi.org/10.3390/su70911438