Article

Factor Decomposition Analysis of Energy-Related CO2 Emissions in Tianjin, China

1
School of Environmental Science and Engineering, Tianjin University, Tianjin 300072, China
2
Department of Environmental Science and Engineering, Nankai University Binhai College, Tianjin 300270, China
3
Tianjin Academy of Environmental Sciences, Tianjin 300191, China
*
Author to whom correspondence should be addressed.
Sustainability 2015, 7(8), 9973-9988; https://doi.org/10.3390/su7089973
Submission received: 4 May 2015 / Revised: 8 July 2015 / Accepted: 20 July 2015 / Published: 24 July 2015

Abstract

:
Tianjin is the largest coastal city in northern China with rapid economic development and urbanization. Energy-related CO2 emissions from Tianjin’s production and household sectors during 1995–2012 were calculated according to the default carbon-emission coefficients provided by the Intergovernmental Panel on Climate Change. We decomposed the changes in CO2 emissions resulting from 12 causal factors based on the method of Logarithmic Mean Divisia Index. The examined factors were divided into four types of effects: energy intensity effect, structure effect, activity intensity effect, scale effect and the various influencing factors imposed differential impacts on CO2 emissions. The decomposition outcomes indicate that per capita GDP and population scale are the dominant positive driving factors behind the growth in CO2 emissions for all sectors, while the energy intensity of the production sector is the main contributor to dampen the CO2 emissions increment, and the contributions from industry structure and energy structure need further enhancement. The analysis results reveal the reasons for CO2 emission changes in Tianjin and provide a solid basis upon which policy makers may propose emission reduction measures and approaches for the implementation of sustainable development strategies.

1. Introduction

Climate change is one of the most urgent global environmental challenges of the present time. China has become the utmost primary energy consumer as well as the utmost CO2 emitter all over the world. In 2012, China consumed 2735 million tons of oil equivalent (Mtoe) of primary energy and the amount of China’s CO2 emissions reached 9.21 billion tons [1,2]. The combustion of fossil fuels contributes not only to CO2 emissions, but also to air pollutants such as SO2 and NOx [3]. At the Copenhagen Climate Change Conference in 2009, the Chinese government made a commitment to the world that China would reduce its carbon emissions per unit GDP in 2020 by 40%–45% compared with 2005 levels [4]. China’s FYP12 also includes the goal of a 17% carbon intensity (carbon emissions per unit of GDP) reduction from the 2010 level. These commitments indicate a shift in emphasis in China’s policy concerning an increased balance between the need for development and the requirements of the environment.
Approximately half of the Chinese population now lives in cities, particularly in metropolises such as Beijing and Tianjin [5]. The 35 largest cities in China, which contain 18% of the population, contribute 40% of China’s energy uses and CO2 emissions [6]. The impact of such cities imposing on energy use and associated emissions is becoming increasingly severe. Based on current knowledge of emission status, understanding the driving forces behind the increase in CO2 emissions in cities is the foundation for the presentation of a comprehensive analysis on future emissions, and it is essential to the formulation of policies for the mitigation of the effects of climate change and fulfilment of applicable targets. The relative contributions of socioeconomic factors such as population, economic growth, energy structure, and energy intensity to the change in CO2 emissions in China have been analyzed [7,8,9,10,11,12]. The objectives of this study are to quantify and examine the driving forces behind CO2 emissions in Tianjin by applying the extended Logarithmic Mean Divisia Index (LMDI) decomposition model and, based on this, to make policy recommendations to help achieve the stated emission reduction targets.
Tianjin, one of the four municipalities directly under the Central Government of China, is not only an economic center in the north of China but also a well-known international harbor. In 2012, Tianjin covered an area of 1.19 × 10⁴ km2 and supported a population of 14.13 million permanent residents, which generated an overall GDP of 12,893.9 billion RMB (approximately 2.48% of the total GDP of China) and a per capita GDP that exceeded 10,000 USD. The total energy consumption of Tianjin in 2012 was 79.27 million tons of standard coal [5]. The proportion of fossil fuels in the primary energy consumption structure were approximately 58.1%, 36.9%, and 5% for coal, crude oil, and natural gas, respectively [13]. According to the “Low-Carbon City Pilot Scheme of Tianjin (2012)”, in 2010, the total net emission of greenhouse gases (GHGs) in Tianjin was approximately 0.13 billion tons of CDE (carbon dioxide equivalent), of which 95.5% was CO2. As one of China’s pilot low-carbon cities, Tianjin is facing major pressure to discover new ways in which to reduce CO2 emissions.
As for the contribution in this paper, two aspects can be achieved. First, in consideration of the methodology, this paper extends the common LMDI decomposition analysis in CO2 emission changes from both production and household sectors with nine types of energy, and examines the effects of 12 causal factors simultaneously, which are divided into energy intensity effect, structure effect, activity intensity effect, and scale effect. Second, our findings will help in the understanding of how CO2 emissions are affected by a number of driving forces, and allow us to design strategies and recommend policies for the reduction of CO2 emissions in Tianjin, which will favor energy saving, reductions of air pollutants, cost reductions, and policy efficiency improvements.
The rest of this paper is organized as follows. In Section 2, the LMDI approach and the data used in our analysis are described. In Section 3, we present the results of the LMDI decomposition analysis. Section 4 concludes the paper with our policy suggestions.

2. Methodology and Data

2.1. The Logarithmic Mean Divisia Index (LMDI) Decomposition Model

Researchers have developed many methods to quantify the effects of different factors that contribute to changes in energy consumption and carbon emissions, i.e., the structural decomposition analysis (SDA) and the index decomposition analysis (IDA), are widely used as analytical tools for supporting policymaking on national energy and environmental issues [14,15,16,17]. The SDA approach uses information from input-output tables in specific years, whereas IDA, an improvement of the Kaya identity, uses aggregate data at the sector level [7]. However, the SDA can only be performed additively because of the dependence on the input–output tables, which leads to some constraints in the extensive use of SDA [18]. The IDA approach requires lower data than SDA, but it involves a less detailed analysis and allows for assessing the direct impacts only, which limits policy decisions to the sectoral or product scale [15]. Compared to the SDA approach, the application of IDA proves itself more widely on the city scale [16]. However, in this paper, we employ the IDA model because of the lack of time series input–output tables and sectoral energy use data in an input–output format. There are several types of IDA, which can be categorized broadly as Laspeyres IDA and Divisia IDA, and the latter one primarily includes the arithmetic mean Divisia index (AMDI) and log mean Divisia index (LMDI). However, there are several reasons for selecting the LMDI method, introduced by Ang and Choi [19], to explore the driving factors behind the energy-related CO2 emissions in Tianjin: (1) sound theoretical foundation, (2) adaptability, (3) path independency, (4) ease of use, (5) ease of interpretation of results, and (6) ability for solving zero-value problems [14,17,20,21]. Further details regarding the LMDI approach are given by Ang [22].
The LMDI method has both additive and multiplicative forms. In this study, the additive form of time-series analysis was applied to accommodate both the decomposition of the individual sectors in assessing the influence of each, and the subsequent aggregation for establishing the total change. Recently, numerous studies have used LMDI methods for analyzing the factors driving the increases in energy use and GHG at different levels (national, regional, megalopolis, and industrial). However, in most existing research, only a limited number of driving factors (usually 3–7) are generally analyzed, which belong to the scale, structure, and intensity effects [9,23,24,25,26,27,28,29], some of the driving factors analyzed by this paper, such as urban rate, the residents’ consumption expenditure and disposable income are rare in the existing literature. The principle purpose of this decomposition analysis is to analyze the 12 causal factors behind the changes in CO2 emissions in all of the energy end-use sectors from 1995–2012. However, the results of an LMDI application may also provide the basis for forecasting or scenario analysis of future evolution [30,31,32].
Referring to the previous LMDI approach [22], the decomposition schemes applied to the CO2 emissions from each sector can be expressed by the following Equation (1):
C = i = 1 7 j = 1 9 C i j = i = 1 4 j = 1 9 C i j F i j F i j F i F i Y i Y i Y Y P P + i = 5 j = 1 9 C i j F i j F i j F i F i V N V N P P + i = 6 j = 1 9 C i j F i j F i j F i F i T U I T U I U P U P P P + i = 7 j = 1 9 C i j F i j F i j F i F i T R I T R I
where C denotes the total energy-related CO2 emissions; index i = 1, 2, …, 7 denotes diverse sectors, which are primary industry, industry, construction, tertiary industry, transport, urban household and rural household, respectively; index j = 1, 2, …, 9 represents different types of energy, which are coal, coke, crude oil, gasoline, kerosene, diesel, fuel oil, natural gas, and liquefied petroleum gas, respectively; Cij refers to the CO2 emissions of energy type j of sector i; Fij is the consumption of energy j of sector i, and Fi represents the total energy consumption of sector i; Yi is the economic output of sector i, and Y denotes the total economic output; P denotes the permanent residents population; VN represents the number of vehicles; TUI is the total disposable income of urban residents; UP refers to the urban population; TRI denotes the total consumption expenditure of rural residents.
Equation (1) can then be transformed as:
C = i = 1 7 j = 1 9 C i j = i = 1 4 j = 1 9 C I i j E S i j E I i I S i G P C P + i = 5 j = 1 9 C I i j E S i j V E I V N C P + i = 6 j = 1 9 C I i j E S i j U E I U I P C U R P + i = 7 j = 1 9 C I i j E S i j R E I TRI
For clarity in presentation, we introduce eleven intermediate terms: CIij, ESij, EIi, ISi, GPC, VEI, VNC, UEI, UIPC, UR and REI to represent the eleven terms in Equation (1), respectively. CIijCij/Fij, represents the carbon emission coefficient for energy type j of sector i, ESijFij/Fi defines the energy mix of sector i, EIiFi/Y represents the energy intensity of sector i, ISiYi/Y defines the activity mix of sector i, GPC ≡ Y/P refers to the per capita of GDP, VEIFi/VN reflects the vehicle energy intensity, VNCVN/P denotes the per capita number of vehicles, UEIFi/TUI refers to the energy consumption intensity of urban residents, UIPC ≡ TUI/UP defines the per capita disposable income of urban residents, UR ≡ UP/P reflects the urbanization rate, REIFi/TRI refers to the energy consumption intensity of rural residents.
The time derivative was taken on both sides of Equation (2) and, therefore, the instantaneous increase in the rate of CO2 emissions is given as follows:
d C d t = i = 1 4 j = 1 9 1 C I i j d C I i j d t C I i j E S i j E I i I S i G P C P + + i = 1 4 j = 1 9 C i j E S i j E I i I S i G P C 1 P d P d t P ) + ( i = 5 j = 1 9 1 C I i j d C I i j d t C I i j E S i j V E I V N C P + + i = 5 j = 1 9 C I i j E S i j V E I V N C 1 P d P d t P ) + ( i = 6 j = 1 9 1 C I i j d C I i j d t C I i j E S i j U E I U I P C U R P + + i = 6 j = 1 9 C I i j E S i j U E I U I P C U R 1 P d P d t P ) + ( i = 7 j = 1 9 1 C I i j d C I i j d t C I i j E S i j R E I T R I + + i = 7 j = 1 9 C I i j E S i j R E I 1 T R I d T R I d t T R I )
We define Wij = Cij and then:
0 T C d ln C d t d t = i = 1 4 j = 1 9 0 T W i j ( d ln C I i j d t + d ln E S i j d t + d ln E I i d t + d ln I S i d t + d ln G P C d t + d ln P d t ) d t + i = 5 j = 1 9 0 T W i j ( d ln C I i j d t                    + d ln E S i j d t + d ln V E I d t + d ln V N C d t + d ln P d t ) d t + i = 6 j = 1 9 0 T W i j ( dln C I i j d t + dln E S i j d t + dln U E I d t + dln U I P C d t                    + dln U R d t + dln P d t ) d t + i = 7 j = 1 9 0 T W i j ( dln C I i j d t + dln E S i j d t + dln R E I d t + dln T R I d t ) d t
C T - C 0 = i = 1 7 j = 1 9 W i j ( t * ) ln C I i j , T C I i j , 0 + i = 1 7 j = 1 9 W i j ( t * ) ln E S i j , T E S i j , 0 + i = 1 4 j = 1 9 W i j ( t * ) ln E I i j , T E I i j , 0 + i = 1 4 j = 1 9 W i j ( t * ) ln I S i j , T I S i j , 0             + i = 1 4 j =1 9 W i j ( t * ) ln G P C T G P C 0 + i = 1 6 j = 1 9 W i j ( t * ) ln P T P 0 + i = 5 j = 1 9 W i j ( t * ) ln V E I T V E I 0 + i = 5 j = 1 9 W i j ( t * ) ln V N C T V N C 0             +  i = 6 j = 1 9 W i j ( t * ) ln U E I T U E I 0 + i = 6 j = 1 9 W i j ( t * ) ln U I P C T U I P C 0 + i = 6 j = 1 9 W i j ( t * ) ln U R T U R 0             + i = 7 j = 1 9 W i j ( t * ) ln R E I T R E I 0 + i = 7 j = 1 9 W i j ( t * ) ln T R I T T R I 0
where Wij (t*) is a weight function given by Wij = Cij at point t* ∈ [0,T], and subscripts T and 0 refer to the target and base years, respectively. One way in which to obtain the approximate value of Wij (t*) is to use the LMDI method, which is able to address zero values in the dataset and also leaves no residual terms. The logarithmic mean of two positive numbers is defined as:
L ( x , y ) = { ( x y ) / ( ln x ln y ) , x y x , x = y 0 , x = y = 0
W i j ( t * ) = C i j , T C i j , 0 ( ln C i j , T ln C i j , 0 )
Therefore, Equation (5) can be rewritten as below:
Δ C t o t = C T - C 0 = Δ C I + Δ E S + Δ E I + Δ I S + Δ G P C + Δ P + Δ V E I + Δ V N C + Δ U E I + Δ U I P C + Δ U R + Δ R E I + Δ T R I
where Δ C tot is the change of CO2 emissions in Tianjin between base year 0 and target year t; Δ C I represents the emissions coefficient effect, the value of which is zero because the 1995–2012 period is a relatively short term, and we define the carbon emission coefficient as a constant; Δ E S denotes the energy structure of all sectors; Δ E I refers to the energy intensity effect of the production sectors, including primary industry, industry, construction, and tertiary industry; Δ I S reflects the economic structure effect of the production sectors; Δ G P C and Δ U I P C represent the effects of per capita GDP and disposable income per urban resident, respectively; Δ V E I , Δ U E I , and Δ R E I reflect the effects of vehicle energy intensity and of energy consumption intensity of urban and rural residents, respectively; Δ V N C refers to the effect of vehicle numbers per capita; Δ P is the total population effect; Δ U R reflects the urbanization effect; and Δ T R I denotes the effects of the total consumption expenditure of rural residents.

2.2. Data Sources

With regard to the availability of data, local sources were used to obtain the data required for this analysis. The data spanning 1995–2012 used in the analysis were collected from various issues of the Tianjin Statistical Yearbook and China Energy Statistical Yearbook published annually by the National Bureau of Statistics (NBS); and authors’ calculation. The volume of energy sources consumed by primary industry, industry, construction, tertiary industry, transport, and urban and rural residents in Tianjin was obtained directly from Tianjin’s Energy Balance Table in the China Energy Statistical Yearbooks (NBSC, 1996–2013) and was converted into coal equivalents (tce) on the basis of the standard coal-equivalent coefficients for different types of energy, which were also obtained from the China Energy Statistical Yearbook. The energy-related CO2 emissions were estimated by applying the emission factor approach of the Intergovernmental Panel on Climate Change (2006) [33], which is currently the most widely used method. The GDP data in this paper were taken from the Tianjin Statistical Yearbook and given as 108 yuan in constant 1995 price (RMB). Other data were all extracted from the Tianjin Statistical Yearbook.

3. Results and Discussion

From 1995 to 2012, with an annual growth rate of 13.97%, which is much higher than the national average, Tianjin’s GDP has increased from 93.20 billion RMB to 857.59 billion RMB (in 1995 constant price). Meanwhile, energy-related CO2 emission almost kept increasing during the study period except year 1996, 1999, 2001 and 2003; the total energy-related CO2 emissions have grown 36.93 million tons, with a total increase rate of 103.01% and a 4.62% annual increase rate on average. The CO2 emissions were decomposed yearly during 1995–2012 depending on the LMDI method outlined in Section 2. The effective values of the impact factors for CO2 emission changes obtained from the decomposition analysis are listed in Table 1. The decomposition outcomes indicate that various influencing factors impose differential effects on CO2 emissions, and the accumulation of effects from factors reducing emissions is more than offset by the effects of the driving factors increasing emissions, therefore bringing about a substantial increment in total energy-related CO2 emissions.
According to the characteristics of each type of driving factor, the 12 factors were divided into four types: energy intensity effect (ΔEI, ΔVEI, ΔUEI and ΔREI), structure effect (ΔES, ΔIS, and ΔURI), activity intensity effect (ΔGPC, ΔUIPC, and ΔVNC), and scale effect (ΔP and ΔTRI), the growth rate of Tianjin’s energy-related CO2 emissions and each type of effect’s contribution are shown in Figure 1.
Table 1. Decomposition of Tianjin’s energy-related CO2 emission changes (1995–2012).
Time PeriodΔEIΔVEIΔUEIΔREIΔESΔISΔURΔGPCΔUIPCΔVNCΔPΔTRIΔCtot
1995–1996−7.27−0.16−0.660.37−0.04−1.110.013.610.510.490.290.04−3.95
1996–1997−1.930.27−0.550.240.18−0.450.022.480.270.400.260.011.21
1997–1998−1.500.65−1.08−0.200.24−0.810.023.360.190.170.080.021.16
1998–1999−3.600.24−0.04−0.01−0.17−0.030.011.980.170.100.250.05−1.04
1999–2000−4.990.50−0.11−0.07−0.200.340.056.810.310.421.950.065.06
2000–2001−2.890.10−0.11−0.03−0.17−0.080.012.060.130.020.200.12−0.64
2001–2002−1.15−0.62−0.06−0.08−0.74−0.260.002.170.091.180.040.020.61
2002–2003−10.34−0.86−0.22−0.040.930.490.043.980.131.470.290.03−4.10
2003–2004−0.96−0.33−0.23−0.070.191.390.015.980.250.641.200.128.19
2004–2005−0.87−0.06−0.03−0.04−0.170.390.012.880.160.180.820.063.32
2005–2006−2.26−0.02−0.20−0.040.090.140.035.620.270.442.390.096.55
2006–2007−1.34−0.27−0.02−0.010.310.070.057.200.410.251.060.157.86
2007–2008−8.04−0.11−0.14−0.050.230.440.046.380.600.402.490.102.34
2008–2009−1.05−0.27−0.060.02−0.73−1.580.064.350.350.640.950.132.81
2009–2010−1.27−0.32−0.11−0.09−0.38−0.930.052.040.270.371.400.071.10
2010–2011−3.58−0.77−0.19−0.02−0.18−0.090.124.251.000.871.870.273.55
2011–2012−2.49−0.45−0.04−0.01−0.60−0.380.153.190.800.222.360.172.92
1995–2012−55.50−2.49−3.86−0.14−1.20−2.460.6668.355.938.2617.891.5036.93
a Unit: Million tons; b Negative values indicate decreasing CO2 emissions.
Figure 1. Growth rate of Tianjin’s energy-related CO2 emissions and each type of effect’s contribution degree.
Sustainability 07 09973 g001

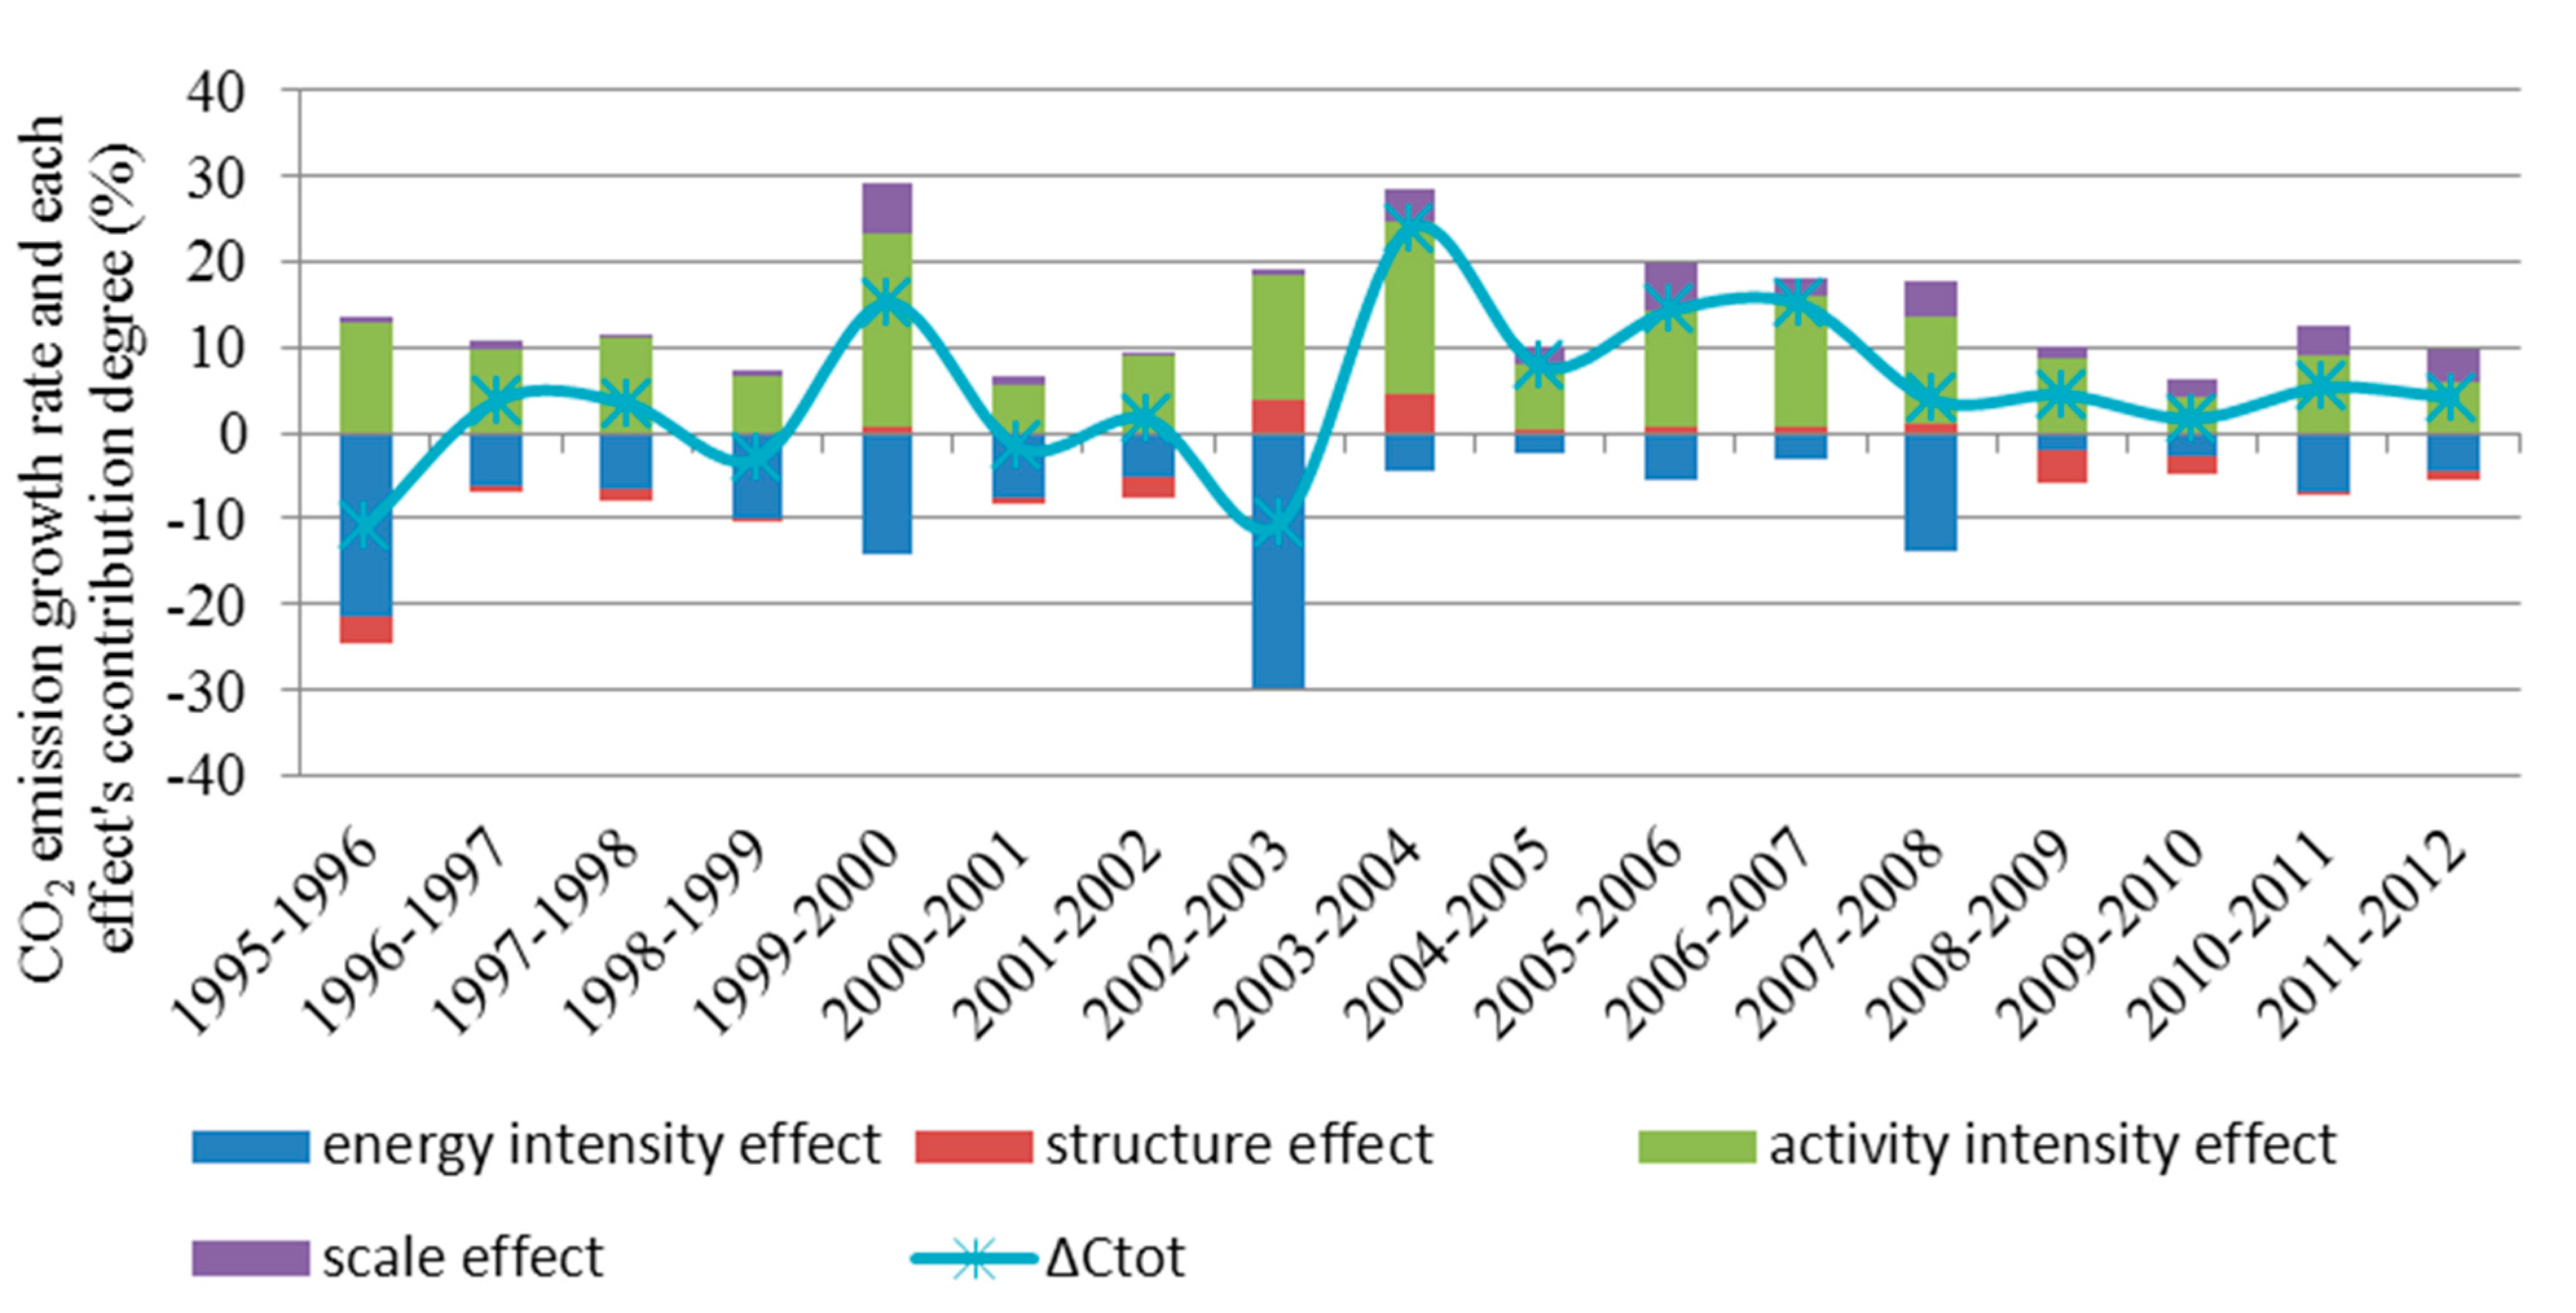
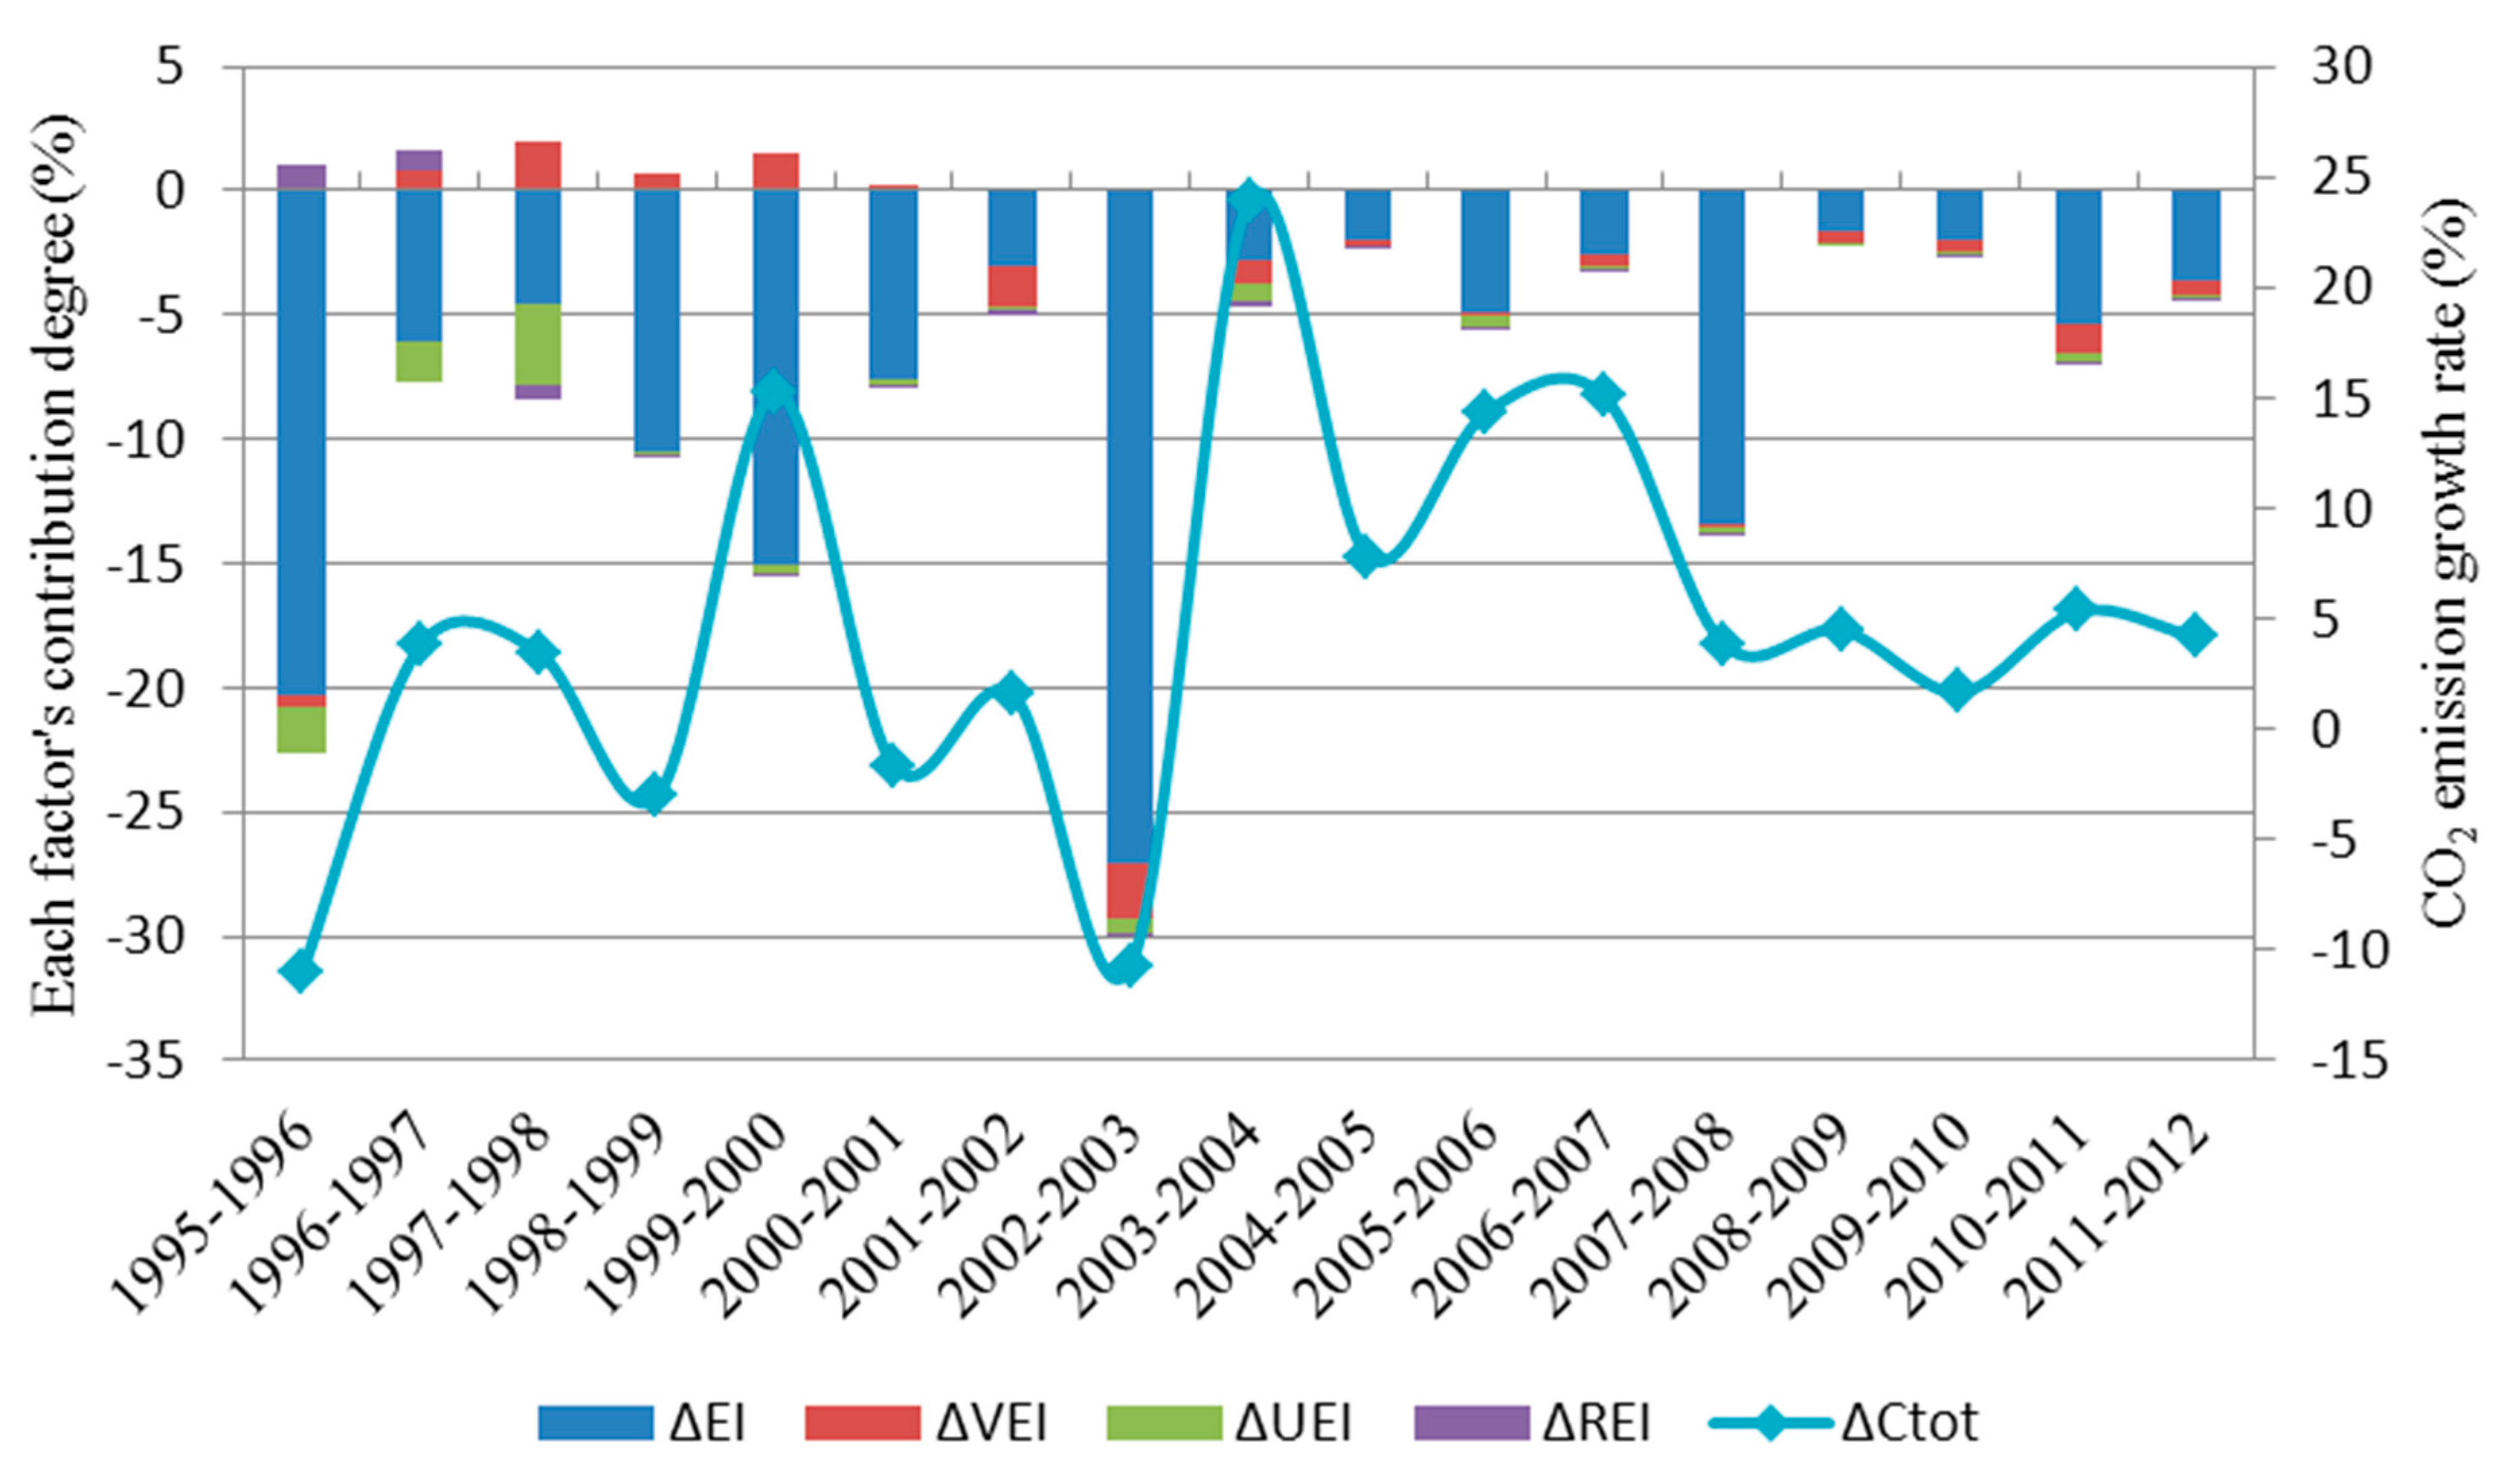
3.1. Energy Intensity Effect

As shown in Figure 1, the energy intensity effect appears to be the main contributor to dampen the increase of CO2 emissions during 1995–2012. According to the decomposition results, the energy intensity effect caused 61.99 million tons of CO2 emissions reduction accumulatively (i.e., the sum of ΔEI, ΔVEI, ΔUEI and ΔREI), approximately 1.68 times of the cumulative CO2 emission changes (i.e., 36.93 million tons) in the same period. The contribution degree of the four factors above and the energy-related CO2 emission changes in percentage are shown in Figure 2.
Figure 2. Contribution degree of each factor included in the energy intensity effect to the growth rate of Tianjin’s energy-related CO2 emissions (1995–2012).
Sustainability 07 09973 g002
The energy intensity’s decline, expressed as the reduction of energy consumption per unit of GDP, usually due to the energy efficiency improvement and energy saving, leads to the negative contribution and propitious to the reduction of CO2 emissions; therefore, the ΔEI is generally recorded as the most important inhibiting factor in decomposition analysis studies of carbon emissions [16,26,34,35]. Energy efficiency in Tianjin has progressed substantially in recent years, especially during the period of the FYP11 (2006–2010), due to the implementation of a series of energy saving and emission reduction measures, supported by an average annual energy consumption growth rate of 10.8%, Tianjin achieved an average annual economic growth rate of 16.1%; and the energy consumption per GDP of Tianjin fell continuously from 2.58 tce/104 yuan in 1995 to 0.67 tce/104 yuan in 2012. Negative contribution of ΔEI is observed throughout the study period, i.e., the decreased energy intensity prompts 50.50 million tons of CO2 emissions reduction accumulatively, which contributes to −150.29% of the total CO2 emission changes in absolute value, making ΔEI the most significant limiting factor in CO2 emissions, which is in consistent with the outcomes obtained by the decomposition study of the “Beijing-Tianjin-Hebei case” [36] and “Tianjin case” [37], but a little different with the nationwide perspective [16], i.e., ΔEI has promoted China’s CO2 emissions in some years.
The ΔUEI and ΔREI mainly reflect a positive role in reducing CO2 emissions from 1995 to 2012, bringing about 3.83 and 0.14 million tons decrease respectively, but the accumulated contributions are minor compared with the ΔEI. The income elasticity coefficient of urban and rural resident’s household energy consumption is relatively small; however, the level of energy consumption is closely related to lifestyle and consumption patterns, indicating that the improvement of household energy efficiency is very complicated, covering many aspects related to the daily behavior of urban and rural residents, and more efforts need to be taken.
The number of motor vehicles in Tianjin increased with an average annual growth rate of 15.4%, from 0.28 million in 1995 to 2.21 million in 2012. The ΔVEI fluctuates throughout the study period, but the overall contribution is negative, i.e., it is conducive to CO2 emission reduction.
Considering the rapid development process of urbanization and industrialization in Tianjin, the increment of total energy consumption is expected to continue in both the production and household sectors; therefore, the reduction of the energy intensity will be of great importance in achieving CO2 emission goals.

3.2. Structure Effect

As shown in Figure 1, the contribution of the structure effect fluctuates, and it is much smaller than the energy intensity effect. The decomposition results shown in Table 1 indicate that the structure effect caused 3.0 million tons of CO2 emissions reduction accumulatively (i.e., the sum of ΔES, ΔIS, and ΔUR), which only accounted for −8.13% of the total CO2 emission changes.
The energy structure effect (ΔES) plays a nominal role in promoting the diminishment of energy-related CO2 emissions during 1995–2012, with an accumulated decrease contribution of 1.2 million tons, which accounts for about −3.26% of the total CO2 emission changes. This indicates that the energy structural adjustment of Tianjin did not seem to have much impact on CO2 emissions reduction, which is not fully consistent with the results obtained by some existing literature [16,36], in those studies, the ΔES is much larger. Meanwhile, a clear fluctuation of ΔES contributions is observed during the examined period, and the ΔES has promoted CO2 emissions to some extent for several years. Over the same period, the percentage of coal in the energy consumption in Tianjin has the same volatility, as shown in Figure 3. From 1995 to 2001, the proportion of coal consumption appears a general downward trend, falling from 53.27% in 1995 to 49.03% in 2001, i.e., the cumulative contribution of the ΔES is negative. In association with the increase in the proportion of coal after 2002, the cumulative contribution of the ΔES becomes positive, and becomes negative again after 2008, indicating that although the energy structure adjustment in Tianjin recently has achieved initial success, the adjustment and optimization of energy structure has not changed the pattern of dominance by coal and thus, there is considerable room for improvement, considering the rapid increase of natural gas consumption in recent years.
During the examined period, the share of primary industry in Tianjin declined continuously (decreased from 6.5% to 1.3%), and although there was an adjustment in the economic structure toward tertiary industry (increased from 37.8% to 47.0%), the industrial structure did not change a lot from 1995–2012 in general, i.e., secondary industry (including Industry and Construction) remained dominant, as shown in Figure 4. The decomposition results signal that during the period of 1995–2012, the cumulative economic structure adjustment effect (ΔIS) is negative with a nominal contribution value of 2.46 million tons of CO2 decrease, which only accounted for −6.6% of the total CO2 emission changes, consistent with the results of other studies [35,37,38]. The ΔIS played a positive driving role in the growth of Tianjin’s energy-related CO2 emissions during 2002–2008, and over the same period, the proportion of secondary industry rose from 49.7% to 55.2% and the value of heavy industrial output increased rapidly. Figure 5 shows the proportion of energy-related CO2 emissions in Tianjin from different sectors in 1995 and 2012. It indicates that the relative proportion of each sector has changed considerably, in particular the decline of industry from 77% to 62% and the increases in transport, construction, and tertiary industry. It is obvious that to arrest the growth of CO2 emissions, the inevitable path requires the simultaneous adjustment of the intra-industry structure, promotion of the development of non-energy-intensive industries, and the upgrade of the technology used by energy-intensive industries.
China is a typical example of a dual-economy country, whose population can be divided into two types: rural and urban. The urbanization rate (UR) is actually a demographic structure, expressed as a proportion of the urban population to the total population. The percentage of the urban population of Tianjin increased continually throughout the examined period, i.e., it rose from 52.93% in 1995 to 81.55% in 2012, with an annual growth rate of 2.58%. The ΔUR plays a role in facilitating the increase of CO2 emissions but with a relatively smaller contribution compared with other positive driving factors, and the cumulative and relative contribution of which during 1995–2012 is 0.66 million tons and 1.8% respectively, which is in agreement with the study of Tianjin’s energy-related per capita CO2 emission [35].
Figure 3. Changes of energy consumption structure in Tianjin (1995−2012).
Sustainability 07 09973 g003
Figure 4. Industrial structure changes and GDP growth in Tianjin (1995–2012).
Sustainability 07 09973 g004
Figure 5. CO2 emissions from different sectors: Inner; 1995, Outer; 2012.
Sustainability 07 09973 g005

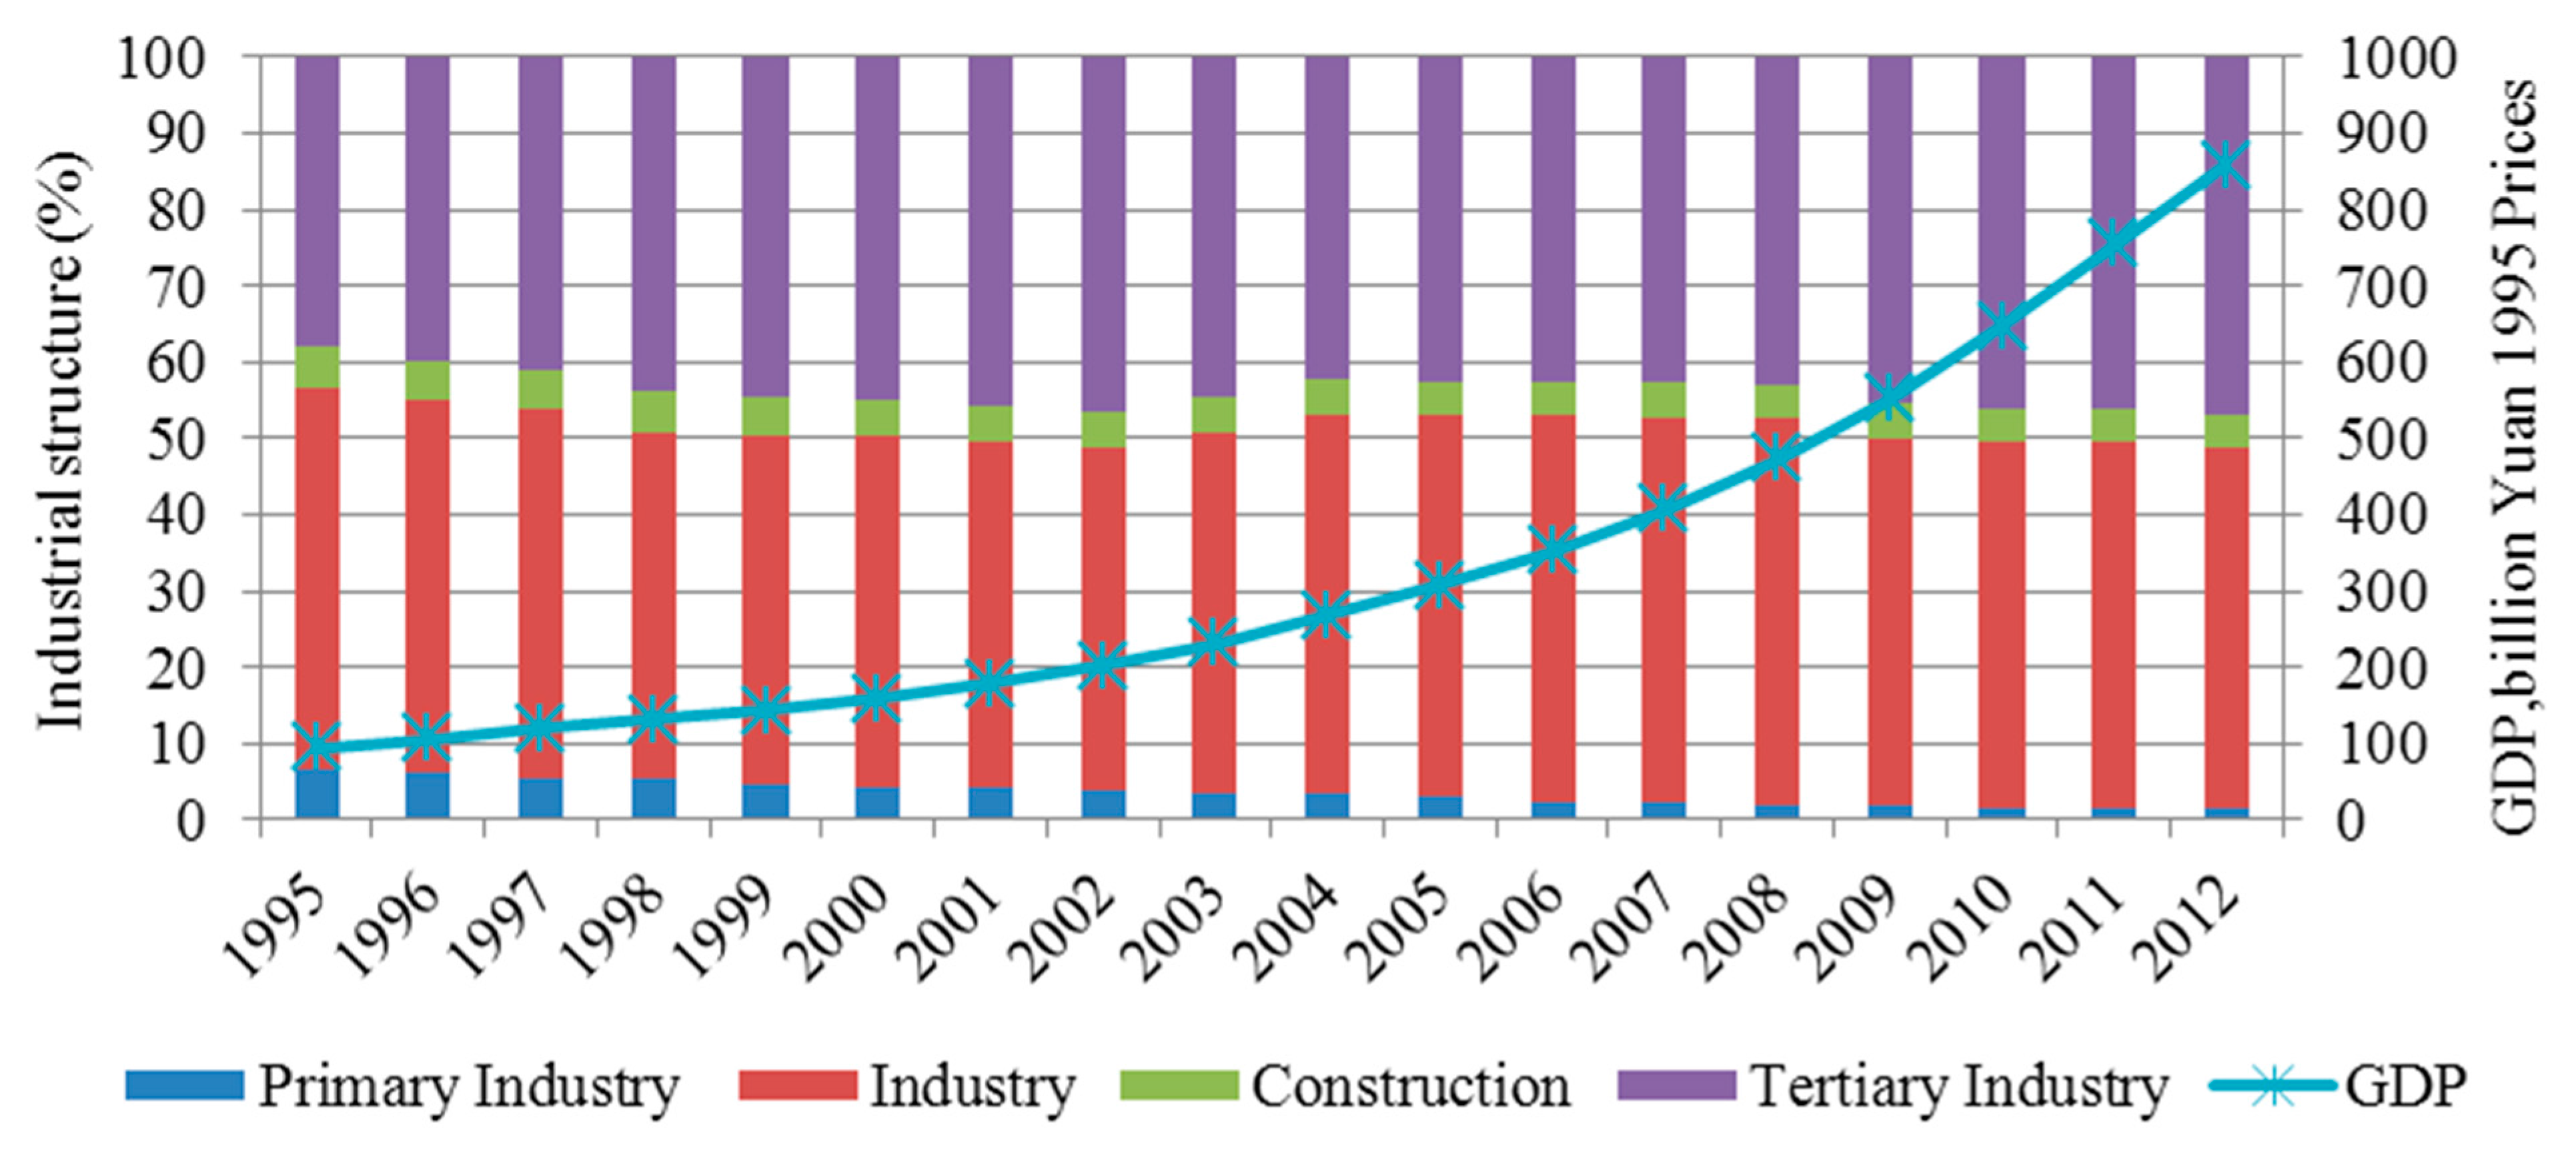
3.3. Activity Intensity Effect

The decomposition analysis revealed that the activity intensity effect, including the per capita GDP (ΔGPC), per capita number of vehicles (ΔVNC), and per capita disposable income of urban residents (ΔUIPC) promoted a remarkable increase in CO2 emissions in Tianjin during the study period, as shown in Figure 1.
GPC, a comprehensive measure of a country’s per capita production capacity of products and services that reflects not only the economic development of the country but also the affluence of the residents, appears the main contributor to the increase of CO2 emissions in Tianjin during 1995–2012, which is consistent with the conclusions obtained by other studies [12,26]. Over the previous 20 years, Tianjin has had the most rapidly expanding economy in China [5], and there is an upward trend in both GPC and CO2 emissions throughout the study period, i.e., the GPC increased by 6.13 times, from 9895 yuan in 1995 to 60,686 yuan in 2012. In the meantime, the CO2 emissions increased by 2.03 times. Therefore, it is unsurprising that the ΔGPC effect is overwhelming, i.e., the dominant positive effect of the ΔGPC is observed throughout the study time series, leading to a 68.35 million tons increase, which contributes to 185.08% of the CO2 emission changes.
During the study period, the per capita disposable income of urban residents (UIPC) increased at an average annual rate of 14.3%, i.e., it has increased by a factor of 4.8 and its contribution to the increase in CO2 emissions is positive, with an accumulated contribution rate of 16.01%. The increase in the level of purchasing power of urban residents has led both directly and indirectly to the increase in CO2 emissions, which highlights another explicit opportunity for reducing CO2 emissions, i.e., the conversion of residents to low-carbon patterns of consumption.
Because of the lack of effectual control over vehicle ownership in Tianjin, the per capita number of vehicles (VNC) has increased by more than five times during 1995–2012. Meanwhile, the CO2 emissions from the transportation sector amplified by more than 1.5 times in the period 1995–2012, as shown in Figure 5. The ΔVNC has also played a positive driving role in CO2 emissions during the examined period, resulting in 8.26 million tons increment.

3.4. Scale Effect

A steadily growing population and increasing levels of income lead to greater demands for goods and services that result in more energy consumption and CO2 generation. The population effect (ΔP) and expenditure effect of rural residents (ΔTRI) are both scale effects that indicate the positive impacts of a growing population and rising levels of income on the increase of CO2 emissions.
Population size and growth was widely recognized as one of the primary drivers of anthropogenic CO2 emissions [6,26]. The results of our LMDI decomposition analysis indicate that the ΔP is the second most significant driving factor after ΔGPC, which is in agreement with the results of some of the previous literature [28,36]. With an average rate of growth of 2.43% per year, the increasing population has contributed significantly to the CO2 emission increment in Tianjin during the study period, leading to an increase of CO2 emissions of 17.89 million tons, which accounts for about 48.45% of the total CO2 emission changes in absolute value. Besides, the permanent population data of Tianjin was used in our analysis, since the scale and growth rate of the registered population is smaller than that of the permanent population. When the registered population data was used in our decomposition analysis, the contribution of ΔP to the cumulative CO2 emission changes became much smaller. A deceleration in the rate of urban population growth would appear beneficial for a coordinated and sustained development of the population, economy, society, resources, and environment. However, the migration of the rural population into the larger cities means that further growth of the urban population is inevitable. Thus, we conclude that the ΔP effect will promote further CO2 emissions in Tianjin in the future and make the overall reduction of emissions more difficult.
The expenditure effect of rural residents (ΔTRI) also has a positive effect because increased income enables rural residents to pay for more energy consumption. In addition, energy usage related to the use of household appliances such as washing machines, air conditioners, refrigerators, personal computers and private vehicles and motorcycles has increased rapidly, although this scale effect is insignificant in comparison with the ΔP effect.

4. Conclusions and Policy Recommendations

In association with the speedy economic development, Tianjin has experienced a sharp increase in CO2 emissions. In this study, the driving factors responsible for the ups and downs of CO2 emissions in Tianjin during the period of 1995–2012 are analyzed quantitatively using the LMDI decomposition method. In general, the above analysis forms a solid foundation for the implementation of appropriate mitigation policies in Tianjin. Several conclusions are obtained as below.
Although ΔGPC and ΔP contribute most to the increment of the metropolis’s CO2 emissions during 1995–2012, it is impracticable to reduce CO2 emissions through the control of population growth or the restraint on the ever-increasing demand for goods and services for each person, particularly the needs of energy and resources. Along with further increases in income levels and urban population, the ΔUIPC, ΔTRI, ΔVNC, and ΔUR are expected to continue promoting CO2 emissions. Energy intensity effect, especially the ΔEI, reduces energy-related CO2 emissions significantly; however, the relatively minor cumulative contributions of ΔIS and ΔES to CO2 emissions reduction should not be ignored, neither of them play their due roles, indicating that greater efforts need to be taken in the future to promote their inhibitory contribution to CO2 emission. By and large, the three most promising areas for reducing CO2 emissions are energy efficiency improvements, economic structure adjustments, and fuel switching. Based on the results of our research, we make the following policy recommendations.
(1) Economic policy. It is necessary for Tianjin to continually transform economic growth patterns and upgrade industrial structure by innovative technologies. The government is advised to decrease the proportion of energy-intensive and carbon-intensive industries by accelerating the elimination of backward production capacity and using advanced and applicable technologies to promote low-carbon technology in traditional industries such as metallurgy, electricity generation, and the petrochemical sector. The government is expected to nurture emerging low-carbon technologies with particular focus on the renewable energy, new material, energy saving, and environmental protection industries. Furthermore, the information industry and producer services with high added-value output, low-energy consumption, and low pollution should be encouraged to underline the inhibitory effect of industrial structure optimization on the growth of carbon emissions.
(2) Energy policy. Although Tianjin’s energy intensity is among the best in China, further efforts are needed to increase energy efficiency since there is still a large room for improvement when compared with other developed countries. There are many recommended measures that can be taken by Tianjin to achieve the energy efficiency upgrade: (a) administrative measures, i.e., the enactment of related regulations and more stringent energy efficiency standards, further strengthening the energy use evaluation and management of industry, especially the energy-intensive ones like chemical industry, the iron and steel industry and thermal power industry; (b) application of new energy-related technologies, for instance, green buildings, green transportation as well as the development of ultra-supercritical, integrated coal gasification for the gas-steam combined cycle and other advanced coal-fired power generation technologies in thermal power projects; (c) economic instruments, i.e., tax, energy efficiency loans, and subsidies. However, the energy efficiency cannot be increased indefinitely; more attention should be paid to the adjustment of energy structure. The government should accelerate the development and use of non-fossil-fuel energy sources especially solar, geothermal, and biomass, further increase the proportion of natural gas in energy consumption, while consolidating and stabilizing existing natural gas supply, and exploit new gas sources to guarantee future increases.
(3) Population policy. Propaganda of the importance of CO2 mitigation and low-carbon should be enhanced to ensure residents’ better understanding of the connection between daily behavior and CO2 emissions. More attention should be given to increasing the awareness of the population to low-carbon technology. Improving the consciousness of residents to green transportation and low-carbon lifestyles would promote patterns of low-carbon consumption.

Author Contributions

Lin Zhao and Zhe Wang designed research; Lin Zhao, Zhe Wang, Guozhu Mao and Ben Wu performed research. All authors wrote the paper. All authors have read and approved the final manuscript.

Conflicts of Interest

The authors declare no conflict of interest.

References

  1. BP. Bp Statistical Review of World Energy 2013; BP Company: London, UK, 2013. [Google Scholar]
  2. Boden, T.A.; Marland, G.; Andres, R.J. Global, Regional, and National Fossil-fuel CO2 Emissions; Carbon Dioxide Information Analysis Center: Oak Ridge, TN, USA, 2012. [Google Scholar]
  3. Agee, M.D.; Atkinson, S.E.; Thomas, D.C.; Williams, J.W. Non-separable pollution control: Implications for a CO2 emissions cap and trade system. Resour. Energy Econ. 2014, 36, 64–82. [Google Scholar] [CrossRef]
  4. Accord, C. China’s Autonomous Domestic Mitigation Actions. Available online: https://unfccc.int/files/meetings/cop_15/copenhagen_accord/application/pdf/chinacphaccord_app2.pdf (accessed on 28 January 2010).
  5. National Bureau of Statistics of China (NBSC). China Statistical Yearbook 2013; China Statistics Press: Beijing, China, 2013.
  6. Dhakal, S. Urban energy use and carbon emissions from cities in China and policy implications. Energy Policy 2009, 37, 4208–4219. [Google Scholar] [CrossRef]
  7. Wang, Y.; Zhao, H.; Li, L.; Liu, Z.; Liang, S. Carbon dioxide emission drivers for a typical metropolis using input-output structural decomposition analysis. Energy Policy 2013, 58, 312–318. [Google Scholar] [CrossRef]
  8. Tan, Z.F.; Li, L.; Wang, J.J.; Wang, J.H. Examining the driving forces for improving China’s CO2 emission intensity using the decomposing method. Appl. Energy 2011, 88, 4496–4504. [Google Scholar] [CrossRef]
  9. Liu, Z.; Liang, S.; Geng, Y.; Xue, B.; Xi, F.; Pan, Y.; Zhang, T.; Fujita, T. Features, trajectories and driving forces for energy-related ghg emissions from Chinese mega cites: The case of Beijing, Tianjin, Shanghai and Chongqing. Energy 2012, 37, 245–254. [Google Scholar] [CrossRef]
  10. Guan, D.; Hubacek, K.; Weber, C.L.; Peters, G.P.; Reiner, D.M. The drivers of Chinese CO2 emissions from 1980 to 2030. Glob. Environ. Change 2008, 18, 626–634. [Google Scholar] [CrossRef]
  11. Wang, C.; Chen, J.N.; Zou, J. Decomposition of energy-related CO2 emission in China: 1957–2000. Energy 2005, 30, 73–83. [Google Scholar] [CrossRef]
  12. Chen, L.; Yang, Z.F.; Chen, B. Decomposition analysis of energy-related industrial CO2 emissions in China. Energies 2013, 6, 2319–2337. [Google Scholar] [CrossRef]
  13. Tianjin Municipal Bureau of Statistics. Tianjin Statistical Yearbook 2013; China Statistics Press: Beijing, China, 2013.
  14. Liu, F.L.; Ang, B.W. Eight methods for decomposing the aggregate energy-intensity of industry. Appl. Energy 2003, 76, 15–23. [Google Scholar] [CrossRef]
  15. Cellura, M.; Longo, S.; Mistretta, M. Application of the structural decomposition analysis to assess the indirect energy consumption and air emission changes related to italian households consumption. Renew. Sustain. Energy Rev. 2012, 16, 1135–1145. [Google Scholar] [CrossRef]
  16. Zhang, Y.J.; Da, Y.B. The decomposition of energy-related carbon emission and its decoupling with economic growth in china. Renew. Sustain. Energy Rev. 2015, 41, 1255–1266. [Google Scholar] [CrossRef]
  17. Ang, B.W. Decomposition analysis for policymaking in energy. Energy Policy 2004, 32, 1131–1139. [Google Scholar] [CrossRef]
  18. Ang, B.W.; Zhang, F.Q. A survey of index decomposition analysis in energy and environmental studies. Energy 2000, 25, 1149–1176. [Google Scholar] [CrossRef]
  19. Ang, B.W.; Choi, K.H. Decomposition of aggregate energy and gas emission intensities for industry: A refined divisia index method. Energy J. 1997, 18, 59–73. [Google Scholar] [CrossRef]
  20. Ang, B.W.; Liu, F.L. A new energy decomposition method: Perfect in decomposition and consistent in aggregation. Energy 2001, 26, 537–548. [Google Scholar] [CrossRef]
  21. Ang, B.W.; Liu, N. Handling zero values in the logarithmic mean divisia index decomposition approach. Energy Policy 2007, 35, 238–246. [Google Scholar] [CrossRef]
  22. Ang, B.W. The lmdi approach to decomposition analysis: A practical guide. Energy Policy 2005, 33, 867–871. [Google Scholar] [CrossRef]
  23. Liu, L.C.; Fan, Y.; Wu, G.; Wei, Y.M. Using lmdi method to analyzed the change of China’s industrial CO2 emissions from final fuel use: An empirical analysis. Energy Policy 2007, 35, 5892–5900. [Google Scholar] [CrossRef]
  24. Wu, J.H.; Chen, Y.Y.; Huang, Y.H. Trade pattern change impact on industrial CO2 emissions in Taiwan. Energy Policy 2007, 35, 5436–5446. [Google Scholar] [CrossRef]
  25. Fernandez Gonzalez, P.; Landajo, M.; Presno, M.J. Multilevel lmdi decomposition of changes in aggregate energy consumption. A cross country analysis in the EU-27. Energy Policy 2014, 68, 576–584. [Google Scholar] [CrossRef]
  26. O’Mahony, T. Decomposition of Ireland’s carbon emissions from 1990 to 2010: An extended kaya identity. Energy Policy 2013, 59, 573–581. [Google Scholar]
  27. Tian, Y.H.; Zhu, Q.H.; Geng, Y. An analysis of energy-related greenhouse gas emissions in the Chinese iron and steel industry. Energy Policy 2013, 56, 352–361. [Google Scholar] [CrossRef]
  28. Wang, C.J.; Wang, F.; Zhang, H.G.; Ye, Y.Y.; Wu, Q.T.; Su, Y.X. Carbon emissions decomposition and environmental mitigation policy recommendations for sustainable development in Shandong province. Sustainability 2014, 6, 8164–8179. [Google Scholar] [CrossRef]
  29. Guo, B.; Geng, Y.; Franke, B.; Hao, H.; Liu, Y.; Chiu, A. Uncovering China’s transport CO2 emission patterns at the regional level. Energy Policy 2014, 74, 134–146. [Google Scholar] [CrossRef]
  30. Xu, J.H.; Fleiter, T.; Eichhammer, W.; Fan, Y. Energy consumption and CO2 emissions in China’s cement industry: A perspective from lmdi decomposition analysis. Energy Policy 2012, 50, 821–832. [Google Scholar] [CrossRef]
  31. Lin, B.Q.; Ouyang, X.L. Analysis of energy-related CO2 (carbon dioxide) emissions and reduction potential in the Chinese non-metallic mineral products industry. Energy 2014, 68, 688–697. [Google Scholar] [CrossRef]
  32. Baldwin, J.G.; Wing, I.S. The spatiotemporal evolution of U.S. Carbon dioxide emissions: Stylized facts and implications for climate policy. J. Reg. Sci. 2013, 53, 672–689. [Google Scholar] [CrossRef]
  33. Intergovernmental Panel on Climate Change (IPCC). 2006 IPCC Guidelines for National Greenhouse Gas Inventories [db/ol]. Available online: http://www.ipcc-nggip.iges.or.jp/public/2006gl/index.html (accessed on 1 May 2015).
  34. Ma, C.; Stern, D.I. Biomass and China’s carbon emissions: A missing piece of carbon decomposition. Energy Policy 2008, 36, 2517–2526. [Google Scholar] [CrossRef]
  35. Chen, Y.; Lin, S. Study on factors affecting energy-related per capita carbon dioxide emission by multi-sectoral of cities: A case study of Tianjin. Nat. Hazards 2015, 77, 833–846. [Google Scholar] [CrossRef]
  36. Wang, Z.H.; Yang, L. Delinking indicators on regional industry development and carbon emissions: Beijing-Tianjin-Hebei economic band case. Ecol. Indic. 2015, 48, 41–48. [Google Scholar] [CrossRef]
  37. Kang, J.; Zhao, T.; Liu, N.; Zhang, X.; Xu, X.; Lin, T. A multi-sectoral decomposition analysis of city-level greenhouse gas emissions: Case study of Tianjin, China. Energy 2014, 68, 562–571. [Google Scholar] [CrossRef]
  38. Wang, W.W.; Liu, R.; Zhang, M.; Li, H.A. Decomposing the decoupling of energy-related CO2 emissions and economic growth in Jiangsu province. Energy Sustain. Dev. 2013, 17, 62–71. [Google Scholar] [CrossRef]

