
Seasonal and Diurnal Thermal Performance of a Subtropical Extensive Green Roof: The Impacts of Background Weather Parameters

Abstract
:1. Introduction
2. Study Area and Methods
2.1. Study Area
2.2. Experimental Design

| Vertical component | Material | Thickness (mm) | |
|---|---|---|---|
| Reinforced roof deck | Roof slab | Screed and concrete | 200 |
| Waterproof membrane | Two-layer torched-applied modified bitumen assembly | 0.5 | |
| Insulation | Extruded polystyrene | 50 | |
| Concrete tile | Screed and concrete | 200 | |
| Extensive green roof | Root barrier | Polyethylene | 0.5 |
| Drainage | High impact polyethylene | 25 | |
| Filter | Geo-textile | 0.5 | |
| Water storage | Rockwool | 40 | |
| Growing medium | Decomposed granite and compost | 70 | |
| Vegetation | Perennial Peanut | 200 | |
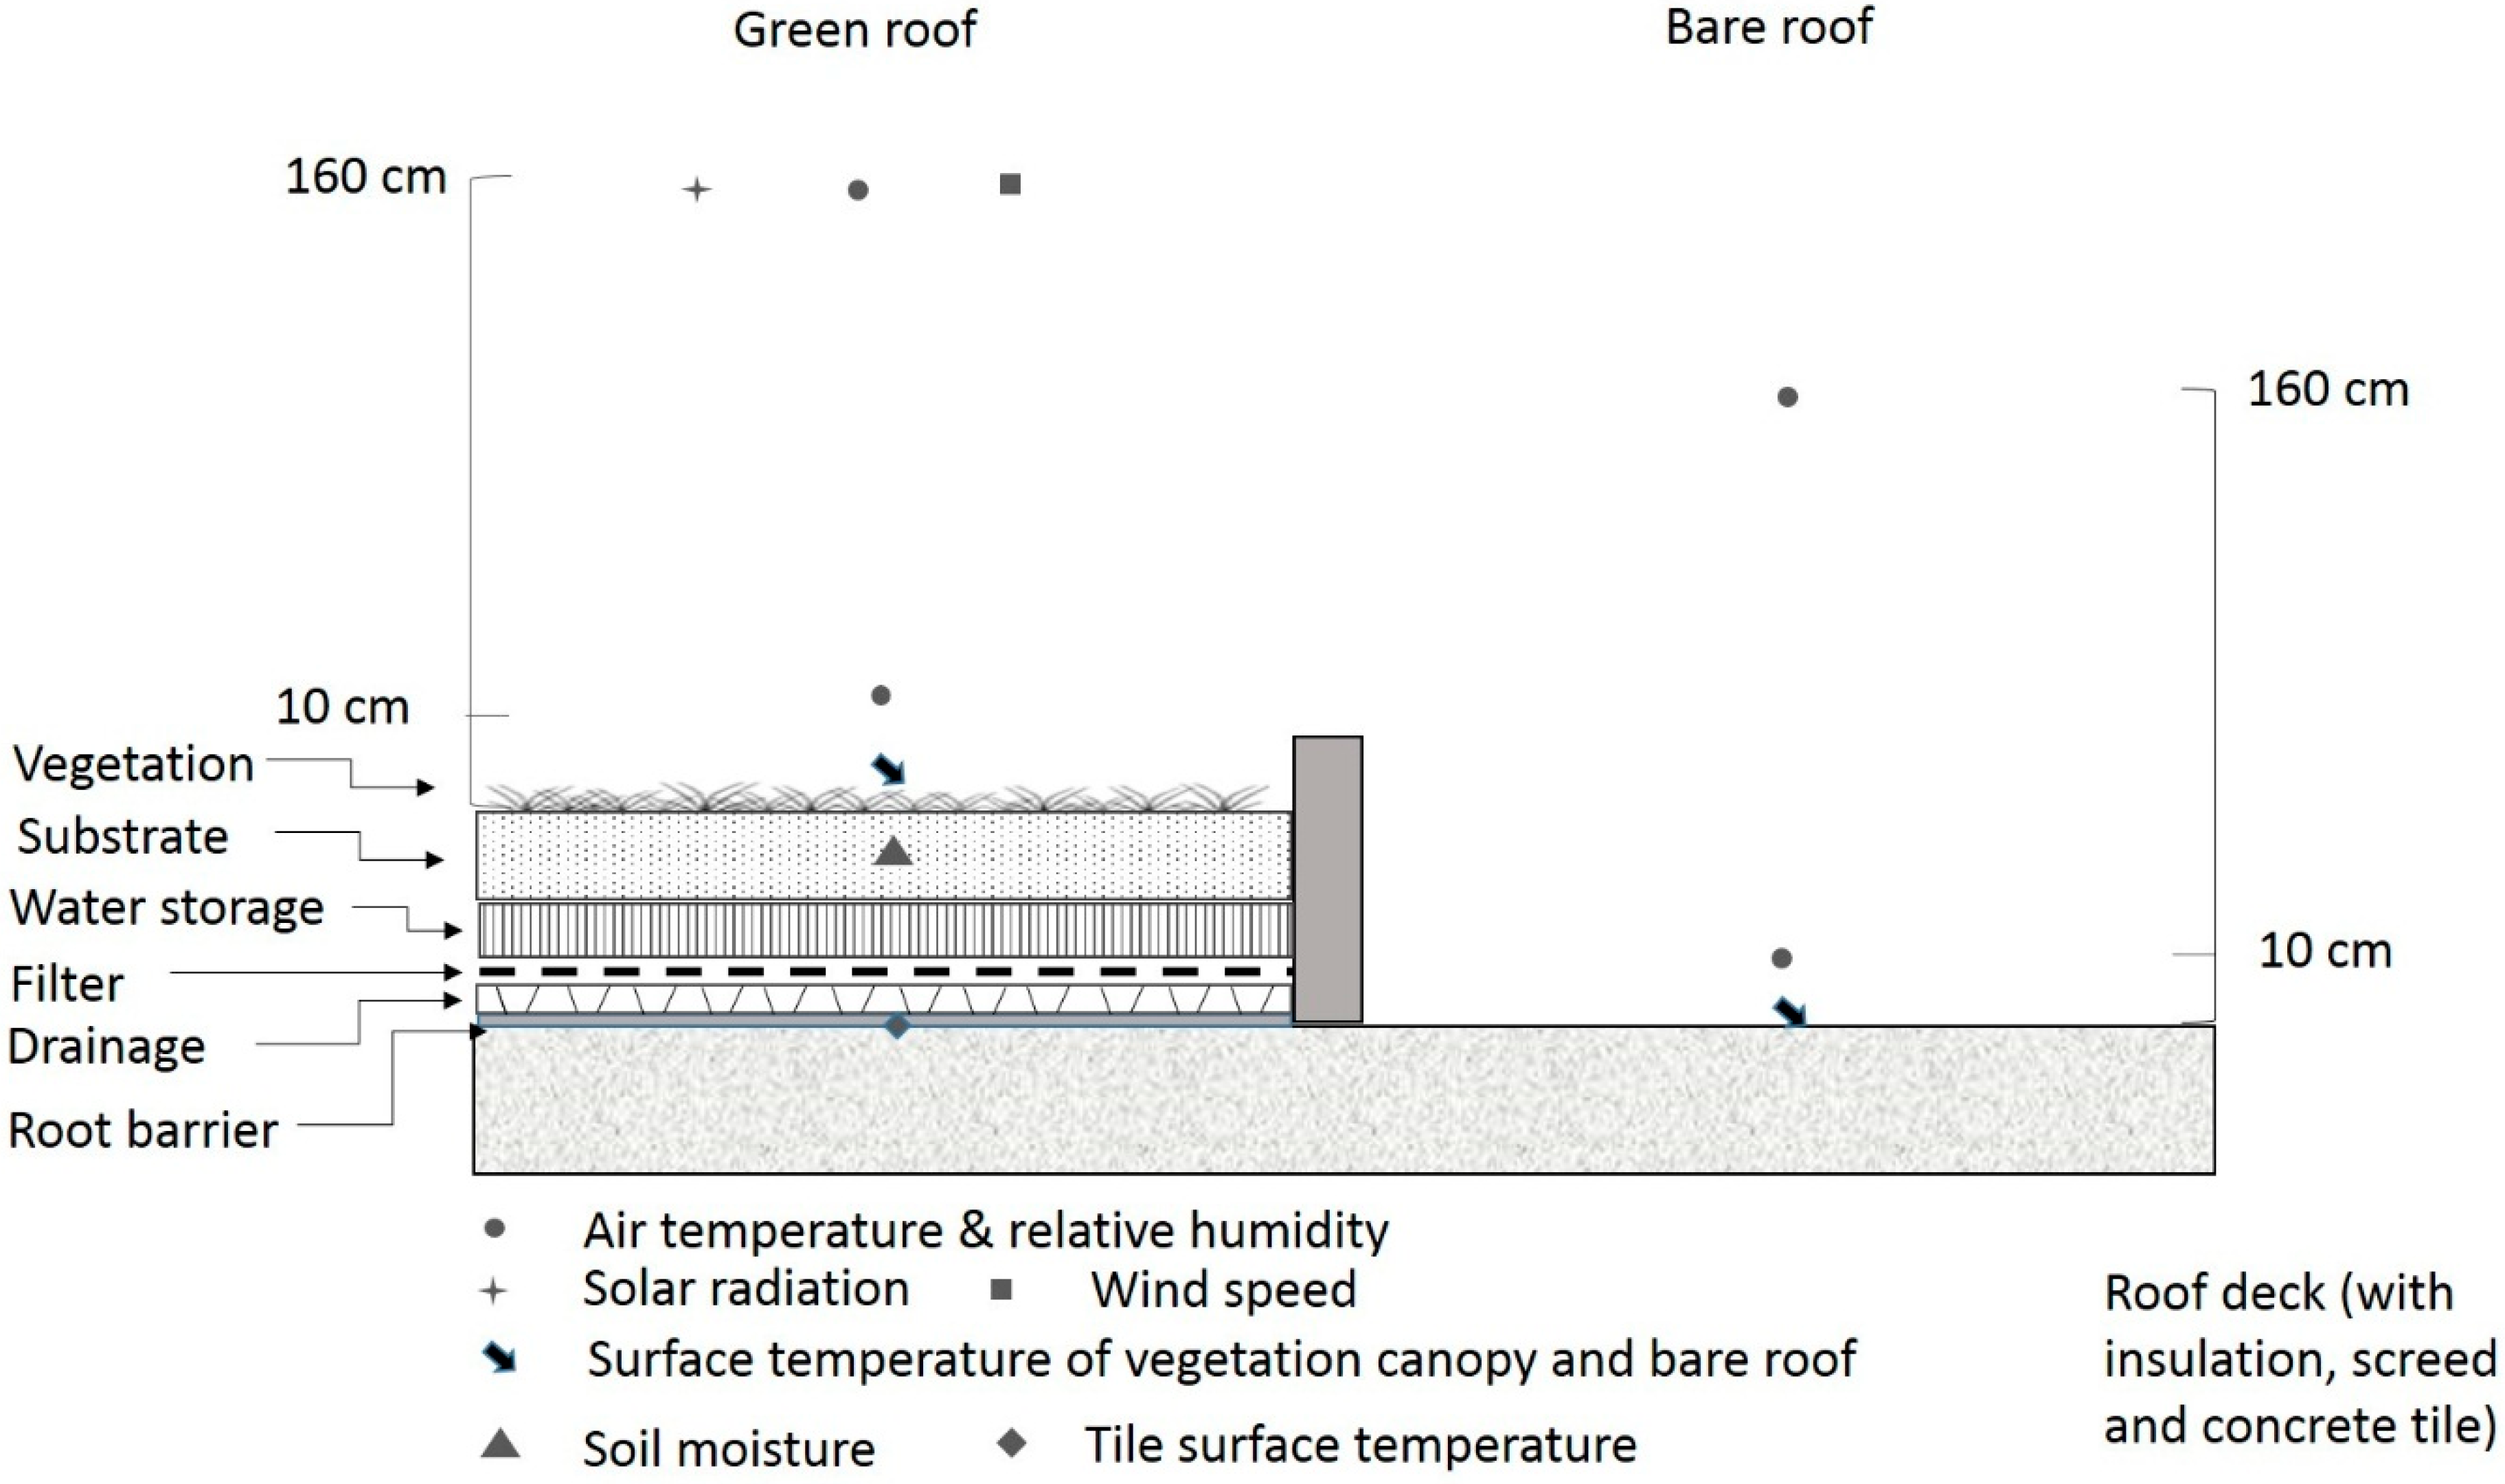
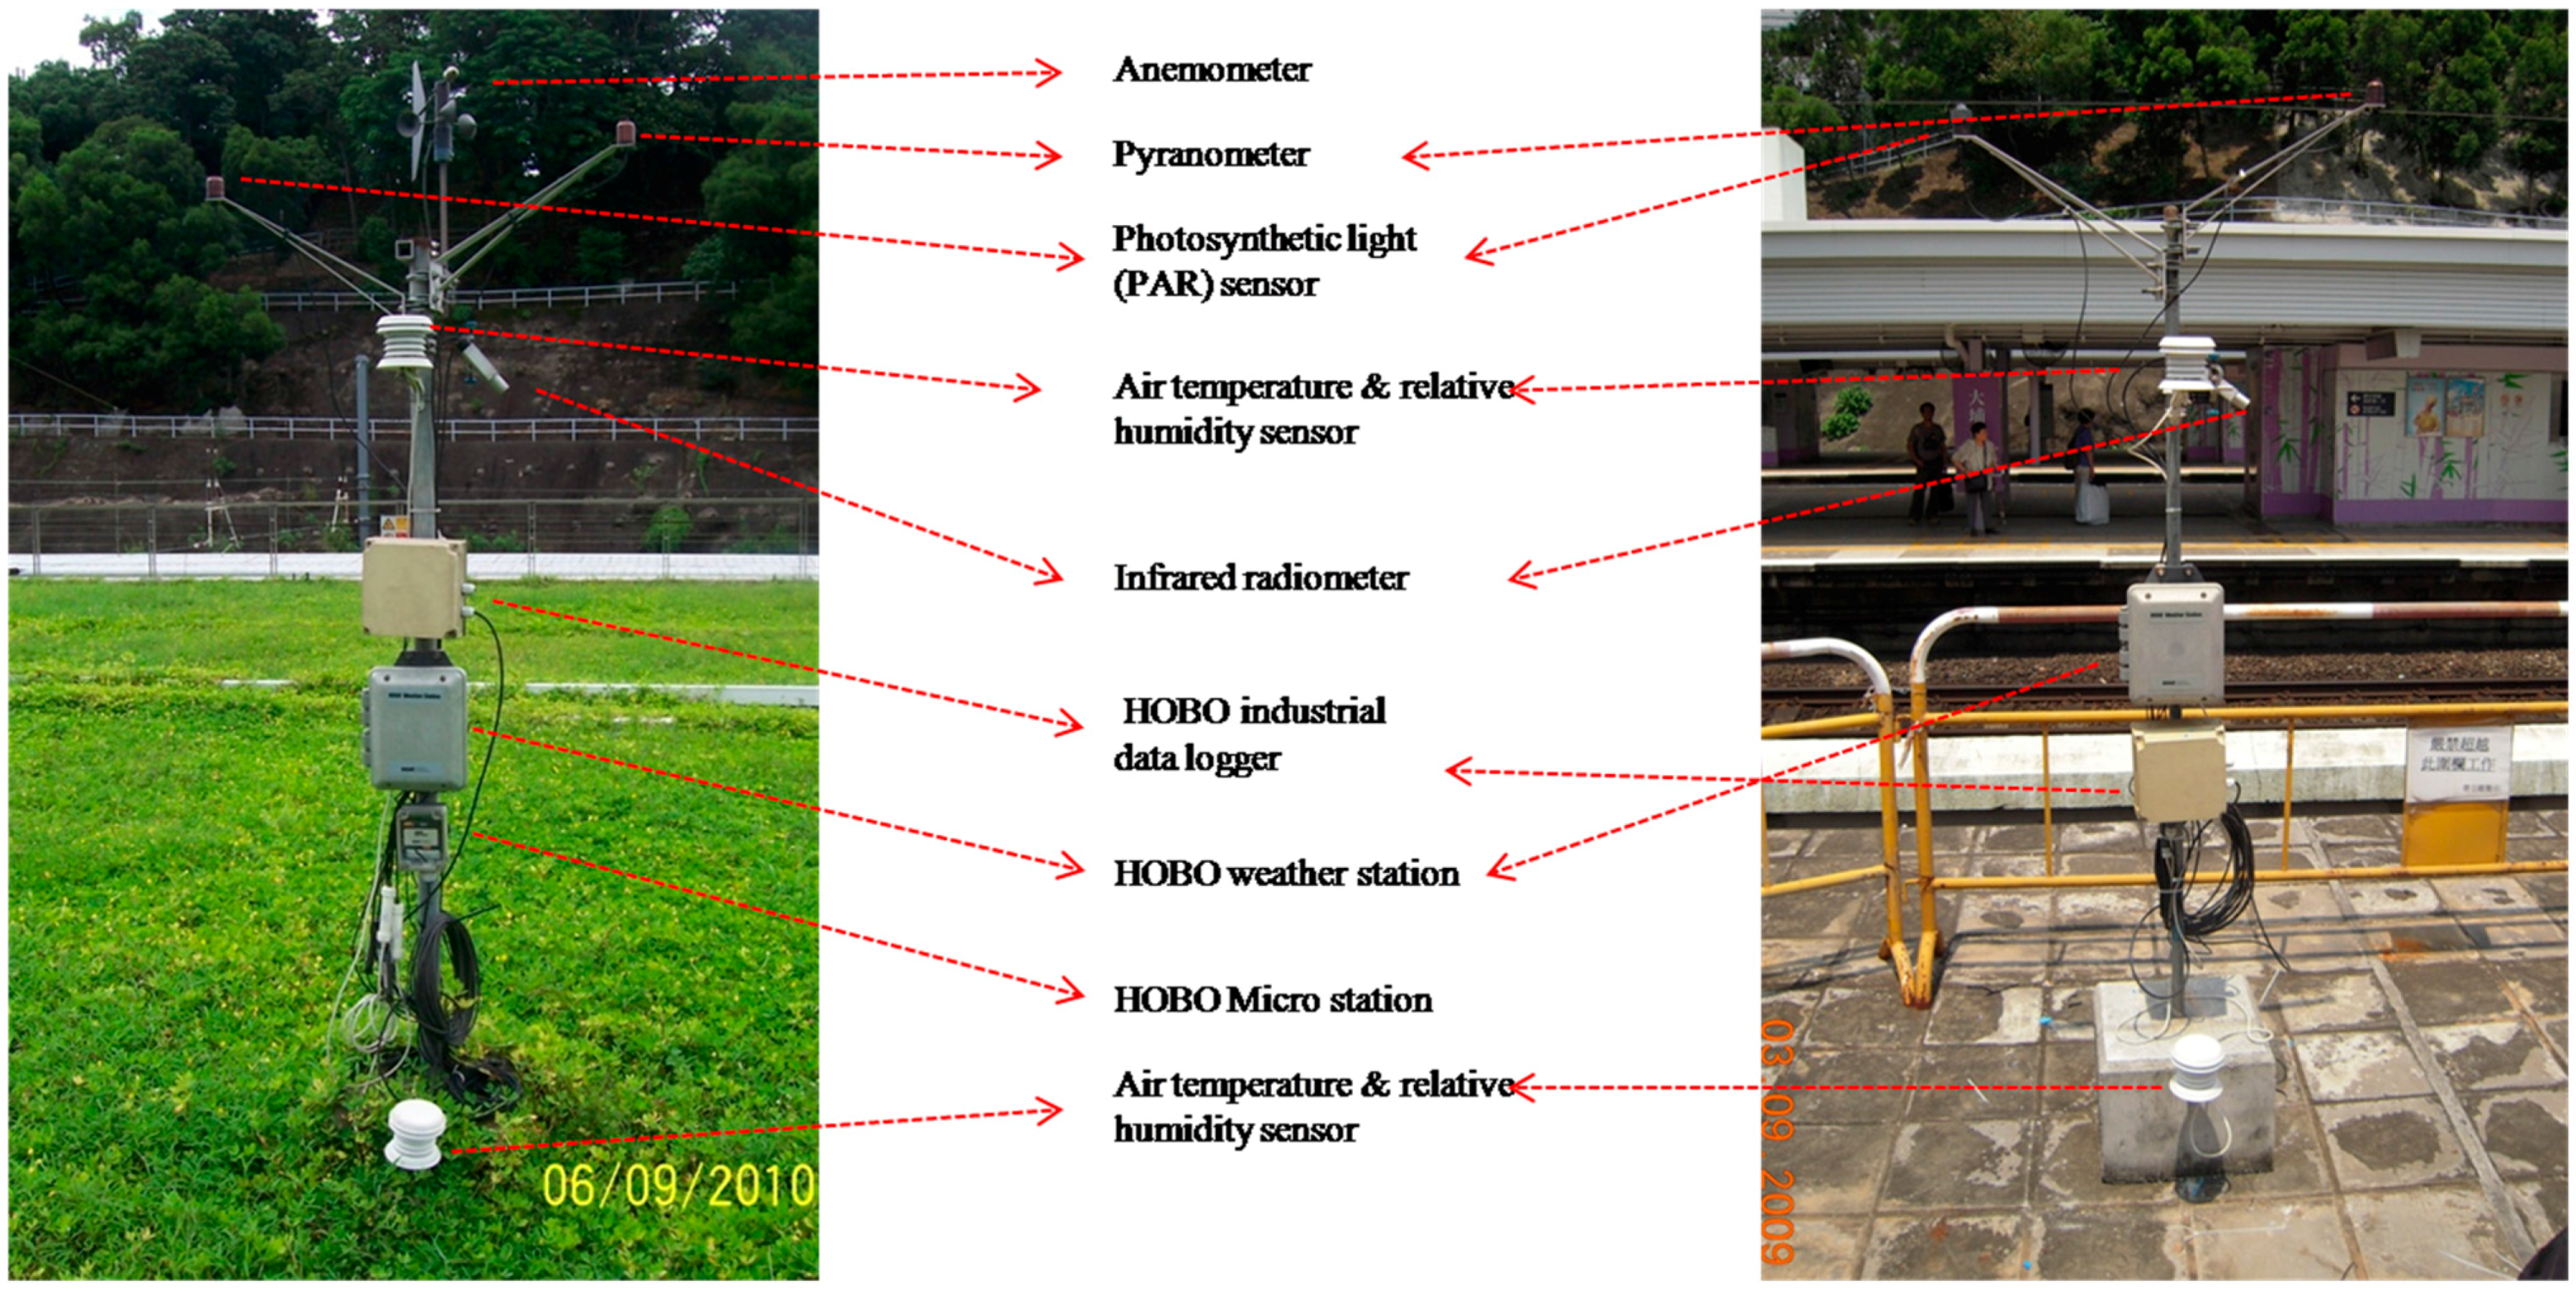
2.3. Data Collection
| Sunshine hours | Cloud amount (%) | Rainfall (mm) | |
|---|---|---|---|
| Sunny | 4–1 | <80 | 0 |
| Cloudy | 0–4 | >90 | 0 |
| Rainy | 0 | 80–90 | >10 |
2.4. Data Processing
2.4.1. Thermal-Effect Indicators
2.4.2. Background Weather Variables
| Symbol | Unit | Explanation |
|---|---|---|
| Study site | ||
| A | na | Experimental plot after green roof installation |
| B | na | Experimental plot before green roof installation |
| Z | na | Control (bare roof) plot |
| Monitoring thermal-effect indicators | ||
| Tt | °C | Concrete tile surface temperature |
| Tv | °C | Vegetation canopy surface temperature |
| T10 | °C | Air temperature at 10 cm height |
| T160 | °C | Air temperature at 160 cm height |
| RH10 | °C | Relative humidity at 10 cm height |
| RH160 | °C | Relative humidity at 160 cm height |
| Derived thermal-effect indicators | ||
| DT | ------ | Daytime mean from 12:00 h to 16:00 h |
| NT | ------ | Nighttime mean from 20:00 h to 00:00 h |
| Season-cum-weather scenarios | ||
| SPS | ------ | Spring sunny |
| SPR | ------ | Spring rainy |
| SPC | ------ | Spring cloudy |
| SUS | ------ | Summer sunny |
| SUR | ------ | Summer rainy |
| SUC | ------ | Summer cloudy |
| FLS | ------ | Fall sunny |
| FLR | ------ | Fall rainy |
| FLC | ------ | Fall cloudy |
| WTS | ------ | Winter sunny |
| WTC | ------ | Winter cloudy |
| Background weather variables | ||
| Ta | °C | Air temperature |
| RH | % | Relative humidity |
| SR | Wm−2 | Solar radiation |
| WS | ms−1 | Wind speed |
| SM | m3m−3 | Substrate moisture |
2.5. Data Analysis
2.5.1. Independent T-test
2.5.2. Multiple Regression Analysis
3. Seasonal and Diurnal Patterns of Green-roof Thermal Effects
3.1. Overall Assessment
| T10 | T160 | RH10 | RH160 | Tt | Tv | ||
|---|---|---|---|---|---|---|---|
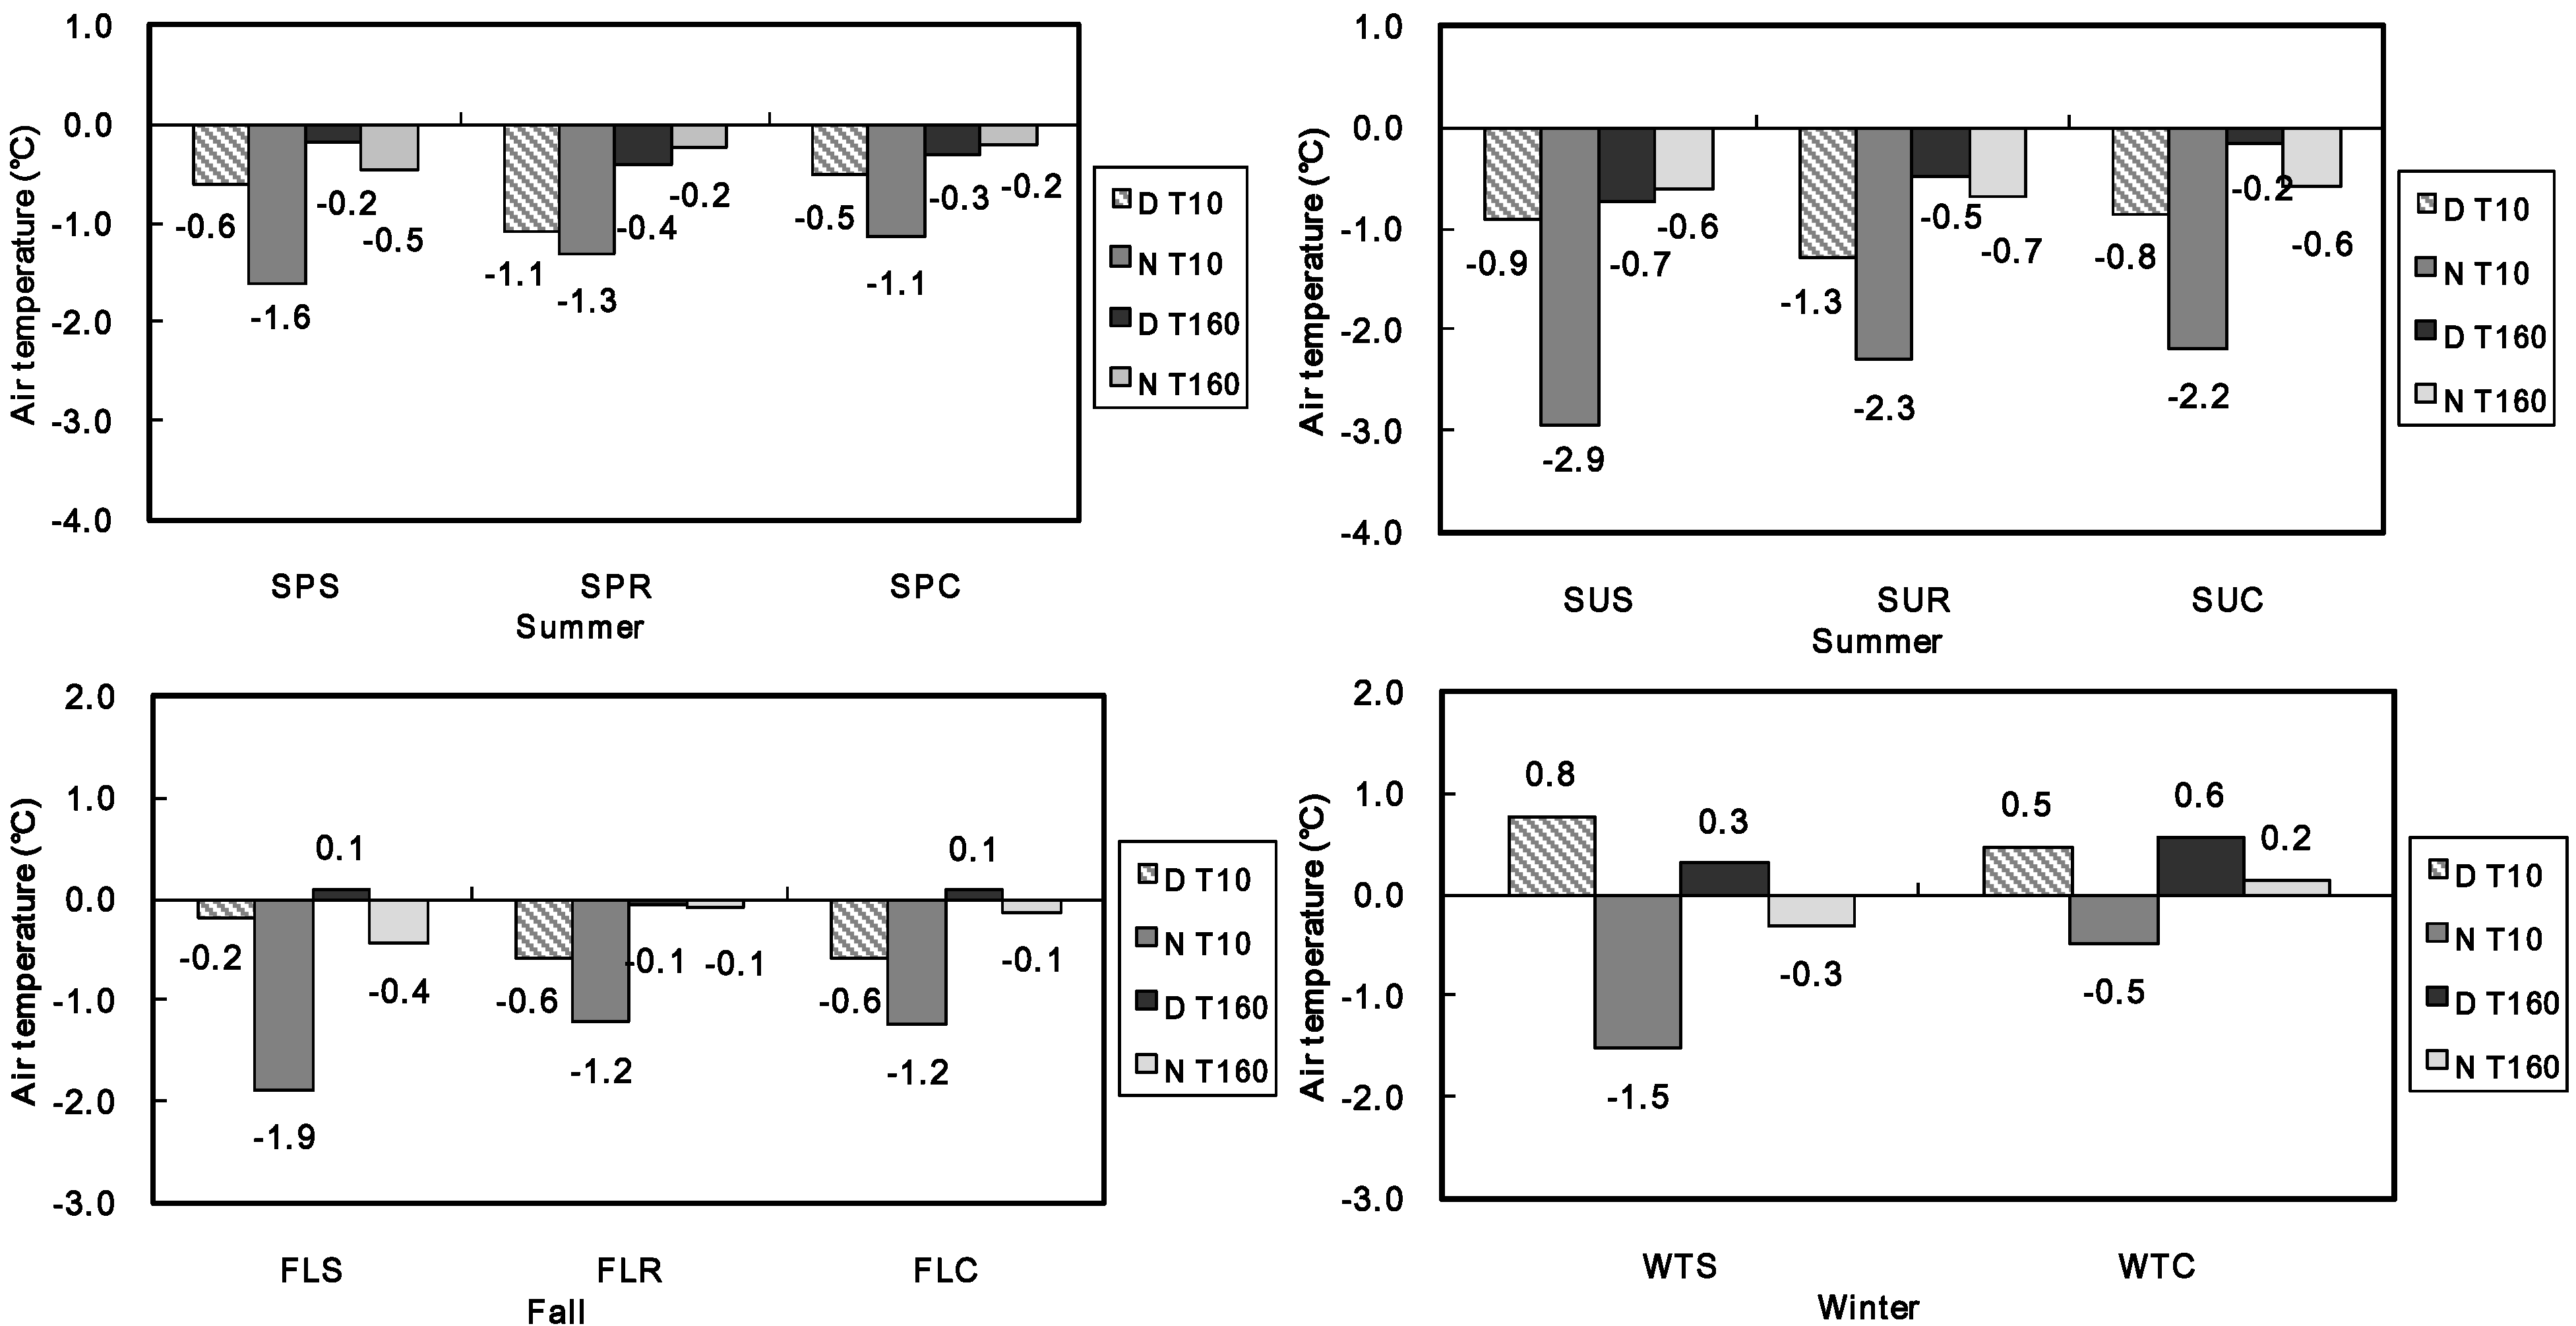
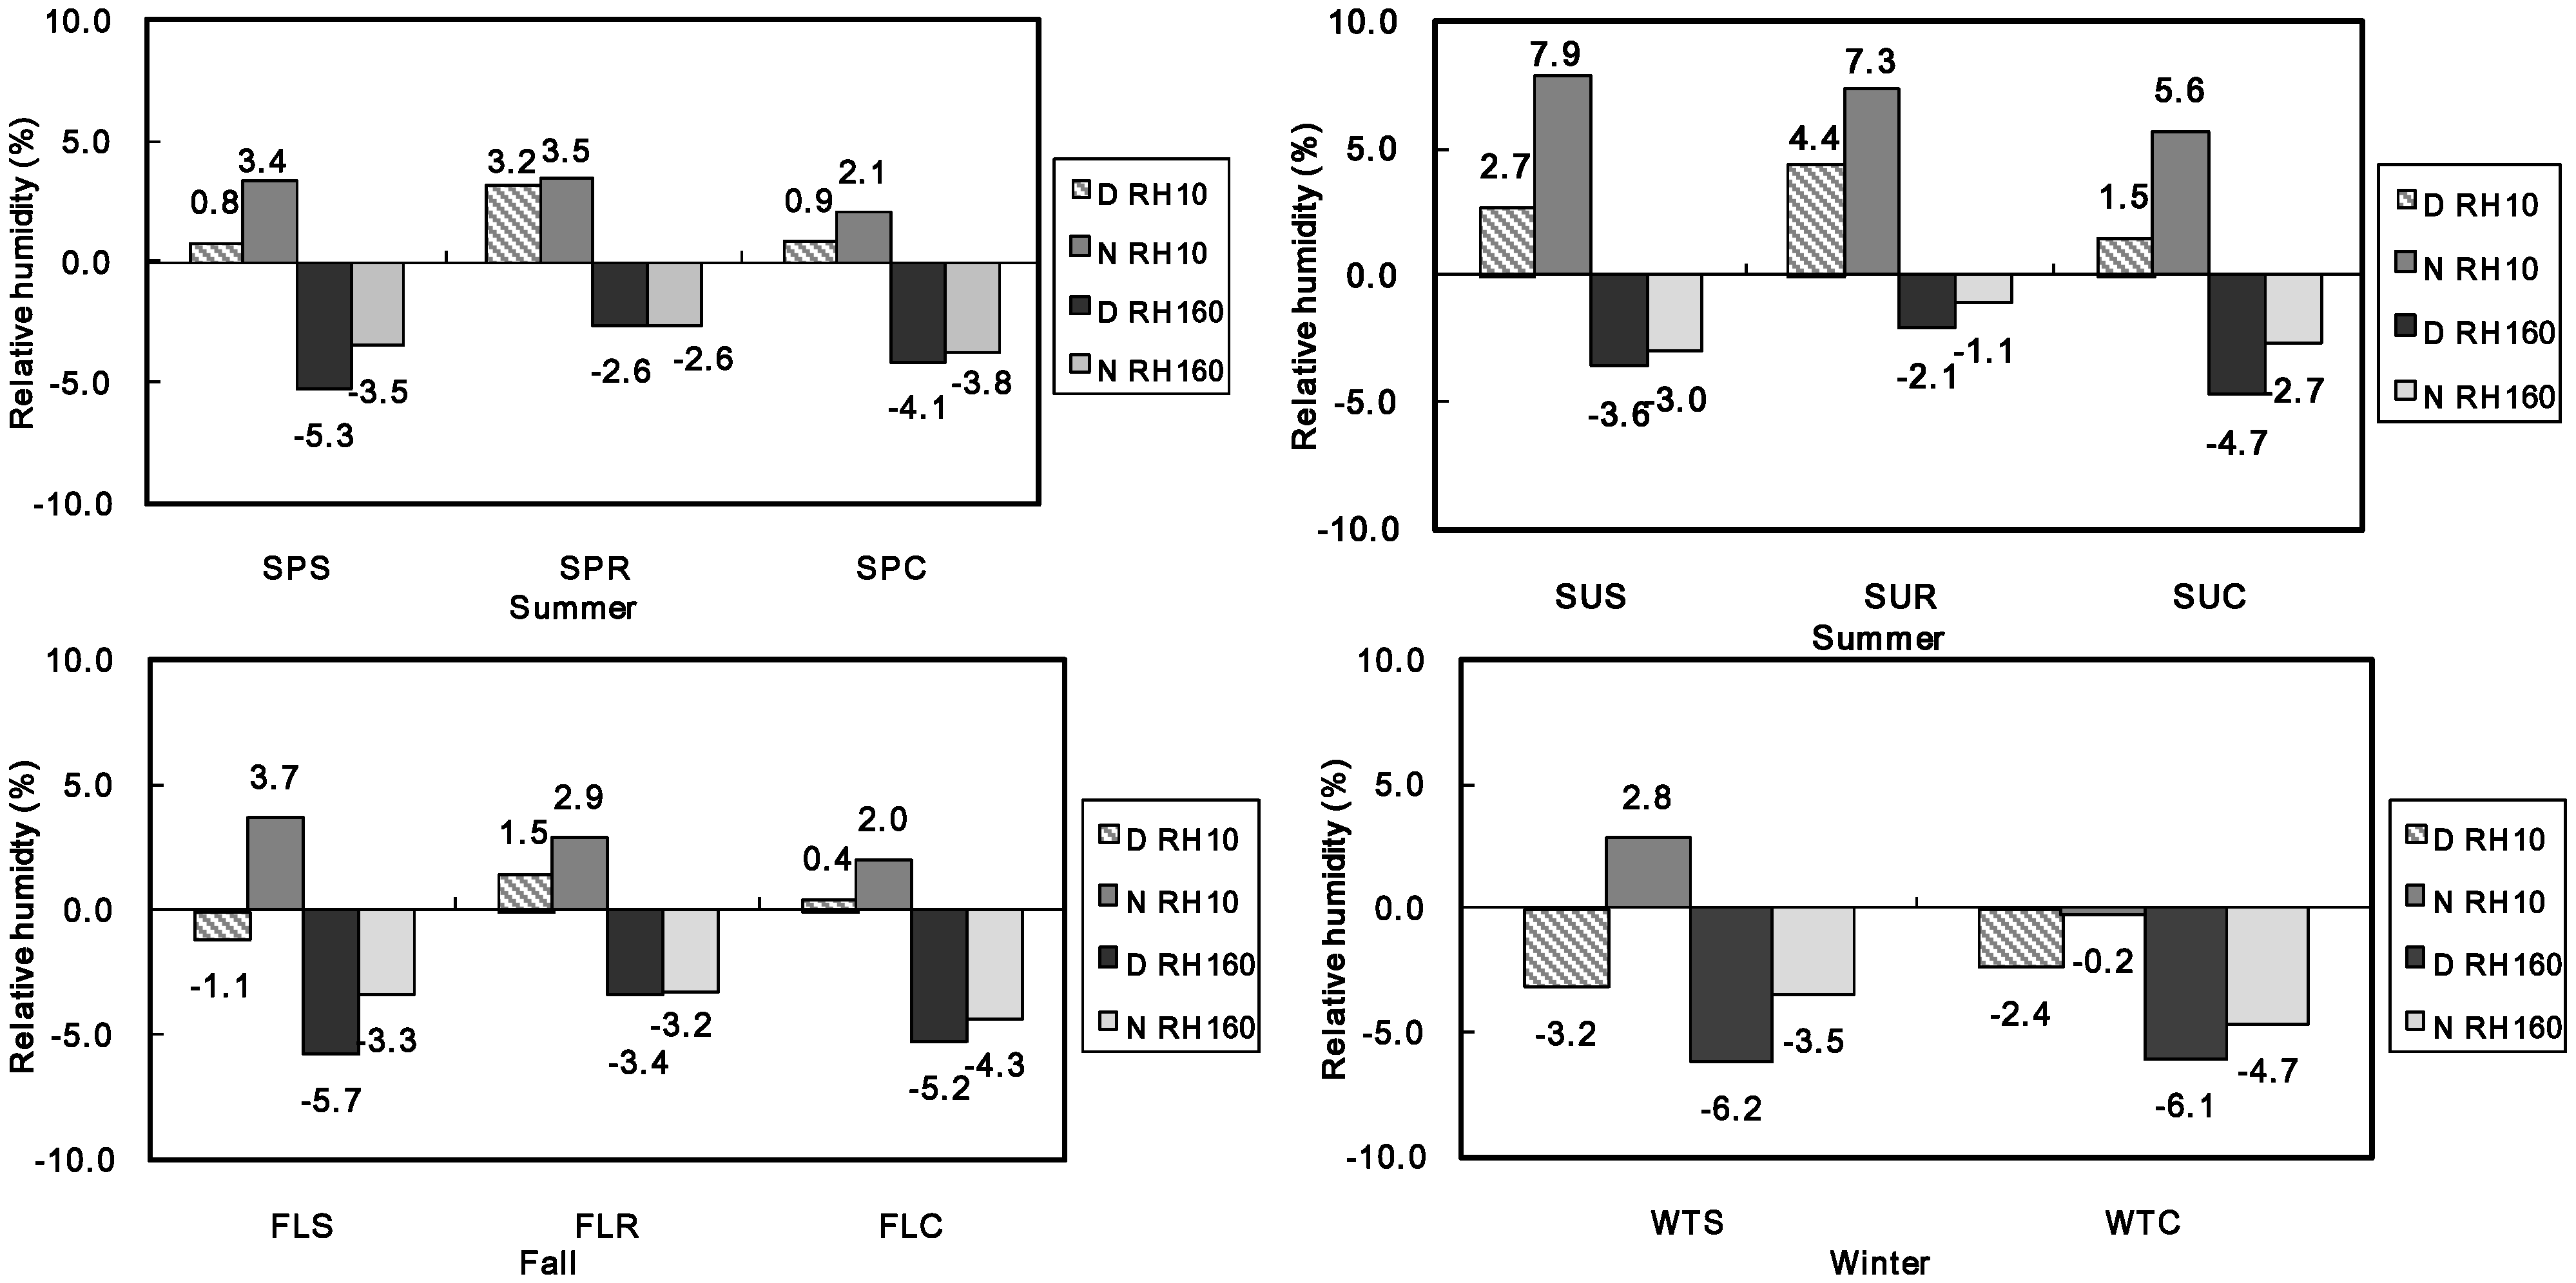
| Daytime | SPS | −0.6 ** | −0.2 | 0.8 * | −5.3 ** | −4.1 ** | 1.6 ** |
| SPR | −1.1 ** | −0.4 | 3.2 * | −2.6 ** | −0.7 | 0.4 | |
| SPC | −0.5 ** | −0.3 | 0.9 | −4.1 ** | −2.1 ** | 1.0 ** | |
| SUS | −0.9 ** | −0.7 ** | 2.7 ** | −3.6 ** | −7.9 ** | 2.2 ** | |
| SUR | −1.3 ** | −0.5 ** | 4.4 ** | −2.1 ** | −1.1 ** | 1.8 ** | |
| SUC | −0.8 | −0.2 | 1.5 | −4.7 ** | −1.4 | 2.0 | |
| FLS | −0.2 | 0.1 | −1.1 ** | −5.7 ** | −5.8 ** | 1.7 ** | |
| FLR | −0.6 | −0.1 | 1.5 | −3.4 ** | 1.3 | 0.2 | |
| FLC | −0.6 * | 0.1 | 0.4 | −5.2 ** | −2.9 ** | 0.3 | |
| WTS | 0.8 ** | 0.3 ** | −3.2 ** | −6.2 ** | −4.3 ** | 2.7 ** | |
| WTC | 0.5 ** | 0.6 ** | −2.4 ** | −6.1 ** | −0.7 ** | 2.1 ** | |
| Nighttime | SPS | −1.6 ** | −0.5 ** | 3.4 ** | −3.5 ** | 2.7 ** | 0.3 ** |
| SPR | −1.3 ** | −0.2 * | 3.5 ** | −2.6 ** | 2.1 ** | 0.6 ** | |
| SPC | −1.1 ** | −0.2 ** | 2.1 ** | −3.8 ** | 2.0 ** | 0.6 ** | |
| SUS | −2.9 ** | −0.6 ** | 7.9 ** | −3.0 ** | 0.9 ** | 2.3 ** | |
| SUR | −2.3 ** | −0.7 ** | 7.3 ** | −1.1 ** | 0.8 ** | 2.0 ** | |
| SUC | −2.2 ** | −0.6 * | 5.6 ** | −2.7 ** | −0.2 ** | 2.6 | |
| FLS | −1.9 ** | −0.4 ** | 3.7 ** | −3.3 ** | 1.3 ** | −0.4 ** | |
| FLR | −1.2 * | −0.1 | 2.9 | −3.2 ** | 3.0 * | −0.4 | |
| FLC | −1.2 ** | −0.1 | 2.0 * | −4.3 ** | 0.7 | −0.3 | |
| WTS | −1.5 ** | −0.3 ** | 2.8 ** | −3.5 ** | 2.0 ** | 0.8 ** | |
| WTC | −0.5 ** | 0.2 | −0.2 | −4.7 ** | 1.2 ** | 1.2 ** |
3.2. Air Temperature
3.3. Relative Humidity
3.4. Canopy Surface Temperature (Tv)
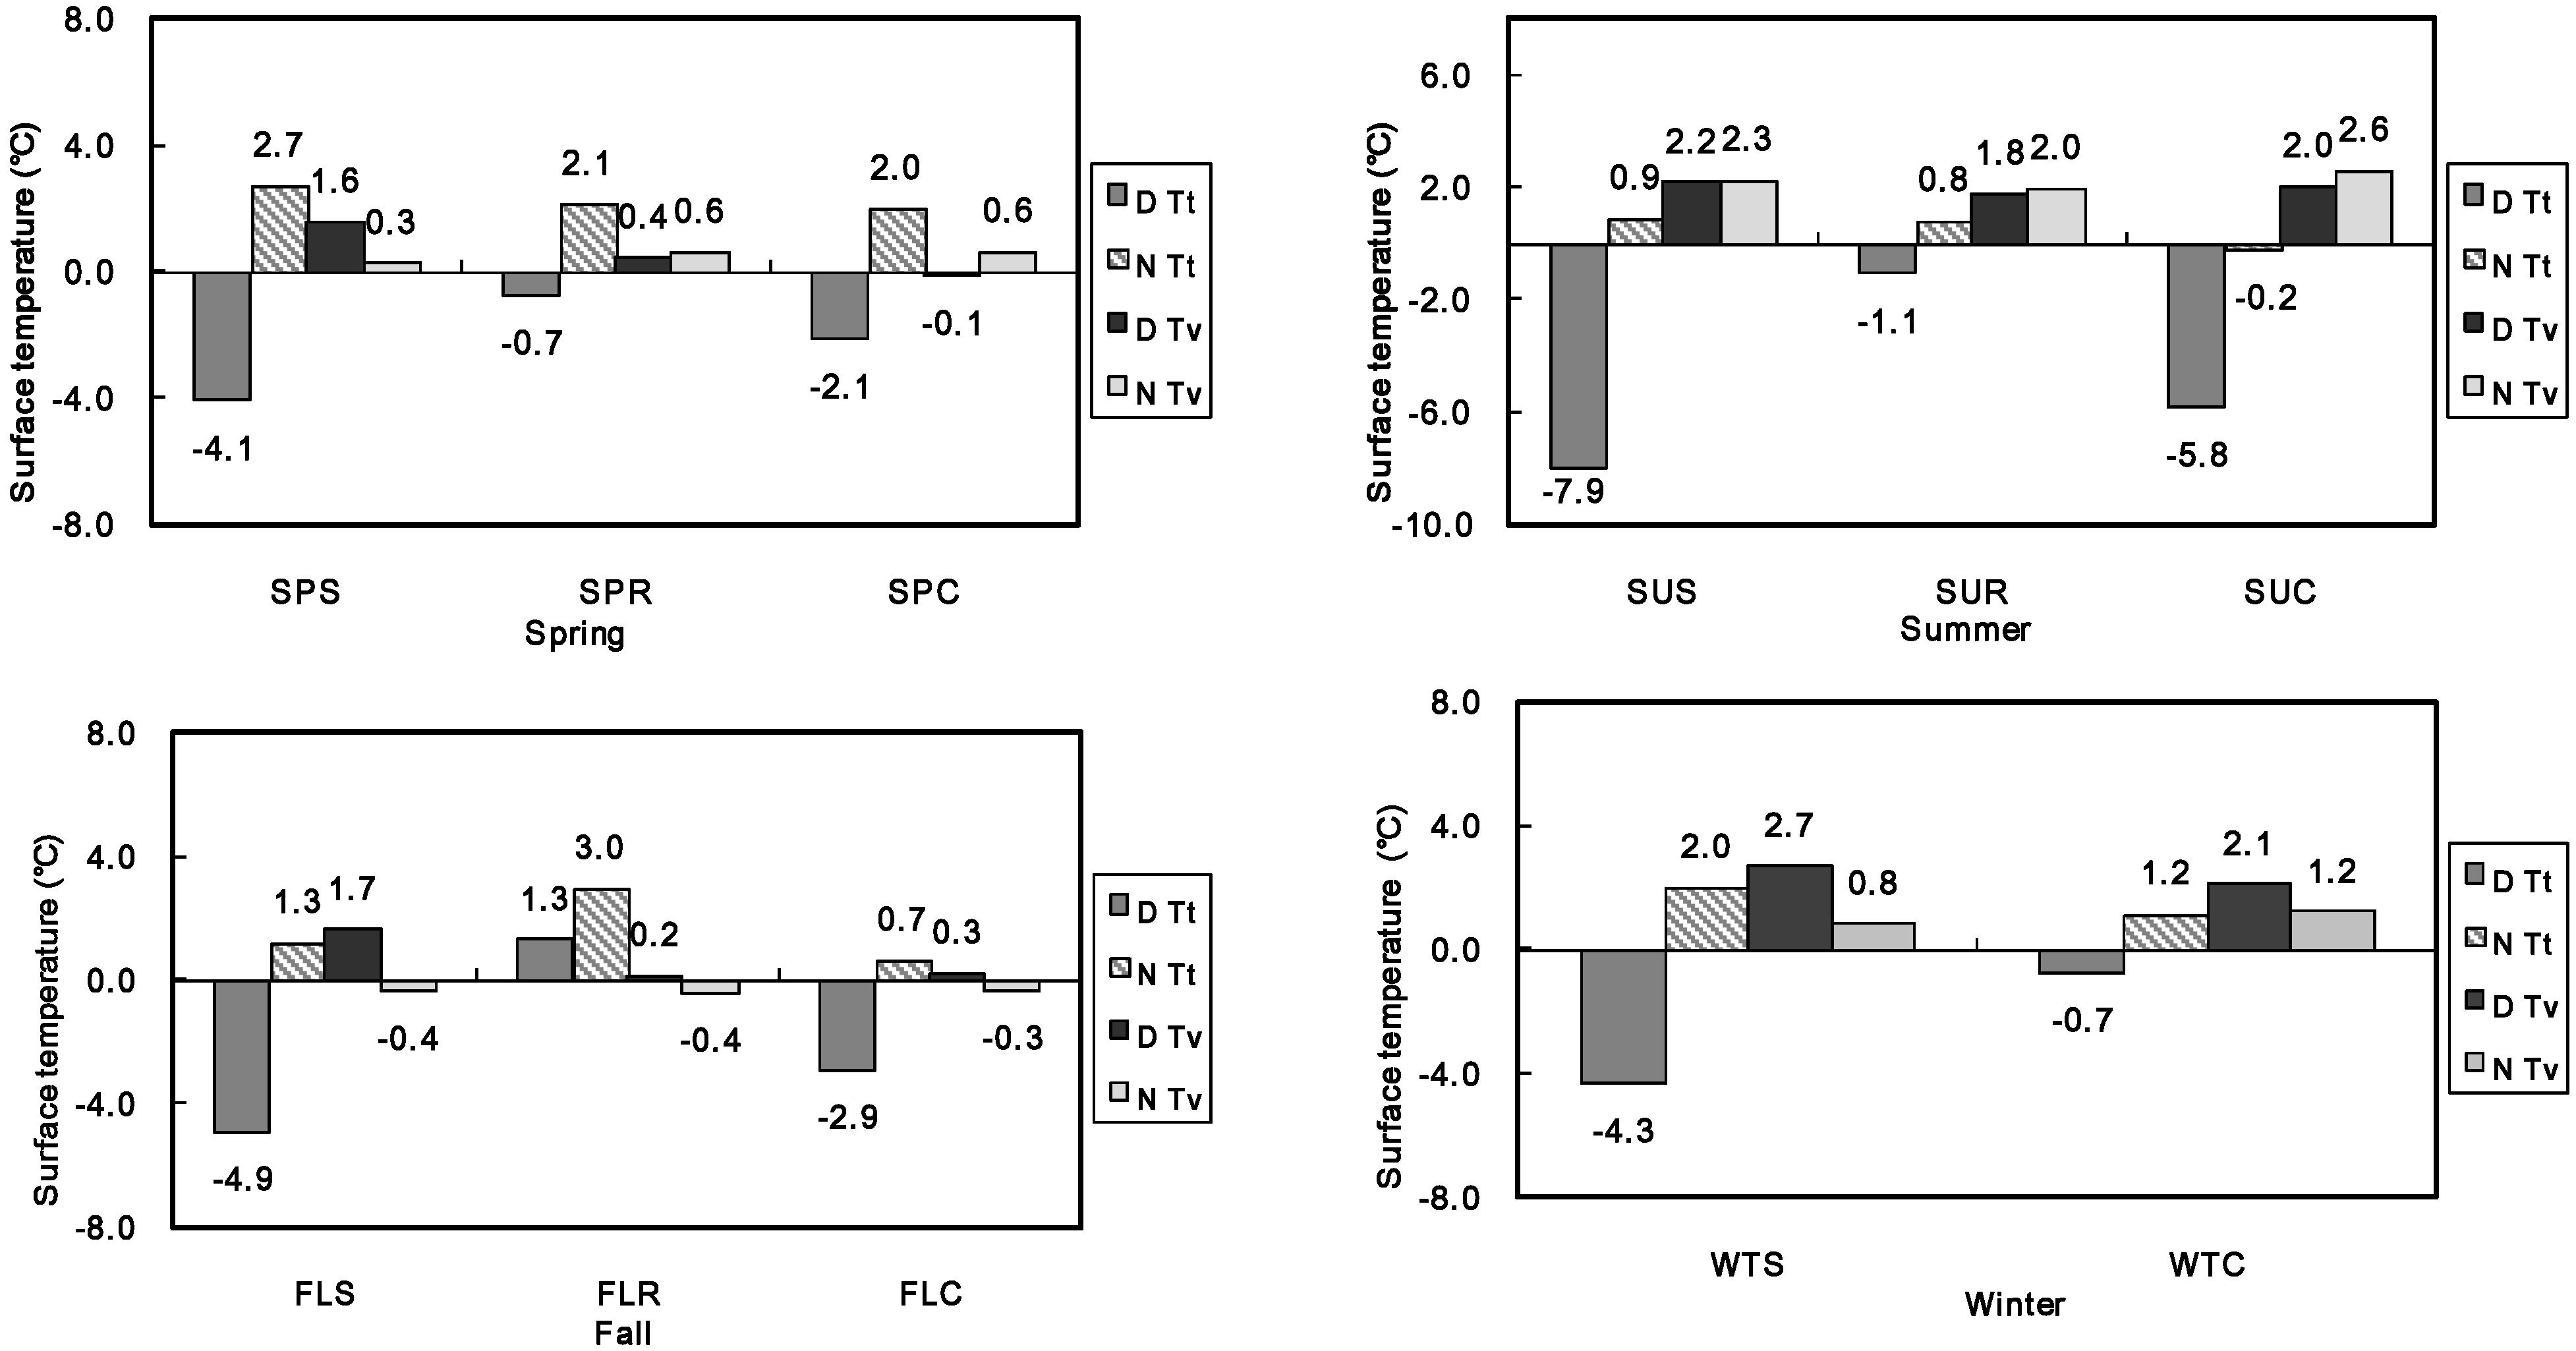
3.5. Concrete Tile Surface Temperature (Tt)
4. Thermal-Effect Prediction Models
| Weather parameter/thermal indicator | T10 | Tt | Tv | RH10 | ||||
|---|---|---|---|---|---|---|---|---|
| DT | NT | DT | NT | DT | NT | DT | NT | |
| SR | −0.001 ** | –– | −0.01 ** | –– | −0.002 ** | –– | 0.005 ** | –– |
| (−0.16) | (−0.48) | (−0.17) | (0.22) | |||||
| Ta | −0.15 ** | −0.14 ** | −0.19 ** | −0.08 ** | −0.17 ** | −0.15 ** | 0.40 ** | 0.45 ** |
| (−0.62) | (−0.84) | (-3.43) | (−0.30) | (−0.59) | (−0.90) | (0.59) | (0.80) | |
| RH | −0.03 ** | 0.02 ** | 0.08 ** | - | −0.03 ** | 0.02 ** | 0.11 ** | - |
| (−0.29) | (0.19) | (0.35) | (−0.3) | (0.18) | (0.40) | |||
| WS | −0.3 ** | 0.39 ** | 0.59 ** | - | −0.4 ** | 0.23 ** | 0.56 * | −1.20 ** |
| (−0.14) | (0.32) | (0.11) | (−0.14) | (0.19) | (0.09) | (−0.30) | ||
| SM | 0.03 ** | 0.03 ** | - | −0.03 * | 0.05 ** | - | −0.07 ** | −0.07 ** |
| (−0.15) | (0.16) | (−0.13) | (0.17) | (−0.11) | (−0.14) | |||
| Constant | 4.14 | −1.25 | −3.5 | 4.29 | 5.73 | 1.47 | −15.1 | −2.5 |
| R2 | 0.72 | 0.73 | 0.72 | 0.08 | 0.72 | 0.7 | 0.74 | 0.72 |
5. Conclusions
Acknowledgments
Author Contributions
Conflicts of Interest
References
- Demuzere, M.; Orru, K.; Heidrich, O.; Olazabal, E.; Geneletti, D.; Orru, H.; Bhave, A.G.; Mittal, N.; Feliu, E.; Faehnle, M. Mitigating and adapting to climate change: Multi-functional and multi-scale assessment of green urban infrastructure. J. Environ. Manag. 2014, 146, 107–115. [Google Scholar] [CrossRef] [PubMed]
- Hallegatte, S.; Corfee-Morlot, J. Understanding climate change impacts, vulnerability and adaptation at city scale: An introduction. Clim. Change 2011, 104, 1–12. [Google Scholar] [CrossRef]
- Pisello, A.L.; Piselli, C.; Cotana, F. Thermal-physics and energy performance of an innovative green roof system: The Cool-Green Roof. Sol. Energy 2015, 116, 337–356. [Google Scholar] [CrossRef]
- Gao, Y.; Xu, J.; Yang, S.; Tang, X.; Zhou, Q.; Ge, J.; Xu, T.; Levinson, R. Cool roofs in China: Policy review, building simulations, and proof-of-concept experiments. Energy Policy 2014, 74, 190–214. [Google Scholar] [CrossRef]
- Gilbert, H.; Mandel, B.H.; Levinson, R. Keeping California cool: Recent cool community developments. Energy Build. 2015. [Google Scholar] [CrossRef]
- Salata, F.; Golasi, I.; Vollaro, A.D.L.; Vollaro, R.D.L. How high albedo and traditional buildings’ materials and vegetation affect the quality of urban microclimate. A case study. Energy Build. 2015, 99, 32–49. [Google Scholar] [CrossRef]
- Jim, C.Y.; Peng, L.L.H. Weather effect on thermal and energy performance of an extensive tropical green roof. Urban For. Urban Green. 2012, 11, 73–85. [Google Scholar] [CrossRef]
- Peng, L.L.H.; Jim, C.Y. Economic evaluation of green-roof environmental benefits in the context of climate change: The case of Hong Kong. Urban For. Urban Green. 2015, 14, 554–561. [Google Scholar] [CrossRef]
- Onmura, S.; Matsumoto, M.; Hokoi, S. Study on evaporative cooling effect of roof lawn gardens. Energy Build. 2001, 33, 653–666. [Google Scholar] [CrossRef]
- Wong, N.H.; Chen, Y.; Ong, C.L.; Sia, A. Investigation of thermal benefits of rooftop garden in the tropical environment. Build. Environ. 2003, 38, 261–270. [Google Scholar] [CrossRef]
- Sonne, J.K. Evaluating Green Roof Energy Performance. ASHRAE J. 2006, 48, 59–61. [Google Scholar]
- Wong, N.H.; Puay Yok, T.; Yu, C. Study of thermal performance of extensive rooftop greenery systems in the tropical climate. Build. Environ. 2007, 42, 25–54. [Google Scholar]
- Santamouris, M.; Pavlou, C.; Doukas, P.; Mihalakakou, G.; Synnefa, A.; Hatzibiros, A.; Patargias, P. Investigating and analyzing the energy and environmental performance of an experimental green roof system installed in a nursery school building in Athens, Greece. Energy 2007, 32, 1781–1788. [Google Scholar] [CrossRef]
- Simmons, M.T.; Gardiner, B.; Windhager, S.; Tinsley, J. Green roofs are not created equal: the hydrologic and thermal performance of six different extensive green roofs and reflective and non-reflective roofs in a sub-tropical climate. Urban Ecosyst. 2008, 11, 339–348. [Google Scholar] [CrossRef]
- Spala, A.; Bagiorgas, H.S.; Assimakopoulos, M.N.; Kalavrouziotis, J.; Matthopoulos, D.; Mihalakakou, G. On the green roof system. Selection, state of the art and energy potential investigation of a system installed in an office building in Athens, Greece. Renew. Energy 2008, 33, 173–177. [Google Scholar] [CrossRef]
- Spolek, G. Performance monitoring of three ecoroofs in Portland, Oregon. Urban Ecosyst. 2008, 11, 349–359. [Google Scholar] [CrossRef]
- Eumorfopoulou, E.A.; Kontoleon, K.J. Experimental approach to the contribution of plant-covered walls to the thermal behaviour of building envelopes. Build. Environ. 2009, 44, 1024–1038. [Google Scholar] [CrossRef]
- Teemusk, A.; Mander, U. Greenroof potential to reduce temperature fluctuations of a roof membrane: A case study from Estonia. Build. Environ. 2009, 44, 643–650. [Google Scholar] [CrossRef]
- Jim, C.Y.; Peng, L.L.H. Substrate moisture effects on water balance and thermal performance of a tropical green roof. Eco. Eng. 2012, 47, 9–23. [Google Scholar] [CrossRef]
- Jim, C.Y. Air-conditioning energy consumption due to green roofs with different building thermal insulation. Appl. Energy 2014, 128, 49–59. [Google Scholar] [CrossRef]
- Jim, C.Y. Building thermal-insulation effect on ambient and indoor thermal performance of green roofs. Ecol. Eng. 2014, 69, 265–275. [Google Scholar] [CrossRef]
- Luo, H.; Wang, N.; Chen, J.P.; Ye, X.Y.; Sun, Y.F. Study on the thermal effects and air quality improvement of green roof. Sustainability 2015, 7, 2804–2817. [Google Scholar] [CrossRef]
- Kokogiannakis, G.; Darkwa, J. Support for the integration of green roof constructions within Chinese building energy performance policies. Energy 2014, 65, 71–79. [Google Scholar] [CrossRef]
- Kumar, R.; Kaushik, S.C. Performance evaluation of green roof and shading for thermal protection of buildings. Build. Environ. 2005, 40, 1505–1511. [Google Scholar] [CrossRef]
- Alexandri, E.; Jones, P. Developing a one-dimensional heat and mass transfer algorithm for describing the effect of green roofs on the built environment: comparison with experimental results. Build. Environ. 2007, 42, 2835–2849. [Google Scholar] [CrossRef]
- Sailor, D. A green roof model for building energy simulation programs. Energy Build. 2008, 40, 1466–1478. [Google Scholar] [CrossRef]
- Sun, T.; Bou-Zeid, E.; Ni, G.H. To irrigate or not to irrigate: Analysis of green roof performance via a vertically-resolved hygrothermal model. Build. Environ. 2014, 73, 127–137. [Google Scholar] [CrossRef]
- Klein, P.M.; Coffman, R. Establishment and performance of an experimental green roof under extreme climatic conditions. Sci. Total. Environ. 2015, 512–513, 82–93. [Google Scholar] [CrossRef] [PubMed]
- Bass, B.; Krayenhoff, S; Martilli, A.; Stull, R. Mitigating the urban heat island with green roof infrastructure. Urban Heat Isl. Summit 2002. [Google Scholar] [CrossRef]
- Banting, D.; Doshi, H.; Li, J.; Missios, P.; Au, A.; Currie, B.A.; Verrati, M. Report on the Environmental Benefits and Costs of Green Roof Technology for the City of Toronto; Ryerson University: Toronto, ON, Canada, 2005. [Google Scholar]
- Savio, P.; Rosenzweig, C.; Solecki, W.D.; Slosberg, R.B. Mitigating New York City’s Heat Island with Urban Forestry, Living Roofs, and Light Surfaces. New York City Regional Heat Island Initiative; The New York State Energy Research and Development Authority: Albany, NY, USA, 2006. [Google Scholar]
- Smith, K.; Roeber, P. Green roof mitigation potential for a proxy future climate scenario in Chicago, Illinois. J. Appl. Meteorol. Clim. 2011, 50, 507–522. [Google Scholar] [CrossRef]
- Chan, A.L.S.; Chow, T.T. Energy and economic performance of green roof system under future climatic conditions in Hong Kong. Energy Build. 2013, 64, 182–198. [Google Scholar] [CrossRef]
- Virk, G.; Jansz, A.; Mavrogianni, A.; Mylona, A.; Stocker, J.; Davies, M. Microclimatic effects of green and cool roofs in London and their impacts on energy use for a typical office building. Energy Build. 2015, 88, 214–228. [Google Scholar] [CrossRef]
- Raji, B.; Tenpieric, M.J.; Dobbelsteen, A.V.D. The impacts of greening systems on building energy performance: A literature review. Renew. Sustain. Energy Rev. 2015, 45, 610–623. [Google Scholar] [CrossRef]
- Santamouris, M. Cooling the cities- A review of reflective and green roof mitigation technologies to fight heat island and improve comfort in urban environments. Sol. Energy 2014, 103, 682–703. [Google Scholar] [CrossRef]
- Coutts, A. M.; Beringer, J.; Tapper, N.J. Impact of increasing urban density on local climate: spatial and temporal variations in the surface energy balance in Melbourne, Australia. J. Appl. Meteorol. Clim. 2007, 46, 477–493. [Google Scholar] [CrossRef]
- Speak, A.F.; Rothwell, J.J.; Lindley, S.J.; Smith, C.L. Reduction of the urban cooling effects of an intensive green roof due to vegetation damage. Urban Clim. 2013, 3, 40–55. [Google Scholar] [CrossRef]
- Siu, L.W. Quantifying the Urban Heat Island (UHI) Intensity in Hong Kong. MPhil Thesis, The University of Hong Kong, Hong Kong, China, 2011. [Google Scholar]
- Tian, Y.H.; Jim, C.Y. Development potential of sky gardens in the compact city of Hong Kong. Urban For. Urban Green. 2012, 11, 223–233. [Google Scholar] [CrossRef]
- Tian, Y.H.; Jim, C.Y.; Tao, Y. Challenges and Strategies for Greening the Compact City of Hong Kong. J. Urban. Plan. Dev. 2012, 138, 101–109. [Google Scholar] [CrossRef]
- Peng, L.L.H.; Jim, C.Y. Green-roof effects on neighborhood microclimate and human thermal sensation. Energies 2013, 6, 598–618. [Google Scholar] [CrossRef] [Green Version]
- Shan, X.Z.; Yu, X.J. Citizen assessment as policy tool of urban public services, empirical evidence from assessment of urban green spaces in China. Sustainability 2014, 6, 7833–7849. [Google Scholar] [CrossRef]
© 2015 by the authors; licensee MDPI, Basel, Switzerland. This article is an open access article distributed under the terms and conditions of the Creative Commons Attribution license (http://creativecommons.org/licenses/by/4.0/).
Share and Cite
Peng, L.L.H.; Jim, C.Y. Seasonal and Diurnal Thermal Performance of a Subtropical Extensive Green Roof: The Impacts of Background Weather Parameters. Sustainability 2015, 7, 11098-11113. https://doi.org/10.3390/su70811098
Peng LLH, Jim CY. Seasonal and Diurnal Thermal Performance of a Subtropical Extensive Green Roof: The Impacts of Background Weather Parameters. Sustainability. 2015; 7(8):11098-11113. https://doi.org/10.3390/su70811098
Chicago/Turabian StylePeng, Lilliana L. H., and C. Y. Jim. 2015. "Seasonal and Diurnal Thermal Performance of a Subtropical Extensive Green Roof: The Impacts of Background Weather Parameters" Sustainability 7, no. 8: 11098-11113. https://doi.org/10.3390/su70811098