Article

Robust Priority for Strategic Environmental Assessment with Incomplete Information Using Multi-Criteria Decision Making Analysis

1
Department of Civil and Environmental System Engineering, Konkuk University, Seoul 143-701, Korea
2
Department of Civil and Environmental Engineering, Yonsei University, Seoul 120-749, Korea
*
Author to whom correspondence should be addressed.
Sustainability 2015, 7(8), 10233-10249; https://doi.org/10.3390/su70810233
Submission received: 22 May 2015 / Revised: 9 July 2015 / Accepted: 23 July 2015 / Published: 31 July 2015
(This article belongs to the Section Environmental Sustainability and Applications)

Abstract

:
This study investigates how the priority rankings for dam construction sites vary with multi-criteria decision making (MCDM) techniques and generation approaches for incomplete information. Strategic environmental assessment (SEA) seeks to recommend sustainable dam construction sites based on their environmental and ecological impacts in a long-term plan for dam construction (LPDC) in South Korea. However, if specific information is missing, the SEA is less useful for choosing a dam construction site. In this study, we applied AHP, ELECTRE III, PROMETHEE II and Compromise Programming as MCDM techniques, and used binomial and uniform distributions to generate missing information. We considered five dam site selection situations and compared the results as they depended on both MCDM techniques and information generation methods. The binomial generation method showed the most obvious priorities. All MCDM techniques showed similar priorities in the dam site selection results except for ELECTREE III. The results demonstrate that selecting an appropriate MCDM technique is more important than the data generation method. However, using binomial distribution to generate missing information is more effective in providing a robust priority than uniform distribution, which is a commonly used technique.

1. Introduction

Water facilities, such as dams, levees, and river barrages, have contributed to Korean economic development by supplying water, preventing flood damage, and providing hydropower. However, most government-led water resource projects have caused social conflicts since the late 1990s, when the Korean economic paradigm shifted from government-led development focused on economic growth to a free-market economy focused on quality of life and an environmentally friendly landscape. Since its development in the 1970s, environmental impact assessments (EIAs) have been introduced to many countries as an effective tool to foster harmony between development and conservation. EIAs have been implemented to estimate environmental effects, and they have generated awareness among engineers and planners of the importance of environmentally friendly development and conservation [1]. However, EIAs are usually implemented after a number of strategic decisions have already been made in high-level plans. Their inherent limitations, such as the challenges presented by projects that cause serious environmental damage, have been exposed [2]. Therefore, it is necessary to have a strategic approach to environmentally sound and sustainable development that includes consideration of environmental effects from the earliest stages of decision-making, including policy plan programs and strategic environmental assessments (SEAs).
SEA is widely used to describe systematic processes for analyzing environmental effects at the strategic level of decision-making processes, including policies, plans, and programs [3,4]. The SEA for Korea’s Long-term Plan for Dam Construction (LPDC) was implemented to ensure consistency in environmental considerations in the planning process and to support strategic decision-making (Figure 1). The SEA raised the effectiveness of the LPDC by increasing its environmental and social acceptance through the feedback of SEA results to the LPDC. The SEA process also improved the sustainability of the LPDC by improving consideration of environmental priorities in the evaluation of water supply alternatives and dam construction sites. Planners were encouraged to seek environmentally friendly and sustainable water resource development options. The SEA reminded dam planners to recognize characteristics that led to negative public opinion due to changes in environmental consciousness. Therefore, during the planning process, the SEA enabled the preferential consideration of politic alternatives for environmentally friendly and sustainable water resource development. The SEA produced a paradigm shift—from functional planning toward sustainable dam planning—that considered regional situations.
SEAs were introduced to Korea through the revision of relevant acts from 2004 to 2006. Consequently, many plans for water resource development were categorized as target areas for SEA implementation [5]. SEAs are generally understood as a process by which to assess the environmental impacts of a plan. They also provide alternatives for making appropriate decisions from an environmental point of view. SEAs are an effective approach to creating a balance between development and conservation by predicting and reviewing the environmental effects of policies and plans from the initial planning stages. SEAs have been applied in many countries, including Korea, as a tool for integrating environmental considerations into the planning, management, and decision-making processes for various infrastructures [5,6,7]. The SEA process necessarily incorporates multi-criteria decision-making (MCDM) methods. In dam planning, studies in several countries, including Korea, show that most considerations concern geological or hydrological elements rather than environmental or ecological elements [8,9,10,11]. Therefore, in this study we explored the robust prioritization of environmental and ecological influences in decision making based on incomplete information available from the SEA for dam planning. Particularly, we compare the priority results acquired using various MCDM methods, AHP, ELECTRE III, PROMETHEE II, and Compromise Programming. In addition, we examine the effects of various generation distribution approaches in selecting the most suitable dam sites. To generate missing input information, we applied the uniform distribution and binomial distribution. Finally, we investigated and compared the effects of the type of MCDM method and the generation methods for missing information to estimate robust prioritization of dam site selection.
Figure 1. LPDC planning process incorporating SEAs [5].
Sustainability 07 10233 g001

2. Methods

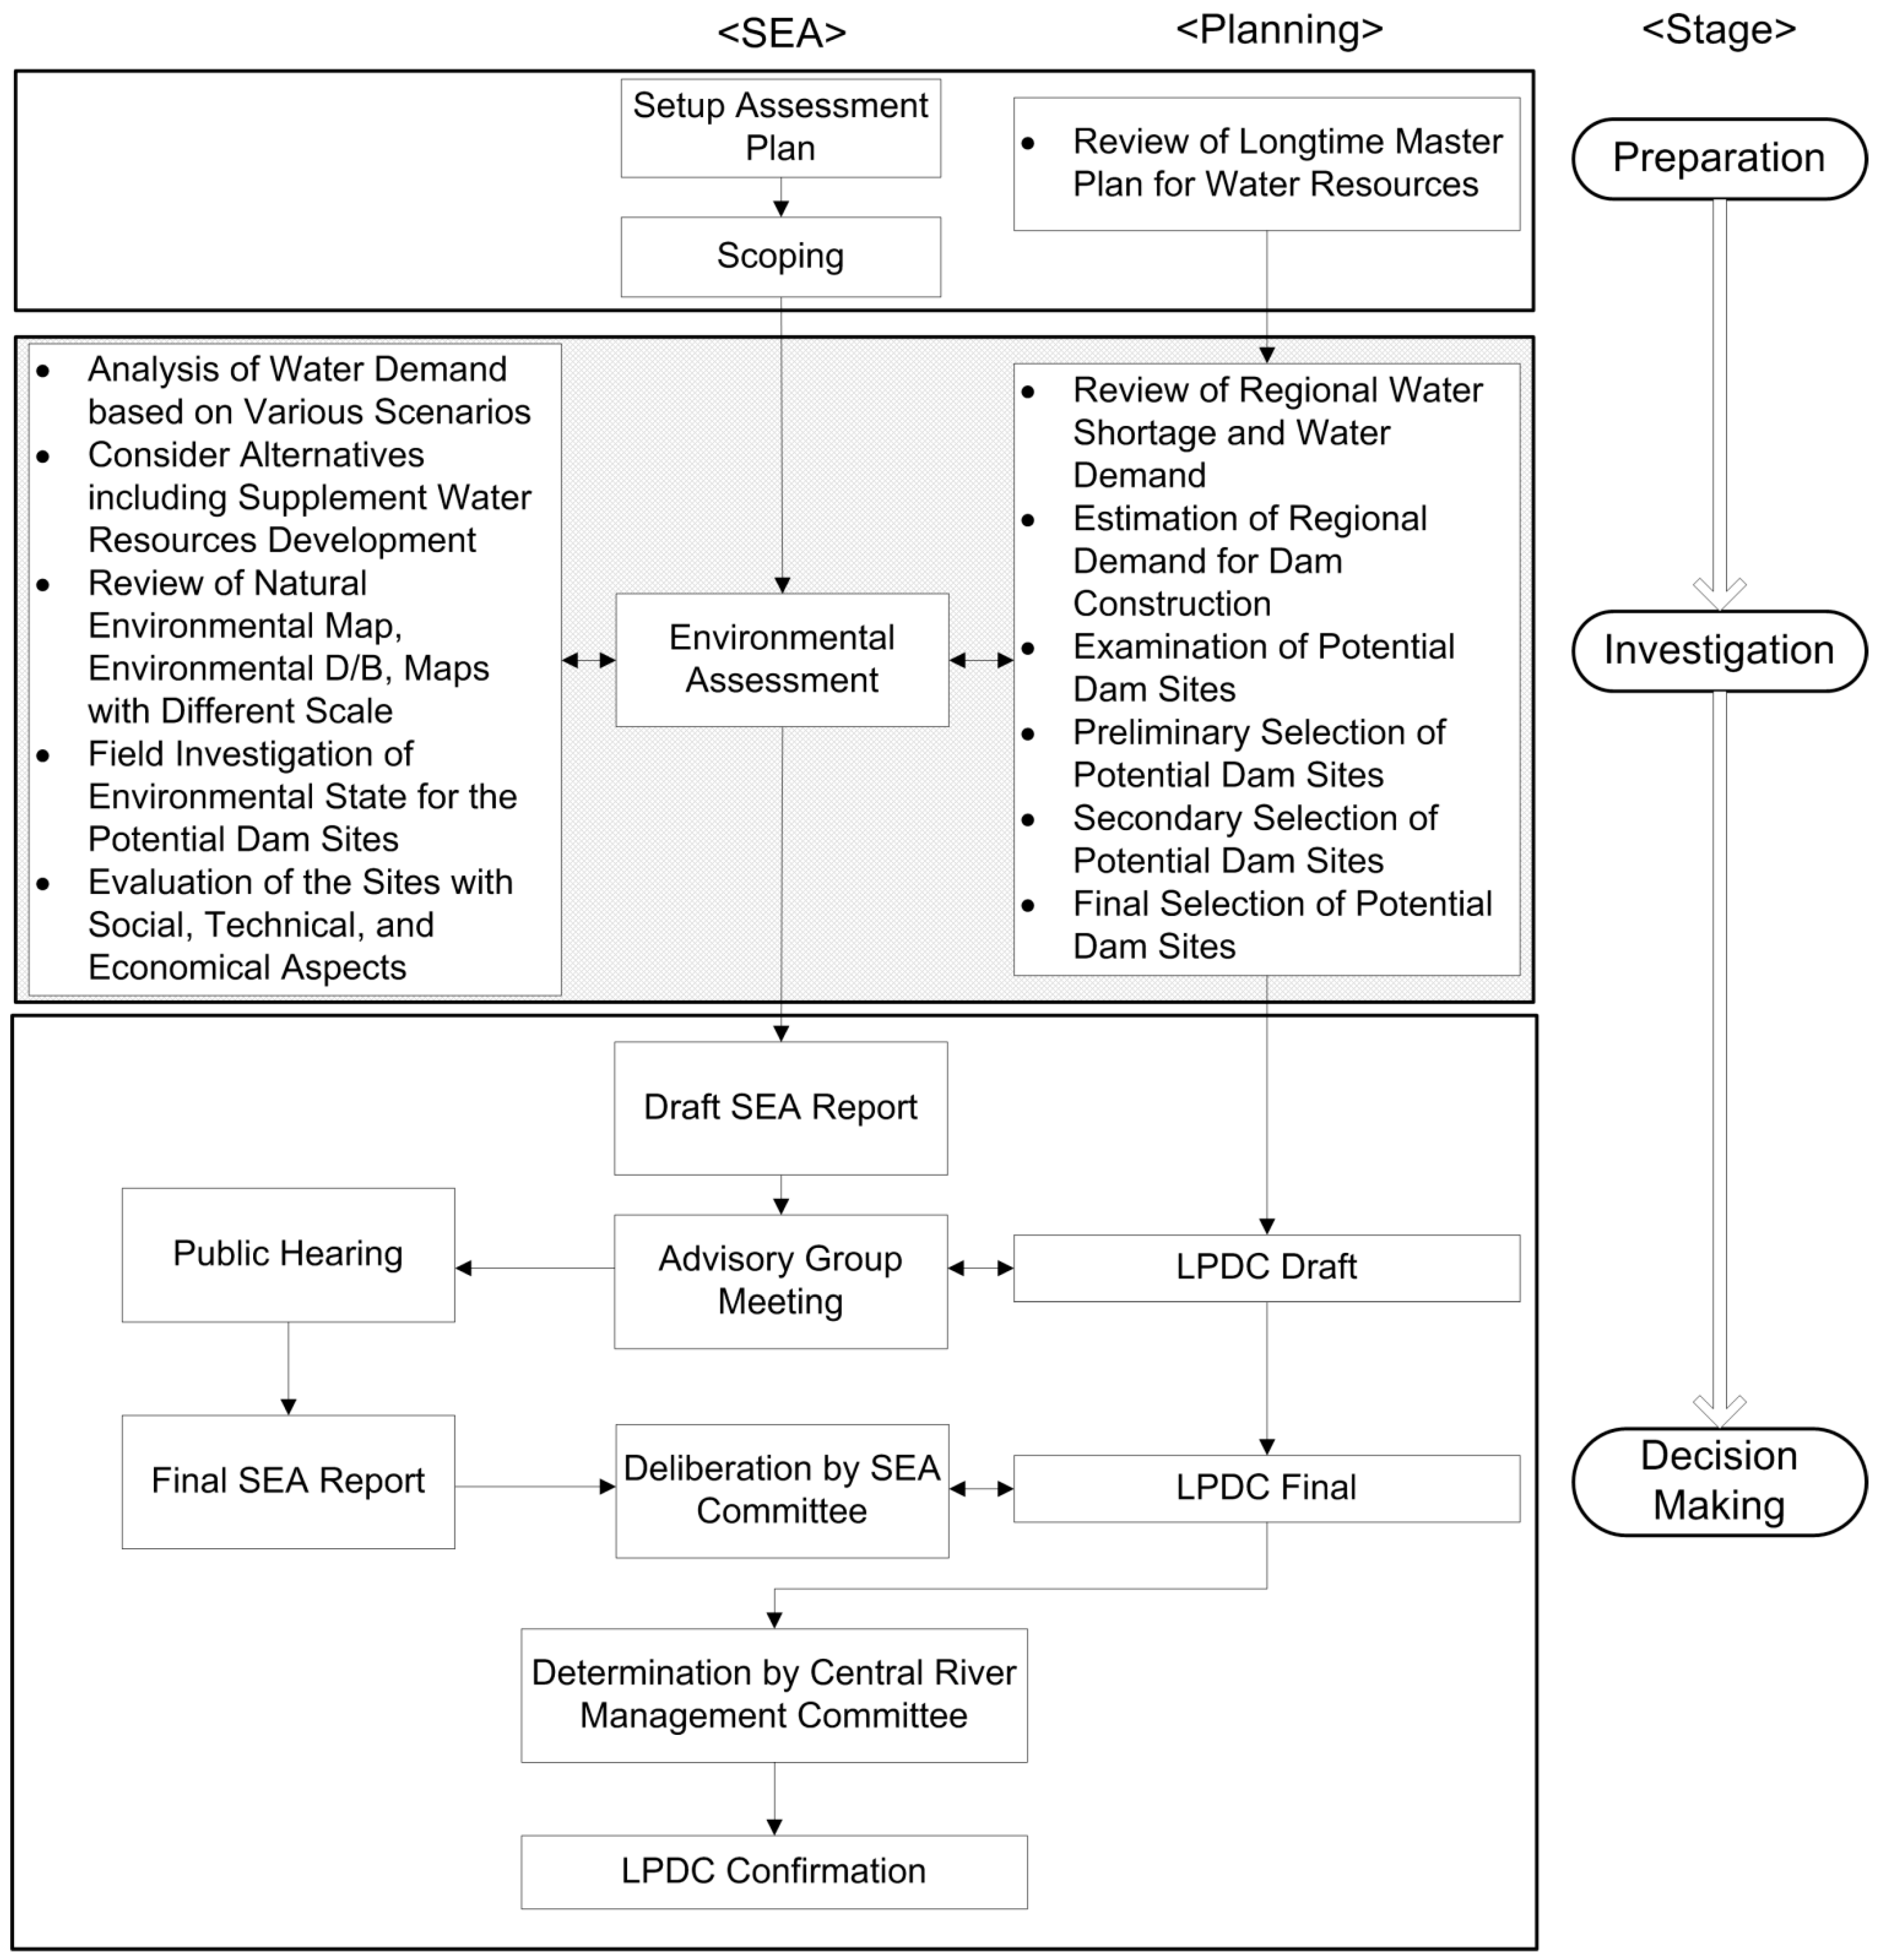
2.1. Candidate Site Selection

In Korea, the LPDC is established every 10 years and modified every five years. It requires implementation of an SEA. 
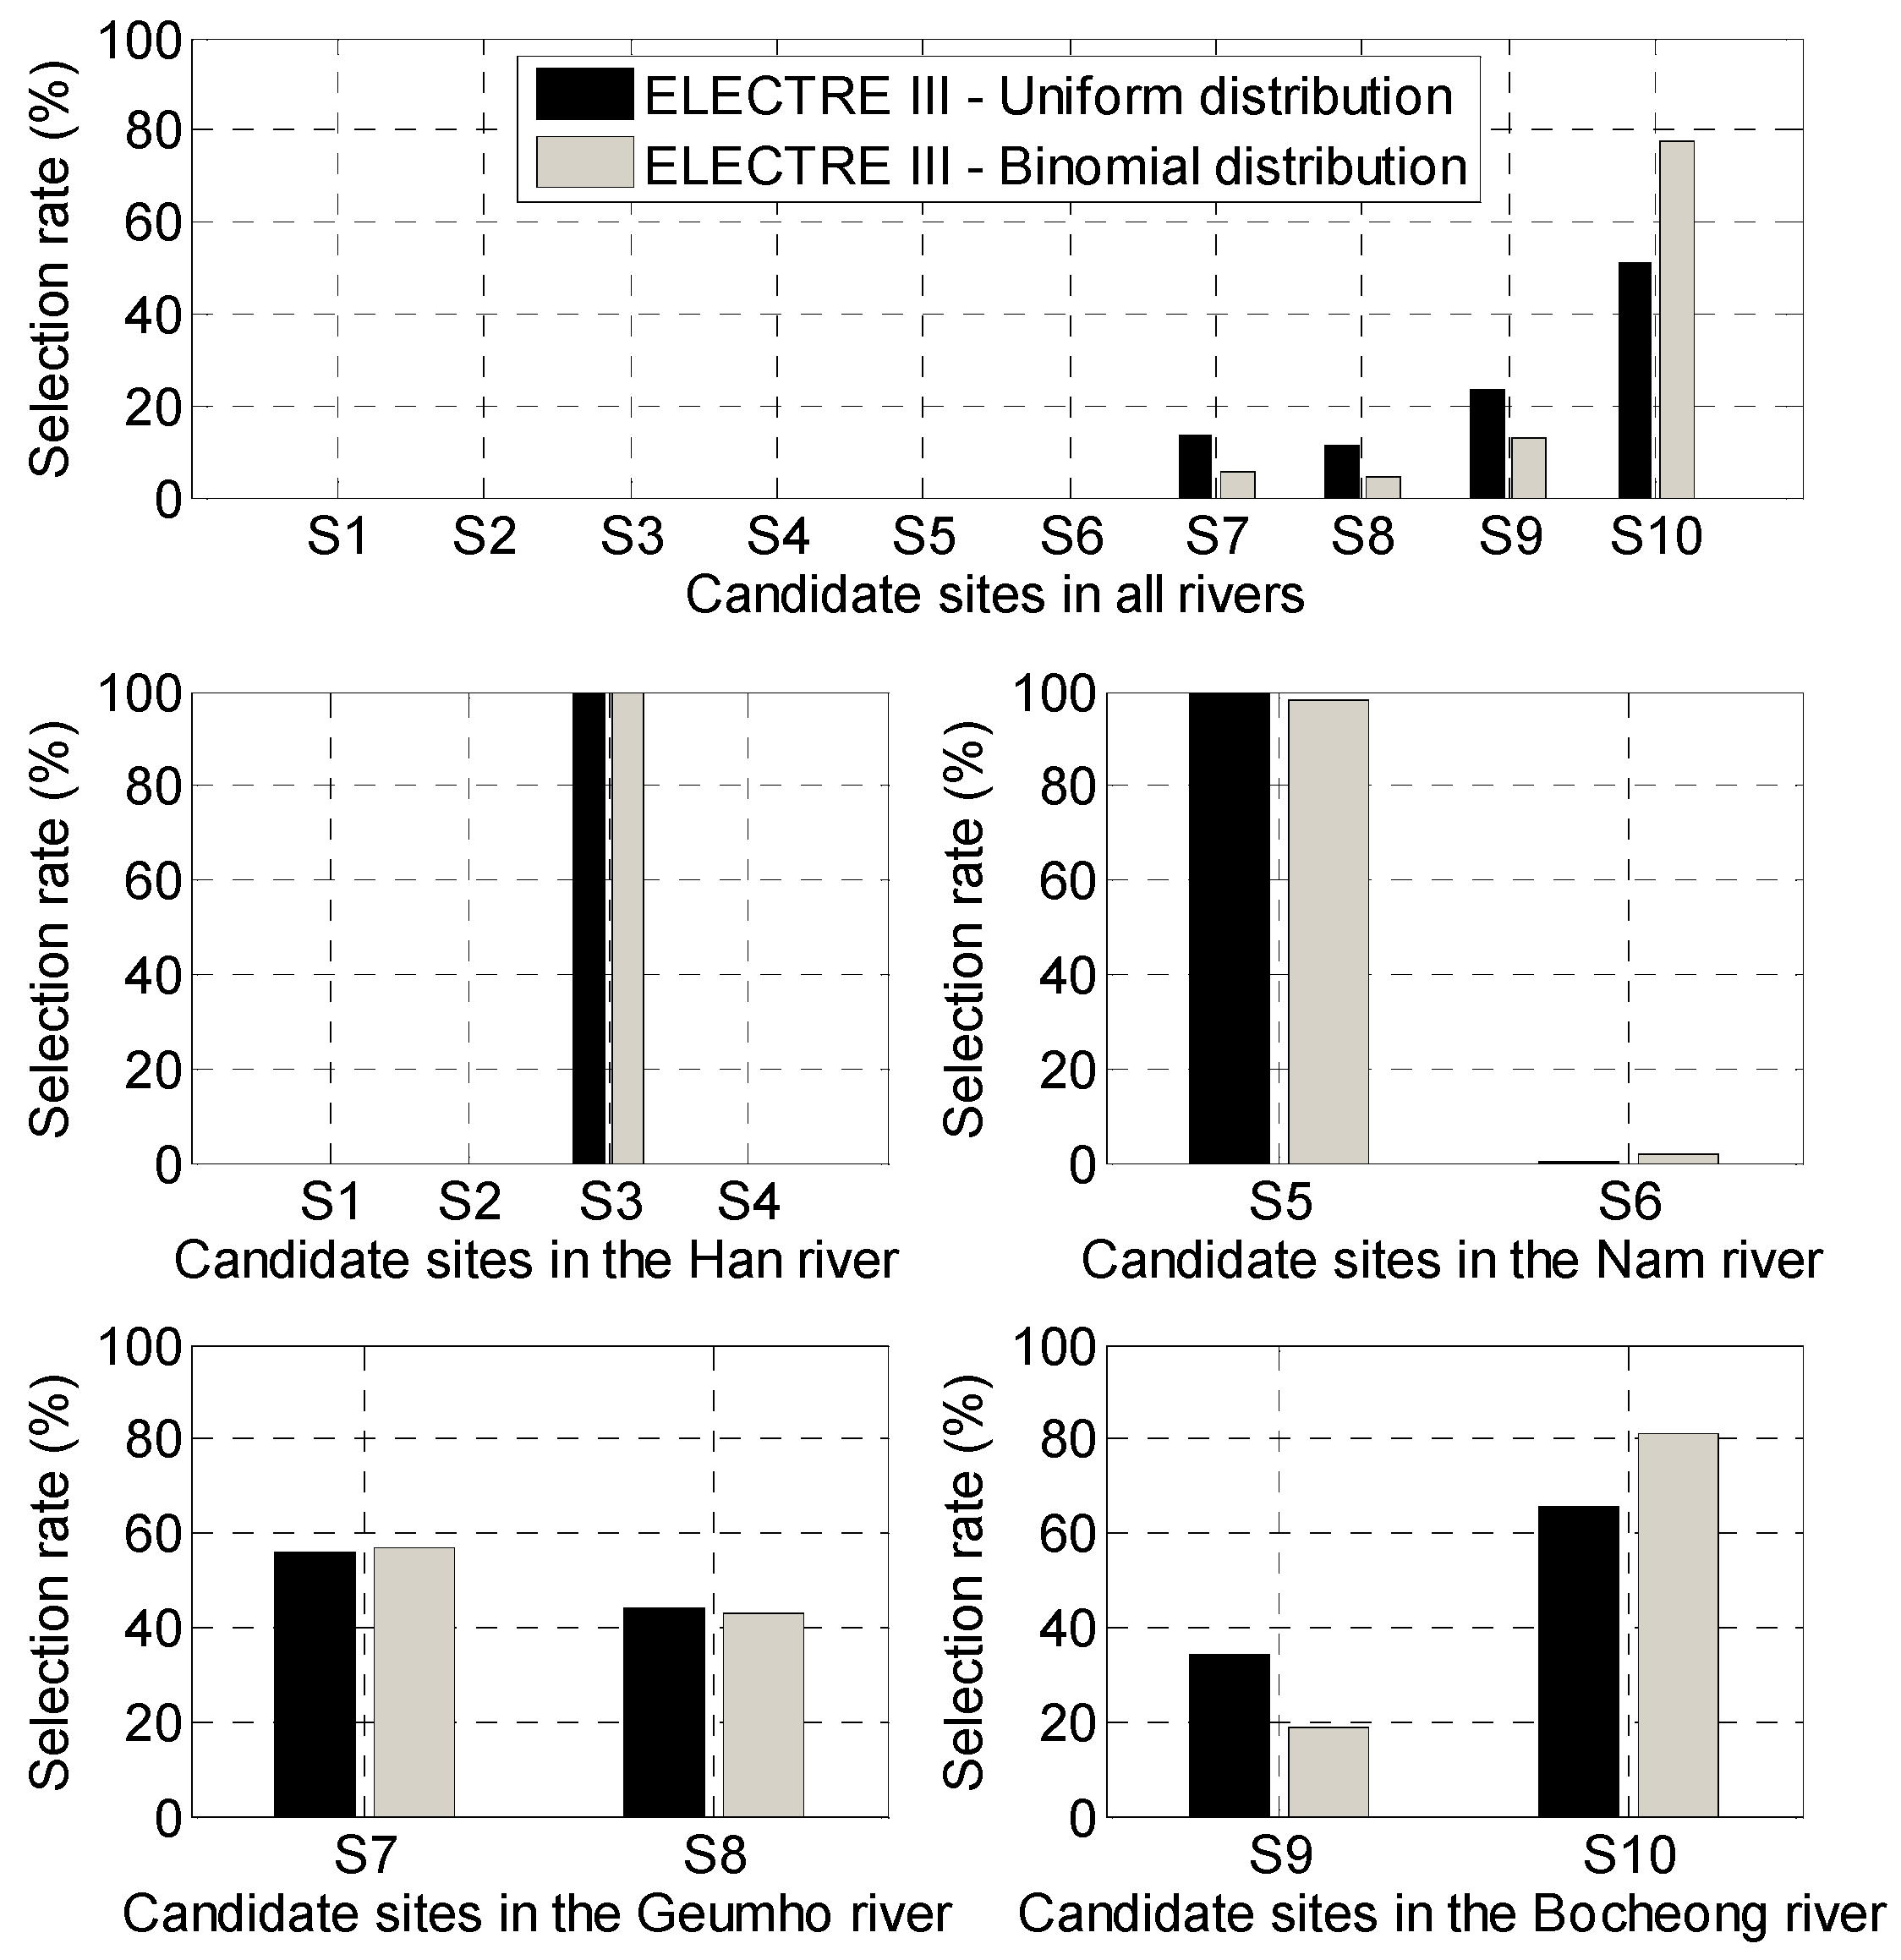
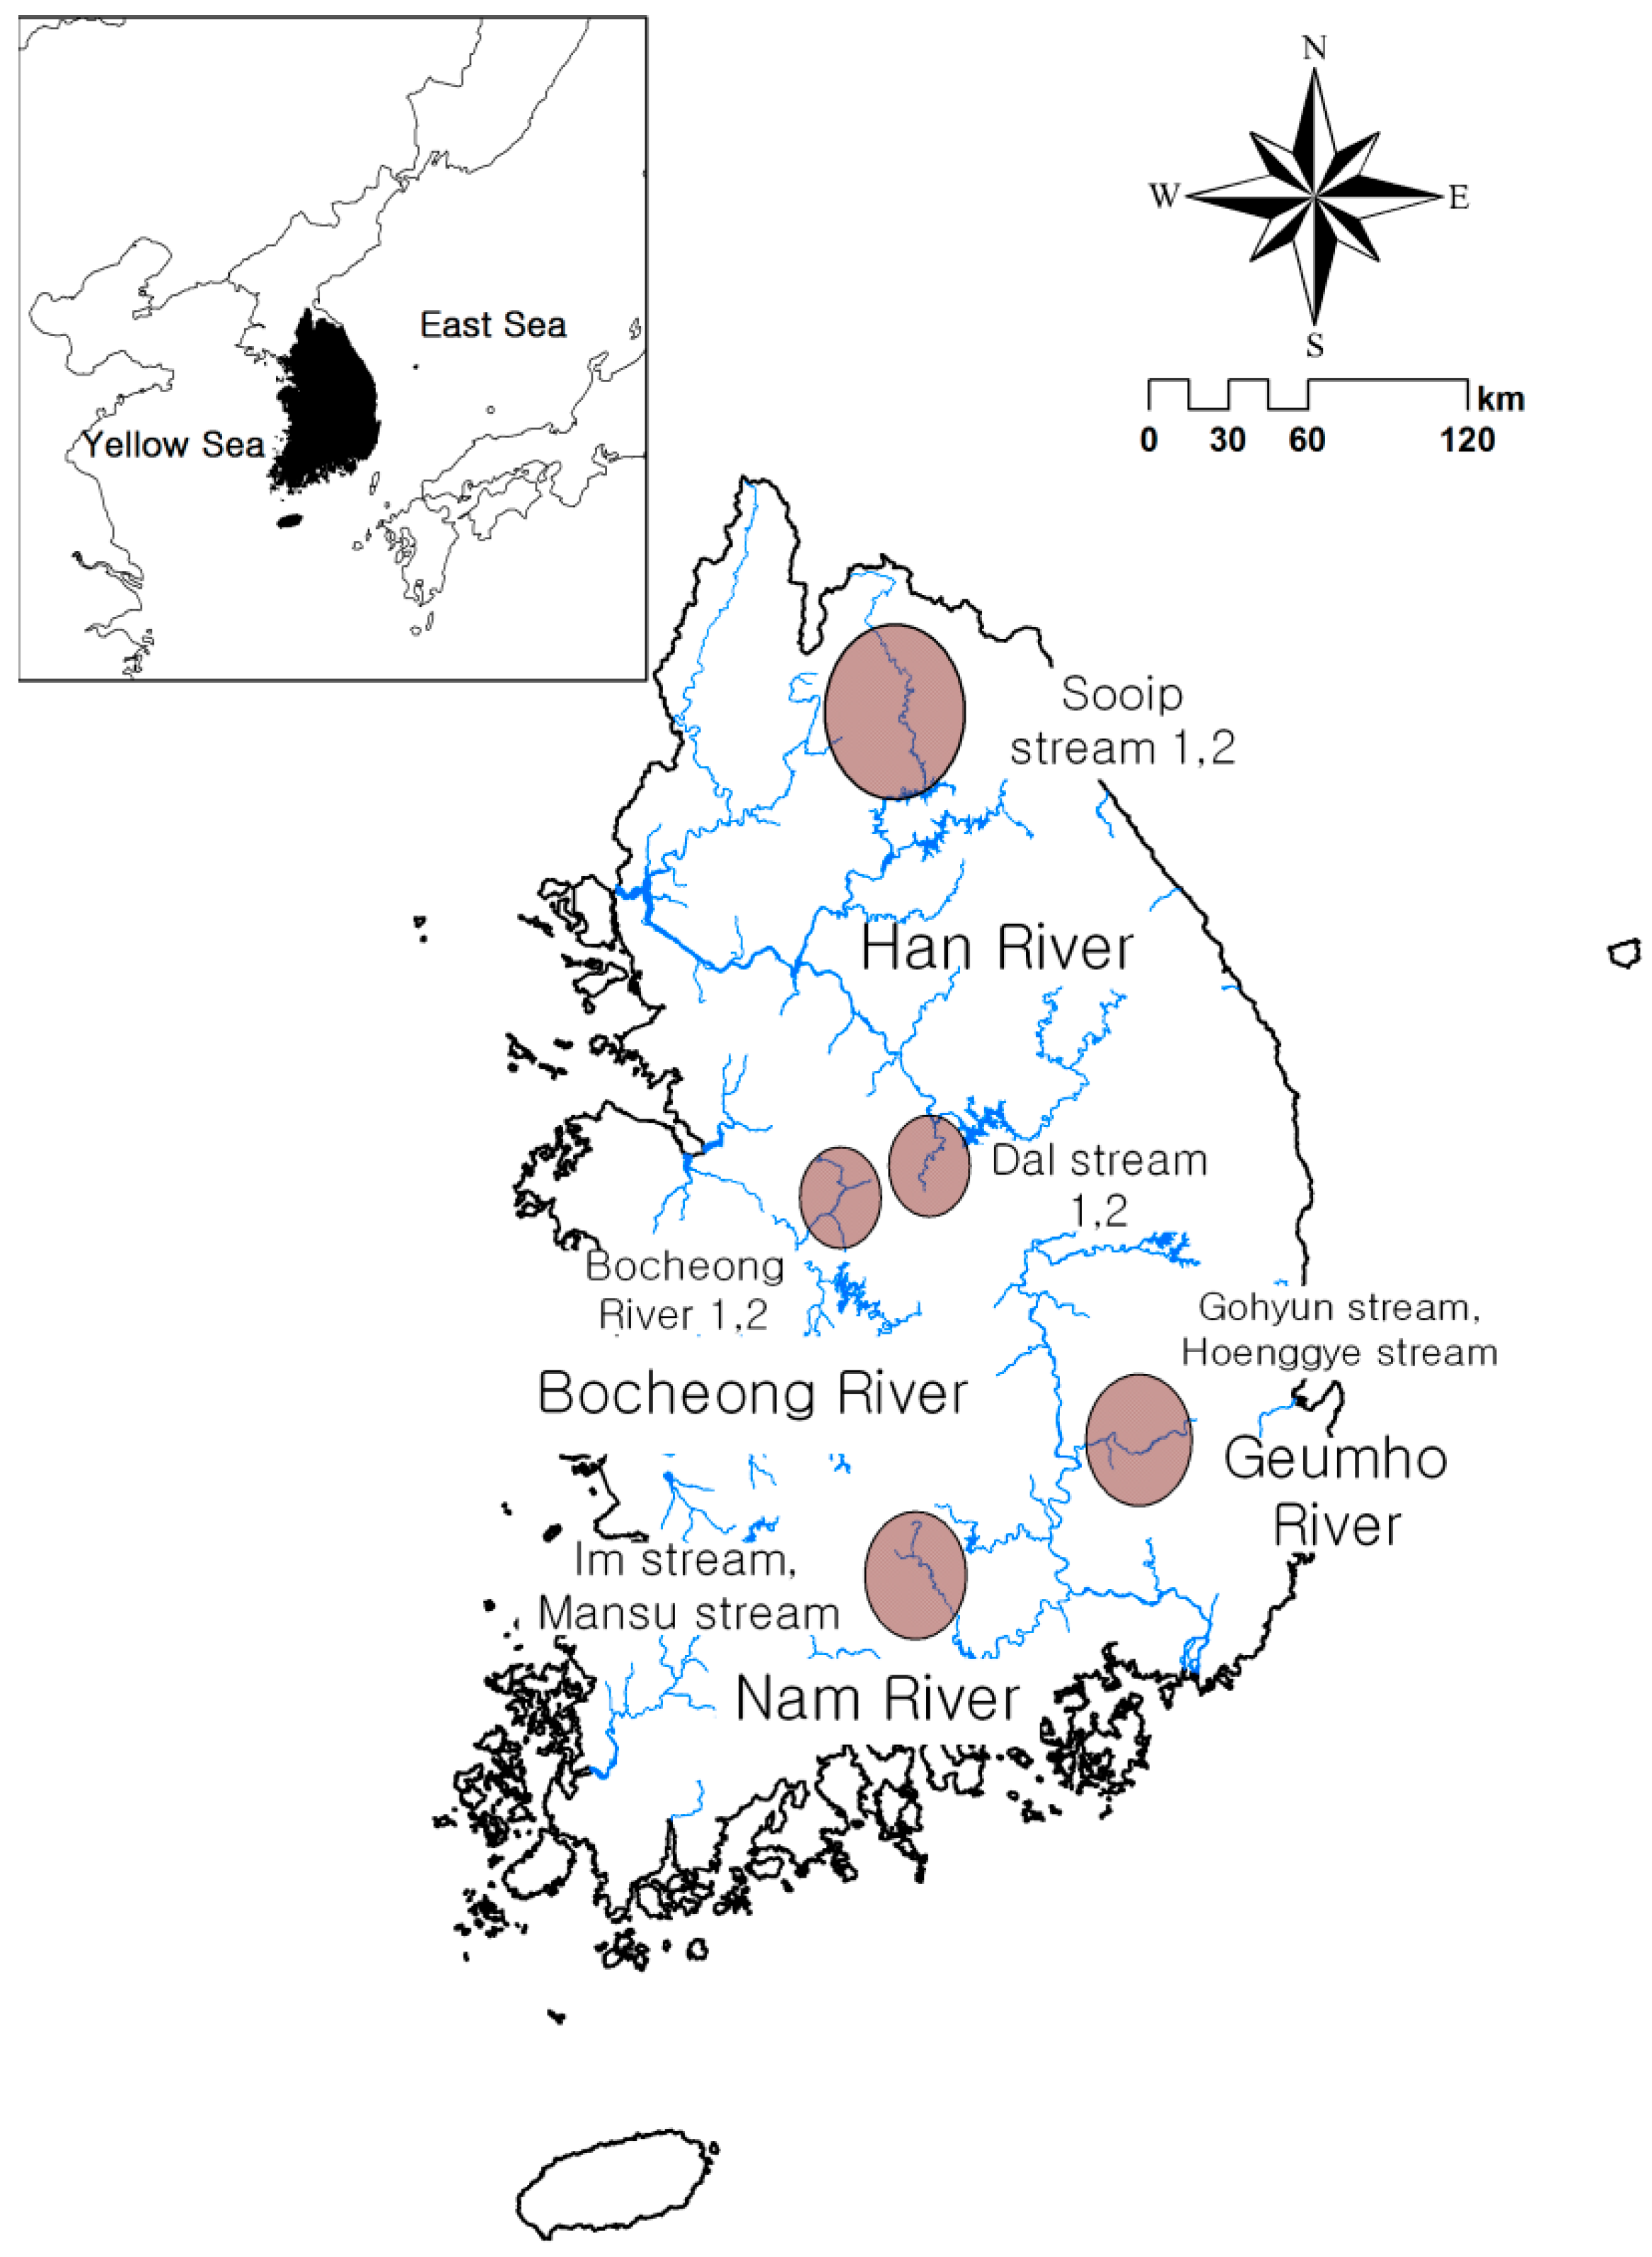
Table 1 shows the 10 candidate sites for dam construction on four rivers in South Korea. On the Han River, two sites (S1 and S2) are on the northern tributary, and the other two (S3 and S4) are on the southern tributary. Similarly, on the Nakdong River, two sites (S5 and S6) are on the Nam River, a western tributary, and the other two sites (S7 and S8) are on the Geumho River, an eastern tributary. The two sites (S9 and S10) are on the Bocheong River tributary, as shown in Figure 2. For our purposes, the most appropriate dam site would be the one with the smallest environmental impact. Among the ten dam sites, four are on the Han River, four are on the Nakdong River, and two are on the Geum River, as shown in Table 1. All candidate sites are generally upstream on the rivers.
Table 1. Candidate sites for dams in the LPDC SEA.
WatershedSitesSite Number
Han RiverSooip stream 1S1
Sooip stream 2S2
Dal stream 1S3
Dal stream 2S4
Nam RiverIm stream,S5
Mansoo streamS6
Geumho RiverGohyun streamS7
Hoenggye streamS8
Bocheong RiverBocheong 1S9
Bocheong 2S10
Figure 2. Location of candidate sites for dam planning in the LPDC SEA.
Sustainability 07 10233 g002
To meet Korean water resource planning goals, one dam construction site should be selected on the Han River, one site on the Bocheong River, and two sites on the tributaries of the Nakdong River, i.e., the Geumho River and Bocheong River [1]. Abandoned mines exist in the upstream areas, which require precise investigation of possible effects and mitigating alternatives in future dam construction. To evaluate the environmental conditions of the dam site candidates, environmental data were collected and categorized in terms of landscape and geology (LG), ecological worth (EW), water quality (WQ), and environmental toxicity (ET) in the LPDC, as shown in Table 2.
Table 2. Assessment considerations in examinations of potential dam sites.
ConsiderationsMonitoring Factors
Landscape and geology (LG)
  • Specific topology, geology, and landscape assessment
Ecological worth (EW)
  • Land: land plants, birds, mammals, insects, amphibians, and reptiles
  • Water: fish, benthic macro-invertebrates, phytoplankton, and zooplankton
Water quality (WQ)
  • pH, temperature, BOD, COD, DO, SS, TN, TP, total coliforms, heavy metals (As, Cd, Pb, Cr+6, Cu) (14 items)
  • Stream water quality assessment for investigation results
Environmental toxicity (ET)
  • Mines (including abandoned mines) and landfill in dam watersheds (assessment of potential soil pollution)
Table 3. Landscape and geology.
SitesNatural PreservesNatural Monuments and Cultural Assets
Han RiverS1DMZJigyeon Falls
S2DMZDutayeon Falls
S300
S4Songnisan National ParkYongchu Falls
Nam RiverS5Jirisan National ParkYongyudam Pond
S6Jirisan National ParkSilsangsa Temple
Geumho RiverS7
S8
Bocheong RiverS900
S1000
Note: − denotes no information.
Table 3 shows the assessment of landscape and geology information based on connected reservation regions and the landscapes of the candidate dam sites. The demilitarized zone (DMZ) and national parks are considered part of the national reserve system, and renowned waterfalls, ponds, and temples are regarded as valuable natural landscapes for topology and geology information. In this study, the Geumho River sites (Gohyun (S7) and Hoenggye (S8) streams) were not part of the natural reserve system and no natural landscape data were available (Table 3). Table 4 shows the number of endangered species at the dam candidate sites, as defined by Korean legal protection level 2. The SEA monitored endangered species of plants, mammals, birds, amphibians, reptiles, fish, insects, and invertebrates. The total numbers of endangered species per site ranged between 18 and 0. Table 5 shows the observed average water quality parameters. The SEA reports biological oxygen demand (BOD), chemical oxygen demand (COD), total nitrogen (TN), and total phosphorus (TP) as water quality parameters. All water quality parameters were monitored three to four times a year at each site.
Table 4. Number of endangered species.
SitesEndangered Species Based on Legal Protection Level 2
Totalpmarfiin
Han RiverS11811220300
S21711210300
S362120100
S4139110200
Nam RiverS540120100
S695210100
Geumho RiverS711000000
S821100000
Bocheong RiverS910010000
S1000000000
Note: p: plants, m: mammals, a: birds, r: amphibians and reptiles, f: fish, i: insects, in: invertebrates.
Table 5. Water quality parameters and observations.
Parameters
(unit: mg/L)
Han RiverNam RiverGeumho RiverBocheong River
S1S2S3S4S5S6S7S8S9S10
BOD0.320.300.810.761.581.090.710.450.520.80
COD1.481.502.812.132.582.293.693.301.222.34
TN1.3241.2452.4842.5461.1190.9014.4592.9110.8632.581
TP0.0010.0040.0300.0270.0160.0580.0440.0000.0080.057
Table 6 shows the number of abandoned mines around the candidate sites. An abandoned mine is regarded as an ET, and the number of abandoned mines relates to the effects of ET in this study. Sites S7, S8, and S9 do not include information about abandoned mines. The abandoned mines near the candidate sites required a detailed review of their expected effects and mitigating alternatives in the process of future dam construction. Table 7 shows the evaluation criteria for the data in Table 3, Table 4, Table 5 and Table 6. We regulated the evaluation numbers in this study from one to nine with odd numbers. Table 7 shows the results of the judgment scales for four criteria. Smaller numbers represent worse conditions for dam construction: a one indicates the worst condition for dam construction, and a nine is the best condition [12,13]. The results from applying Table 7 to the data in Table 3, Table 4, Table 5 and Table 6 are shown in Table 8. Five cells in Table 8 contain no information: S7 and S8 in LG and S7, S8, and S9 in ET.
Table 6. Number of abandoned mining sites.
SiteNumber of Mines
Han RiverS13
S21
S320
S478
Nam RiverS54
S62
Geumho RiverS7
S8
Bocheong RiverS9
S102
Note: − denotes no information.
Table 7. Judgment scales in four criteria.
Evaluation13579
Landscape and Geology (LG)NoneNot ImportantMinimally ImportantImportantVery Important
Ecological worth (EW)17–2013–169–125–80–4
Water Quality (WQ)BOD (mg/L as CaCO3)>99–66–31–3<1
COD (mg/L as CaCO3)>99–66–31–3<1
TN (mg/L)1–1.50.6–10.4–0.60.2–0.4<0.2
TP (mg/L)0.1–0.150.05–0.10.03–0.050.01–0.03<0.01
Environmental toxicity>2013–169–125–80–4
Note: Smaller evaluation numbers indicate worse conditions for dam construction: 1 denotes the worst condition, and 9 represents the best condition.
Table 8. Site assessment results based on environmental aspects.
CRITERIAS1S2S3S4S5S6S7S8S9S10
Landscape and geology (LG)117111LG1LG277
Ecological worth (EW)1173759999
Water quality (WQ)6.56.55.565.555675
Environmental toxicity (ET)991179ET1ET2ET39
Note: Grey highlighting indicates missing information.

2.2. Multi-Criteria Decision-Making Methods

The ELimination Et Choice Translating REality (ELECTRE) and Preference Ranking Organization Method for Enrichment Evaluation (PROMETHEE) families of methods are the most prominent outranking methods [14]. This study applied ELECTREE III and PROMTHEE II among the outranking methods. We applied four different MCDM methods—Analytical Hierarchy Process (AHP), ELECTRE III, PROMETHEE II, and Compromise Programming—to estimate the uncertainty of priorities based on the incomplete information in the SEA using standardized data. The decision strategies of PROMETHEE II and ELECTRE III are based on the concordance–discordance theory. On the other hand, AHP uses an eigenvector method to search for an optimal solution [15]. Compromise Programming is a mathematical programming technique for use in a continuous context [16].

2.2.1. Analytical Hierarchy Process

AHP is a systematic approach developed by Saaty [8] to enable decision making based on experience, intuition, and heuristics using the structure of a well-defined methodology derived from sound mathematical principles. It provides a formalized approach in which the economic justification for the time invested in the decision making process is provided by the improved quality of solutions to complex problems. Recently, the AHP has been applied to evaluate the priorities of various infrastructure strategies, such as transportation infrastructure investments [17] and CO2 mitigation strategies for road construction [18]. The AHP methodology can be explained in the following steps [12,19,20]:
(1)
A hierarchy of goals, criteria, and alternatives for the problem is organized.
(2)
Comparison matrices based on pairwise comparisons of various criteria are organized from the collected data on a qualitative scale.
(3)
The relative importance of the various criteria is provided by the principal eigenvalue and corresponding normalized right eigenvector of the comparison matrix.
(4)
The coefficient of inconsistency (CI) is calculated to confirm the inconsistency of the matrix through the amount of redundancy as
C I = C R R I = λ max n R I ( n 1 )
where λ max is the maximum eigenvalue, n is the matrix size, R I is the random inconsistency index, and C R is the consistency ratio. The value of C I should be less than 0.1 [12].
(5)
The rating of each alternative is multiplied by the weights of the sub-criteria and combined to calculate local rankings with respect to each criterion.

2.2.2. Electre III

ELECTRE III is a variant of the ELECTRE family and has been used to select a wind/solar hybrid power station [21] and for safety analysis in a road network [22].
Concordance in ELECTRE III is defined as a fuzzy relation with a region of indifference rather than directly using weights. ELECTRE III uses a zone of hesitation for the decision maker between indifference and strict preference. It is similar to PROMETHEE except the weights are not as important. The first attribute is called the concordance index; the second is the discordance index [23].
The preference and indifference thresholds are used to construct concordance index C i ( a , b ) for each criterion with respect to alternative a outranking alternative b, which is estimated as follows [14]:
C i ( a , b ) = { 1 i f f i ( a ) + q i f i ( b ) 0 i f f i ( a ) + p i f i ( b ) p i + f i ( a ) f i ( b ) p i q i o t h e r w i s e
where f ( ) is a corresponding difference in the preference, p i and q i are the preference and indifference thresholds, respectively, and i is the criteria. The overall concordance index is as follows:
C ( a , b ) = i = 1 m ω i C i ( a , b ) i = 1 m ω i
where ω i is the set of weights that depend on the criteria. Discordance is estimated as follows:
D i ( a , b ) = { 0 i f f i ( a ) + p i f i ( b ) 1 i f f i ( a ) + ν i f i ( b ) f i ( b ) f i ( a ) p i v i p i o t h e r w i s e
where ν i is a veto threshold for each criterion.
The overall concordance index and the discordance indices are combined to give a valued outranking relationship. Alternative a is said to outrank b with credibility S ( a , b ) estimated as follows:
S ( a , b ) = { C ( a , b )            i f D i ( a , b ) C ( a , b ) i C ( a , b ) i J ( a , b ) ( 1 D i ( a , b ) ) ( 1 C ( a , b ) )     o t h e r w i s e
where J ( a , b ) is a set of criteria, such that D i ( a , b ) > C ( a , b ) . Finally, ELECTRE III leads to descending and ascending distillation processes and combines them to produce a partial preorder.

2.2.3. Promethee II

PROMETHEE II was developed by Brans et al. [24] and is another outranking method. It has been used to evaluate the decision-making for renewable projects [25] and industrial enterprises [26]. PROMETHEE II provides a complete ranking of the alternatives and uses net flow to rank the alternatives. This method applies net outranking flow as follows:
φ ( a ) = φ + ( a ) φ ( a )
where φ + ( a ) indicates the positive outranking flow for a : φ + ( a ) = x A π ( a , x ) and φ ( a ) indicates the negative outranking flow for a : φ ( a ) = x A π ( x , a ) . The positive outranking flow expresses the extent to which a outranks all other options. The negative outranking flow expresses the extent to which a is outranked by all other options. π ( a , b ) indicates the global preference, which ranges between 0 and 1. Weak global preference of a over 0 is indicated by b , and 1 indicates strong global preference. π ( a , b ) is represented as j = 1 k ω j P j ( a , b ) , where ω is the weight and P ( a , b ) indicates the degree to which a is preferred over b . Let j = 1 k ω j = 1 .

2.2.4. Compromise Programming

The displaced ideal method for compromise programming was proposed by Zeleny [16]. Compromise Programming is used to identify the solutions closest to the ideal solution as determined by some measure of distance. It consists of identifying the different attributes, indicators, or performance objectives that contribute to overall performance. In particular, Compromise Programming is a useful decision making method for environmental problems because environmental policy is mainly concerned with removing threats to the environment rather than maximizing the overall results of the alternatives [27]. The weights are assigned to each performance objective to reflect the relative importance of the part the decision maker is asked to provide. Additional constraints on the values of the objectives and a new ideal point are built using those constraints [28]. Compromise programming uses the following equation to rank alternatives based on their distance from an ideal solution. One compromise distance for each alternative is obtained:
L p ( x ) = [ i = 1 n α i s | z i * z i ( x ) z i * z i * * | p ] 1 / p
where L p is the distance metric of the alternative, α i s is the weighting factor, n is the total number of criteria, a is the discrete alternative, z i * and z i * * are the best and worst values for criterion i, and z i * ( x ) is the result of implementing alternative x with respect to criterion i [29]. The scaling coefficient p depends on the objectives. The solution of Equation (7) produces a non-dominated point for 1 p . In this study, p = 1, which indicates a solution of maximum efficiency because the weighted sum of the achievements for the all the objectives considered is maximized [30].

2.3. Generating Missing Information

This study applied 1000 generation sets for the five sets of information missing from Table 8 with two distributions: uniform and binomial. Binomial distribution indicates a normal distribution selection and uniform distribution signifies equivalent selection. Figure 3 and Figure 4 show histograms of the generated information with a binomial distribution in which the mean is five and with a uniform distribution for five sets of missing information, respectively.
We applied the generated information sets to AHP, PROMETHEE II, ELECTRE III, and Compromise Programming for MCDM. We selected the best dam construction site on the Han River, Nam River, Geumho River, Bocheong River, and all rivers. The entire process of this study was as follows:
(1)
Generate 1000 sets for the five missing variables (LG1, LG2, ET1, ET2, and ET3) with binomial distribution and uniform distribution, as shown in Figure 3 and Figure 4.
(2)
Apply AHP, ELECTRE III, PROMETHEE II, and Compromise Programming methods for MCDM.
(3)
Investigate the best dam construction sites based on the five cases (in the Han River, Nam River, Geumho River, Bocheong River, and all rivers) depending on MCDM method and distribution (binomial or uniform).
Figure 3. Histograms of assessment generation with binomial distribution: (a) LG1; (b) LG2; (c) ET1; (d) ET2; (e) ET3.
Sustainability 07 10233 g003
Figure 4. Histograms of assessment generation with uniform distribution: (a) LG1; (b) LG2; (c) ET1; (d) ET2; (e) ET3.
Sustainability 07 10233 g004

3. Results

The results of this study are organized based on the applied MCDM techniques. Figure 5 shows the dam construction selection sites for the five cases using AHP. Site S10 on all rivers, S3 on the Han River, S5 on the Nam River, S8 on the Geumho River, and S10 on the Bocheong River were selected as the best dam construction sites. In particular, the results for the binomial distribution show higher selection rates than the results for the uniform distribution on all rivers, the Geumho River, and the Bocheong River. In other words, the differences in selection rates among the candidate sites in the uniform distribution are smaller than those in the binomial distribution.
Figure 5. Selection rates of candidate sites in regulated regions based on uniform and binomial distribution samplings using the Analytical Hierarchy Process (AHP).
Sustainability 07 10233 g005
Figure 6 shows the dam construction selection sites chosen using PROMETHEE II. The selected dam construction sites on each river are exactly the same as with AHP. Figure 7 shows the dam construction selection sites chosen using ELECTRE III. The selected dam site in the Geumho River for ELECTRE III is S8, whereas all the other MCDM methods chose S7. This difference could occur because ELECTRE III provides two or more priorities as the best solution instead of a complete ranking. Other studies [15,31,32] have also described vague priority results from ELECTRE III. Figure 8 shows the dam construction selection sites chosen using Compromise Programming. We set the scaling coefficient, p, in Compromise Programming as equal to 1. The results are the same as those of AHP and PROMETHEE II, though the selection rate differs slightly from the other two methods.
Overall, all four MCDM methods using both distribution samplings selected sites S3 and S5 on the Han River and Nam River, respectively. On the Bocheong River, the binomial distribution selected S10 with approximately 80% certainty, and the uniform distribution selected S10 with approximately 60% certainty. For all rivers, the binomial and uniform distributions selected S10 with approximately 80% and 50% certainty, respectively. However, for the Geumho River, AHP, PROMETHEE II, and Compromise Programming selected S8, whereas ELECTREE III selected S7.
Figure 6. Selection rates of candidate sites in regulated regions based on uniform and binomial distribution samplings using PROMETHEE II.
Sustainability 07 10233 g006
Figure 7. Selection rates of candidate sites in regulated regions based on uniform and binomial distribution samplings using ELECTRE III.
Sustainability 07 10233 g007
Figure 9 shows the average priority rankings of the candidate sites with uniform and binomial distributions. Generally, the average rankings of each site are similar; however, a few sites show some different rankings. Particularly, the rankings of S3, S5, S6, S8, and S9 vary by MCDM method. The difference in the average rankings based on the generation of information data sets is smaller than the difference in rankings based on the applied MCDM methods. Overall, site S10 is the most selected site for dam construction.
Figure 8. Selection rates of candidate sites in regulated regions based on uniform and binomial distribution samplings using Compromise Programming (Ls = 1).
Sustainability 07 10233 g008
Figure 9. Changes in average priority rankings of candidate sites with uniform and binomial distributions of missing information using four MCDM methods.
Sustainability 07 10233 g009

4. Conclusions

We investigated robust decision-making with incomplete SEA information using various MCDM methods for dam construction planning. Dam sites are selected using selection percentages and shown as a selection ratio. The SEA was missing five data sets in the LG and ET categories. We filled in the missing information using 1000 sampling sets with binomial and uniform distributions, and used all the resulting data to investigate five dam selection situations: dam sites on all rivers and those on the Han River, Nam River, Geumho River, and Bocheong River, separately.
All dam sites selected were consistent except for the sites on the Geumho River. Results from binomial distribution sampling showed a more robust selection ratio than those from uniform distribution sampling in all five dam selection cases. Thus, binomial distribution sampling produces stronger results than uniform distribution when providing missing information.
Overall, ELECTRE III was the only MCDM method that significantly affected dam selection. This result coincides with the conclusions of Gilliams et al. [15] and Selmi et al. [33], who compared PROMETHEE II, ELECTRE III, and AHP and found ELECTRE III to be problematic. The methods for imputing incomplete information also affected site selection. Data generated with a binomial distribution, similar to a normal distribution, showed a more dominant selection ratio than those generated with a uniform distribution. AHP, PROMETHEE II, and Compromise Programming with binomial distribution showed the most dominance and consistency in estimating priorities. ELECTRE III with both binomial and uniform distributions produced the least robust results in this study.

Acknowledgments

This research was supported by a grant (14AWMP-B082564-01) from Advanced Water Management Research Program funded by Ministry of Land, Infrastructure and Transport of Korean government. Moreover, the present work was developed within the framework of the “Panta Rhei” Research Initiative of the International Association of Hydrological Sciences (IAHS) (Working Group Evolving Urban—Water Systems).

Author Contributions

Daeryong Park and Yeonjoo Kim primarily wrote the article and designed the study; Myong-Jin Um performed the data analysis and interpreted the results; and Sung-Uk Choi provided support in performing the data analysis and writing the article.

Conflicts of Interest

The authors declare no conflicts of interest.

References

  1. Song, Y.-I.; Joo, Y.J.; Bae, S.J.; Choi, Y.Y. Study on the EIA after the Adoption of the Strategic Environmental Assessment; Ministry of Environment: Sejong City, Korea, 2006. (In Korean)
  2. Song, Y.-I.; Seo, S.C.; Kim, S.H.; Choi, J.G.; Han, S.W. Improving Prior Environmental Review System; Korea Environmental Institute: Sejong City, Korea, 2002. (In Korean) [Google Scholar]
  3. Therivel, R. Strategic Environmental Assessment; Earthscan Publ. Ltd.: London, UK, 1992. [Google Scholar]
  4. Sadler, B.; Verheem, R. Strategic Environmental Assessment—Status, Challenges and Future Directions; Ministerie Van Volkshuisvesting, Ruimtelijke Ordering en Milieubeheer: Dan Haag, The Netherlands, 1996. [Google Scholar]
  5. Song, Y.I.; Park, D.; Shin, G.; Kim, C.; Grigg, N.S. Strategic environmental assessment for dam planning: A case study of South Korea’s experience. Water Int. 2010, 35, 397–408. [Google Scholar] [CrossRef]
  6. Josimovic, B.; Maric, I.; Milijic, S. Multi-criteria evaluation in strategic environmental assessment for waste management plan, a case study: The city of Belgrade. Waste Manag. 2015, 36, 331–342. [Google Scholar] [CrossRef] [PubMed]
  7. Kis Madrid, C.; Hickey, G.M.; Bouchard, M.A. Strategic Environmental Assessment Effectiveness and the Initiative for the Integration of Regional Infrastructure in South America (IIRSA): A Multiple Case Review. J. Environ. Assess. Policy Manag. 2011, 13, 515–540. [Google Scholar] [CrossRef]
  8. Jamali, I.A.; Mortberg, U.; Olofsson, B.; Shafique, M. A Spatial Multi-Criteria Analysis Approach for Locating Suitable Sites for Construction of Subsurface Dams in Northern Pakistan. Water Resour. Manag. 2014, 28, 5157–5174. [Google Scholar] [CrossRef]
  9. Kim, H.-J.; Lyu, Y.-G.; Kim, Y.-G.; Lim, H.-D. A Study on Optimization for Location and type of Dam Considering the Characteristic of Large Fault. J. Korean Soc. Rock Mech. 2012, 22, 227–242. (In Korean) [Google Scholar] [CrossRef]
  10. Jamali, I.A.; Olofsson, B.; Mortberg, U. Locating suitable sites for the construction of subsurface dams using GIS. Environ. Earth Sci. 2013, 70, 2511–2525. [Google Scholar] [CrossRef]
  11. Ahlers, R.; Brandimarte, L.; Kleemans, I.; Sadat, S.H. Ambitious development on fragile foundations: Criticalities of current large dam construction in Afghanistan. Geoforum 2014, 54, 49–58. [Google Scholar] [CrossRef]
  12. Satty, T.L. The Analytical Hierarchy Processes; McGraw-Hill: New York, NY, USA, 1980. [Google Scholar]
  13. Saaty, T.L. Fundamentals of Decision Making and Priority Theory with the Analytic Hierarchy Process; RWS Publications: Pittsburgh, PA, USA, 1994. [Google Scholar]
  14. Belton, V.; Stewart, T.J. Multiple Criteria Decision Analysis: An Integrated Approach; Springer: New York, NY, USA, 2003. [Google Scholar]
  15. Gilliams, S.; Raymaekers, D.; Muys, B.; van Orshoven, J. Comparing multiple criteria decision methods to extend a geographical information system on afforestation. Comput. Electron. Agric. 2005, 49, 142–158. [Google Scholar] [CrossRef]
  16. Zeleny, M. Compromise Programming-Multiple Criteria Decision Making; Columbia, University of South Carolina Press: Columbia, SC, USA, 1973. [Google Scholar]
  17. Quadros, S.G.R.; Nassi, C.D. An evaluation on the criteria to prioritize transportation infrastructure investments in Brazil. Transp. Policy 2015, 40, 8–16. [Google Scholar] [CrossRef]
  18. Javid, J.R.; Nejat, A.; Hayhoe, K. Selection of CO2 mitigation strategies for road transportation in the United States using a multi-criteria approach. Renew. Sustain. Energy Rev. 2014, 38, 960–972. [Google Scholar] [CrossRef]
  19. Bhushan, N.; Ria, K. Strategic Decision Making: Applying the Analytic Hierarchy Process; Springer-Verlag: London, UK, 2004. [Google Scholar]
  20. Saaty, T.L.; Vargas, L.G. Models, Methods, Concepts and Applications of the Analytic Hierarchy Process; Kluwer Academic Publishers: Boston, MA, USA, 2000. [Google Scholar]
  21. Jun, D.; Tian-tian, F.; Yi-sheng, Y.; Yu, M. Macro-site selection of wind/solar hybrid power station based on ELECTRE-II. Renew. Sustain. Energy Rev. 2014, 35, 194–204. [Google Scholar] [CrossRef]
  22. Fancello, G.; Carta, M.; Fadda, P. A Decision Support System Based on Electre III for Safety Analysis in a Suburban Road Network. Transp. Res. Procedia 2014, 3, 175–184. [Google Scholar] [CrossRef] [Green Version]
  23. Roy, B. The outraking approach and the foundation of ELECTRE methods. Theor. Decis. 1991, 31, 49–73. [Google Scholar] [CrossRef]
  24. Brans, J.P.; Mareschal, B.; Vincke, P. How to select and how to rank projects: The Promethee method. Eur. J. Oper. Res. 1986, 24, 228–238. [Google Scholar] [CrossRef]
  25. Haralambopoulos, D.A.; Polatidis, H. Renewable energy projects: Structuring a multi-criteria group decision-making framework. Renew. Energy 2003, 28, 961–973. [Google Scholar] [CrossRef]
  26. Veza, I.; Celar, S.; Peronja, I. Competences-based Comparison and Ranking of Industrial Enterprises Using PROMETHEE Method. Procedia Eng. 2015, 100, 445–449. [Google Scholar] [CrossRef]
  27. Chung, E.S.; Lee, K.S. Identification of Spatial Ranking of Hydrological Vulnerability Using Multi-Criteria Decision Making Techniques: Case Study of Korea. Water Resour. Manag. 2009, 23, 2395–2416. [Google Scholar] [CrossRef]
  28. Gorantiwar, S.D.; Smout, I.K. Multicriteria decision making (compromise programming) for integrated water resources management in an irrigation scheme. In Proceedings of the 3rd International Perspective on Current & Future State of Water Resources & the Environment, EWRI-ASCE, Chennai, Tamil Nadu, India, 5–7 January 2010.
  29. Goicoechea, A.; Hansen, D.R.; Duckstein, L. Multiobjective Decision Analysis with Engineering and Business Applications; John Wiley & Sons: New York, NY, USA, 1982. [Google Scholar]
  30. Tamiz, M.; Jones, D.; Romero, C. Goal programming for decision making: An overview of the current state-of-the-art. Eur. J. Oper. Res. 1998, 111, 569–581. [Google Scholar] [CrossRef]
  31. Barda, O.H.; Depuis, J.; Lencioni, P. Multicriteria location of thermal power plants. Eur. J. Oper. Res. 1990, 45, 332–346. [Google Scholar] [CrossRef]
  32. Salminen, P.; Hokkanen, J.; Lahdelma, R. Comparing multicriteria methods in the context of environmental problems. Eur. J. Oper. Res. 1998, 104, 485–496. [Google Scholar] [CrossRef]
  33. Selmi, M.; Kormi, T.; Ali, N.B.H. Comparing Multi-Criteria Decision Aid Methods through a Ranking Stability Index. In Proceedings of the Modeling, Simulation and Applied Optimization (ICMSAO), 5th International Conference on, Hammamet, Tunisia, 28–30 April 2013.

