Article

How Many Butterflies Are There in a City of Circa Half a Million People?

by
Lorena Ramírez-Restrepo
1,*,
Carlos Andrés Cultid-Medina
2 and
Ian MacGregor-Fors
1,*
1
Red de Ambiente y Sustentabilidad, Instituto de Ecología, A.C. Carretera antigua a Coatepec 351, El Haya, Xalapa 91070, Mexico
2
Grupo de Investigación en Biología, Ecología y Manejo de Hormigas, Universidad del Valle, Ciudad Universitaria Meléndez, Calle 13 No 100-00, Cali 25360, Colombia
*
Authors to whom correspondence should be addressed.
Sustainability 2015, 7(7), 8587-8597; https://doi.org/10.3390/su7078587
Submission received: 25 February 2015 / Revised: 27 May 2015 / Accepted: 1 June 2015 / Published: 2 July 2015

Abstract

:
Urbanization poses severe threats to biodiversity; thus, there is an urge to understand urban areas and their biological, physical, and social components if we aim to integrate sustainable practices as part of their processes. Among urban wildlife groups, butterflies have been used as biological indicators due to their high sensitivity to environmental changes. In this study, we estimated the number of butterflies that live within a neotropical medium-sized city (Xalapa, Veracruz, Mexico) using a robust interpolation procedure (ordinary kriging). Our calculations added an average of 1,077,537 (± SE 172) butterfly individuals that dwelt in Xalapa in the surveyed space and time. The interpolation procedures showed to be robust and reliable, and up to some extent conservative. Thus, our results suggest that there are at least 1.8 butterfly individuals per capita in Xalapa. Notably, higher butterfly abundances tended to be recorded near highly vegetated areas and along city borders. Besides providing the basis for further ecological studies, our results will contribute to the crucial need of scientific data that is lacking, but critically important, for adequate urban management and planning, as well as environmental education.

1. Introduction

People have rapidly become concentrated in urban areas around the globe in the past decades [1]. Cities continue to expand as a response to the current economic dynamics that drive human population growth and migration towards urban areas [2], implying disproportionate environmental demands related to the basic human needs (e.g., housing, food, health services, educational institutions) [3]. Urbanization poses important negative impacts on the biodiversity and habitats within and adjacent to urban areas [4], which in some cases goes unnoticed [4,5]. In fact, urbanization has been identified as one of the main drivers of species loss [6]. However, the specific impacts of urbanization on biodiversity can vary, often depending on the city’s geographic location, size, and array of other physical, ecological, and social factors [7]. Thus, as urban areas sprawl, there is an urge to understand them in order to include sustainable practices as a part of their processes [8,9].
Ecological studies focused on urban areas have been developed around the globe, using different frameworks and approaches (e.g., urban–rural gradients, urban green areas, biological communities, species lists, ethology) [10,11,12,13,14,15]. Some general patterns regarding the response of wildlife species to urbanization have emerged, at least for well-studied groups [7,16,17]. Two of the most generalized patterns are that species richness tends to decrease with urbanization, while the abundance of a few particular species tends to increase [7,18,19]. Such declines in species richness are not necessarily lineal, with some moderately developed areas showing higher richness when compared to highly and lowly urbanized sites [6,20,21].
Highly charismatic organisms, such as birds and butterflies, are some of the most well-studied animal groups in urban areas [22,23,24]. In addition to their aesthetic value, which often generates positive appraisal from the public [25,26], butterflies are excellent indicators of environmental changes [27,28]. Thus, knowledge related to butterflies and other wildlife groups could increase our comprehension of their responses to urbanization and help bridge the gap between scientific knowledge and management and planning strategies [29].
In recent decades, butterflies in urban areas have gained attention from ecologists, with most publications centered on the study of ecological patterns (i.e., diversity, resource use, population dynamics, response to urban habitats and threats, landscape ecology, developmental biology, ethology, genetics; Lorena Ramírez-Restrepo and Ian MacGregor-Fors personal observation). Although some general patterns regarding the response of butterflies to urbanization have been identified [7,25], there is still a dearth of knowledge related to their ecology at citywide scales. In fact, only two previous studies have followed a citywide or regional approach to study the spatial ecology of butterflies in urban areas [30,31].
Based on the urgent need to generate data that can provide ecological bases for urban managers and planners, as well as environmental educators [32,33], we used a citywide approach to estimate the total number of butterfly individuals (Insecta: Lepidoptera; only considering Papilionoidea; referred to as butterflies hereafter) that dwelt in a medium sized neotropical city (Xalapa-Enriquez, referred to as Xalapa hereafter). For this, we used ordinary kriging, a geostatistical interpolation procedure that allowed us to generate a citywide estimate (Figure 1).
Figure 1. Location of study area (Xalapa, Veracruz, Mexico) with all surveyed sites comprising a citywide design.
Sustainability 07 08587 g001

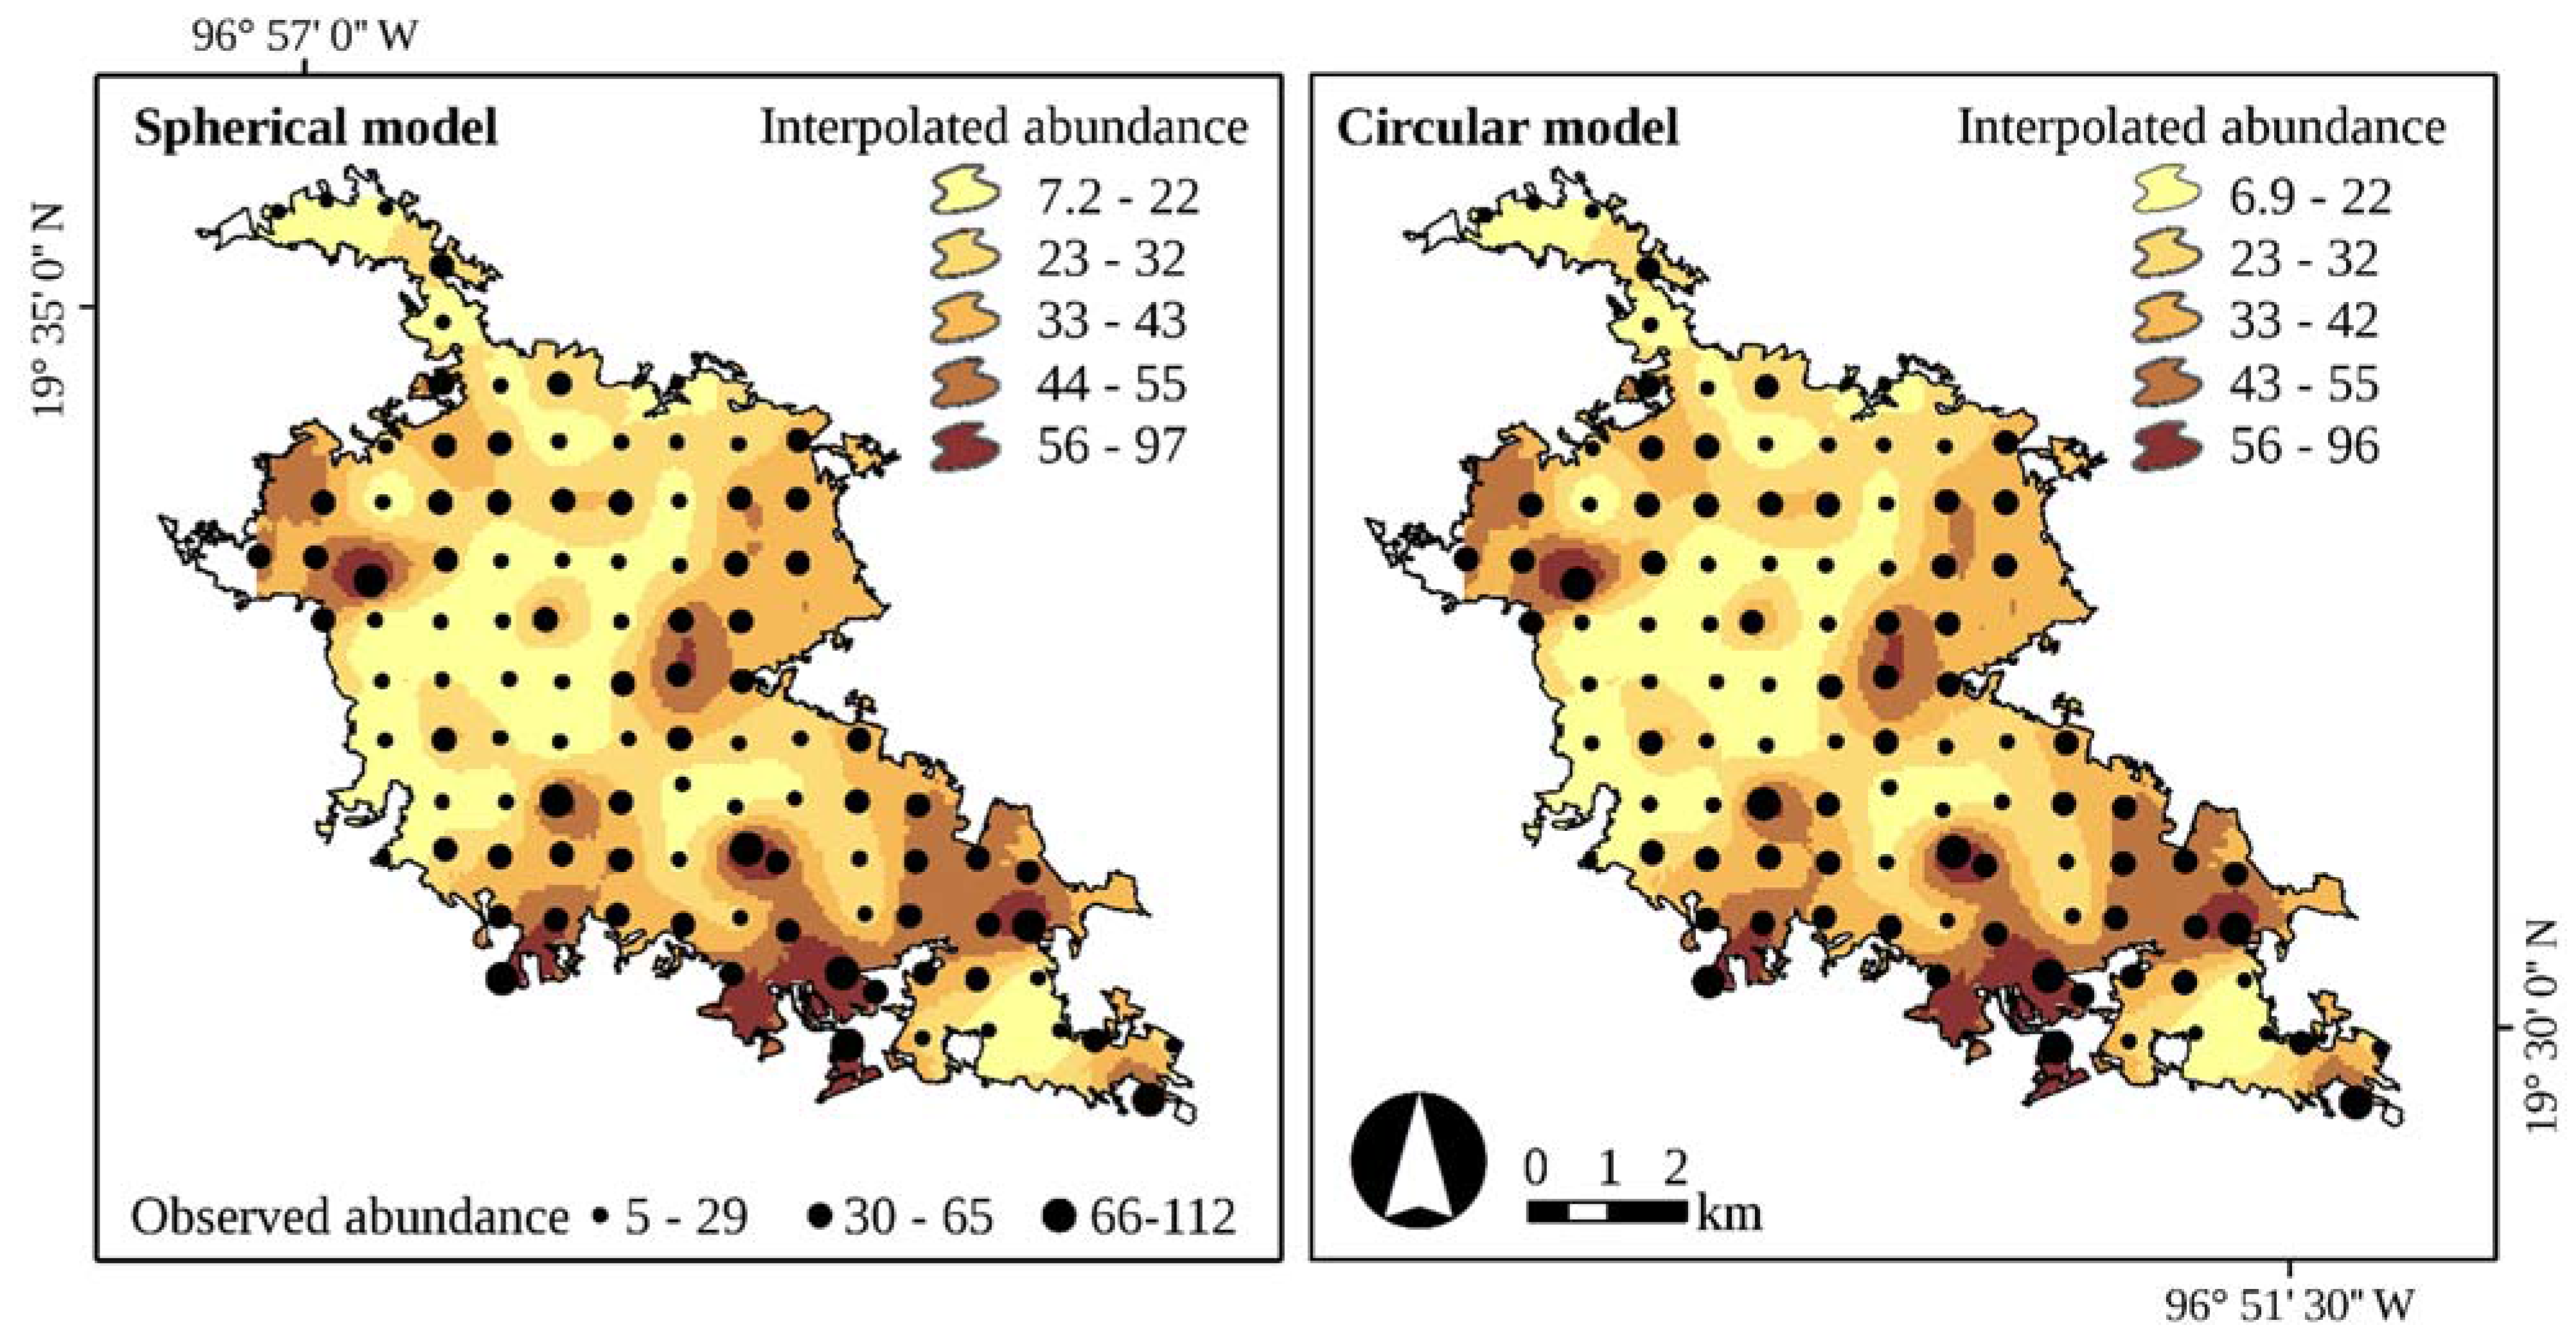
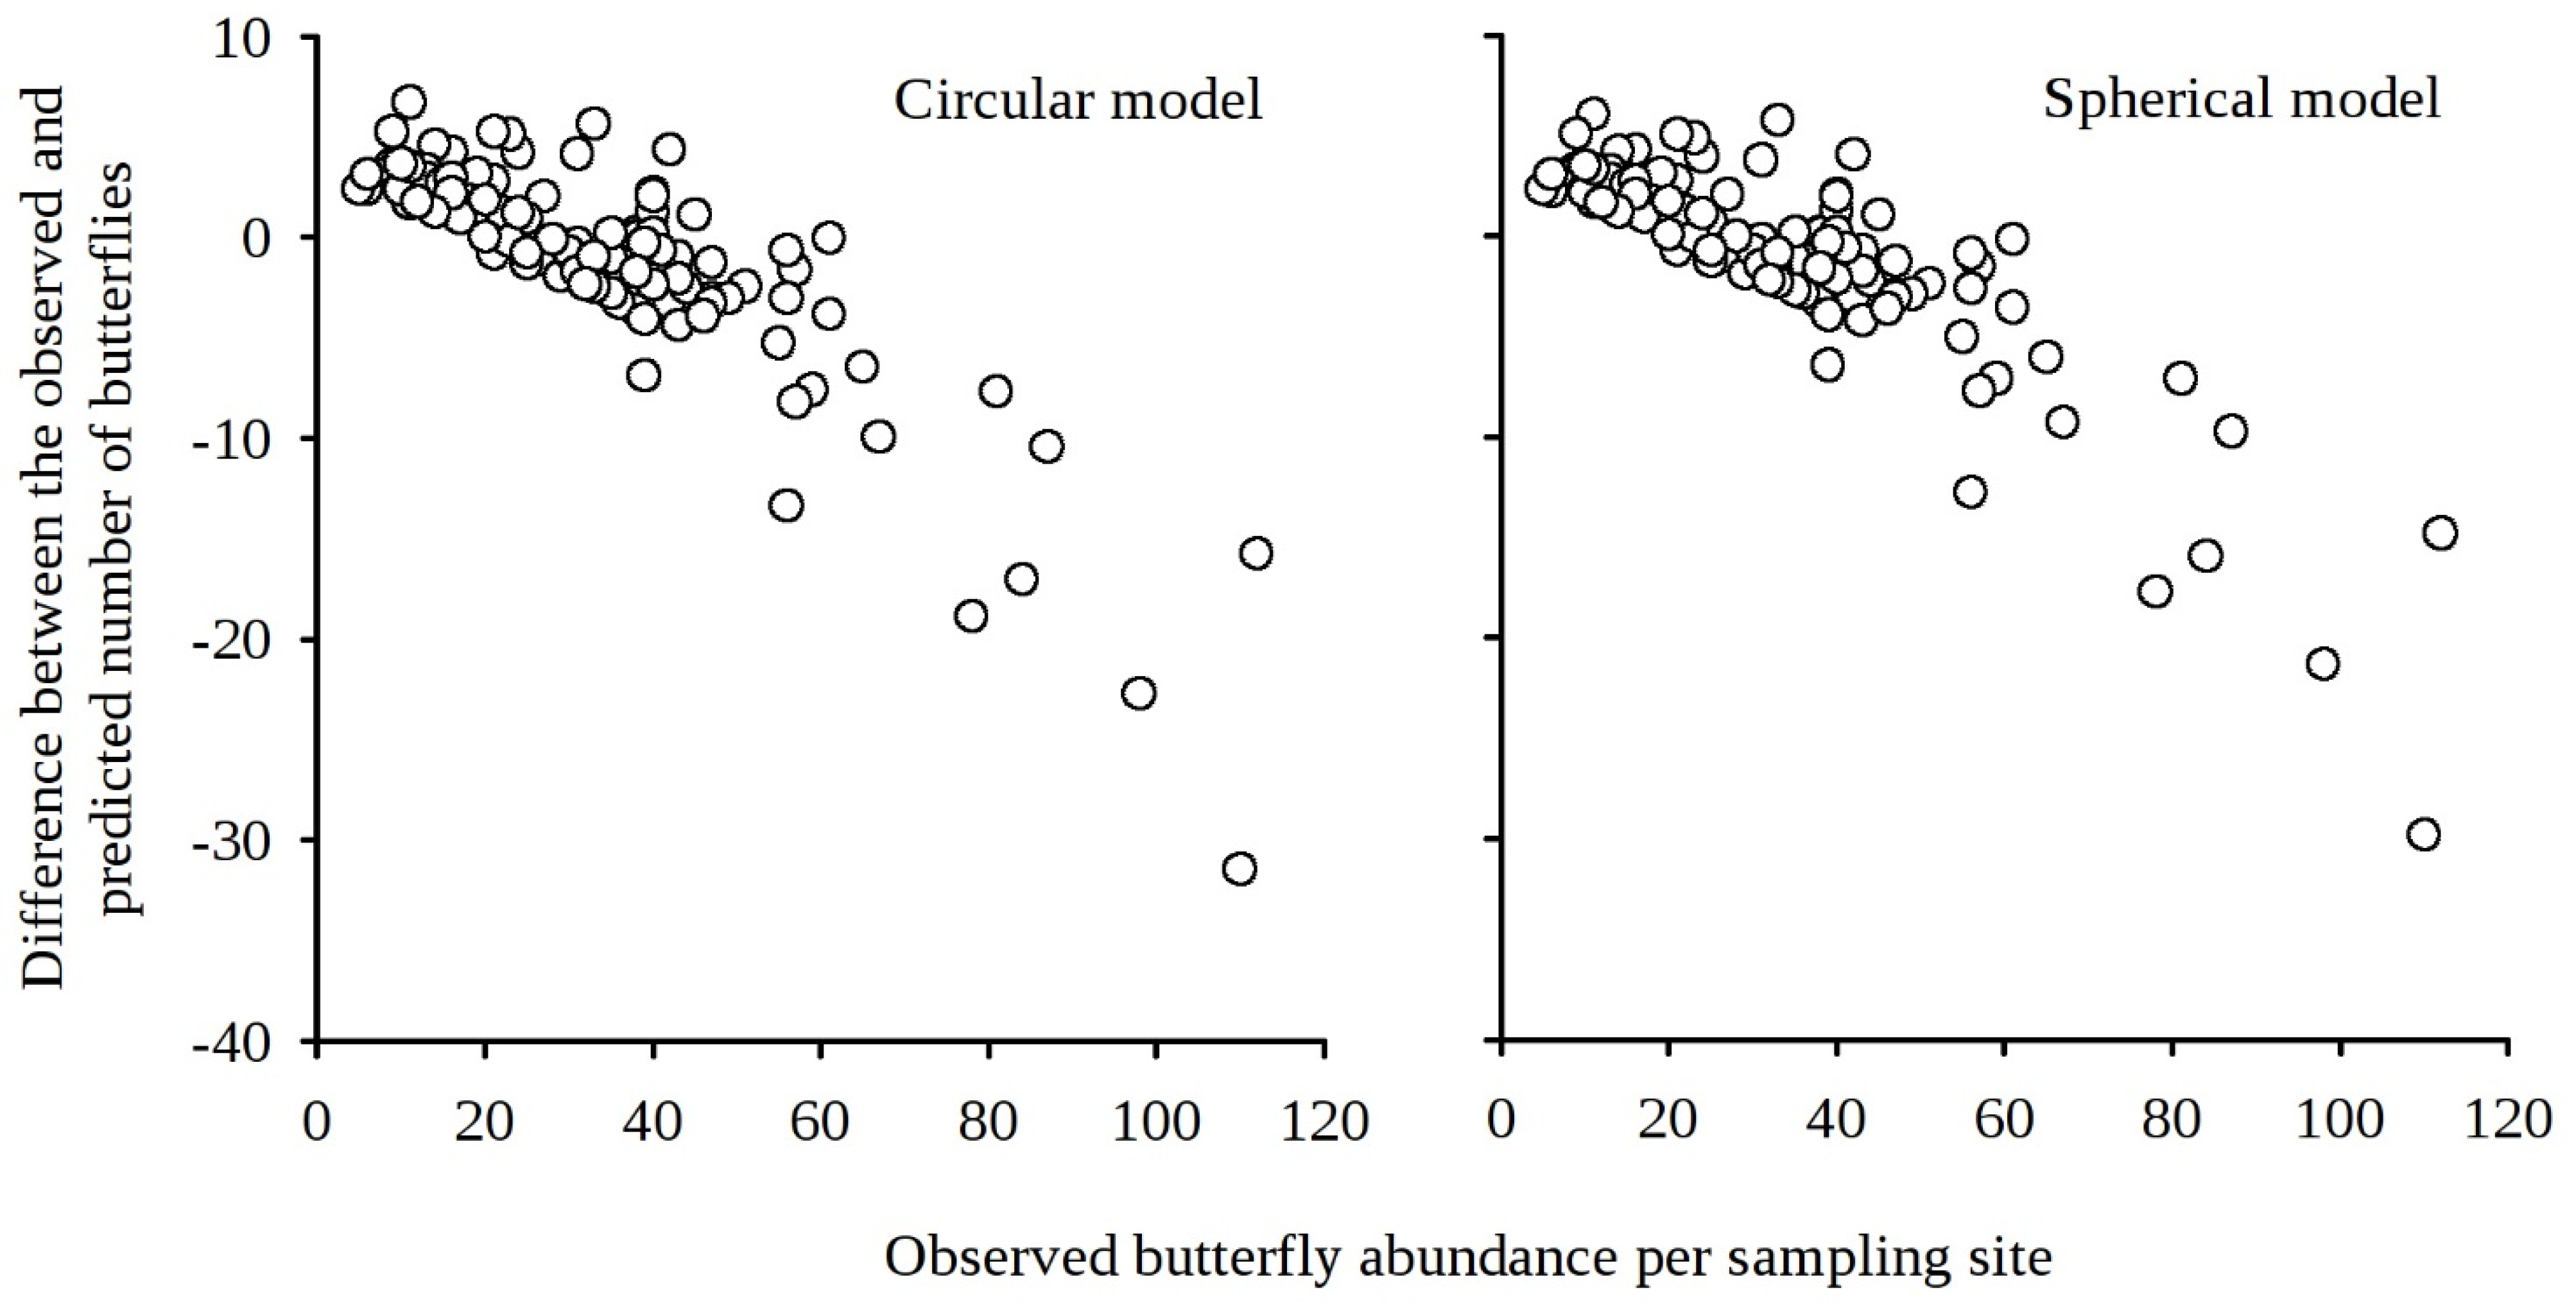
2. Results and Discussion

Previous studies have shown that the city of Xalapa shelters an important number of butterfly species [20,34]. As part of our surveys, we recorded 162 butterfly species and a total number of 3683 individuals. The ten most abundant species recorded in this study accounted for ~50% of the total individuals: (1) Diaethria anna anna (318 individuals); (2) Leptophobia aripa elodia (277 individuals); (3) Heliconius charitonia vazquezae (261 individuals); (4) Dione moneta poeyii (203 individuals); (5) Hermeuptychia aff. hermes (183 individuals); (6) Anteos maerula (155 individuals); (7) Ascia monuste monuste (131 individuals); (8) Eresia phillyra phillyra (107 individuals); (9) Eunica monima (104 individuals); and (10) Mechanitis menapis doryssus (100 individuals). It is noteworthy that these ten species are only found in the American continent, usually distributed between Central America and the southern United States of America [35]. Having recorded such a high proportion of individuals pertaining to only 10 species agrees with a previous study that reported 57% of the total butterfly abundance of a city to also be represented by 10 species [30]. In fact, such dominance is fairly common when studying the distribution of species abundances in biological communities [36].
After performing interpolation procedures, we were able to estimate the number of butterfly individuals that dwelt in Xalapa in the surveyed space and time (circular model: 1,077,709; spherical model: 1,077,365; Figure 2). These estimates suggest that there are at least 1.8 butterfly individuals per capita in Xalapa. It is important to underline that this calculation is based on data of butterflies recorded in the surveyed space and time.
Figure 2. Observed and interpolated butterfly abundances in the city of Xalapa using two different models (i.e., spherical, circular).
Sustainability 07 08587 g002
When we analyzed the observed and predicted butterfly values for the sampled sites, we found slight differences using both models (i.e., spherical, circular). We found an average difference of −1.22 (± SE 0.56) butterflies per survey site between the observed and predicted data for the circular model, where 47% of the predictions overestimated the observed values, while 53% underestimated them. Regarding the spherical model, we found an average difference of −1.16 (± SE 0.53) butterflies per survey between the observed and predicted data, where 47% of the predictions overestimated the observed values, while 53% underestimated them. It is noteworthy that we found strong and significant correlations between the observed butterfly abundance per sampling site and the differences between the number of observed butterflies and the predicted number of butterflies at each sampling site for both models (circular model: r = 0.85, p < 0.001; spherical model: r = 0.85, p < 0.001; Figure 3). These results show small differences between the observed and predicted number of butterflies in the surveyed space and time, with largest discrepancies of prediction in sites where we recorded a high number of butterflies in the field (>60; Figure 3). Thus, our interpolation results show to be reliable and, up to some extent, conservative.
We found two distribution trends of butterfly abundances across the city. On the one hand, higher abundances had a tendency to be recorded and predicted near highly vegetated areas located in the southeastern part of the urban area (e.g., Parque Natura, Reserva El Tejar-Garnica) and along city borders (Figure 2). On the other hand, the lowest abundance values were recorded, in general, at highly developed urban areas (Figure 2). This pattern agrees with the only other two citywide butterfly surveys performed in Porto Alegre (Brazil) that report less butterfly abundance in the most intensely urbanized areas (i.e., building area) [30,31].
Figure 3. Relationships between the observed number of butterflies at each survey site and the differences between observed and interpolated (predicted) butterfly abundances for both models (i.e., spherical, circular).
Sustainability 07 08587 g003
Further studies are needed to identify the drivers of butterfly abundance in the city. Based on previous knowledge, some potential variables to test are: spatial scale, vegetation composition, presence and abundance of nectar sources, host plants, distance to well-preserved habitat patches, distance to the urban center and border, temperature, humidity, and altitude [13,20,37,38]. Future studies are also needed in order to assess butterfly biological traits, behavior, species richness, composition, and distribution patterns across the urban area, with comparisons between them and adjacent non-urban systems, if we are to achieve a complete picture of the response of butterflies to urbanization in Xalapa.
Although urban areas can pose severe threats on biodiversity [6,7], they currently house more than half of the total human population and an important proportion of both urban and non-urban decision makers [39]. We are convinced that generating basic ecological knowledge of a charismatic indicator group in a highly biodiverse city, such as Xalapa [40], is an important first step if we aim to manage and plan urban areas integrating sustainable practices as part of their processes. Besides providing the basis for further ecological studies, our findings add to the need of scientific information required for adequate urban management and wildlife conservation goals. Environmental education and scientific outreach programs are crucial in urban areas, and they often depend on the information generated by rigorous scientific studies in order to raise awareness about the importance of biodiversity in cities. Undoubtedly, the more we understand about the biological diversity within urban areas, together with other physical and social components, the closer we will be to setting a balance between the quality of human life and our effects on biodiversity, following reconciliation ecology approaches [41].

3. Materials and Methods
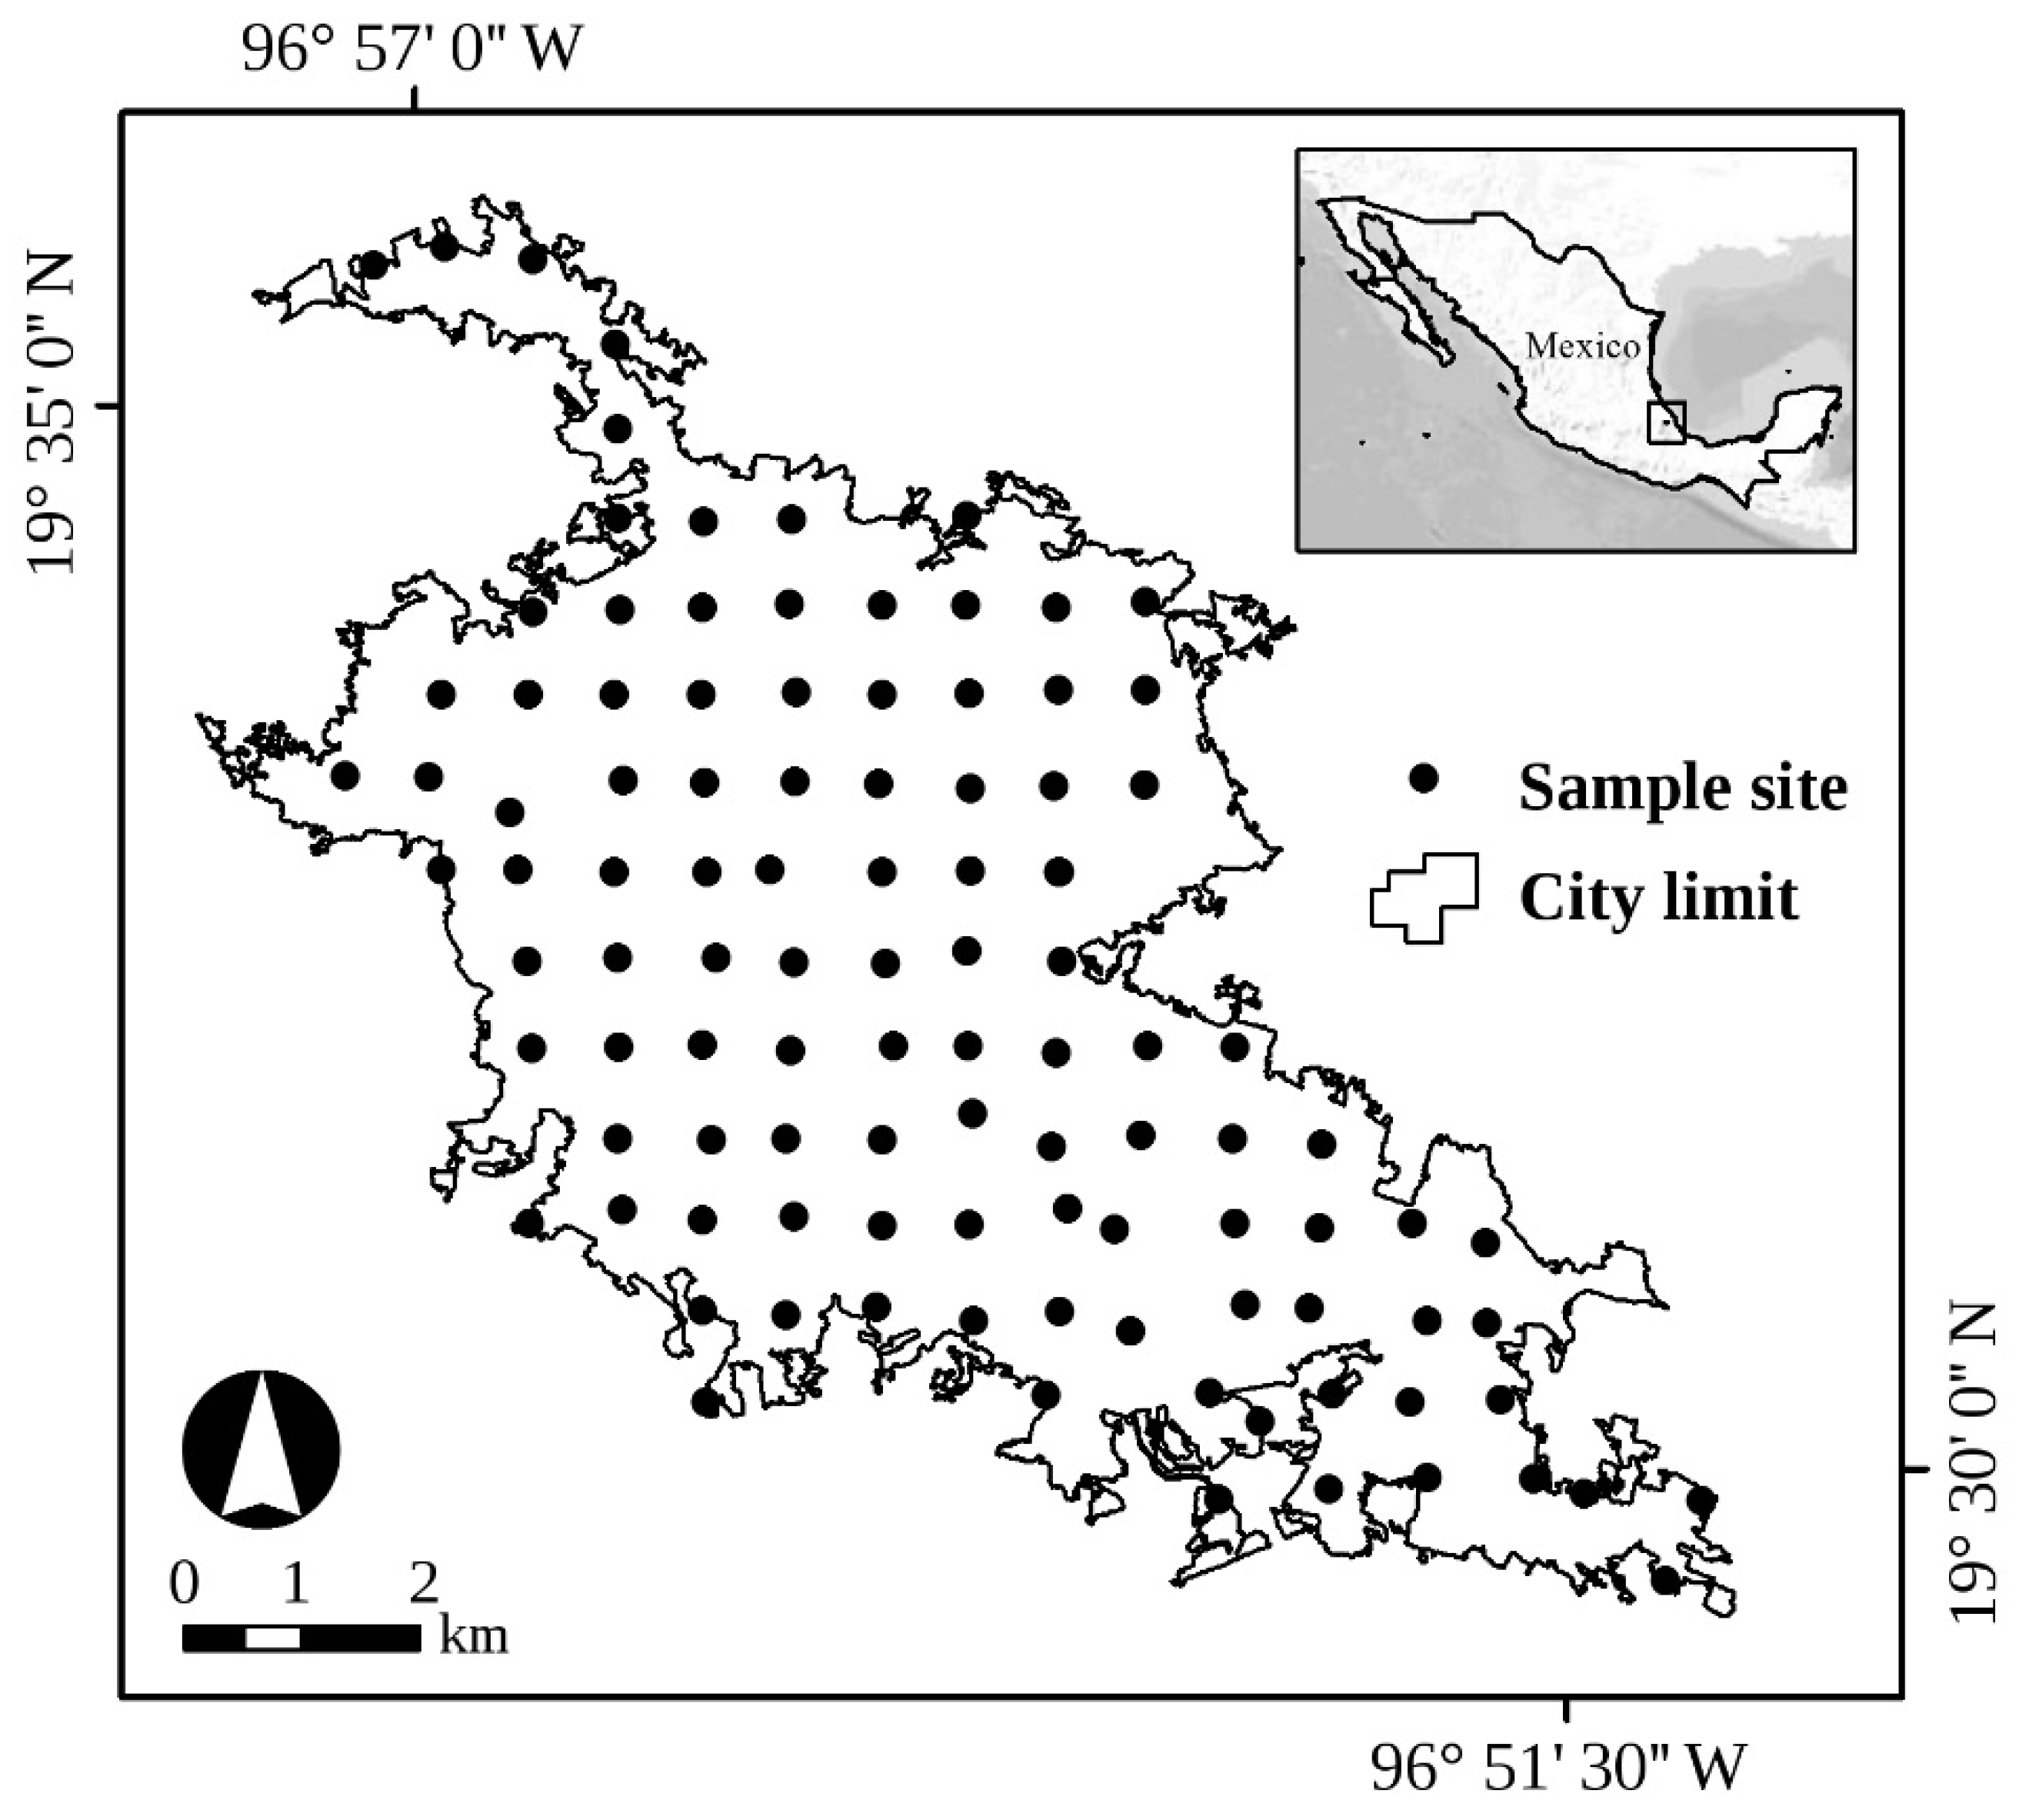
3.1. Study Area

Xalapa is the state capital and second largest urban area of Veracruz. Located in eastern-central Mexico (19°29′N–19°36′N, 96°51′W–96°58′W; 1120–1720 m asl), Xalapa has a population of 597,256 inhabitants (including the three neighboring municipalities located within the urban continuum of Xalapa: Banderilla, Tlalnelhuayocan, Emiliano Zapata) [42]. In terms of human population, the number of inhabitants in Xalapa has grown importantly since the 1980s, with an average growth of ~110,000 inhabitants per decade [42,43,44,45]. Its expansion has occurred, in general, without proper planning [46], increasing linearly since the 1950s, with an average growth of 13.8 km2 per decade [47].
For this study, we established the boundaries of Xalapa following [48] and an unpublished spatial procedure (Ian MacGregor-Fors personal observation). Briefly, we set the limits of the city by drawing (on-screen) the boundary between urban and non-urban areas on an up-to-date high-resolution satellite image. We then randomly set a 750 m × 750 m grid on the polygon of the city, considering all quadrat centroids as sampling sites. Later, in the field, we adjusted the position of each sampling site to the nearest public land where sampling was feasible (given that several points were originally set at unaccessible areas). The resulting number of sampling sites was 110, which was reduced to 106 due to security reasons at the periphery of the city (Figure 1). It is noteworthy that citywide surveys provide a representative sample of the physical, environmental, and socioeconomic variance of a city [10]; however, as happens with large spatial-scale studies, sampling intensity is often compromised when considering single observer surveys to avoid potential biases [49].

3.2. Butterfly Surveys

We surveyed butterflies in a 36 m radius circular area at each survey site, performing random walks for 30 min. To avoid potential multiple observer biases [49], a single observer (Lorena Ramírez-Restrepo) visited all sampling sites once between August and October of 2013, when most butterfly species can be recorded as adults in the study area [34]. She carried out all of the surveys between 9:00–16:20 h, in days with no rain and with environmental temperatures >20 °C, which are the conditions for peak butterfly activity. She used entomological aerial nets and direct observations to record all butterflies in the surveyed space and time. She kept all captured butterflies in portable soft cages to decrease the probability of recounting individuals. At the end of each survey period, she released the identified captured individuals and collected those that remained unidentified as voucher specimens.

3.3. Data Analysis

We estimated the total abundance of butterflies of Xalapa in the surveyed space and time using ordinary kriging interpolation procedures (using GenStat [50]). Briefly, kriging is a geostatistical method of interpolation that generates the best unbiased prediction of intermediate values (where no data are available) between neighboring known values [51]. This method results in a continuum of interpolated information conformed by predicted pixels. Due to its robustness, this method is widely used in several disciplines and is starting to become common in ecological studies [33,52,53,54]. To generate interpolated information based on our butterfly surveys, we square root transformed the observed abundances per sampling site in order to comply with normality and skewness [55]. Subsequently, we generated a semivariogram using a square area that represents the same area of our circular surveys (4071.5 m2; 36 m radius surveys) and taking into account 7–20 neighbors. The semivariogram was adjusted to the theoretical linear, exponential, circular, and spherical models. Both, the circular and the spherical models were those that best fit our data (Table 1). Finally, we carried out the ordinary kriging procedure with the adjusted semivariograms (i.e., circular, spherical models) [50]. The results of this procedure allowed us to calculate the interpolated (predicted) total abundance of butterflies of the city in the surveyed space and time for both models. We used descriptive statistics to compare the observed and predicted values for both models to assess the reliability of our procedures. We also sought for possible correlations between the observed number of butterflies per sampling site and the difference between the observed and the predicted butterfly abundance value.
Table 1. Semivariogram modeling parameters. Best fitted models correspond to those with lowest mean square residuals. The exponential model was not considered given the negative nugget variance value.
ModelRangeSill VarianceNugget VarianceMean sq. Residuals
Linear 0.00041.9950.2112
Exponential339.93.4180−0.3430.0126
Circular976.32.47400.5680.0158
Spherical1089.02.52400.5190.0158

Acknowledgments

We are most grateful to Margaret A. Oliver for her support in the use of the GenStat program and to Gonzalo Halffter Salas, Sergio Guevara Sada, Keith Willmott, and three anonymous reviewers for their comments and suggestions, which greatly enhanced the quality and clarity of our paper. We also thank Ina Falfan and Richard Lemoine Rodríguez for their assistance with the use of GIS, and Jeffrey G. Lee for proofreading our paper. This study was partially funded by the Dirección General del Instituto de Ecología, A.C. (INECOL) through the “Proyectos de Investigación de Alto Valor Estratégico para la Sociedad” (project: “Patrones ecológicos y percepción social de la diversidad biológica que habita en la ciudad de Xalapa: Un enfoque multidisciplinario”). Lorena Ramírez-Restrepo acknowledges the scholarship and financial support provided by the National Council of Science and Technology (CONACYT 213179/244461, Convocatoria 290649), COLCIENCIAS (Convocatoria 568-2012), and the Doctoral Program of INECOL. Carlos Andrés Cultid-Medina was supported with a national Ph.D. Educational Condonable Credit by COLCIENCIAS, generación bicentenario (2010), and funding from the Red de Ecoetología (Instituto de Ecología, A.C).

Author Contributions

Lorena Ramírez-Restrepo and Ian MacGregor-Fors conceived the idea; Lorena Ramírez-Restrepo and Ian MacGregor-Fors set the survey design; Lorena Ramírez-Restrepo collected and processed the data; Lorena Ramírez-Restrepo, Carlos Andrés Cultid-Medina and Ian MacGregor-Fors performed analyses; Lorena Ramírez-Restrepo led the writing.

Conflicts of Interest

The authors declare no conflict of interest.

References

  1. Department of Economic and Social Affairs, Population Division, United Nations. World Urbanization Prospects: The 2014 Revision, Highlights (ST/ESA/SER.A/352); United Nations: New York, NY, USA, 2014. [Google Scholar]
  2. Buhaug, H.; Urdal, H. An urbanization bomb? Population growth and social disorder in cities. Glob. Environ. Chang. 2013, 23, 1–10. [Google Scholar] [CrossRef]
  3. Vitousek, P.M.; Mooney, H.A.; Lubchenco, J.; Melillo, J.M. Human domination of Earth’s ecosystems. Science 1997, 277, 494–499. [Google Scholar] [CrossRef]
  4. Tilden, J. San Francisco’s vanishing butterflies. Lepid. News 1956, 10, 133–145. [Google Scholar]
  5. Shapiro, A.M.; Shapiro, A.R. The ecological associations of the butterflies of Staten Island. J. Res. Lepid. 1973, 12, 65–128. [Google Scholar]
  6. Czech, B.; Krausman, P.R.; Devers, P.K. Economic associations among causes of species endangerment in the United States. Bioscience 2000, 50, 593–601. [Google Scholar] [CrossRef] [Green Version]
  7. McKinney, M.L. Effects of urbanization on species richness: A review of plants and animals. Urban Ecosyst. 2008, 11, 161–176. [Google Scholar] [CrossRef]
  8. Pickett, S.T.A.; Boone, C.G.; McGrath, B.P.; Cadenasso, M.L.; Childers, D.L.; Ogden, L.A.; McHale, M.; Grove, J.M. Ecological science and transformation to the sustainable city. Cities 2013, 32, S10–S20. [Google Scholar] [CrossRef]
  9. Voinov, A.; Farley, J. Reconciling sustainability, systems theory and discounting. Ecol. Econ. 2007, 63, 104–113. [Google Scholar] [CrossRef]
  10. McCaffrey, R.E.; Turner, W.R.; Borens, A.J. A new approach to urban bird monitoring. Urban Bird Ecol. Conserv. 2012, 45, 139–154. [Google Scholar]
  11. Dearborn, D.C.; Kark, S. Motivations for conserving urban biodiversity. Conserv. Biol. 2010, 24, 432–440. [Google Scholar] [CrossRef] [PubMed]
  12. McDonnell, M.J.; Hahs, A.K. The future of urban biodiversity research: Moving beyond the “low-hanging fruit”. Urban Ecosyst. 2013, 16, 397–409. [Google Scholar] [CrossRef]
  13. Brown, K.S., Jr.; Freitas, V.A.L. Butterfly communities of urban forest fragments in Campinas, Sao Paulo, Brazil: Structure, instability, environmental correlates, and conservation. J. Insect Conserv. 2002, 6, 217–231. [Google Scholar] [CrossRef]
  14. Bergerot, B.; Merckx, T.; van Dyck, H.; Baguette, M. Habitat fragmentation impacts mobility in a common and widespread woodland butterfly: Do sexes respond differently? BMC Ecol. 2012, 12, Article 5. [Google Scholar] [CrossRef] [PubMed]
  15. Bergerot, B.; Fontaine, B.; Renard, M.; Cadi, A.; Julliard, R. Preferences for exotic flowers do not promote urban life in butterflies. Landsc. Urban Plan. 2010, 96, 98–107. [Google Scholar] [CrossRef]
  16. Ortega-Álvarez, R.; MacGregor-Fors, I. Spreading the word: The ecology of urban birds outside the United States, Canada and Western Europe. Auk 2011, 128, 415–418. [Google Scholar] [CrossRef]
  17. Aronson, M.F.J.; la Sorte, F.A.; Nilon, C.H.; Katti, M.; Goddard, M.A.; Lepczyk, C.A.; Warren, P.S.; Williams, S.G.; Cilliers, S.; Clarkson, B.; et al. A global analysis of the impacts of urbanization on bird and plant diversity reveals key anthropogenic drivers. Proc. R. Soc. B 2014, 281. [Google Scholar] [CrossRef] [PubMed]
  18. Ortega-Álvarez, R.; MacGregor-Fors, I. Living in the big city: Effects of urban land-use on bird community structure, diversity, and composition. Landsc. Urban Plan. 2009, 90, 189–195. [Google Scholar] [CrossRef]
  19. Leveau, C.M.; Leveau, L.M. Avian community response to urbanization in the Pampean region, Argentina. Ornitol. Neotrop. 2005, 16, 503–510. [Google Scholar]
  20. Ramírez Restrepo, L.; Halffter, G. Butterfly diversity in a regional urbanization mosaic in two Mexican cities. Landsc. Urban Plan. 2013, 115, 39–48. [Google Scholar] [CrossRef]
  21. Lepczyk, C.A.; Flather, C.H.; Radeloff, V.C.; Pidgeon, A.M.; Hammer, R.B.; Liu, J. Human impacts on regional avian diversity and abundance. Conserv. Biol. 2008, 22, 405–416. [Google Scholar] [CrossRef] [PubMed]
  22. Ortega-Álvarez, R.; MacGregor-Fors, I. Dusting-off the file: A review of knowledge on urban ornithology in Latin America. Landsc. Urban Plan. 2011, 101, 1–10. [Google Scholar] [CrossRef]
  23. Dallimer, M.; Rouquette, J.R.; Skinner, A.M.J.; Armsworth, P.R.; Maltby, L.M.; Warren, P.H.; Gaston, K.J. Contrasting patterns in species richness of birds, butterflies and plants along riparian corridors in an urban landscape. Divers. Distrib. 2012. [Google Scholar] [CrossRef]
  24. Sandström, U.G.; Angelstam, P.; Mikusiński, G. Ecological diversity of birds in relation to the structure of urban green space. Landsc. Urban Plan. 2006, 77, 39–53. [Google Scholar] [CrossRef]
  25. McIntyre, N.E. Ecology of urban arthropods: A review and a call to action. Ann. Entomol. Soc. Am. 2000, 93, 825–835. [Google Scholar] [CrossRef]
  26. Kellert, S.R. Values and perceptions of invertebrates. Conserv. Biol. 1993, 7, 845–855. [Google Scholar] [CrossRef]
  27. Bergerot, B.; Tournant, P.; Moussus, J.P.; Stevens, V.M.; Julliard, R.; Baguette, M.; Foltête, J.C. Coupling inter-patch movement models and landscape graph to assess functional connectivity. Popul. Ecol. 2013, 55, 193–203. [Google Scholar] [CrossRef]
  28. Thomas, J.A. Monitoring change in the abundance and distribution of insects using butterflies and other indicator groups. Philos. Trans. R. Soc. Lond. B Biol. Sci. 2005, 360, 339–357. [Google Scholar] [CrossRef] [PubMed]
  29. Turner, W.R.; Nakamura, T.; Dinetti, M. Global Urbanization and the Separation of Humans from Nature. Bioscience 2004, 54, 585. [Google Scholar] [CrossRef]
  30. Ruszczyk, A. Distribution and abundance of butterflies in the urbanization zones of Porto Alegre, Brazil. J. Res. Lepid. 1986, 25, 157–178. [Google Scholar]
  31. Ruszczyk, A.; Mellender de Araujo, A. Gradients in butterfly species diversity in an urban area in Brazil. J. Lepid. Soc. 1992, 46, 255–264. [Google Scholar]
  32. Fuller, R.A.; Tratalos, J.; Gaston, K.J. How many birds are there in a city of half a million people? Divers. Distrib. 2009, 15, 328–337. [Google Scholar] [CrossRef]
  33. Walker, J.S.; Balling, R.C.; Briggs, J.M.; Katti, M.; Warren, P.S.; Wentz, E.A. Birds of a feather: Interpolating distribution patterns of urban birds. Comput. Environ. Urban Syst. 2008, 32, 19–28. [Google Scholar] [CrossRef]
  34. Hernández Baz, F. La fauna de Mariposas (Lepidoptera: Rhopalocera) de Xalapa, Veracruz, Mexico. La Ciencia y el Hombre 1993, 14, 55–88. (In Spanish) [Google Scholar]
  35. Butterflies of America. Available online: butterfliesofamerica.com. (accessed on 20 January 2015).
  36. McGill, B.J.; Etienne, R.S.; Gray, J.S.; Alonso, D.; Anderson, M.J.; Benecha, H.K.; Dornelas, M.; Enquist, B.J.; Green, J.L.; He, F.; et al. Species abundance distributions: Moving beyond single prediction theories to integration within an ecological framework. Ecol. Lett. 2007, 10, 995–1015. [Google Scholar] [CrossRef] [PubMed]
  37. Ehrlich, P.R.; Raven, P.H. Butterflies and plants: A study in coevolution. Evolution 1964, 18, 586–608. [Google Scholar] [CrossRef]
  38. Pin Koh, L.; Sodhi, N.S. Importance of reserves, fragments, and parks for butterfly conservation in a tropical urban landscape. Ecol. Appl. 2004, 14, 1695–1708. [Google Scholar]
  39. Miller, J.R.; Hobbs, R.J. Conservation where people live and work. Conserv. Biol. 2002, 16, 330–337. [Google Scholar] [CrossRef]
  40. MacGregor-Fors, I.; Avendaño-Reyes, S.; Bandala, V.M.; Chacón-Zapata, S.; Díaz-Toribio, M.H.; González-García, F.; Lorea-Hernández, F.; Martínez-Gómez, J.; Montes de Oca, E.; Montoya, L.; et al. Multi-taxonomic diversity patterns in a neotropical green city: A rapid biological assessment. Urban Ecosyst. 2015, 18, 633–647. [Google Scholar] [CrossRef]
  41. Rosenzweig, M. Win-Win Ecology—How the Earth’s Species Can Survive in the Midst of Human Enterprise; Oxford University Press: New York, NY, USA, 2003; p. 224. [Google Scholar]
  42. Instituto Nacional de Estadística Geografía e Informática (INEGI). Censo de Población y Vivienda 2010; INEGI: Aguascalientes, Mexico, 2011. (In Spanish) [Google Scholar]
  43. INEGI. Censo de Población y Vivienda 1980; INEGI: Aguascalientes, Mexico, 1980. (In Spanish) [Google Scholar]
  44. INEGI. Censo de población y vivienda 1990; INEGI: Aguascalientes, Mexico, 1990. (In Spanish) [Google Scholar]
  45. INEGI. Censo de población y vivienda 2000; INEGI: Aguascalientes, Mexico, 2000. (In Spanish) [Google Scholar]
  46. Benítez, G.; Pérez-Vázquez, A.; Nava-Tablada, M.; Equihua, M.; Álvarez-Palacios, J.L. Urban expansion and the environmental effects of informal settlements on the outskirts of Xalapa city, Veracruz, Mexico. Environ. Urban 2012, 24, 149–166. [Google Scholar] [CrossRef]
  47. Lemoine-Rodríguez, R. Cambios en la Cobertura Vegetal de la Ciudad de Xalapa-Enríquez, Veracruz y Zonas Circundantes Entre 1950 y 2010. Bachelor’s Thesis, Universidad Veracruzana, Xalapa, Mexico, 2012. [Google Scholar]
  48. MacGregor-Fors, I. How to measure the urban-wildland ecotone: Redefining “peri-urban” areas. Ecol. Res. 2010, 25, 883–887. [Google Scholar] [CrossRef]
  49. Ruxton, G.; Colegrave, N. Experimental Design for the Life Sciences; Oxford University Press: Oxford, UK, 2010. [Google Scholar]
  50. Payne, R.W.; Murray, D.A.; Harding, S.A.; Baird, D.B.; Soutar, D.M. GenStat for Windows, 11th ed.; VSN Introduction: England, UK, 2008. [Google Scholar]
  51. Oliver, M.A. The variogram and kriging. In Handbook of Applied Spatial Analysis: Software Tools, Methods and Applications; Fischer, M.M., Getis, A., Eds.; Springer Science & Business Media: Berlin, Germany, 2009; pp. 319–352. [Google Scholar]
  52. Sauer, J.R.; Pendleton, G.W.; Orsillo, S. Mapping of Bird Distributions from Point Count Surveys. Monitoring Bird Populations by Point Counts; US Department of Agriculture, Forest Service General Technical Report PSW-GTR-149; Pacific Southwest Research Station: Albany, CA, USA, 1995; pp. 151–160. [Google Scholar]
  53. Valley, R.D.; Drake, M.T.; Anderson, C.S. Evaluation of alternative interpolation techniques for the mapping of remotely-sensed submersed vegetation abundance. Aquat. Bot. 2005, 81, 13–25. [Google Scholar] [CrossRef]
  54. Pebesma, E.J.; Duin, R.N.; Burrough, P.A. Mapping sea bird densities over the North Sea: Spatially aggregated estimates and temporal changes. Environmetrics 2005, 16, 573–587. [Google Scholar] [CrossRef]
  55. Lin, Y.P.; Yeh, M.S.; Deng, D.P.; Wang, Y.C. Geostatistical approaches and optimal additional sampling schemes for spatial patterns and future sampling of bird diversity. Glob. Ecol. Biogeogr. 2008, 17, 175–188. [Google Scholar] [CrossRef]

