Next Article in Journal
The Justice Dimension of Sustainability: A Systematic and General Conceptual Framework
Next Article in Special Issue
Network Theory Integrated Life Cycle Assessment for an Electric Power System
Previous Article in Journal
Alternative Labeling Programs and Purchasing Behavior toward Organic Foods: The Case of the Participatory Guarantee Systems in Brazil
 
 
Correction published on 30 October 2015, see Sustainability 2015, 7(11), 14597-14598.
Article

Co-Benefits of Household Waste Recycling for Local Community’s Sustainable Waste Management in Thailand

by
Amornchai Challcharoenwattana
1,2,† and
Chanathip Pharino
2,3,*,†
1
International Postgraduate Programs in Environmental Management, Graduate School, Chulalongkorn University, Bangkok 10330, Thailand
2
Center of Excellence on Hazardous Substance Management (HSM), Chulalongkorn University, Bangkok 10330, Thailand
3
Department of Environmental Engineering, Faculty of Engineering, Chulalongkorn University, Bangkok 10330, Thailand
*
Author to whom correspondence should be addressed.
These authors contributed equally to this work.
Sustainability 2015, 7(6), 7417-7437; https://doi.org/10.3390/su7067417
Submission received: 27 February 2015 / Revised: 25 May 2015 / Accepted: 28 May 2015 / Published: 9 June 2015

Abstract

:
The study aimed to evaluate co-benefits in term of GHG reduction, and avoided landfill costs by implementing a community-based management (CBM) program for municipal solid waste (MSW). Two towns of peri-urban settlement in Thailand were investigated in case studies to compare eco-performance between the towns with and without implementation of the CBM program. MSW mass flows together with MSW utilization records were analyzed based on data in year 2013. Climate co-benefits from waste utilization activities were examined. Results from the study indicated that waste banks in the CBM program can effectively divert most of recyclables from entering landfills. The performance of “waste bank—recyclable recovery program” recycling rate from the case study with CBM is 172.20 kg per member per year, which is about 926% higher than average CBMs with MSW recycling in Thailand, and the success of CBM can be attributed to its curbside pickup service and fair-pricing of recyclables. The study also found that if the town decided to divert wastes from landfilling, carbon intensity of the MSW system would be 0.47 tons of CO2-eq per ton of collected MSW. The landfilling cost would be approximately 7.41 USD per ton of MSW as landfilling cost. With CBM programs, current MSW reutilization rate has achieved 9.68% of generated waste, and 16.80% of GHG emission has been avoided, along with a reduction in landfill costs of 11.57%. Two scenarios of waste utilization in Thailand were explored and compared, in terms of which scenarios yielded the highest co-benefits. The study demonstrates that by allowing local mechanism and community involvement programs to develop with operational waste banks, the efficiency of collecting recycling wastes increased. A similar system can be applied to other communities in other countries.

1. Introduction

1.1. Problems of Traditional MSW Management Practices

Over the last few decades, negative impacts of landfill has become one of the major causes of environmental quality deterioration, particularly of worsening of groundwater quality, poor air quality from emitted gases and noxious odors, and worsening climate change impact [1,2,3]. Not surprisingly, employing landfill has become a less preferred MSW management (MSWM) technique. Moreover, stakeholders who live around landfills often suffer from deteriorated aesthetic and living quality in their neighborhood [4] and depressed property value [5,6]. The pressure of finding alternative means to handle MSW continues to challenge the capability of the MSWM system. Under the presence of urbanization, MSW generation rates have been found to accelerate along with increases of population size and wealth [7]. MSW composition has also changed according to various stages of urbanization. Generally, MSW composition in a less urbanized town tends to contain mostly food wastes while a more urbanized town tends to contain more diverse waste with a rising proportion of paper and plastic wastes [8].
Promoting MSW separation and recycling has become one of approaches to reduce MSW landfilling. Many countries, e.g., Japan, South Korea and the USA, approach the rising MSW generation through mandating waste separation and charging a relatively higher fee for landfilling MSW as a deterrence of landfilling mixed and unsorted wastes. The strategies involve at-source waste separation of recyclables from the regular wastes to minimize relatively high MSW disposal fees. There are, however, cases of waste generators outsmarting the volume-based MSW pricing system by compacting their refuses to reduce disposal cost [9]. Also, some MSW generators illegally dispose their refuses on neglected spaces or in neighbors’ trash containers [10,11]. Hence, alternative modes to promote MSW separation may yield better results in term of recycling efficiency.
Thailand, like many other developing countries, is also facing problems of rising MSW generation. The trend continues to grow upward according to Thailand’s Pollution Control Department [PCD] [12]. Daily MSW generation rates were found to be at 0.91 kg per capita in the smallest towns, classified by Thailand’s Department of Local Administration where population size is lower than 5000, to 1.89 kg per capita in fully urbanized towns, classified by Thailand’s Department of Local Administration where population size is higher than 50,000. Table 1 suggests that Thailand’s MSW compositions are also similar to other developing countries whereby organic wastes are the dominating waste type in all town sizes. Plastic and paper, however, gain a higher share of the waste stream in more urbanized towns. Public finances for MSWM often fail to provide and enforce incentives for MSW separation and recycling. From Table 2, the majority of towns in Thailand still employ unsounded disposal methods as alternatives, i.e., open dumping or open burning. This is because of the benefits of having relatively lower out-of-pocket cost as compared to other more advanced MSWM methods [8]. Environmental impact assessment (EIA) for landfill construction in Thailand is not required [Notification of the Ministry of Natural Resources and Environment dated 24 April B.E. 2555 (2012)] while some MSWM technologies, e.g., incinerator with electricity generator with 10 MW, are required to conduct an EIA. Despite relatively more relaxed rules for landfill chartering, many landfills, however, often face strong oppositions from stakeholders. For example, in 2012, seven out of 121 sanitary landfills in Thailand were put on suspension or unable to be commenced due to protests and legal proceedings [12].
Table 1. Composition of MSW in developing countries and selected cities.
LocationsGeneration Rate (kg/capita·day)Organic (%)Paper (%)Plastic (%)Glass (%)Metal (%)Other (%)
Average Low Income Countries [8]0.664583317
Average Lower middle income Countries [8]0.79599123215
Average Upper middle income Countries [8]1.25414115313
Average High Income Countries [8]2.12831117617
Bangkok, Thailand [13]1.575011.322.52.71.712
Phnom Penh, Cambodia [14] cited in [15]0.7469.66.415.51.20.67
Delhi, India [16]0.538.65.6610.249
Beijing, China [17]0.8563.411.112.71.80.311
Table 2. Statistics of MSWM methods in Thailand [18].
MSWM MethodsDetailsNumbers of Sites
Compliance to Thailand’s MSWM standardsSanitary/Engineered landfill73
Controlled Dump367
Incinerator with appropriate pollution control equipment10
Waste-to-Energy system1
Mechanical-Biological treatment3
Integrated solid waste management12
Non-compliance to Thailand’s MSWM standardsControlled Dump24
Open dump1955
Incinerator with not-up-to-standard pollution control equipment45
Total2490

1.2. Greenhouse Gas (GHG) Emission and Climate Co-Benefits in MSWM

Landfilling MSW can worsen climate change mitigation due to GHG generation throughout the process of MSWM. GHG emissions, e.g., CO2, CH4, N2O, etc., are emitted from anaerobic and aerobic decomposition of organic wastes, i.e., food, leaf, paper, etc. [19]. GHG emissions also come from fossil fuel combustion in the MSW collection and treatment processes [20,21]. Different methods of burying MSW can yield different levels of GHG emissions. Intergovernmental Panel on Climate Change [IPCC] [22] guideline suggests that the methane generating factor is 100% under deep-depth burying schemes (more than 10 m from surface) and 40% in shallow-depth burying schemes (less than 5 meter from surface). In general, landfilling of MSW without any pre-treatment or landfill gas recovery emits GHG approximately 1.00–1.70 tons of CO2-eq per ton of waste [23,24,25]. Flaring methane may not be a complete solution as a significant percentage of fugitive methane is still released [3,26]. Method of waste collection and handling of waste also contributes differently to GHG emission rates varying from operations in rural or urban areas [27].
Climate co-benefits from reduction of organic wastes into landfill are recognized mainly through the decrease of methane generation and the methane capture and utilization. Home-composting or biogas generation is the primary alternative for organic waste reutilization [28]. Kurniawan, et al. [29] explored the use of Takakura Home Composting method to manage organic wastes at the household level in Surabaya, Indonesia. The study reported climate co-benefits of 3421 million tons of reduced CO2-eq emission per year. Nevertheless, poorly managed composting and biogas generation may contribute to GHG generation from semi-aerobic or anaerobic conditions [30]. The study found that up to 4 g of CH4/kg of wet waste and 0.3 g of N2O/kg can be formed in the deep layers of the composting piles. It should be noted that well-managed composting generally offers net avoided GHG emission [22].
For recyclable wastes, various LCA studies demonstrate wide ranges of GHG emissions when raw materials are produced by recycled and virgin materials. For recyclables, climate co-benefits are generated by diverting recyclables from being landfilled and are recycled as raw materials. Eriksson, et al. [31] studied different MSWM scenarios in three Swedish municipalities and found that implementation of material sorting followed by reutilization of energy-rich wastes and recyclable materials is superior to putting all wastes into landfill in terms of GHG emissions. Overall, most separated wastes, i.e., glass, plastic, paper, metals, and aluminum, that enter into the recycling and remanufacturing system yield the least environmental impacts or even create positive outcomes for the environment by helping to reduce environmental impacts and GHG emissions [32,33].

1.3. Community-Based MSWM

Community-based management (CBM) is a bottom-up approach to solve problems where members of the community function as core operators. Efficiency comparisons between CBM and traditional models often found that CBM can resolve issues effectively with less burden on other taxpayers [34,35,36]. Employing CBM as a tool for resource management has been found in the fields of water resource management [37,38], forest management [39,40], community services [41,42], etc.
For solid waste management, CBM activities are employed for both regular MSW services and specific waste services. For regular MSW services, CBM members collect refuses from households, and sort and manage wastes [43,44]. Specific waste services focus on certain types of waste, e.g., only accept recyclables for further recycling activities or only organic wastes for composting/biogas generation. In addition to promoting better resource reutilization, associated benefits of CBM in MSW are also reported such as rising incomes for CBM members due to better economy of scale and the reduction of health risks from random scavenging [45]. An example can be found in the city of Surabaya, Indonesia where it successfully manages organic wastes using a community composting system [29,46]. Other examples include the recycling program by waste picking service of Zabbaleen group in Cairo, Egypt or CBM projects in Lusaka [44,47]. In Thailand, CBM for MSWM are often chartered as “waste bank programs”. Program operators act as an intermediary in order to sell sorted recyclables at greater net revenues. Activities are often taken part in as a collaboration between waste generators and other entities that agree to host recyclables at their site (often at schools or community centers). Success of waste bank activities in Thailand has been varied depending on the social structure and political situation [48,49]. Examples of community-based MSWM are provided in Table 3.
Table 3. Performance of community-based MSWM.
ActivityIncentiveReutilization Metric
Regular MSW Collection and Disposal Service
Enugu, Nigeria [50]Cash revenue higher than minimum wagePotential earning of 3.91–5.47USD per day
Guiyang, People Republic of China [51]Monetary incentive for MSW separation87.3% of MSW is separated
Nungankkan, India [52]De facto rights to provide service6.5% of generated MSW is sold
Jubilee Hills, India [52]De facto rights to provide service25% of generated MSW, 1/2 as compost, and 1/2 as recyclables
Waste Bank Operations
Rayong municipality, Thailand [53]Community recognition and cash return17.33 kg/member
Yala municipality, Thailand [48]Bartering between unused recyclables to egg15.71 kg/member
Averaged 10 community-based programs in Thailand [49]Community recognition and cash return18.6 kg/member
Average 100 school-based programs in Thailand [49]Community recognition and cash return32.13 kg/member
This study aimed to quantify and benchmark co-benefits of engaging in CBM of municipal solid waste reutilization with GHG abatement and reduced landfilling costs. Though the boundary of this study is within Thailand, findings from this research may also be applicable to other developing countries that may face a similar waste management situation. The objective of this study is to evaluate co-benefits in terms of GHG reduction and avoided landfill costs from implementation of community-based management (CBM) programs for municipal solid waste (MSW). The study also focused on demonstration mechanism at the local level and community involvement programs with operational waste banks. The efficiency of collecting recycling wastes can be increased. Similar systems can be applied to other communities in other countries.

1.4. Site Description

1.4.1. Targeted Study Site: Thumbon Phang Khon Municipality (PKM)

Thumbon Phang Khon municipality (PKM), depicted in Figure 1, is a small municipality located in Sakon Nakorn province in the northeastern region of Thailand. The municipality is well recognized for its MSW reutilization activities.
PKM runs a voluntary MSW collection service that charges members 1.95 USD (Exchange rate: 1 USD = 30.73 Thai Baht) per household per year to receive waste collection service daily. PKM operates a semi-sanitary landfill with an oxidative pond for leachate treatment. At the time of study, there is no material recovery facility at the landfill but the municipality allows scavenging activities between 8:00 and 14:00 daily. The landfill is also contracted to accept MSW from other municipalities at the rate of 16.27 USD/ton, and 32.54 USD/ton if the MSW comes from a private entity.
PKM also facilitates two voluntary MSW reduction programs to reduce landfilling of MSW including:
  • Waste bank program: PKM staffs collect recyclable wastes from 11 villages according to prearranged schedule by visiting two to three villages every Thursday. The municipality acts as a trader by buying recyclables, i.e., plastics, paper, glass, aluminum items, and metals, from waste bank’s members and sorts these recyclables to increase the resale value. Finally, the municipality sells sorted materials to a recycling company. Transactions between PKM’s waste bank and its members are settled in a credit system. Members and waste bank officers witness the weighting and sign in the transaction recording book. The members can withdraw their balances every Monday of the following week. The program, as an incentive, also provides around 160 USD funeral-assistance benefit to family members of whom pass away if two conditions are met: (1) the member maintains a minimum of 16.27 USD in his/her waste bank account at the time of death and (2) the member sells their recyclables to the waste bank within the last month before his or her death. As of October 2013, there are 522 members actively participating in the program.
  • Organic waste reutilization program: PKM provides technical support to its residents by installing waste composting bins and household-scale biogas generating systems at a subsidized cost, and routinely visits the participants. Residuals from biogas generation and compost are used in rice fields and for other agricultural practices in the municipality.
Figure 1. Map of Thumbon Phang Khon Municipality (PKM) (Courtesy of Google).
Sustainability 07 07417 g001

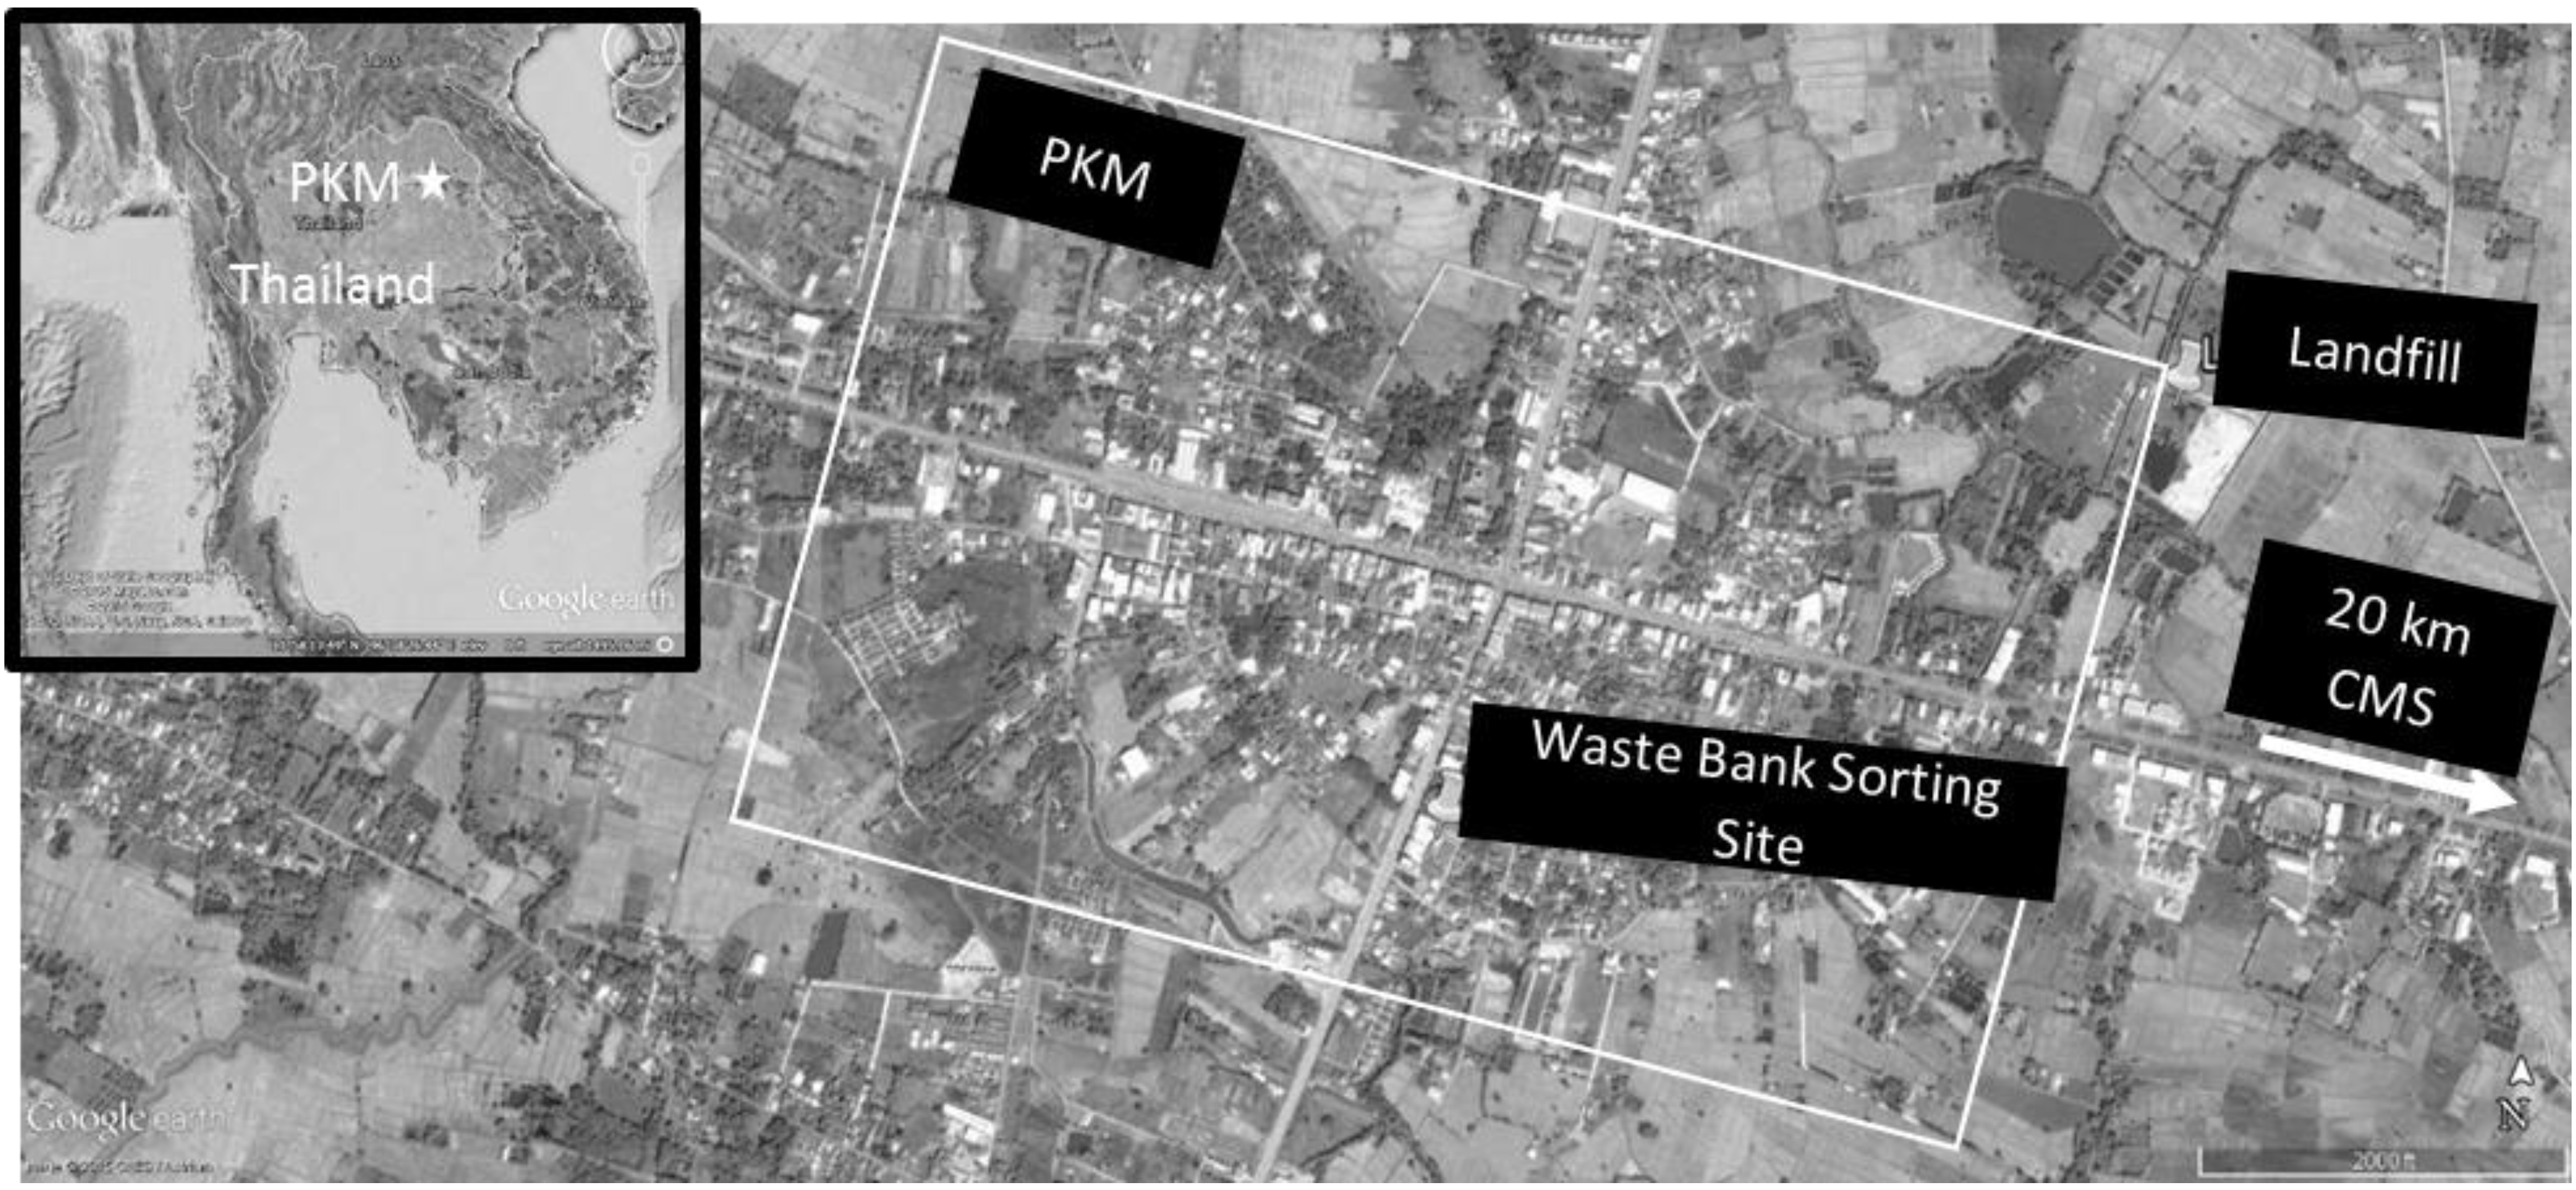
1.4.2. Reference Site: Chang Ming Sub-District Administration Organization (CMS)

Chang Ming Sub-district Administration Organization (CMS), located within the vicinity of PKM, is an administrative area that is not qualified to be chartered as a municipality, due to its failure to meet the requirements of minimum self-collected tax revenue. The MSW collection service is on a voluntary-basis in which the subscribers pay 1 USD per month for a pickup of each 120-L trash bin on a weekly basis. The residents can also opt to manage MSW themselves. Despite being classified as non-municipality, CMS was selected for comparison with MSW characteristics from PKM because CMS service subscribers are mostly living in an urbanized part of the administrative area. CMS is the only urban settlement within proximity to PKM that does not officially promote any MSW reduction program at the time of this study.
Table 4. Socio-economic background of PKM and CMS.
AspectsPhang Khon municipality (PKM)Chang Ming Sub-district Administration (CMS)
Major economic activitiesRetails, government office, private sectorAgricultural
Area under management (km2)3.2951.2
Percent of household subscribing to waste collection service100.00%37.68%
populations receiving MSW service68483478
Annual generation rate per registered population372.30 kg/capita322.15 kg/capita
Frequency of MSW collectionMore frequent than every 3 daysWeekly basis
Government-facilitated MSW recycling systemYes—waste bank, composting, and household biogasNo

2. Methodology

2.1. Identifying Annual MSW Quantity from Household

Accurate estimation of at-source MSW generation is crucial for the evaluation of effectiveness in terms of MSW reduction activities. This study attempted to verify performances of MSWM from PKM and CMS. The unit of analysis was set as “an annual MSW generation of the town ( W M S W ) ” which is equivalent to
W M S W = W L f i + W R e i + ε
where W Lf i = quantity of MSW arrived at the landfill; W Re i = quantity of reutilized MSW by organic waste reutilization and the waste bank; ε = quantity of MSW missing from MSWM; i = Waste types, i.e., organic waste, plastic, paper, etc.
The true value of ε , by its nature, is, however, unknown. An approximation of ε parameter can be estimated by comparing the accounted weight of MSW ( W M S W b u ) against that of a top-down approach ( W M S W t d ) which is calculated by multiplying Thailand’s default MSW generation rate per capita to the number of populations receiving MSW service (listed in Table 4). The mass balance equation can be expressed as follows:
W M S W = ( W M S W b u ) = ( W M S W t d ) = W L f i + W R e i + ε

2.2. Duration of Data Collection for MSW Characterization

The characterizations of MSW from PKM and CMS were conducted on 28 and 29 October 2013 at the landfill to estimate the percentage of each waste type that arrives at the landfill. MSW was segregated until the volume of MSW was reduced to 200 L. The remaining MSW was then characterized on weight-basis using a scale readable to 0.01 kg according to the following waste types (i): organic wastes, plastic, paper, glass, garments, aluminum and miscellaneous wastes. The process was repeated three times for MSW of each town in order to obtain more representative samples. Percentage of waste type i in MSW ( %Lf i ) was then multiplied by the mean of MSW arrived at the landfill from September 2012 to September 2013.
The quantity of reutilized MSW through organic waste reutilization was reported by municipality staff who conducted regular site visits. The quantity of recyclables arriving in the waste bank, Re i , was calculated based on receipts from selling recyclables to recycling shops during September 2012 to September 2013. It should be noted that the weight recorded in the receipts was matched to the record of recyclable waste taken from the members.

2.3. Quantification of Co-Benefits

GHG Emissions and Climate Co-Benefit

Assessment of GHG emission was conducted using the annual MSW generation quantity ( W M S W ) of each studied waste type .This study followed methodology used under Tier-1 guideline [22]. All emission factors used in this study were based on the conversion of emitted GHG into the unit of ton CO2 equivalent (GWP 100-years). Emission factors for landfilling MSW from organic waste decomposition waste obtained from Athitanun [54] while co-benefit from organic waste reutilizations (composting and biogas generation) were obtained from IPCC [22]. Climate co-benefit (Avoided GHG emission) was calculated based on the amount of raw material that was recycled, and the GHG emission savings, compared to emissions from the manufacturing of raw materials from the virgin source, as obtained from IPCC [22] and Browne, et al. [55], listed in Table A1 and Table A2.
GHG emission factors in transportation, Listed in Table A3, and landfilling phases, listed in Table A4, were taken from Thailand Greenhouse Gas Management Organization [TGO] [56]. For transportation, we assumed that travel distance of garbage trucks was based on the weight-km format and the collection fleet was assumed to operate at 50% of their full capacity.
The generic GHG equation can be expressed as follow with explanations given in Table 5:
G H G = w e i g h t   o f   w a s t e × e m i s s i o n   f a c t o r
And,
G H G G t = G H G o r G H G R e + G H G C o _ r g +   G H G C o _ w b + G H G L f _ o p
Table 5. Mathematical formula to quantify GHG emissions.
GHG G t = net GHG emssion
GHG or =sum of GHG emission from MSW decomposition
GHG Re =sum of avoided GHG emission activities, including organic waste reutilization and using raw materials produced from recycled sources instead of virgin source
 GHG Co _ rg =sum of GHG emission from regular MSW collection services minus avoided GHG emission from collection service under different scenarios
 GHG Co _ wb =sum of GHG emission from the waste bank collection services
GHG Lf _ op =sum of GHG from landfilling process minus avoided GHG emission from diversion of MSW from landfill under different scenarios

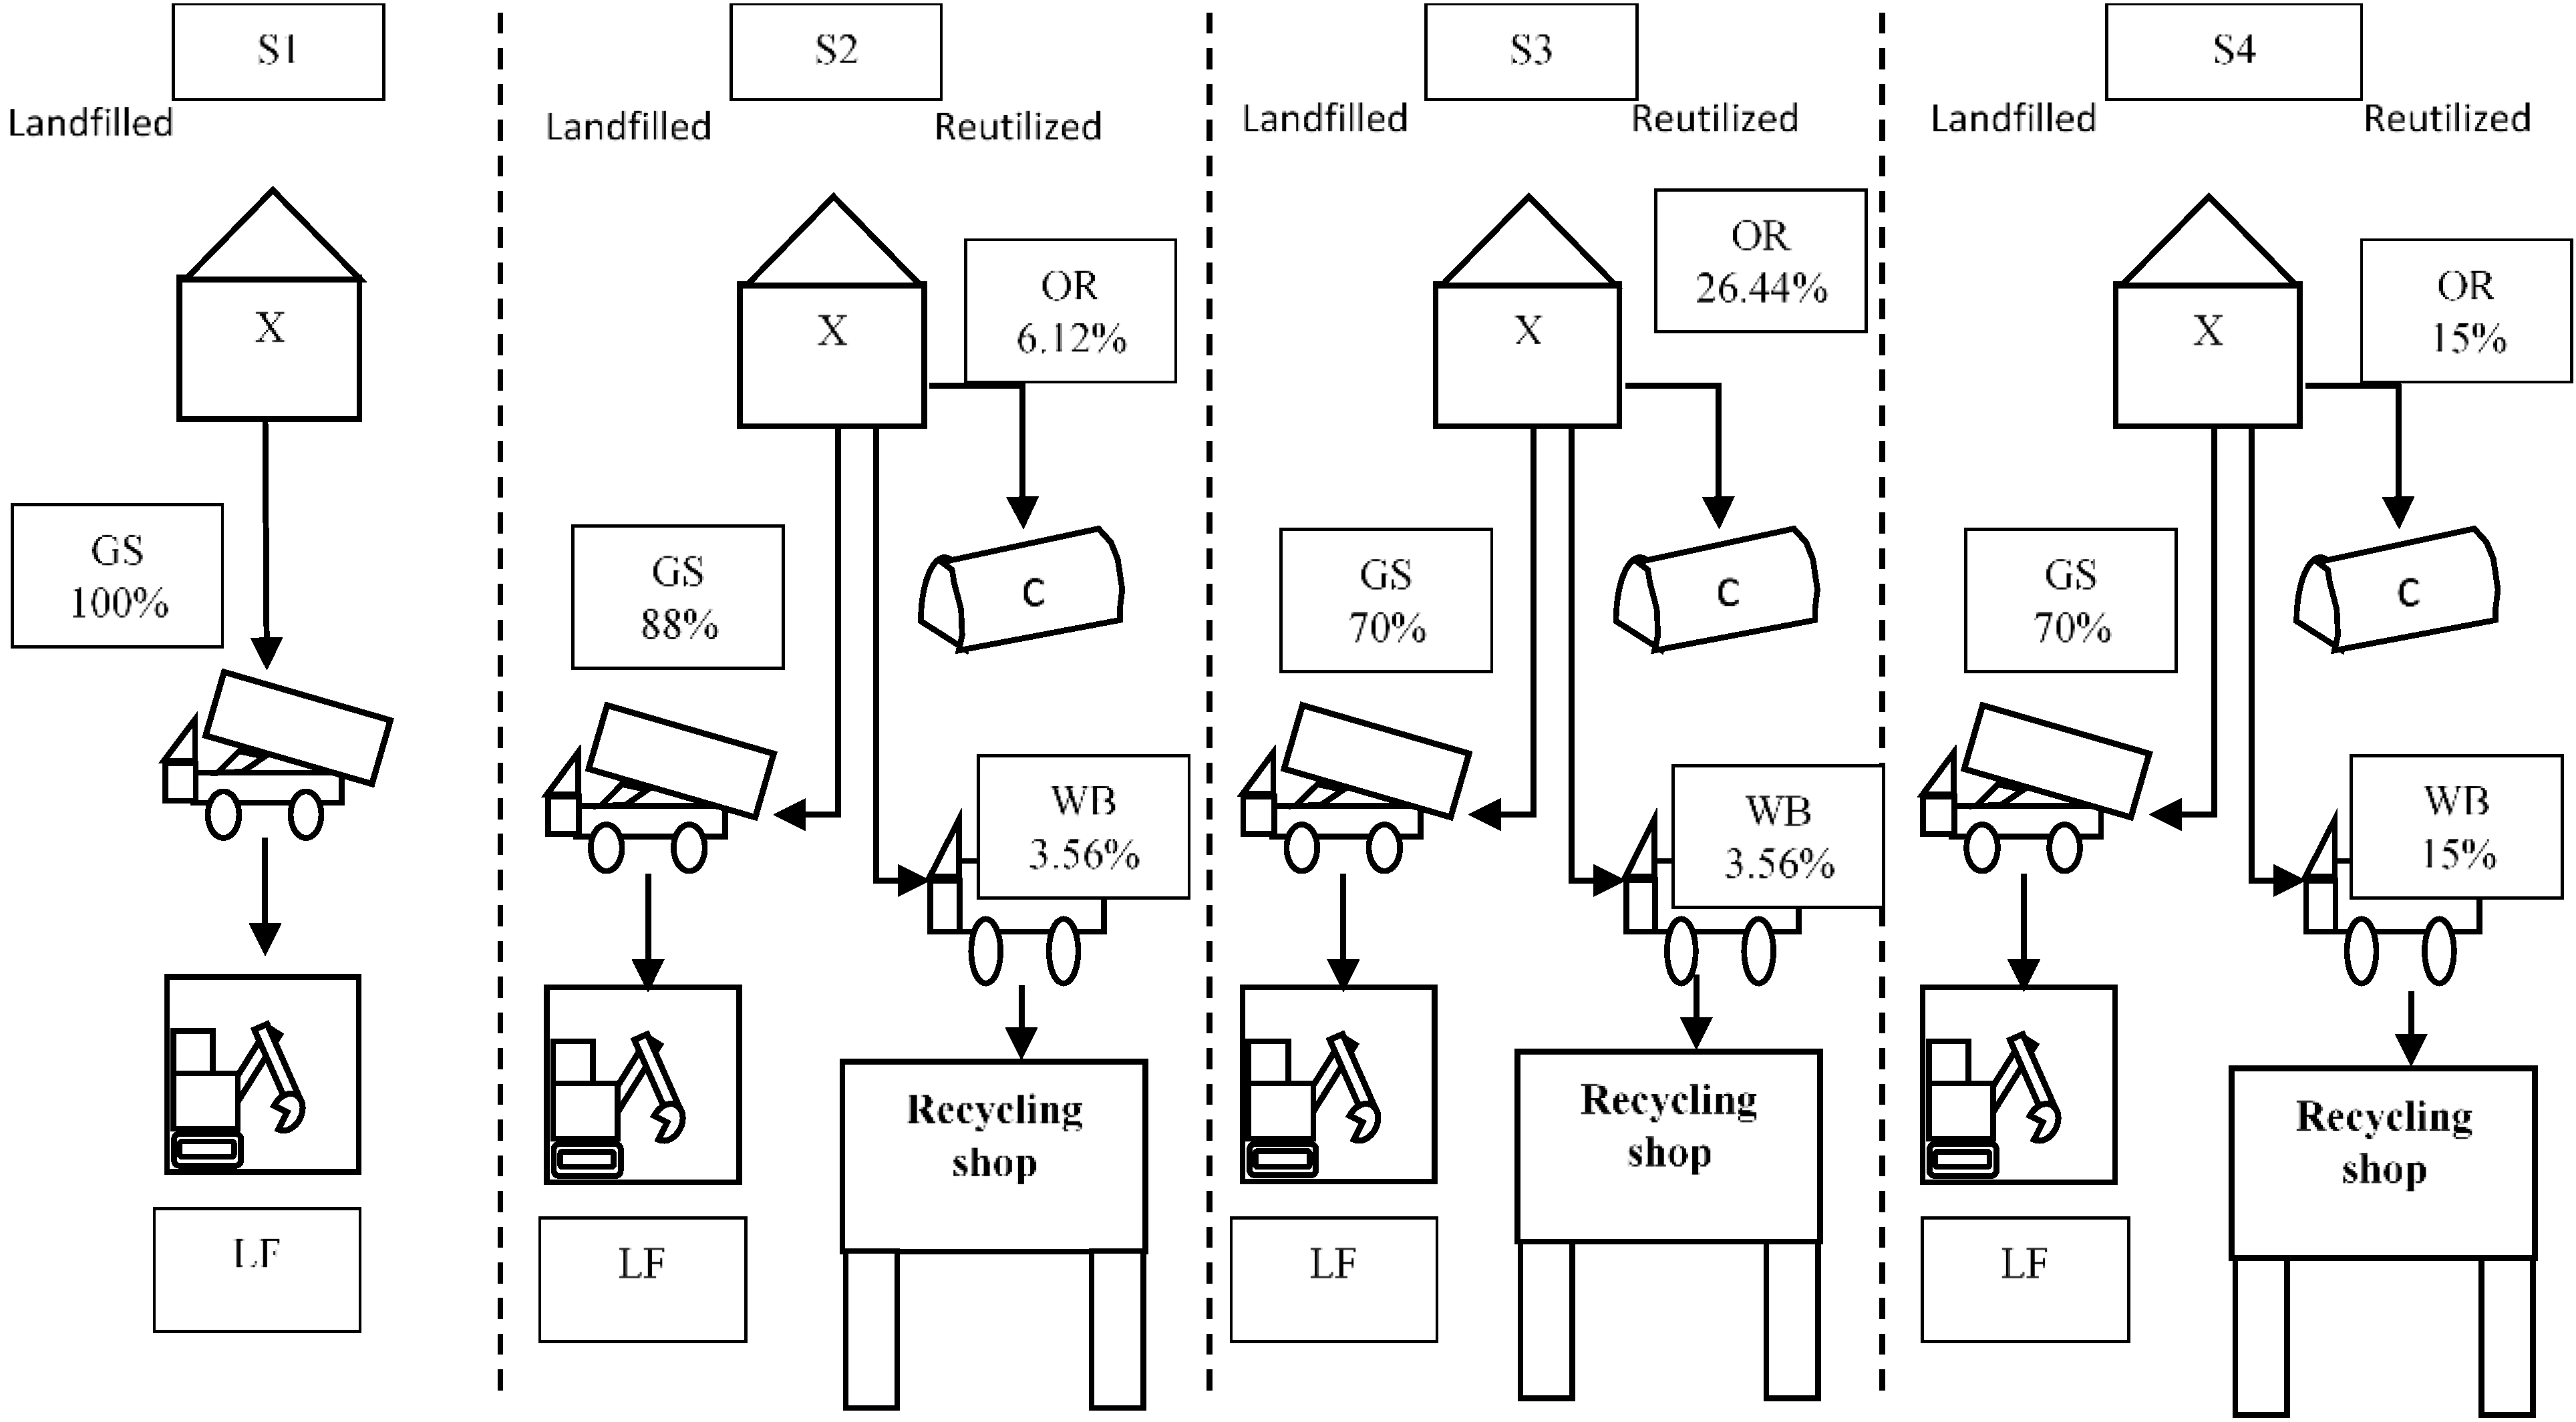
2.4. Scenario Development

To estimate potential reduction of GHG emissions and cost of landfilling under changes in MSWM practices, four scenarios were developed to illustrate net benefits. (See Figure 2):
Figure 2. Flows of MSW under different scenarios. X—annual MSW generated from PKM; C—Compost and Biogas; GS—General MSW collection service; OR—Organic waste reutilization s, and WB—Waste bank.
Sustainability 07 07417 g002
(1)
S1—Baseline scenario. In this scenario, most of the generated MSW is assumed to be landfilled.
(2)
S2—Current MSW utilization scenario. This scenario describes the current MSW situation with 3.56% of generated MSW diverted by the waste bank and 6.12% of generated MSW diverted by organic reutilization (assumed 50% composting and 50% biogas generation).
(3)
S3—This scenario assumes that a 30% reutilization rate, the national MSW reutilization target of Thailand, is achieved by boosting the organic waste reutilization solely. In this scenario, organic waste reutilization is assumed to increase to 26.44% of generated MSW while the rate of generated MSW diverted by the waste bank remains at 3.56%.
(4)
S4—This scenario assumes that a 30% reutilization rate, the national MSW reutilization target of Thailand, is achieved by splitting the 30% quota equally between diverted organic reutilization and diverted recyclables through the waste bank (assuming an additional contribution to meet the waste bank’s 15% quota is made by increasing only the share of recycled plastics while other recycled wastes remain at the same percentage of S2).

3. Result and Discussion

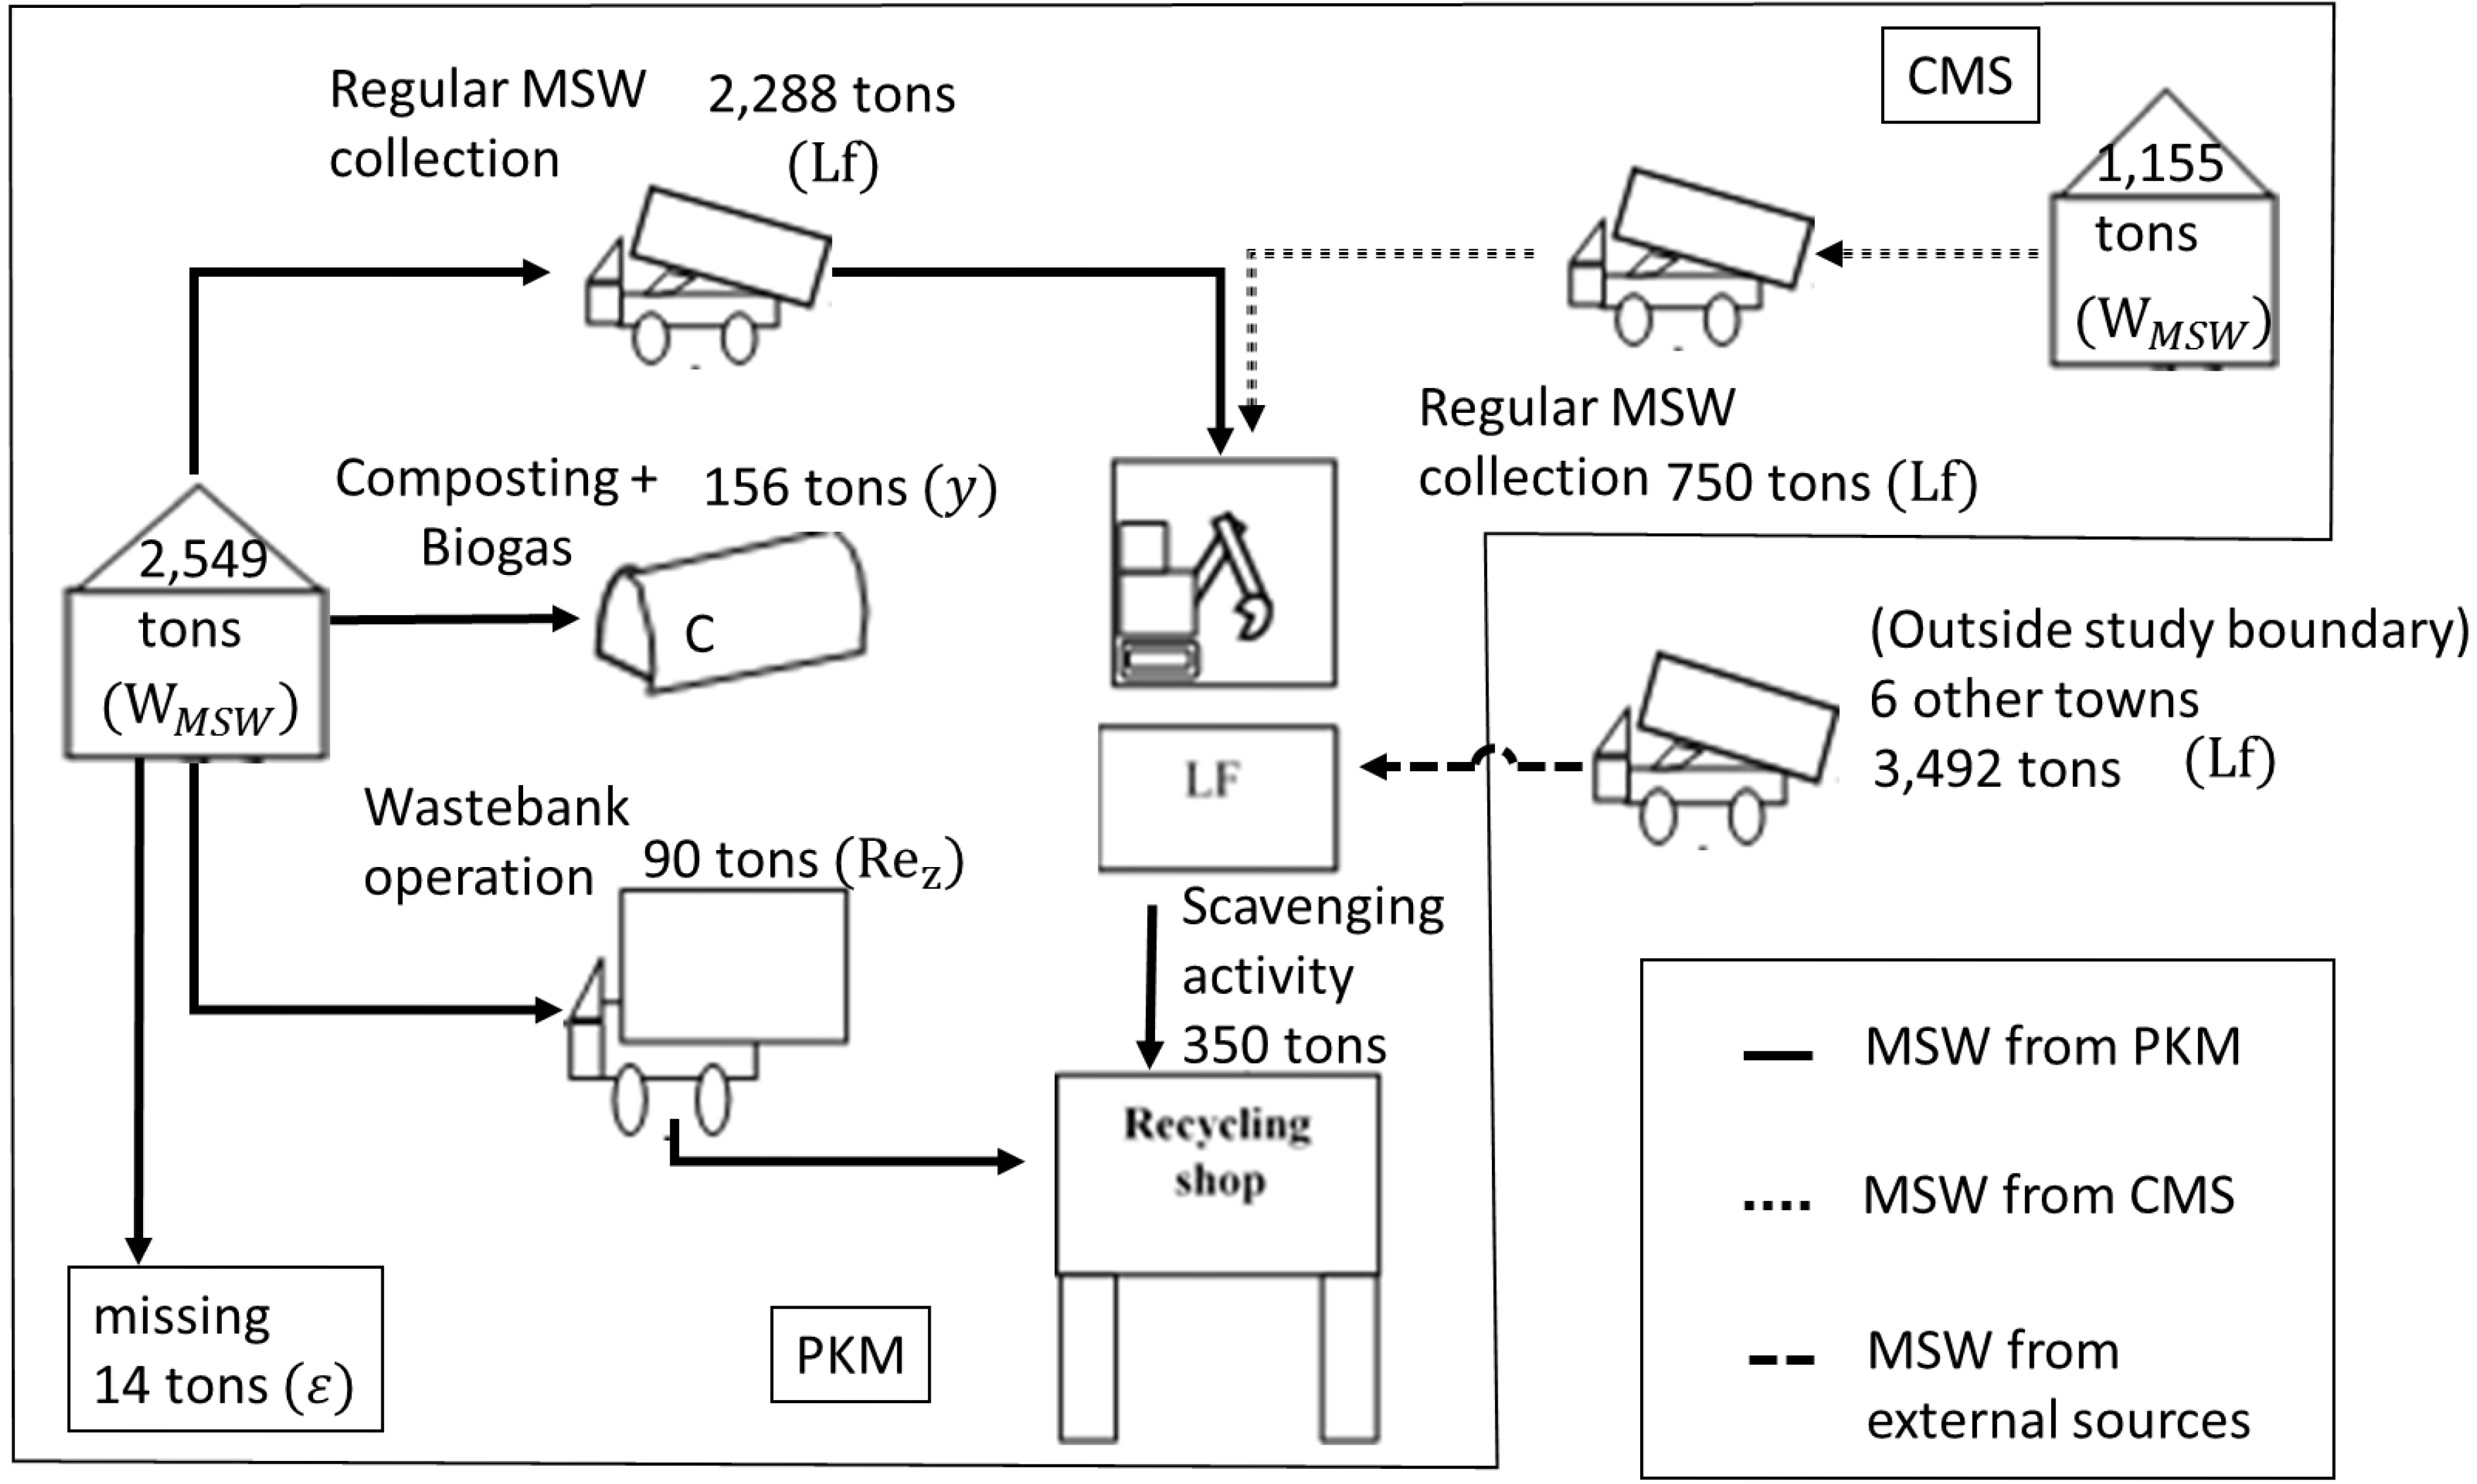
3.1. Situation of MSWM in PKM and CMS

3.1.1. Mass Accounting

Based on mass accounting, the accounted weight of MSW ( W M S W b u P K M ) is at 2534 tons per annum. This MSW arriving at the landfill ( W Lf i = 2288 tons per annum) and reutilized wastes in producing compost, bio-gas generation, and recycling by the waste bank ( W R e i = 246 tons per annum). The result from the generated MSW ( W M S W t d P K M ) calculation of the top-down approach indicated that MSW was generated at the rate of 2549 tons per annum.
From Equation (2), the missing quantity of MSW from MSWM system ( ε P K M ), derived from the difference between W M S W b u P K M and W M S W t d P K M , was estimated to be 14 tons or 0.59%, which is slightly lower than W M S W t d P K M and assumed to be negligible since loss of MSW may occur during operation or through loss of moisture. . Hence, the value of the unit of analysis was set based on the top-down approach as the at-source generated MSW. For PKM, the unit of analysis ( W M S W p k m ) is 2549 tons per year. For CMS, the unit of analysis for at-source generated MSW ( W M S W _ C M S ) was set based on the calculation of the top-down approach ( W M S W t d C M S ) which is 1155 tons per year.
From Figure 3, mass flow of MSW from PKM’s households to disposal points, landfill, composting points, or the waste bank indicated that MSWM of PKM was very effective because only 0.50% of MSW was not accounted for in the system based on comparison of W M S W b u P K M and W M S W t d P K M . PCD [12] reported that 25.16% of generated MSW had disappeared before it was collected for further treatment. In contrast, 35.08% of generated MSW from CMS was not accounted for when MSW from CMS arrived at the landfill (mass flow of CMS based on the top town approach compared to the bottom up approach).The cause of missing wastes may come from an inefficient collection service or some recyclables is removed prior to the arrival at the landfill.

3.1.2. MSW Characteristics and Changes from Reutilization Activities

We found that MSW characteristics of PKM and CMS were consistent with Thailand’s national average of waste composition for small towns in developing countries in South East Asia [57,58,59]. Impacts of the waste bank were observed in the reduction of recyclables at the landfill due to waste bank activities. From MSW characterization, recyclable components from PKM were consistently lower than those of CMS despite the fact that PKM is a more urbanized town and therefore should have higher recyclable content compared to that of CMS. Only recyclables that were not accepted by the waste bank, i.e., green glass bottles or food-contaminated plastic waste, were found in PKM’s MSW. Overall, recyclables from PKM were found to be 4.34% of MSW arriving at the landfill in contrast to 15.35% of those from CMS.
Figure 3. Annual flow of MSW arriving at PKM’s landfill.
Sustainability 07 07417 g003
Table 6 suggested that organic waste was the highest waste type, followed by plastic and paper wastes. The percentages and trends of MSW composition, however, were found to change significantly in the last decade for both CMS and PKM. This was true for the composition of organic waste, paper waste, and plastic waste types. The percentage drop of food waste composition can be potentially explained by an increase of affordability for refrigerators as observed by Hoornweg and Bhada-Tata [8]. Plastic waste—mainly dirty or contaminated plastic bags—was, however, found to have an increasing trend.
Table 6. Characteristics of MSW from towns within PKM vicinity.
Composition2004–20062013
Averaged in the region [57]PKM [60]CMS at sources ( % W ag i ) PKM at sources ( % W ag i ) PKM at landfill ( % W Lf i )
Organic64.36%67.82%45.90%56.70%56.30%
Paper7.58%5.66%4.60%3.60%2.70%
Glass3.30%2.12%6.30%3.90%1.60%
Plastics17.26%17.88%33.40%31.40%34.60%
Garment1.18%2.04%8.10%2.50%2.80%
Aluminum0.97%0.72%0.40%0.10%0.10%
Metal0.97%0.72%0.40%0.20%0.10%
Miscellaneous2.69%3.04%1.00%1.60%1.80%

3.1.3. Efficiency of the Organic Waste Reutilization and Waste Bank Activities

The organic waste reutilization and waste bank programs in PKM helped reduce landfilling of MSW. Separation of organic wastes also helps prevent undue quality deterioration of recyclables. This has been done through a monetary incentive scheme, which entailed a wide range of price differences between unsorted and sorted waste, e.g., 16.66% higher price for newspapers in good condition and 18.75% higher price for clear glass as compared to mixed glass waste. Additional revenues as well as potential budgetary saving from engaging in MSW reutilization can also help increase co-operation within city administrative councils.
It should be noted that the efficiency of MSW reutilization in PKM was not equally distributed across all waste types. Easily recycled waste-types such as paper, glass, aluminum, and metal were recovered at a higher rate compared to organic or plastic waste, which were often contaminated. The quantity of recyclables sold per member, as shown in Table 7, suggested that glass waste, paper, and plastic were among the most common materials in the recyclable stream.
Contrasting to a traditional belief that higher income level tends to correlate with lower level of participation in MSW recycling [61], the results from Table 7 suggested that the waste bank members living in the more affluent area, i.e., Route D, sent more recyclables to the waste bank than the members in the less affluent areas, namely Route A to C.
Table 7. Average annual recycling rates of waste bank operations per recycler between November 2011 and October 2013.
Collection Routes for Waste BankNumber of MembersPlasticAluminumMetalsGlassPaperTotal (kg)
Route A15510.60%0.48%3.88%55.05%29.99%159.18
Route B12711.79%0.42%5.45%61.35%20.99%177.11
Route C10112.26%0.59%2.26%54.52%30.37%144.47
Route D1396.99%0.56%2.76%60.96%28.74%208.03
Average52210.16%0.51%3.61%58.34%27.38%172.20
The success of PKM’s waste bank program could also be attributed to the integration of a social dimension into creating incentives for reutilization by providing strong support from the authorities and through the involvement of waste bank members as evidenced by its high recycling performance. The recycling per member of PKM’s waste bank was found to be very efficient in terms of kg of recyclable per member (shown in Table 7) compared to average community-based management activities (18.6 kg of recyclables per member) [53]. Puangsiri [62] conducted separate research on members of the PKM’s waste bank and reported that members decide to participate in the waste bank because of the convenience of the curbside pickup service, funeral-assistance benefits, and recycling education from the municipality. The positive development of PKM’s CBM can be attributed to PKM’s curbside pickup service and recycling awareness, which other waste banks fail to offer. Findings from Puangsiri [62] were consistent with success factors found in other CBM activities in terms of strong public participation, peer support, convenience, and economic incentives as potential factors to sustain environmental-friendly service programs [63,64].

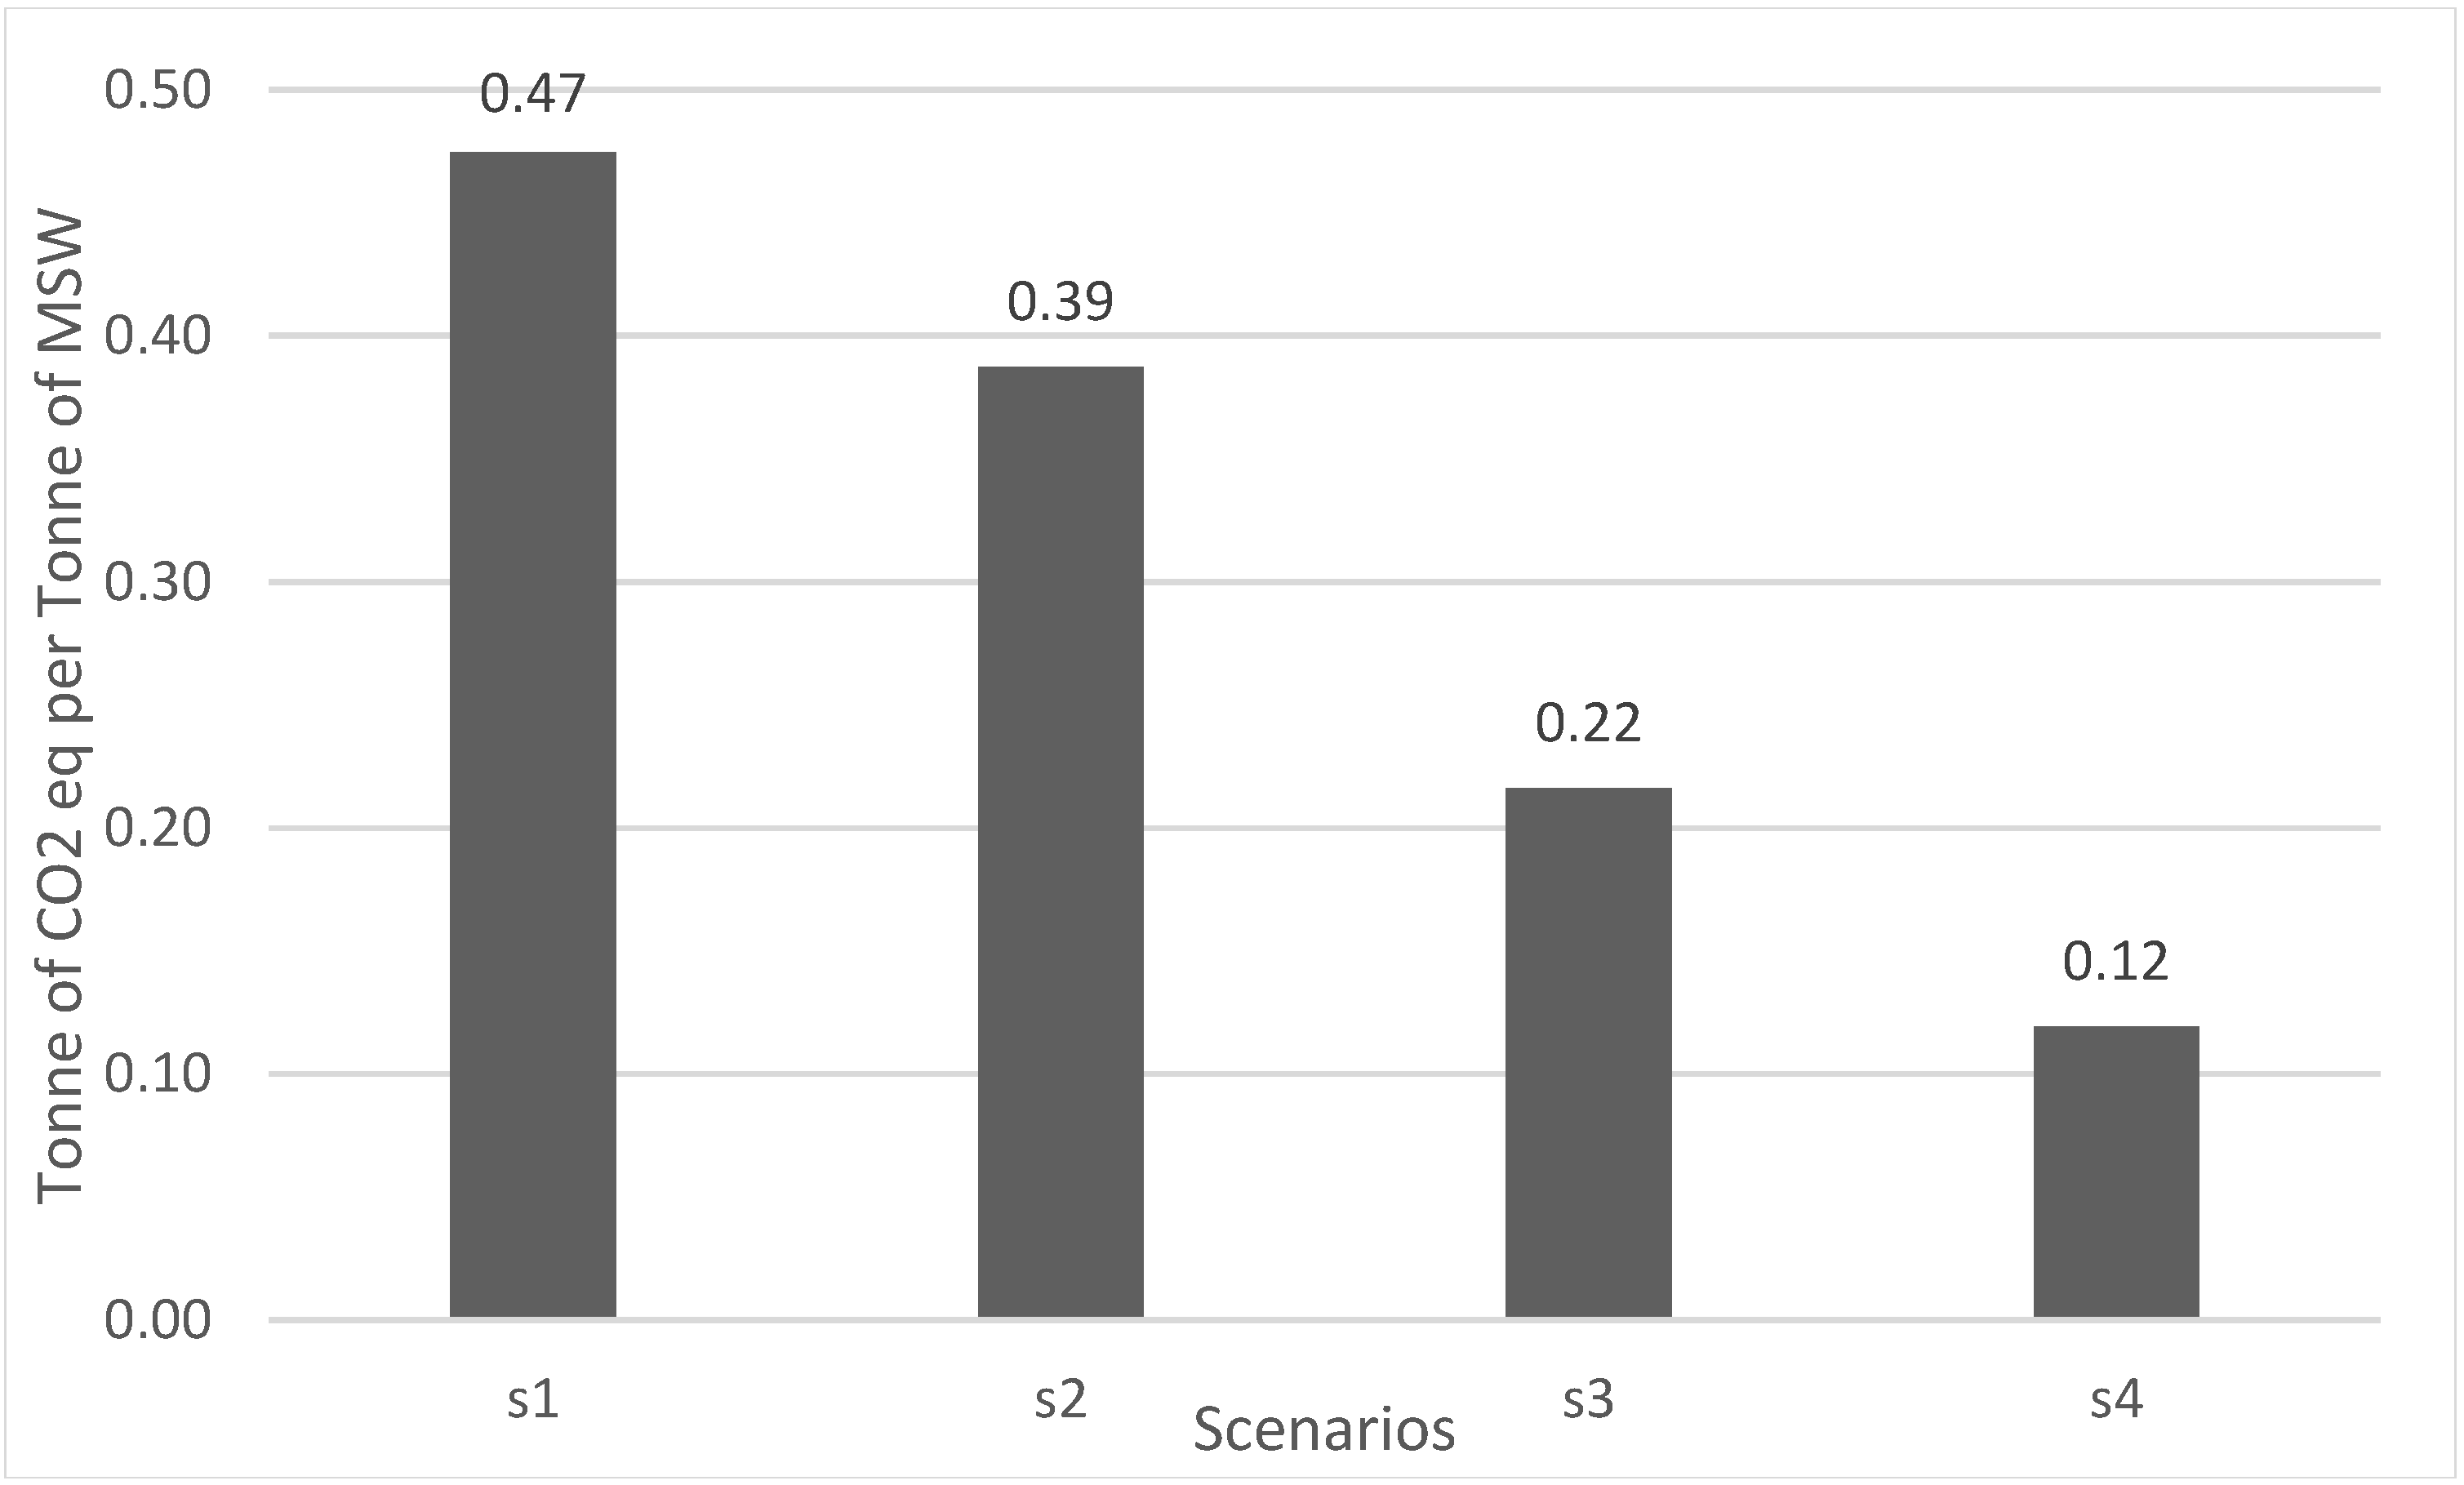
3.2. Climate Co-Benefits Analysis

3.2.1. Baseline GHG Emission

Under the baseline scenario (i.e., no implementation of any MSW reutilization activities (S1)), all generated MSW were assumed to be collected and sent to the landfill. The net annual GHG emission ( GHG G t ) from PKM was equal to 1248.57 tons of CO2-eq. Hotspots were identified of organic waste decomposition ( GHG O r = 1208.96 tons of CO2-eq), contributing 96.83% of total GHG G t . For transportation service, the averaged odometer readout from collection fleets indicated that the fleet runs approximately 79 km per day. In this scenario, GHG from the collection service ( GHG Co = 21.76 tons of CO2-eq), contributed to 1.74% of GHG G t . GHG from landfill operation ( GHG Lf _ op = 17.85 tons of CO2-eq), contributed to 1.43% of GHG G t , which mainly came from fuel uses for equipment operation. There was no climate co-benefit occurring in this scenario due to the assumption of no MSW reutilization and exclusion of scavenging activates in the landfill.
From Figure 4, baseline carbon intensity of GHG emissions ( C I ) was 0.47 tons of CO2-eq per ton of collected MSW. When PKM’s CI was compared against CI from other towns, we found that PKM’s CI was lower than CIs from other towns with similar size, i.e., 0.67 tons of CO2-eq per ton of collected MSW in Muang Klang municipality [65] or 0.73 tons of CO2-eq per ton of collected wastes in Nonthaburi landfill [66]. A logical explanation could be derived from the simplicity of PKM’s MSW collection system as well as low commuting distance between the town and the landfill.
Figure 4. Carbon intensity of MSW decomposition with avoided GHG emission on the MSW.
Sustainability 07 07417 g004

3.2.2. Current GHG Emission and Climate Co-Benefits

Under the current MSW reutilization practice, net GHG emission ( GHG G t ) was reduced to 1040.04 tons of CO2-eq (16.80% reduction as compared to S 1 GHG G t ). CI in this scenario was reported at 0.39 tons of CO2-eq per ton of MSW. The primary sources of reduction in GHG emission were from MSW reutilization activities where organic waste reutilization through composting and biogas generation ( GHG R e _ O r ) was responsible for a 9.67% reduction of S 1 GHG G t . GHG saving from the waste bank operation ( GHG R e _ W b ), by replacing virgin materials, equaled to 7.31% reduction in S 2 GHG G t as compared to S 1 GHG G t . Based on the current recycling rate of the waste bank, recycling of paper and glass wastes led to the largest reductions in GHG emissions due to their large quantities as well as the large difference between GHG emissions produced from raw materials and that from virgin and recycled sources.
Net GHG emission from transportation ( GHG Co = 22.83 tons of CO2-eq) in this scenario was higher than the GHG emission from the transportation phase in the baseline scenario. Therefore, climate co-benefit from transportation was not recognized in this scenario. The cause of increased GHG emission was from additional vehicle use in the waste bank operation, which was an additional 40 km drive on a weekly basis. Nevertheless, net GHG emission within the disposal phase was reduced to ( GHG Lf _ op = 16.01 tons of CO2-eq) as reutilized wastes were diverted from the landfill.

3.2.3. Potential Reduction of GHG Emission and Co-benefits

Under the hypothetical situations where 30% MSW reutilization rate were achieved ( S 3 and S 4 ), the benefits of recycling were pronounced because they were able to reduce GHG emission significantly.
In the S 3 scenario, the net GHG emission ( GHG G t ) have been reduced to 650.49 tons of CO2-eq (47.60% reduction from S 1 GHG G t ) and CI in this scenario was found at 0.22 tons of CO2-eq per ton of MSW. Primary contributor of the avoided GHG emission could be attributed to the reutilization of organic wastes (avoided 482.78 tons of CO2-eq compared to the baseline scenario) while the contribution of the waste bank remained at the same level of S 2 GHG Re . In the collection and landfilling phases, GHG Co in this scenario was at 17.87 tons of CO2-eq (17.88% lower than that of S 1 GHG Co ) due to the reduction of collected MSW to the system. The advantage of prioritizing organic waste reutilization was that the reutilized wastes were not entering into the collection service. This helped lower GHG emission. Avoided GHG emission from landfill operation under this scenario was also reduced by 30% as compared to that of S 1 GHG Lf _ op .
In the S 4 scenario, the net GHG emission has been reduced to 386.56 tons of CO2-eq (69.04% reduction of S 1 GHG G t ) and CI in this scenario was found to be at 0.12 tons of CO2-eq per ton of MSW. By boosting organic waste reutilization rate to 15%, avoided GHG emission was attributed to the reutilization of organic wastes (avoided 280.17 tons of CO2-eq compared to GHG emission from landfilling organic waste). For the 15% quota of boosting the reutilization rate in the waste bank, we set the scenario in the way that we held the reutilization rates of all recyclables, except the rate of plastic waste that was expected to raise to meet the 15% quota, at the rates found in the S 2 . We rationalized this assumption based on the abundance of plastic waste at the landfill (see Table 6). The result indicated that avoided GHG emissions from the waste bank in this scenario was increased to 584.37 tons of CO2-eq. Puangsiri’s study [62] on the attitude toward enhancing PKM’s waste bank also pointed out that PKM waste bank’s members realized the potential of boosting plastic waste recycling. For collection and landfilling phases, GHG Co in this scenario was 1.24% lower than that of S 1 GHG Co due to the increase in the waste bank’s operation. Avoided GHG emissions from landfill operations under this scenario were reduced by 30% as compared to that of S 1 GHG Lf _ op .

3.3. Co-Benefits for Saving of MSW Services

Data from the feasibility study report for the construction of the PKM’s landfill reported that estimated cost for landfilling 1 ton of MSW is approximately 7.41 USD (adjusted to USD’s 2013 value). However, if landfill space can be used efficiently for non-recyclable waste instead of all wastes, the municipality can receive additional profits from accepting the MSW service fee from other municipalities (expected profit at 8.86 USD of every ton of accepted MSW). Under the baseline scenario, we assumed that generated MSW from PKM ( W M S W _ p k m = 2549 tons per year), we calculated that PKM would spend 18,884 USD annually for landfilling MSW and that also the loss opportunity would accrue to 22,584 USD from service landfill space to other municipalities. Within the current scenario (S2), we expected that PKM were able to save 2181 USD and reduce the landfill cost to 6.55 USD per ton of generated MSW. In the scenarios where the reutilization rates attained the 30% reutilization target (S3–S4), we estimated that the financial co-benefit could reach 6777.13 USD per year, reducing the landfill cost to 4.75 USD per ton of generated MSW.

4. Conclusions

This study provides some important lessons. CBM activities have been proved to provide the co-benefit of a reduction of financial burden for administration and operation from the minimization of landfill for MSW and the generation of income from sales of recyclables from CBM members. Another benefit from CBM is the lowering of GHG emissions in non-landfilling scenarios compared to the completely landfilled scenario. Findings from the study suggested that key success factors may stem from the synergism between curbside recycling services, community-wide collaboration, understanding of benefits from recycling, and fair pricing of recyclables purchased at the waste bank, which help to sustain participation in CBM activities.
Key findings derived from the case studies suggested that MSW reduction through CBM activities can potentially be extended and implemented in up to around 50% of residential communities in Thailand and South East Asia, where populations still reside in rural/peri-urban settlements [67]. Organic waste reutilization programs e.g., composts and residual from biogas generation, are highly applicable to the agricultural-based society and peri-urban/rural settlements as the majority of MSW characteristics are organic-based waste types [8]. When settlements become more urbanized, the demand for home composting or biogas generation may diminish due to changes in lifestyle and economic activities. The importance of waste bank functions of a CBM program may be higher due to higher recyclable contents in the waste stream. For organic wastes, it is likely that a more advanced model of MSW recycling may be more suitable, i.e., refuse-derived fuel produced by mixture of plastic, garden, and paper wastes, or large-scale anaerobic digestion system for food and organic wastes.
Although widely used MSWM methods i.e., landfill or open dumping, may have relatively lower initial investment costs, in the long run these methods can incur expensive operating costs as well as produce significant adverse impacts on the environment, particularly climate change. Therefore, the association of climate co-benefits and the ability to save public funds through MSW reutilization should be promoted widely, in order to raise public awareness, provide clear benefits, and create incentives for comprehensive waste management for citizens nationwide.

Acknowledgments

This research received financial support from Center of Excellence on Hazardous Substance Management (HSM) Chulalongkorn University and the 90th Anniversary of Chulalongkorn University Fund (Ratchadaphiseksomphot Endowment Fund). The authors would like to thank the Mayor, Municipality Clerk, Director of Public Health Division, and staff members of PKM, Kraisri Srithupthai from Rajamangala University of Technology Isan Sakonnakhon campus for their helps and assistances during and after my filed study and data collection in Phang Khon municipality. The authors would like to specially thank Krip Rojanastien and Chiva-Som International Health Resort for the generous support in research activities, and Tatthap Veeratat for his help during landfill visits and data collection, Attasit Korchaiyapruk for his valuable comments and suggestions.

Author Contributions

Chanathip Pharino and Amornchai Challcharoenwattana conceived and designed the research; Amornchai Challcharoenwattana performed the data collection and analyzed the data. Chanathip Pharino supervised data collection and verified the analysis and results. Amornchai Challcharoenwattana drafted the manuscript and Chanathip Pharino substantially reviewed, commented, and edited the manuscript.

Conflicts of Interest

The authors declare no conflict of interest.

Appendix

Table A1. Emission factors for conventional MSW disposal activities.
practicesEmission Factors (tons of CO2-eq per ton waste type)Source
Baseline practice ( E f L f ) Alternatives ( E f O r y )
Buried MSW in shallow landfill8.42 × 10−1
Biogas generation4.20 × 10−2IPCC [22]
Composting1.77 × 10−1IPCC [22]
Table A2. Emission factors for recycling activities.
PracticesEmission Factors (tons of CO2-eq per ton of waste type)Source
Virgin material ( E f v i r z ) Recycled material ( E f r e z )
Glass1.033.30 × 10−1Browne, O’Regan and Moles [55]
Paper2.861.58Browne, O’Regan and Moles [55]
Plastic3.742.05Browne, O’Regan and Moles [55]
Ferrous2.491.28Browne, O’Regan and Moles [55]
Aluminum8.802.16Browne, O’Regan and Moles [55]
Table A3. Emission factors from collection services (emission factor of diesel).
Vehicle # (x)Type of Collection TruckFuel Economy (Km/L)km TravelMSW Collected (Tons)Rate of Fuel Consumption (L/tons MSW)Emission Factor (tons of CO2-eq/tons MSW × distance (km)) ( E f V h x )
Regular garbage collection
14-wheel trucks3.508.98× 1035.26× 1034.881.47 × 10−6
24-wheel trucks with compactor4.006.42× 1035.26× 1033.061.29 × 10−6
36-wheel truck with compactor4.007.88 × 1038.76 × 1022.257.73 × 10−7
44-wheel truck6.007.88 × 1033.50 × 1023.751.29 × 10−6
Waste bank Operation
14-wheel trucks3.505.16 × 10252.911.71.46 × 10−5
24-wheel trucks3.505.16 × 10252.911.71.46 × 10−5
Table A4. Emission factors for landfilling process.
OperationUnit/yearAnnual MSW arrived at landfill (tons)Calculated EF (tons of CO2-eq/tons MSW) ( E f e q i )
Excavator & Tractor (L of diesel)5.06 × 1032.28 × 1036.01 × 10−3
Electricity (kWh)3.99 × 1032.28 × 1039.83 × 10−4
total7.00 × 10−3

References

  1. Gentil, E.; Christensen, T.H.; Aoustin, E. Greenhouse gas accounting and waste management. Waste Manag. Res. 2009, 27, 696–706. [Google Scholar] [CrossRef] [PubMed]
  2. Aguilar-Virgen, Q.; Taboada-González, P.; Ojeda-Benítez, S. Analysis of the feasibility of the recovery of landfill gas: A case study of Mexico. J. Clean. Product. 2014, 79, 53–60. [Google Scholar] [CrossRef]
  3. Menikpura, S.; Sang-Arun, J.; Bengtsson, M. Climate co-benefits of energy recovery from landfill gas in developing Asian cities: A case study in Bangkok. Waste Manag. Res. 2013, 31, 1002–1011. [Google Scholar] [CrossRef] [PubMed]
  4. Zaman, N.Q.; Jam, Z.M. Odour Nuisance and the Need for Effective Complaint Measures in Malaysia: A Case Study of a Public Institution in Penang. Chem. Eng. 2014. [Google Scholar] [CrossRef]
  5. Owusu, G.; Nketiah-Amponsah, E.; Codjoe, S.N.A.; Afutu-Kotey, R.L. How do Ghana’s landfills affect residential property values? A case study of two sites in Accra. Urban Geogr. 2014, 35, 1140–1155. [Google Scholar] [CrossRef]
  6. Hite, D.; Chern, W.; Hitzhusen, F.; Randall, A. Property-Value Impacts of an Environmental Disamenity: The Case of Landfills. J. Real Estate Finance Econ. 2001, 22, 185–202. [Google Scholar] [CrossRef]
  7. Un-Habitat. Solid Waste Management in the World’s Cities Water and Sanitation in the World’s Cities 2010; Un-Habitat: London, UK; Washington, DC, USA, 2010. [Google Scholar]
  8. Hoornweg, D.; Bhada-Tata, P. What a Waste: A Global Review of Solid Waste Management; The Worldbank: Washington, DC, USA, 2012. [Google Scholar]
  9. Mazzanti, M.; Montini, A.; Zoboli, R. Municipal Waste Generation and Socioeconomic Drivers: Evidence from Comparing Northern and Southern Italy. J. Environ. Dev. 2008, 17, 51–69. [Google Scholar] [CrossRef]
  10. Nestor, D.V. Policy Evaluation with Combined Actual and Contingent Response Data. Am. J. Agric. Econ. 1998, 80, 264–276. [Google Scholar] [CrossRef]
  11. Taylor, D.C. Policy incentives to minimize generation of municipal solid waste. Waste Manag. Res. 2000, 18, 406–419. [Google Scholar] [CrossRef]
  12. PCD. Thailand State of Pollution Report B.E. 2555 (2012); Thailand’s Pollution Control Department: Bangkok, Thailand, 2013.
  13. Bangkok Metropolitan Administration. Bangkok State of the Environment 2012; Rong Pim Auk Sorn Thai, LP: Bangkok, Thailand, 2013.
  14. JICA (Japan International Cooperation Agency). Project on the Strengthening of Solid Waste Management for the Municipality of Phnom Penh; JICA: Phnom Penh, Cambodia, 2008. [Google Scholar]
  15. Seng, B.; Kaneko, H.; Hirayama, K.; Katayama-Hirayama, K. Municipal solid waste management in Phnom Penh, capital city of Cambodia. Waste Manag. Res. 2011, 29, 491–500. [Google Scholar] [CrossRef] [PubMed]
  16. Talyan, V.; Dahiya, R.P.; Sreekrishnan, T.R. State of municipal solid waste management in Delhi, the capital of India. Waste Manag. 2008, 28, 1276–1287. [Google Scholar] [CrossRef] [PubMed]
  17. Zhen-shan, L.; Lei, Y.; Xiao-Yan, Q.; Yu-mei, S. Municipal solid waste management in Beijing City. Waste Manag. 2009, 29, 2596–2599. [Google Scholar] [CrossRef] [PubMed]
  18. ThaiPublica. National Argenda of Solid Waste, 2014th ed.; ThaiPublica: Bangkok, Thailand, 2014. [Google Scholar]
  19. IPCC. Good Practice Guidance and Uncertainty Management in National Greenhouse Gas Inventories; IGES: Kanagawa, Japan, 2000. [Google Scholar]
  20. Eisted, R.; Larsen, A.W.; Christensen, T.H. Collection, transfer and transport of waste: Accounting of greenhouse gases and global warming contribution. Waste Manag. Res. 2009, 27, 738–745. [Google Scholar] [CrossRef] [PubMed]
  21. Tabata, T.; Hishinuma, T.; Ihara, T.; Genchi, Y. Life cycle assessment of integrated municipal solid waste management systems, taking account of climate change and landfill shortage trade-off problems. Waste Manag. Res. 2011, 29, 423–432. [Google Scholar] [CrossRef] [PubMed]
  22. IPCC. 2006 IPCC Guidelines for National Greenhouse Gas Inventories; IGES: Kanagawa, Japan, 2006. [Google Scholar]
  23. Manfredi, S.; Tonini, D.; Christensen, T.H.; Scharff, H. Landfilling of waste: Accounting of greenhouse gases and global warming contributions. Waste Manag. Res. 2009, 27, 825–836. [Google Scholar] [CrossRef] [PubMed]
  24. Ngnikam, E.; Tanawa, E.; Rousseaux, P.; Riedacker, A.; Gourdon, R. Evaluation of the potentialities to reduce greenhouse gases (GHG) emissions resulting from various treatments of municipal solid wastes (MSW) in moist tropical climates: Application to Yaounde. Waste Manag. Res. 2002, 20, 501–513. [Google Scholar] [CrossRef] [PubMed]
  25. Lombardi, L.; Carnevale, E.; Corti, A. Greenhouse effect reduction and energy recovery from waste landfill. Energy 2006, 31, 3208–3219. [Google Scholar] [CrossRef]
  26. Ritzkowski, M.; Stegmann, R. Landfill aeration worldwide: Concepts, indications and findings. Waste Manag. 2012, 32, 1411–1419. [Google Scholar] [CrossRef] [PubMed]
  27. Larsen, A.W.; Vrgoc, M.; Christensen, T.H.; Lieberknecht, P. Diesel consumption in waste collection and transport and its environmental significance. Waste Manag. Res. 2009, 27, 652–659. [Google Scholar] [CrossRef] [PubMed]
  28. Kong, D.; Shan, J.; Iacoboni, M.; Maguin, S.R. Evaluating greenhouse gas impacts of organic waste management options using life cycle assessment. Waste Manag. Res. 2012, 30, 800–812. [Google Scholar] [CrossRef] [PubMed]
  29. Kurniawan, T.A.; Puppim de Oliveira, J.; Premakumara, D.G.J.; Nagaishi, M. City-to-city level cooperation for generating urban co-benefits: The case of technological cooperation in the waste sector between Surabaya (Indonesia) and Kitakyushu (Japan). J. Clean. Product. 2013, 58, 43–50. [Google Scholar] [CrossRef]
  30. Solomon, S. Climate Change 2007—The Physical Science Basis: Working Group I Contribution to the Fourth Assessment Report of the IPCC; Cambridge University Press: Cambridge, UK, 2007; Volume 4. [Google Scholar]
  31. Eriksson, O.; Carlsson Reich, M.; Frostell, B.; Björklund, A.; Assefa, G.; Sundqvist, J.O.; Granath, J.; Baky, A.; Thyselius, L. Municipal solid waste management from a systems perspective. J. Clean. Product. 2005, 13, 241–252. [Google Scholar] [CrossRef]
  32. Vellini, M.; Savioli, M. Energy and environmental analysis of glass container production and recycling. Energy 2009, 34, 2137–2143. [Google Scholar] [CrossRef]
  33. Reh, L. Challenges for process industries in recycling. China Particuol. 2006, 4, 47–59. [Google Scholar] [CrossRef]
  34. Cunningham, C.E.; Bremner, R.; Boyle, M. Large Group Community-Based Parenting Programs for Families of Preschoolers at Risk for Disruptive Behaviour Disorders: Utilization, Cost Effectiveness, and Outcome. J. Child Psychol. Psychiatry 1995, 36, 1141–1159. [Google Scholar] [CrossRef] [PubMed]
  35. McKenzie-Mohr, D. New Ways to Promote Proenvironmental Behavior: Promoting Sustainable Behavior: An Introduction to Community-Based Social Marketing. J. Soc. Issues 2000, 56, 543–554. [Google Scholar] [CrossRef]
  36. Liddle, E.S.; Mager, S.M.; Nel, E.L. The importance of community-based informal water supply systems in the developing world and the need for formal sector support. Geogr. J. 2014. [Google Scholar] [CrossRef]
  37. Dewan, C.; Mukherji, A.; Buisson, M.-C. Evolution of water management in coastal Bangladesh: from temporary earthen embankments to depoliticized community-managed polders. Water Int. 2015. [Google Scholar] [CrossRef]
  38. Margerum, R.D.; Robinson, C.J. Collaborative partnerships and the challenges for sustainable water management. Curr. Opin. Environ. Sustain. 2015, 12, 53–58. [Google Scholar] [CrossRef]
  39. Sharma, S.K.; Deml, K.; Dangal, S.; Rana, E.; Madigan, S. REDD+ framework with integrated measurement, reporting and verification system for Community Based Forest Management Systems (CBFMS) in Nepal. Curr. Opin. Environ. Sustain. 2015, 14, 17–27. [Google Scholar] [CrossRef]
  40. Cagalanan, D. Governance Challenges in Community-Based Forest Management in the Philippines. Soc. Nat. Resour. 2015, 28, 609–624. [Google Scholar] [CrossRef]
  41. Wallerstein, N.B.; Duran, B. Using Community-Based Participatory Research to Address Health Disparities. Health Promot. Pract. 2006, 7, 312–323. [Google Scholar] [CrossRef] [PubMed]
  42. Farmer, P.; Léandre, F.; Mukherjee, J.; Gupta, R.; Tarter, L.; Kim, J.Y. Community-based treatment of advanced HIV disease: Introducing DOT-HAART (directly observed therapy with highly active antiretroviral therapy). Bull. World Health Organ. 2001, 79, 1145–1151. [Google Scholar] [PubMed]
  43. Afroz, R.; Hanaki, K.; Hasegawa-Kurisu, K. Willingness to pay for waste management improvement in Dhaka city, Bangladesh. J. Environ. Manag. 2009, 90, 492–503. [Google Scholar] [CrossRef] [PubMed]
  44. Wilson, D.C.; Velis, C.; Cheeseman, C. Role of informal sector recycling in waste management in developing countries. Habitat Int. 2006, 30, 797–808. [Google Scholar] [CrossRef]
  45. Medina, M. The Informal Recycling Sector in Developing Countries: Organizing Waste Pickers to Enhance Their Impact; World Bank: Washington, DC, USA, 2008. [Google Scholar]
  46. Afroz, R.; Hanaki, K.; Tuddin, R.; Ayup, K. A survey of recycling behaviour in households in Dhaka, Bangladesh. Waste Manag. Res. 2010, 28, 552–560. [Google Scholar] [CrossRef] [PubMed]
  47. Scheinberg, A.; Spies, S.; Simpson, M.H.; Mol, A.P.J. Assessing urban recycling in low- and middle-income countries: Building on modernised mixtures. Habitat Int. 2011, 35, 188–198. [Google Scholar] [CrossRef]
  48. Mongkolnchaiarunya, J. Promoting a community-based solid-waste management initiative in local government: Yala municipality, Thailand. Habitat Int. 2005, 29, 27–40. [Google Scholar] [CrossRef]
  49. Suttibak, S.; Nitivattananon, V. Assessment of factors influencing the performance of solid waste recycling programs. Resourc. Conserv. Recycl. 2008, 53, 45–56. [Google Scholar] [CrossRef]
  50. Nzeadibe, T.C. Solid waste reforms and informal recycling in Enugu urban area, Nigeria. Habitat Int. 2009, 33, 93–99. [Google Scholar] [CrossRef]
  51. Xu, W.; Zhou, C.; Lan, Y.; Jin, J.; Cao, A. An incentive-based source separation model for sustainable municipal solid waste management in China. Waste Manag. Res. 2015, 33, 469–476. [Google Scholar] [CrossRef] [PubMed]
  52. Colon, M.; Fawcett, B. Community-based household waste management: Lessons learnt from EXNORA’s “zero waste management” scheme in two South Indian cities. Habitat Int. 2006, 30, 916–931. [Google Scholar] [CrossRef]
  53. Rayong City Municipality. 2012 Report of Waste Bank Operation; Rayong City Municipality: Rayong, Thailand, 2013; p. 8. [Google Scholar]
  54. Athitanun, P. Green Biz Generation Going Green: Sustainable Development; NSTDA Academy: Bangkok, Thailand, 2011. [Google Scholar]
  55. Browne, D.; O’Regan, B.; Moles, R. Use of carbon footprinting to explore alternative household waste policy scenarios in an Irish city-region. Resourc. Conserv. Recycl. 2009, 54, 113–122. [Google Scholar] [CrossRef]
  56. TGO. Guideline for Carbon Footprint Estimation in Local Administration Entities, 1st ed.; TGO: Bangkok, Thailand, 2011. [Google Scholar]
  57. PCD. Survey and Analysis of Municipal Solid Waste Characteristics of all Municiplaities in Thailand; PCD: Bangkok, Thailand, 2004.
  58. AIT-UNEP. Municipal Waste Management Report: Status-Quo and Issues in Southeast and East Asian Countries; AIT-UNEP: Pathumthani, Thailand, 2010. [Google Scholar]
  59. Thailand’s Regional Environmental Office 14. Report of Municipal Wastewater Treatment and Solid Waste Management System for the Tapi Wastershed; Thailand’s Regional Environmental Office 14: Surat Thani, Thailand, 2012.
  60. Thailand’s Regional Environmental Office 9. Environmental Situation Report 2012 (B.E. 2555); Srisawa, C., Ed.; Thailand’s Regional Environmental Office 9: Phang Khon, Thailand, 2013.
  61. Jenkins, R.R.; Martinez, S.A.; Palmer, K.; Podolsky, M.J. The determinants of household recycling: a material-specific analysis of recycling program features and unit pricing. J. Environ. Econ. Manag. 2003, 45, 294–318. [Google Scholar] [CrossRef]
  62. Puangsiri, S. Carbon Accounting System from Integrated Municipal Waste Management in Thailand: Case Study Sakhonnakhon Province; Chulalongkorn University: Bangkok, Thailand, 2010. [Google Scholar]
  63. Timlett, R.E.; Williams, I.D. Public participation and recycling performance in England: A comparison of tools for behaviour change. Resourc. Conserv. Recycl. 2008, 52, 622–634. [Google Scholar] [CrossRef]
  64. Seik, F.T. Recycling of domestic waste: Early experiences in Singapore. Habitat Int. 1997, 21, 277–289. [Google Scholar] [CrossRef]
  65. Menikpura, S.N.M.; Sang-Arun, J.; Bengtsson, M. Integrated Solid Waste Management: An approach for enhancing climate co-benefits through resource recovery. J. Clean. Product. 2013, 58, 34–42. [Google Scholar] [CrossRef]
  66. Menikpura, S.N.M.; Gheewala, S.H.; Bonnet, S.; Chiemchaisri, C. Evaluation of the Effect of Recycling on Sustainability of Municipal Solid Waste Management in Thailand. Waste Biomass Valorization 2012, 4, 237–257. [Google Scholar] [CrossRef]
  67. United Nations. World Urbanization Prospects: The 2014 Revision; Department of Economic and Social Affairs: New York, NY, USA, 2014. [Google Scholar]

