Article

The Accelerated Urbanization Process: A Threat to Soil Resources in Eastern China

1
Institute of Rural Development and Information, Ningbo Academy of Agricultural Sciences, Ningbo 315040, China
2
Institution of Remote Sensing and Information System Application, Zhejiang University, Hangzhou 310058, China
3
Institute of Digital Agriculture, Zhejiang Academy of Agricultural Sciences, Hangzhou 310021, China
4
Department of Political Science, Michigan State University, East Lansing, MI 48824, USA
*
Author to whom correspondence should be addressed.
Sustainability 2015, 7(6), 7137-7155; https://doi.org/10.3390/su7067137
Submission received: 11 March 2015 / Revised: 13 May 2015 / Accepted: 28 May 2015 / Published: 2 June 2015
(This article belongs to the Section Sustainable Urban and Rural Development)

Abstract

:
The eastern coastal region of China has been experiencing rapid urbanization which has imposed great challenges on soil resources, characterized by soil sealing and fragmented soil landscapes. Taking Zhejiang Province—a fairly economically-developed and highly-urbanized region in eastern China—as a case study, a practical framework that integrates remote sensing, GIS, soil quality assessment and landscape analysis was employed to track and analyze the rapid urbanization process and spatiotemporal dynamics of soil sealing and landscape change from 1990 to 2010. Meanwhile, this paper qualitatively explored the regional inequality and characteristics in soil sealing intensity among cities of different geo-zones in Zhejiang Province. Results showed that total area of 6420 km2 had been sealed during the past two decades for the entire study area, which represents 6.2% of the provincial area. Among these sealed soils, 68.6% are fertile soils located in flat plains, such as Paddy soils. Soil landscapes became more fragmented and dispersed in distribution, more irregular and complex in shape, and less dominant and diverse in soil type, as evidenced by the constant change of various spatial landscape metrics. What is more, different geo-zones exhibited significant differences in dynamics of soil sealing intensity, soil composition and soil landscape patterns. The permanent loss of valuable soil resource and increasing fragmented soil landscape patterns concomitant with rapid urbanization processes may inevitably bring about potential threats to regional soil resources and food security.

1. Introduction

Unprecedented rapid urbanization and burgeoning populations worldwide have immensely accelerated the process of soil sealing. Soils are often desurfaced, mixed and compacted in this process, resulting in changes in physical properties of soils, and restriction in exchange of gases, water and energy, so far as to terminate their long historical capacity of food production and other diverse ecological services, such as production of biomass and renewable energy; filtering, buffering and transformation function; and biological habitat and gene reserve [1,2]. It consequently increases the risk of potential floods and water scarcity, endangers biodiversity, influences the amount, chemical form and spatial distribution of carbon stocks as well as leads to environmental change on a larger scale [3,4,5]. Moreover, once soil is covered by artificial impervious surfaces, there are few possibilities for restoration, except for at a high cost. Therefore, soil sealing is considered as one of the main causes of soil degradation, and even regarded as soil consumption in some related literatures [6,7].
Recently, the soil sealing assessment through effective monitoring schemes has grown rapidly in many European cities. It can be demonstrated by the rapid growth of scientific literature on the subject of urbanization and soil sealing, which increased from 19 papers in 1990 to more than 350 papers in 2013 [8]. Researches indicate that by 2006, the sealed area in Italy covered 6.3% of total land surface [9]. The sealing area occurring on agricultural land was computed to be 11890.7 km2 from 1990 to 2006 for 21 of the 27 European Union member states [8]. Besides that, fertile soils near large agglomerations always act as first victims of being occupied by urban sprawl [10]. China, as a developing country on the fast track, has been experiencing an unprecedented scale and rate of urbanization over the past two decades. It is estimated that 8170 km2 of land in China had been sealed in the 1990s [11]. It gets more intensified after entering into the 21st century, with a total sealing area of 17,053 km2 from 2000 to 2005 in China [12]. Moreover, China will continue to give high priority to urbanization in the coming decades [13]. Even though these studies have investigated the dynamics of soil sealing, a monitoring scheme for soil sealing with regard to soil quantity and quality at the provincial scale is still lacking.
Furthermore, constant soil sealing processes interfere with the spatial patterns of soil landscapes, which refer to the spatial distribution and mosaic of soil types [10]. Measuring the characteristics of soil landscapes and their changes in response to rapid urbanization can not only be used to study soil heterogeneity and ecological functions, but also the interaction between soil landscapes and human activities [14]. Previous researches on urban expansion and soil sealing paid little attention to evaluating and comparing the regional characteristics of soil sealing and dynamics of soil landscape patterns among different geographical zones (geo-zones) at the provincial scale, which can provide a holistic view for soil utilization and management due to socio-economic development and topographical restriction.
As a case study of Zhejiang Province, one of the most rapidly urbanizing regions in eastern China, which is also a province lacking a plain region for agricultural production, soil sealing has been considered as a severe threat to the environment, food supply and security which is often neglected in this region [10]. Thus, permanent monitoring schemes of soil sealing are especially needed. This paper provided a practical methodological framework integrating remote sensing, geographic information systems and soil landscape analysis, by proposing a feasible and cost-effective method, to explore the dynamics, and evolution of soil sealing and soil landscape change in response to the rampant urbanization process on a large scale. Moreover, potential impacts including threat to soil resources, food security and the implementation of a soil quality database in guiding regional planning is also discussed in this study.

2. Study Area and Database

2.1. Study Area

Zhejiang Province is situated on the eastern seaboard of China, as the south wing of the Yangtze River Delta (Figure 1). Zhejiang Province covers approximately 104,141 km2 and had a population of 48.3 million at the end of 2013. The region is characterized by a complex topography consisting of 70% hill belts, and 30% dense alluvial plains. The climate is humid subtropical. The average annual temperature is 17.8 °C, and the average annual rainfall is about 1380 mm in 2013.
It has experienced unprecedented economic development during the past two decades. The gross domestic product (GDP) per capita increased from 447 US dollars in 1990 to 10885 US dollars in 2013, which was 1.6 times higher than the national average. Additionally, the population density was 464 persons per km2 by the end of 2013, 3.3 times the national average. It makes Zhejiang Province one of the richest and also the most densely populated provinces in China.
Figure 1. Location of Zhejiang Province as well as the spatial division of six geo-zones.
Sustainability 07 07137 g001

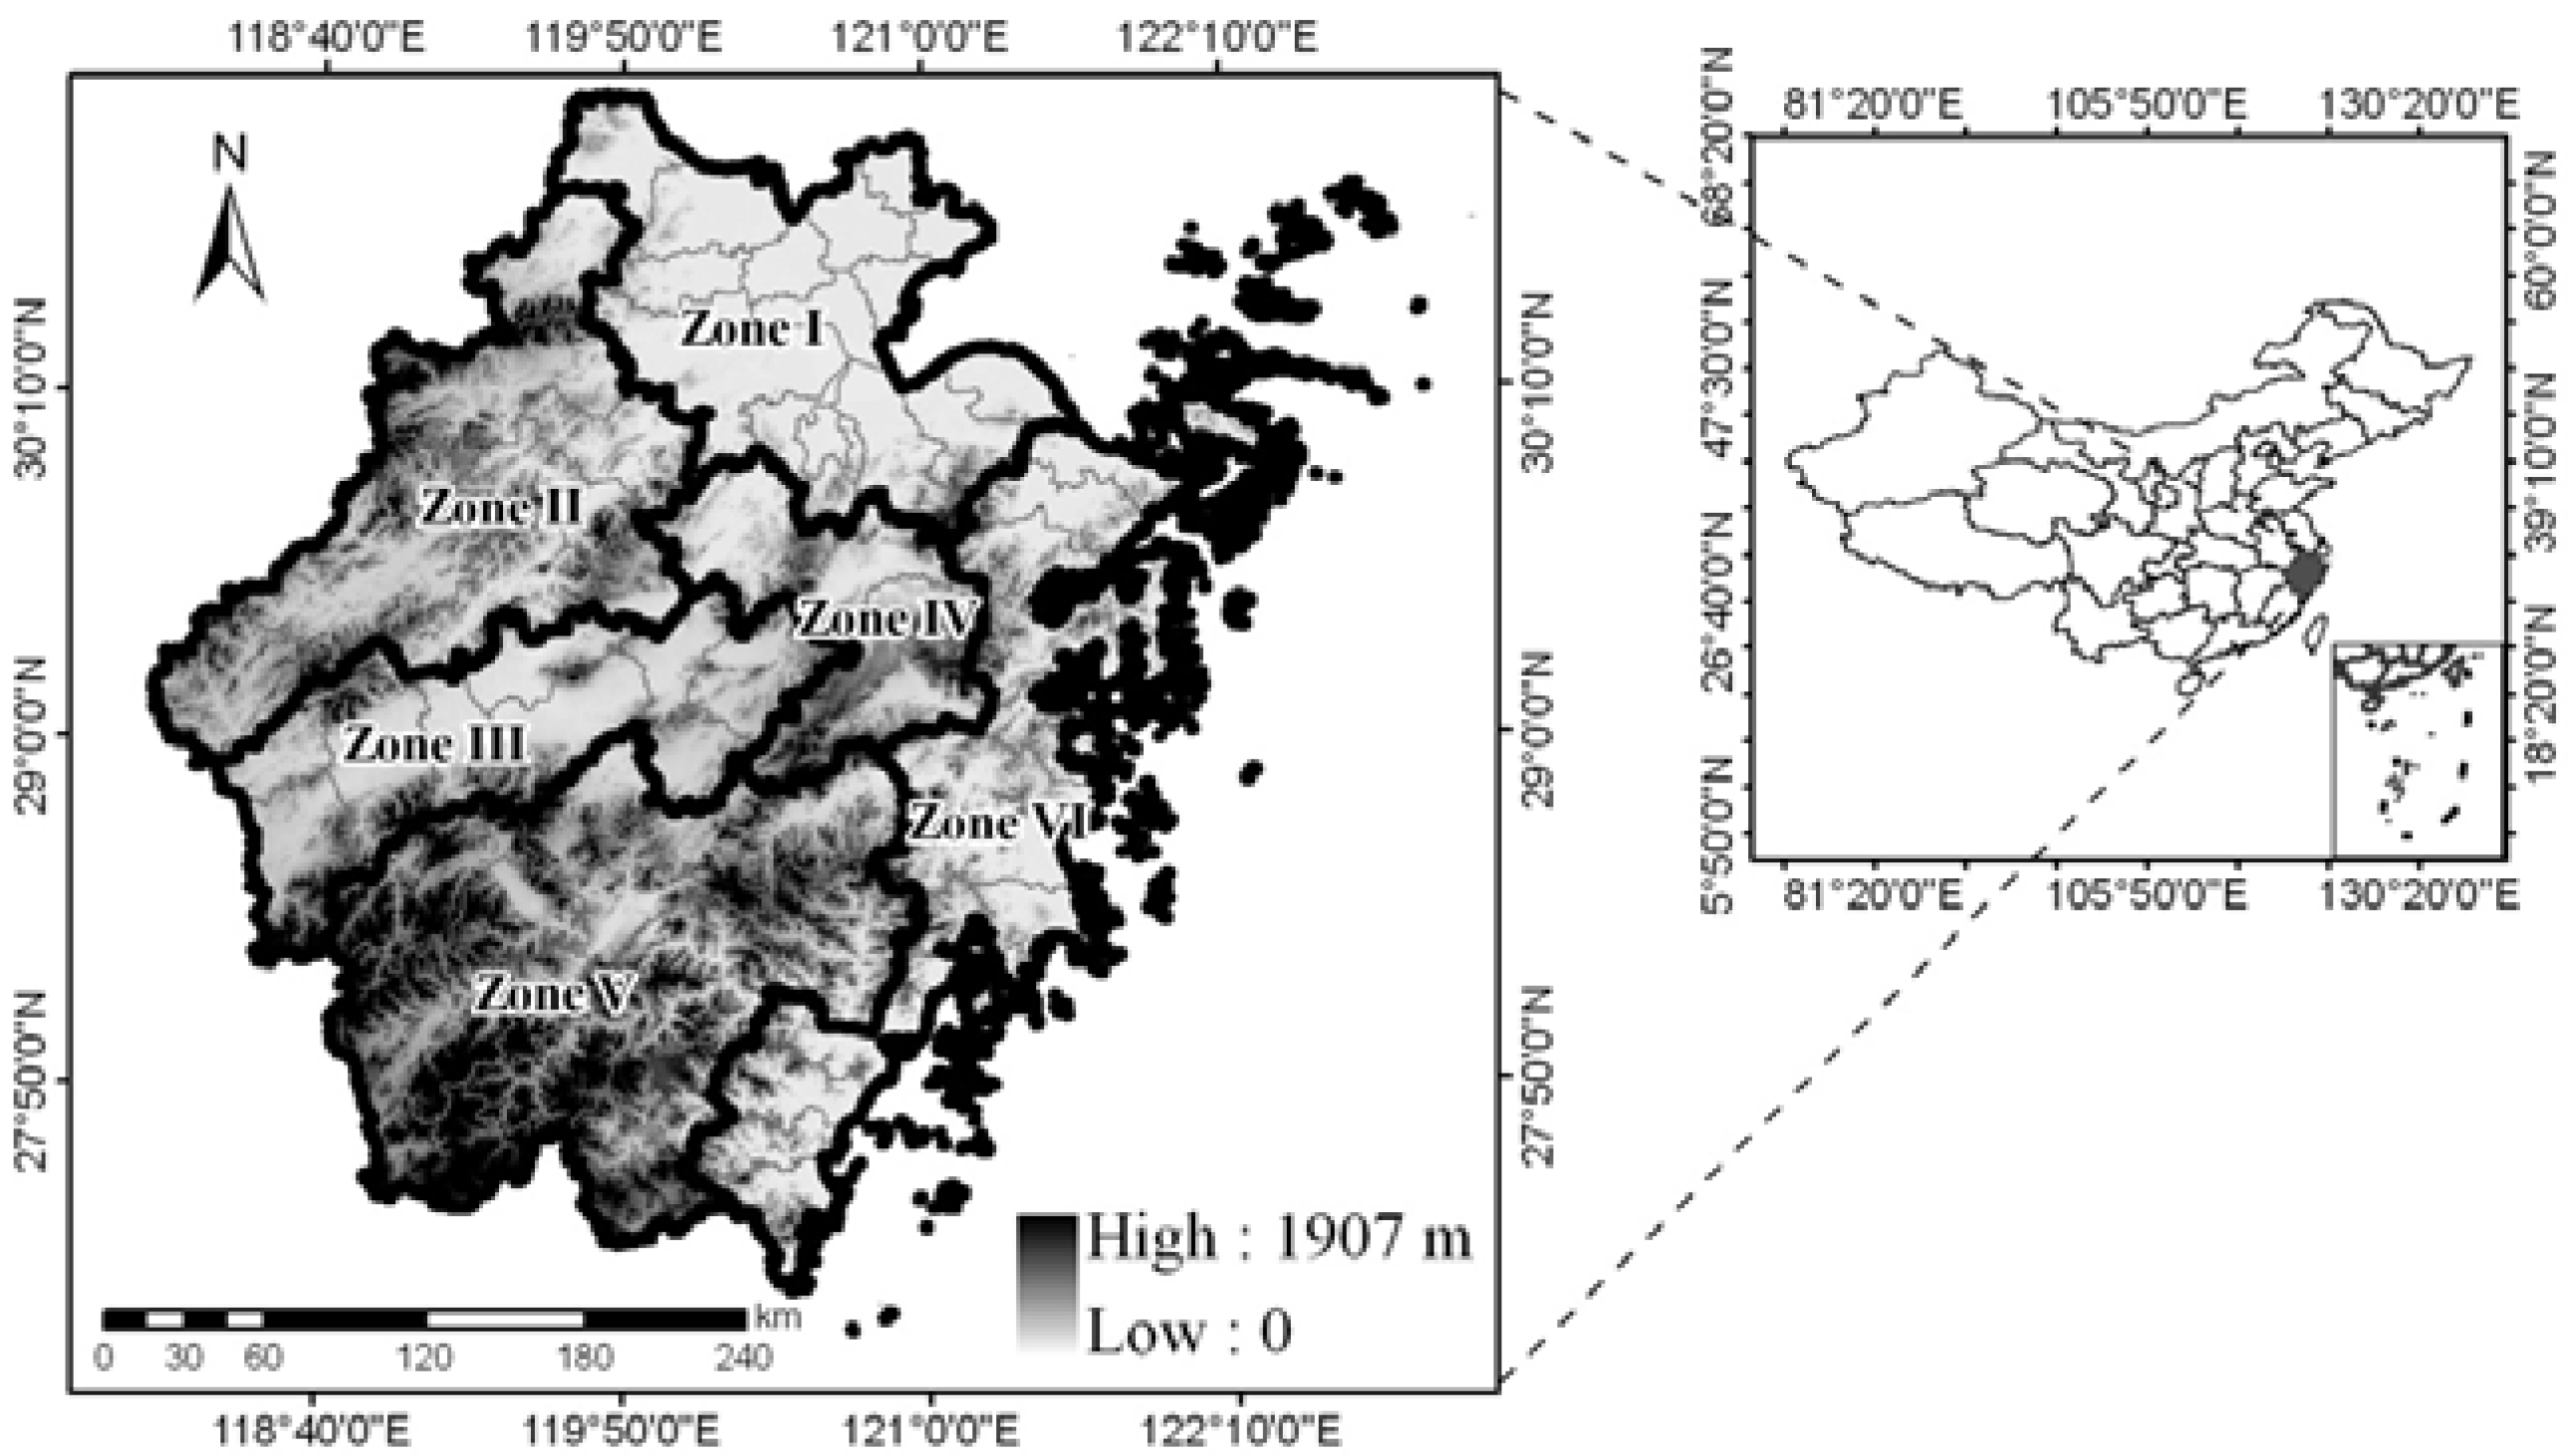
2.2. Partition of Geo-Zones in Zhejiang Province

Division of six geo-zones in Zhejiang Province was based on natural geographical zoning of Zhejiang Province commonly delineated by geographers [15]. Following the principle that location of the majority area of a city/county determines its category, 69 cities or counties were divided into six zones: Zone I (the northern plains region, including 15 cities), Zone II (the northwestern mountainous region, including nine cities), Zone III (the central basin region, including eight cities), Zone IV (the eastern hilly region, including five cities), Zone V (the southern mountainous region, including 14 cities) and Zone VI (the coastal region, including 18 cities), as shown in Figure 1. The major meteorological data and socio-economic indicators of 2013 in each geo-zones are presented in Table 1.
Table 1. Socio-economic indicators of six geo-zones.
Geo-ZoneArea (km2)Average Annual Temperature (°C)Average Annual Rainfall (mm)Population Density (Person/km)GDP Per Capita (US Dollars)
Zone I16,77417.81464.7845.117,357.2
Zone II20,26917.51478.1227.09133.8
Zone III12,12618.51265.9424.29430.0
Zone IV793617.81294.3385.09534.1
Zone V26,59717.11250.5196.05220.9
Zone VI20,43918.21526.2786.712,580.1

2.3. Data Resources

The main dataset used in this paper was listed as follows: (1) digital land use map for year of 1990, 2000 and 2010 were provided by Chinese Ministry of Environmental Protection. The dataset was interpreted from multi-date Landsat TM/ETM images with a spatial resolution of 30 meters using the method of combining object-based segmentation classification and change detection; (2) Digital Elevation Model (DEM) with 30 m’s resolution was used for topographic calculation and geo-zones division; (3) soil survey database of Zhejiang Province with the scale of 1:250,000 that includes a number of variables describing the structure of surveyed soil types, and their physical and chemical characteristics; and (4) demographic and other socio-economic data were obtained from Zhejiang Statistical Yearbooks [16].

3. Methodology

3.1. Summary Description of Soil Types

“Eight great groups” comprise the soil system of Zhejiang Province according to the Provincial Zhejiang Soil Classification System [17]. They are Paddy soils, Coastal saline soils, Fluvo-aquic soils, Limestone soils, Regosols, Purple soils, Red soils and Yellow soils (Figure 2a). A conversion table between Zhejiang Soil Classification and World Reference Base soil groups (IUSS Working Group WRB, 2014) with separated soil characteristics are provided in Appendix.
Figure 2. Soil distribution of Zhejiang Province: (a) soil survey map; (b) soil quality map.
Sustainability 07 07137 g002
Red soils denote the largest soil group of Zhejiang Province covering 36.85% of the entire region, which are characterized by humus horizon, ferralic horizon and parent material horizon. They occur in mountain regions explained by erosion and deposition cycles, and are related to Cambisols in the WRB system. They are followed by Paddy soils (20.2%), which are formed in long-continued wet cultivation. They have anthraquic horizon with an underlying hydragric horizon to reduce percolation losses, and are definitely related to Anthrosols in WRB system. The majority of Paddy soils are distributed in plain regions of northern and eastern Zhejiang Province. Regosols, which take up 12.9% of the provincial area, are weathered away from acid magmatic, sedimentary and metamorphic rocks. They are very weakly developed mineral soils with shallow solum and strong acidity.

3.2. Soil Quality Assessment

In order to estimate the detailed information of the soil quality based on soil productivity potential and cultivated suitability, a weighted-additive system is selected to calculate soil quality index [18,19,20,21,22,23]. Besides seven indicators covering chemical and physical properties of soils (e.g., soil depth, soil organic matter/SOM, total nitrogen (TN), available phosphorus (AP), available potassium (AK), pH and soil texture), an additional topographic indicator (slope) is introduced. Generally, scoring and weighting the indicators is often based on expert opinion or statistical procedures [3]. However, some factors such as pH and soil texture are not easily quantified by numeric equation. In this study, expert score ranking was adopted to quantify the scales and weights of each variable according to its contributions for soil productivity potential with reference to previous researches [24]. Further details on this procedure can be found in Deng et al. [25], which is described in Table 2. The highest weight is assigned to the variable of slope, followed by texture and SOM. The reason is that area with steeper terrain tends to induce higher risk of fertility and soil erosion, and is not conducive to agricultural mechanization. Soil texture affects physical and chemical properties of soil as well as the availability of soil nutrient for crop growth [26]. Meanwhile, SOM was asserted to play an important role in maintaining soil fertility [22].
Table 2. Soil landscape metrics and their ecological characteristics.
IndicatorScoreWeight
1234
Depth (cm)<5050–7575–100>1000.1
TextureHeavy clay/sandLight clay/sand clayClay loam/sand loamLoam0.15
SOM (g kg−1)<1.41.4–2.52.5–3.4>3.40.15
TN (g kg−1)<0.080.08–0.120.12–0.18>0.180.1
AP (mg kg−1)<55–77–9>90.1
AK (mg kg−1)<6161–8484–106>1060.1
pH>7.8≤5.55.5–6.5;7.5–7.86.5–7.50.1
Slope (degree)15–2510–155–10<50.2
Before calculating soil quality index (SQI), regions with slopes exceeding 25° were directly excluded from calculation in advance, and ultimately classified into the lowest level of soil quality. The reason is that they have higher risk of soil erosion, and are recommended to be protected as forest conservation rather than agricultural use [26]. Eight indicators were aggregated into the SQI, which is expressed in Equation (1). Finally, according to the SQI score, the soil coverage of Zhejiang Province was graded into four categories: Excellent (accounted for 17.8% of the entire area of Zhejiang Province), Good (26.6%), Medium (28.7%) and Poor (26.9%). The spatial distribution of soil quality levels was exhibited in Figure 2b. The excellent soils, which are guaranteed of high and stable agricultural production, are distributed in the northern plain region, eastern coastal region and some watershed valley. The poor soils are mainly distributed in the southwest of Zhejiang Province, and this kind of soils are totally not suitable for agricultural production.
S Q I = i = 1 n W i × N i
where SQI is the soil quality index, Wi and Ni represent the weight and score of indicator, respectively, n is the number of indicators. Higher SQI value indicates a higher level of soil quality.

3.3. Metrics of Soil Landscape

Landscape metrics are useful in quantifying the spatial pattern of patches [27]. A number of landscape metrics have been developed to describe the spatiotemporal patterns of land use structure influenced by urbanization. In this study we adopted these landscape metrics to analyze the composition and configuration of soil landscape. Considering their ecological implication for soil landscape studies and the redundancy existing between metrics, five landscape metrics, which are typically adopted and widely used in landscape pattern studies based on land use, are employed in this study to describe the spatial patterns of soil resources under different urbanization processes: patch density (PD), area-weighted mean shape index (AWMSI), largest patch index (LPI), aggregation index (AI) and Shannon’s diversity index (SHDI). FRAGSTATS 3.3 software was used to calculate the selected landscape metrics. The computational equations along with their ecological characters were provided in Table 3.
Table 3. Soil landscape metrics and their ecological characters.
MetricsEquationsDescription
PD P D = N A × 1000000 where N represents the total number of soil patches; A is the total area of soil landscapeRepresents the number of patches within an area of 1 km2 (numbers per 1 km2). PD > 0, higher value denotes higher fragmentation of soil landscape patterns.
LPI L P I = M a x ( X i j ) A × 100 where Xij represents the area of a patchRepresents the dominance of the largest soil patch (percent). 0 < LPI ≤ 100, higher value denotes higher dominance.
AWMSI A W M S I = i = 1 m j = 1 n [ ( 0.25 p i j a i j ) ( a i j A ) ] where pij and aij represents the parameter and area of patch j in soil type iRepresents the complexity and irregularity of soil patches. AWMSI ≥ 1, higher value denotes higher irregularity.
AI A I = [ i = 1 m j = 1 n ( g i j M a x g i j ) ] × 100 where gij is the number of contacts between pixels of each soil type, Max→gij represents the maximum possible number of contacts between the pixels of soil type iReflects the aggregation level of soil types in a landscape (percent). 0 < AI ≤ 100, higher value denotes higher aggregation level.
SHDI S H D I = i = 1 m ( p i × ln p i ) Pi is the percentage of the landscape occupied by soil type iA measure of the diversity of different soil types in a landscape. SHDI ≥ 0, SHDI = 0 means there’s only one soil type comprising the landscape, higher value denotes higher soil diversity.

4. Results and Discussion

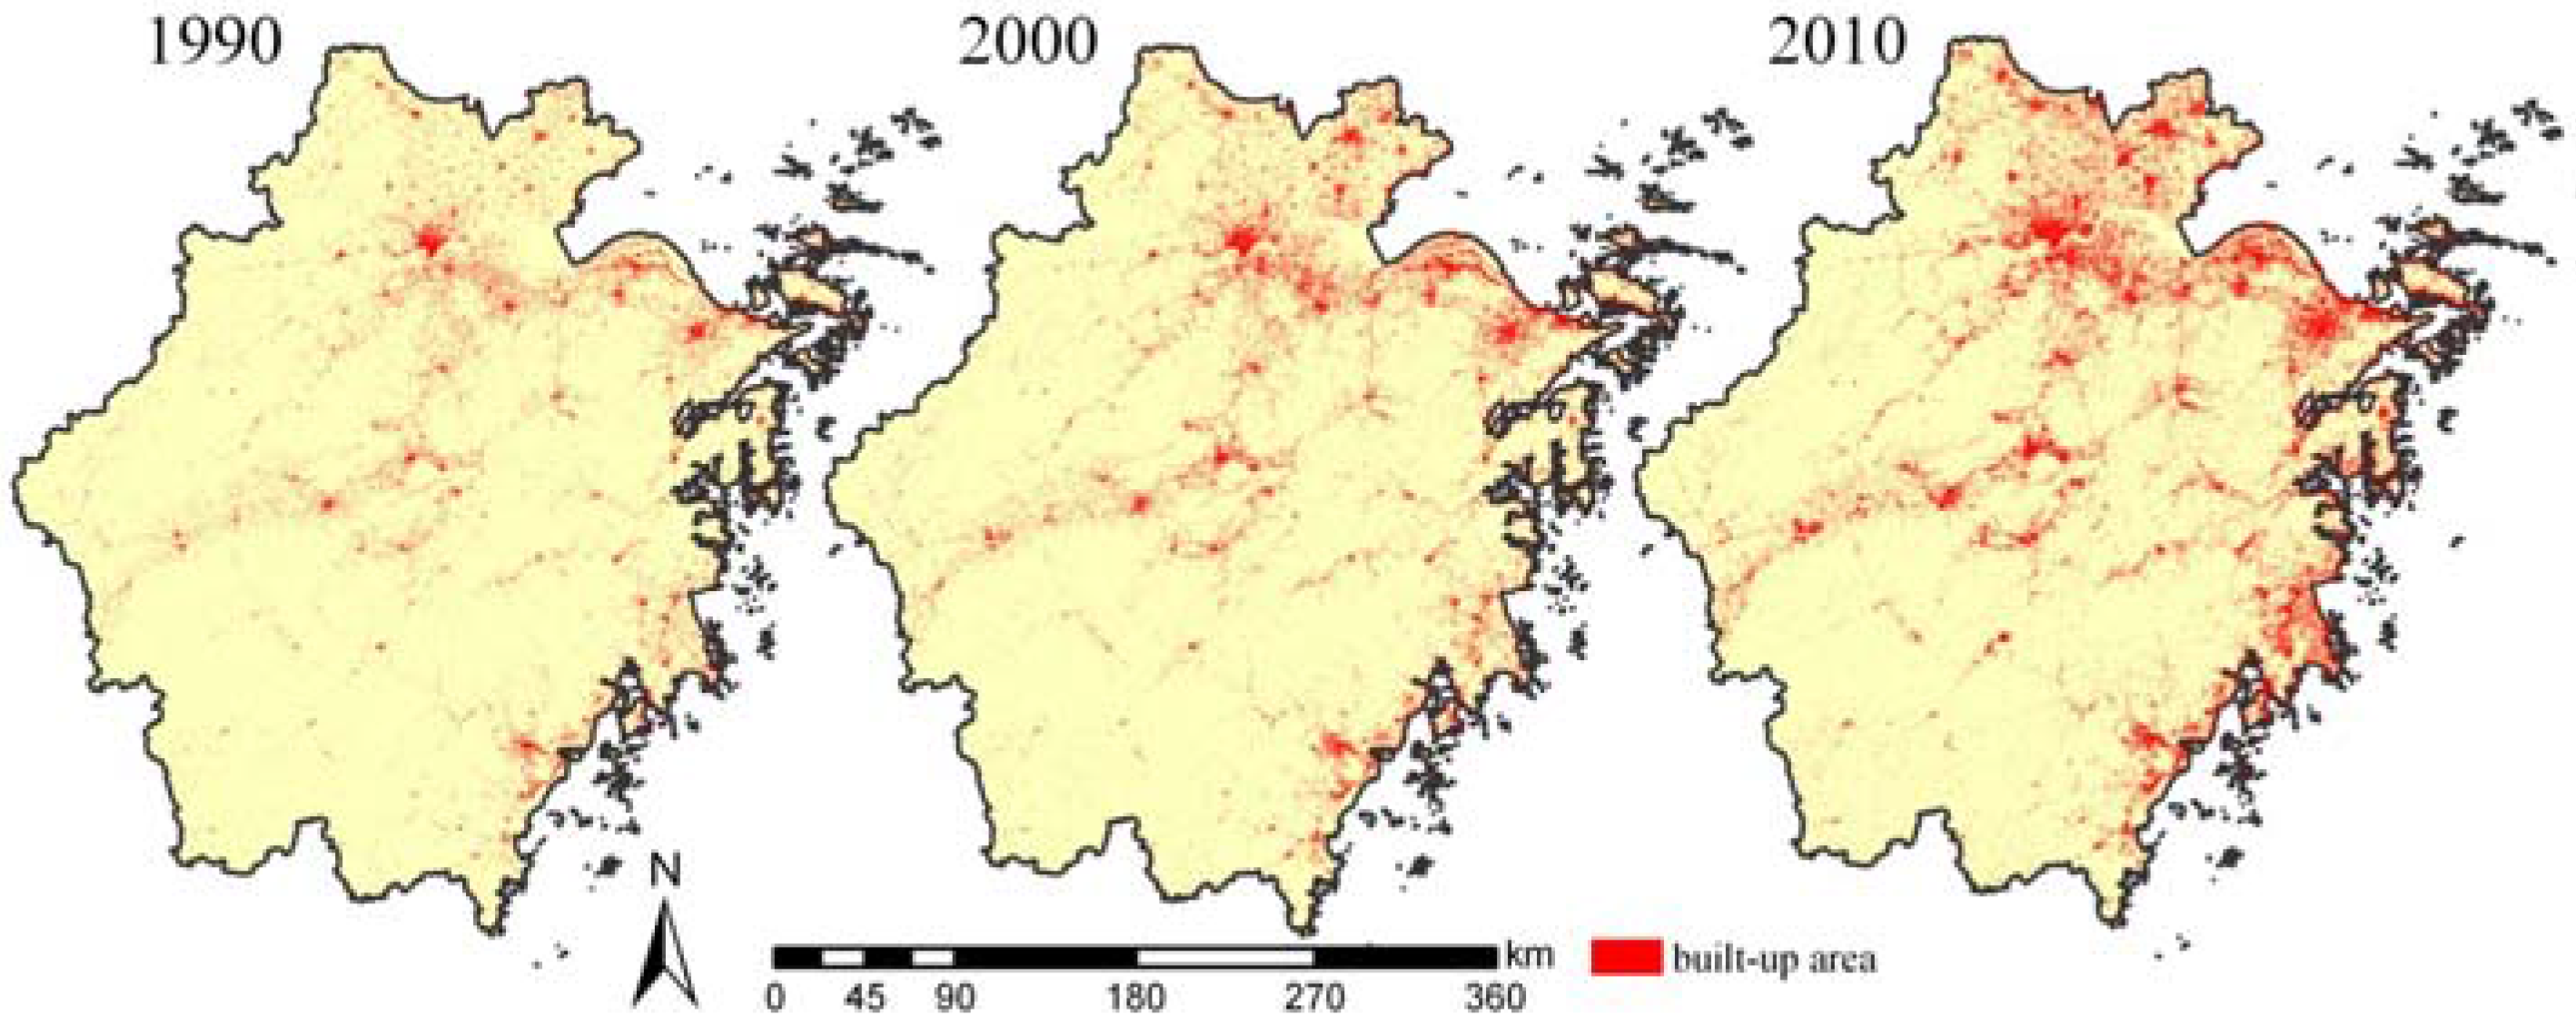
4.1. Dynamics of Soil Sealing Process

Radical market reforms implemented in Zhejiang Province brought immense built-up expansion during the past two decades (Figure 3). According to the results of interpreted remote sensed data, it showed that sealed soils had expanded from 4548.6 to 10,968.5 km2 for the entire study area, with an annual increasing rate of 4.7% over the past two decades (Table 4). The highest increasing rate is observed during 2000 to 2010 (5.5%), when rapid development of export-oriented economy and overheated economic investments stimulated large amounts of construction projects, such as rapid urbanization, new countryside construction, frequent transportation infrastructure construction and the industrial parks boom [25,28].
The comparison of built-up area shows great discrepancy among cities of different geo-zones in Zhejiang Province. For instance, cities in three geo-zones (I, III and VI) are observed to have larger built-up area, which are three typical economically developed centers. In contrast, urbanization is constrained by hilly and mountainous topography in the remaining three geo-zones (II, IV and V). The average expanded built-up area of city in Zone I was observed to be five times more than that in Zone V. It signifies that terrain features and location are two main factors influencing regional urban development. Human settlement is advanced at flat lowland area in close proximity to transportation routes and developed metropolitan cities as estimated in previous researches [29,30]. Zone I, III and VI have specific available resources and are favored by provincial government to achieve rapid economic growth [31]. For instance, cities in Zone I benefits from abundant plain resources and locational advantage of being adjacent to Shanghai, while cities in Zone VI rely on coastal resources for developing fishery and port-transportation.
Figure 3. Expansion of sealed soils in Zhejiang Province.
Sustainability 07 07137 g003
Table 4. Expansion of sealed soils for cities of different geo-zones.
Geo-Zone199020002010
Total area of sealed soil (km2)Zhejiang Province4548.636785.5510,968.48
Average area of sealed soil for each city(km2)Zone I102.30167.51262.94
Zone II51.3169.55105.94
Zone III67.2297.96147.68
Zone IV55.2977.91137.45
Zone V23.7932.4555.03
Zone VI78.06112.19190.65

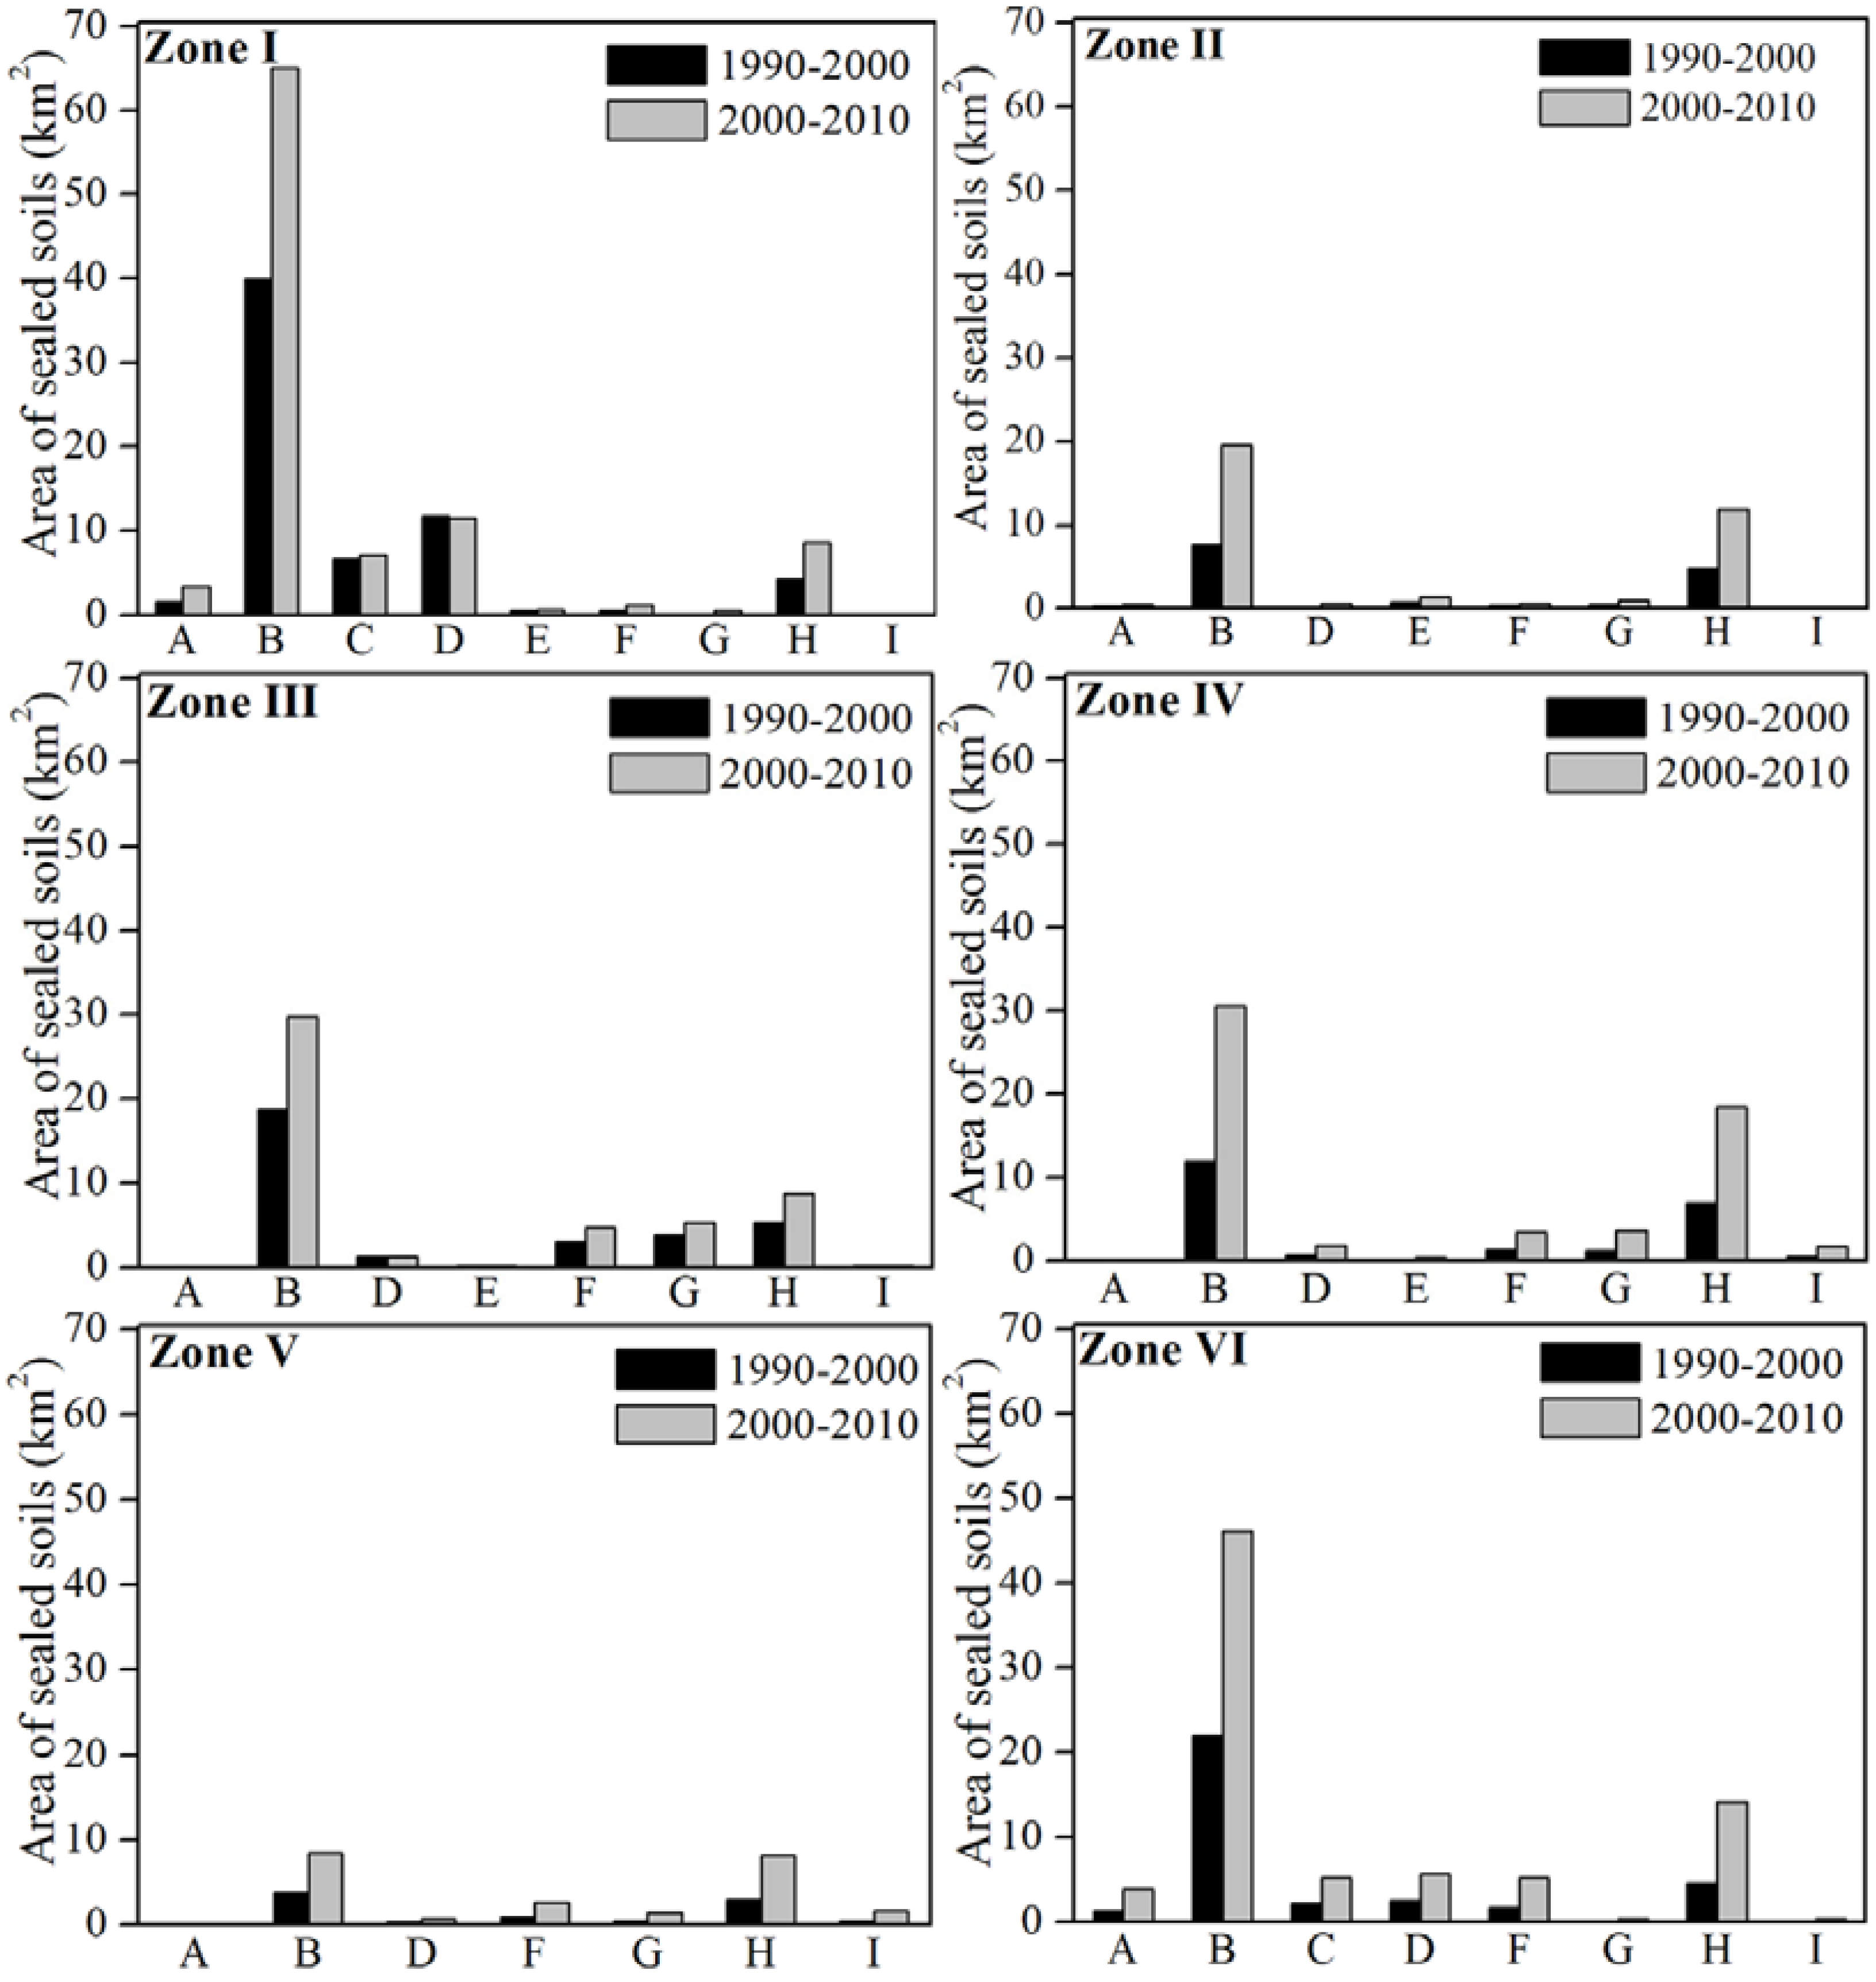
4.2. Type Composition of the Sealed Soils

Based on an overview of the soil types of the newly expanded built-ups during different urbanization periods, it is evident that Paddy soils are the most vulnerable type to be occupied (Figure 4). For the whole study region, 3836 km2 of Paddy soils had been occupied by accelerated urbanization during the past two decades, which accounted for 59% of the total provincial sealed soils. This can be attributed to the fact that Paddy soils are generally distributed in flat areas in close proximity to human settlements due to long tillage history, which determines that they are apt to be occupied by urban sprawl at relatively low cost [32,33]. Moreover, occupation on Paddy soils has sped up distinctly after entering into the 21st century. It is worth mentioning that more than 25% of the Paddy soils in Zhejiang Province have been sealed by the end of 2010. The second largest composition of the sealed soil types is Red soils (16.5%), followed by Fluvo-aquic soils (8.4%).
Figure 4. Occupied area of different soil types among cities in different geo-zones. A—Water, B—Paddy soils, C—Coastal saline soils, D—Fluvo-aquic soils, E—Limestone soils, F—Regosols, G—Purple soils, H—Red soils, I—Yellow soils.
Sustainability 07 07137 g004
The characteristics of soil composition vary among cities of different geo-zones. Paddy soils were proved to be the largest composition of the sealed soils across six zones. The largest occupation on Paddy soils over the past two decades was observed in the cities of Zone I and VI, where majority of the Paddy soils of Zhejiang Province were distributed in these two zones (58.6% of the total provincial Paddy soils). It is summarized that the average consumption of Paddy soils is 826 km2 and 589 km2 per year respectively for each city in these two zones. The consistent sealing of Paddy soils, if not controlled, would seriously threaten food supply and security for that Paddy soils produce about 90% of staple food in eastern coastal China historically [34]. Zhejiang is confronted with the great pressure of having a severe shortage of land supply both for agricultural production and economic development, for it is one of the poorest provinces in terms of land resources in China [35]. In order to fill this gap, local governments set their sights on low hilly regions for economic development and urban expansion purposes [36], such as Zone II, IV and V, which is reflected by relatively high occupation on Red soils and Yellow soils in these regions. Meanwhile, cities located in coastal regions, such as Zone I and VI, have another option to increase available land: reclamation from sea, either for aquaculture or port construction [37]. These diversified reclamation programs led to the considerable occupation on water in these two zones. However, it is noteworthy that these two projects of expanding available lands have potential risks, such as aggravating regional soil erosion and threatening coastline ecology [37,38].

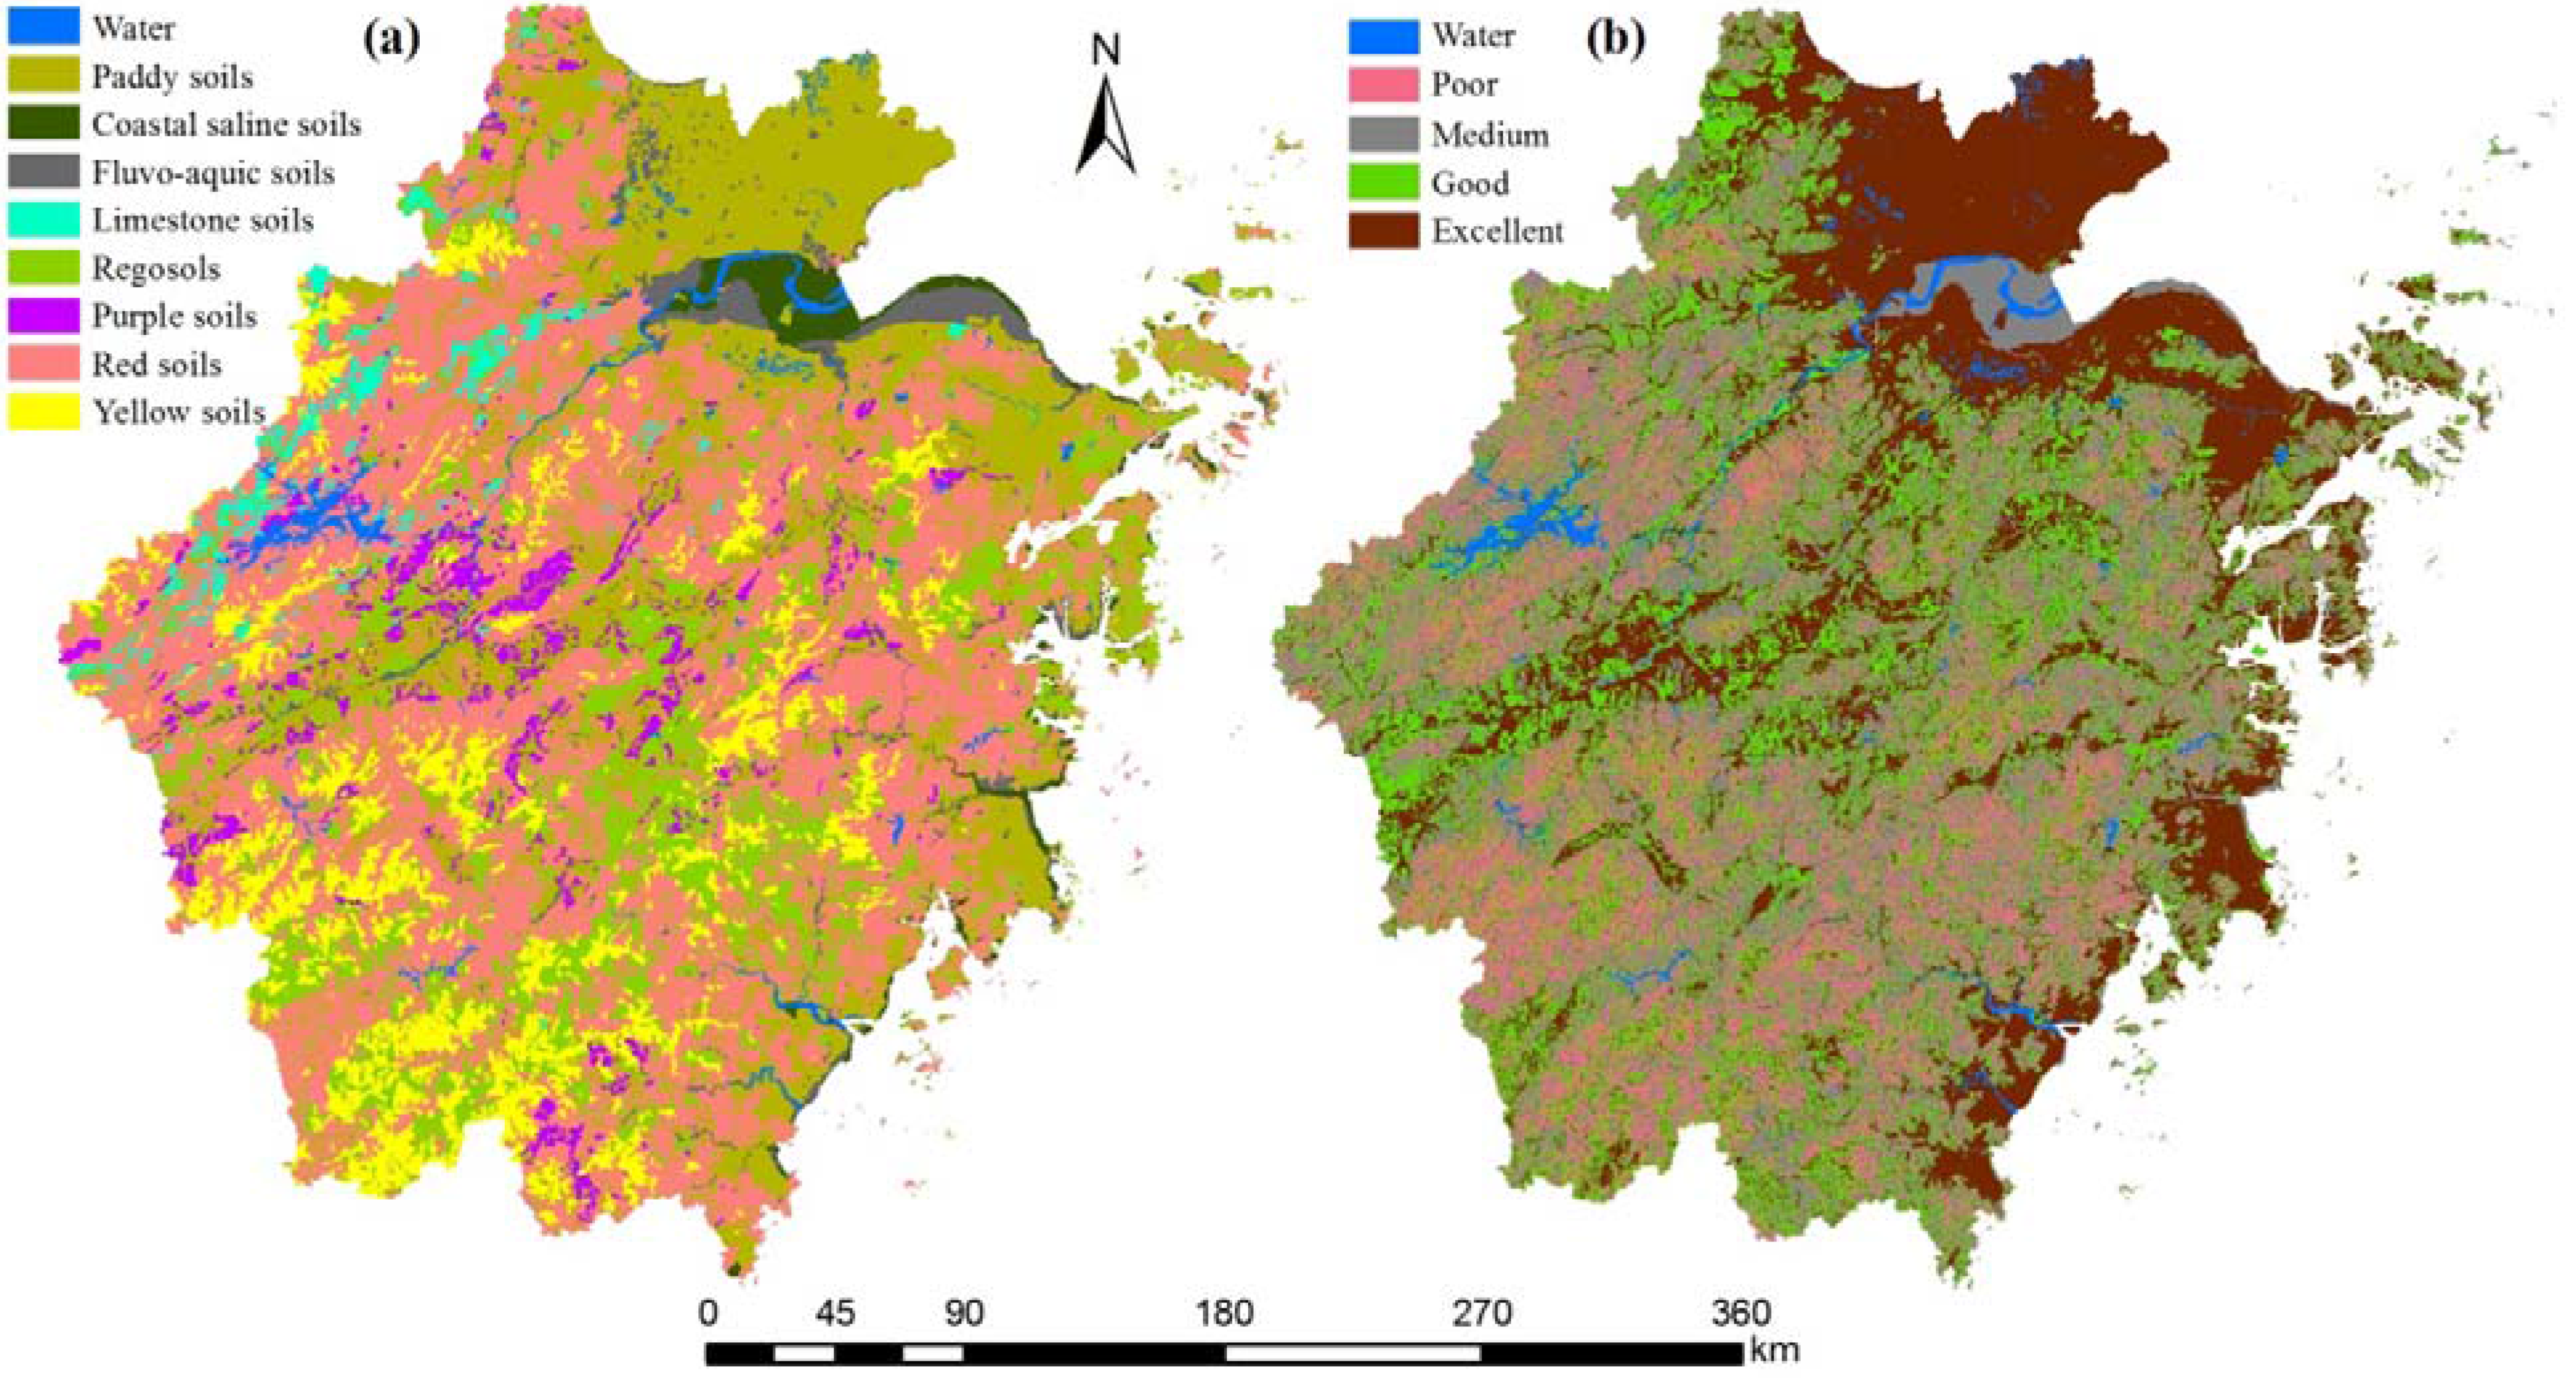
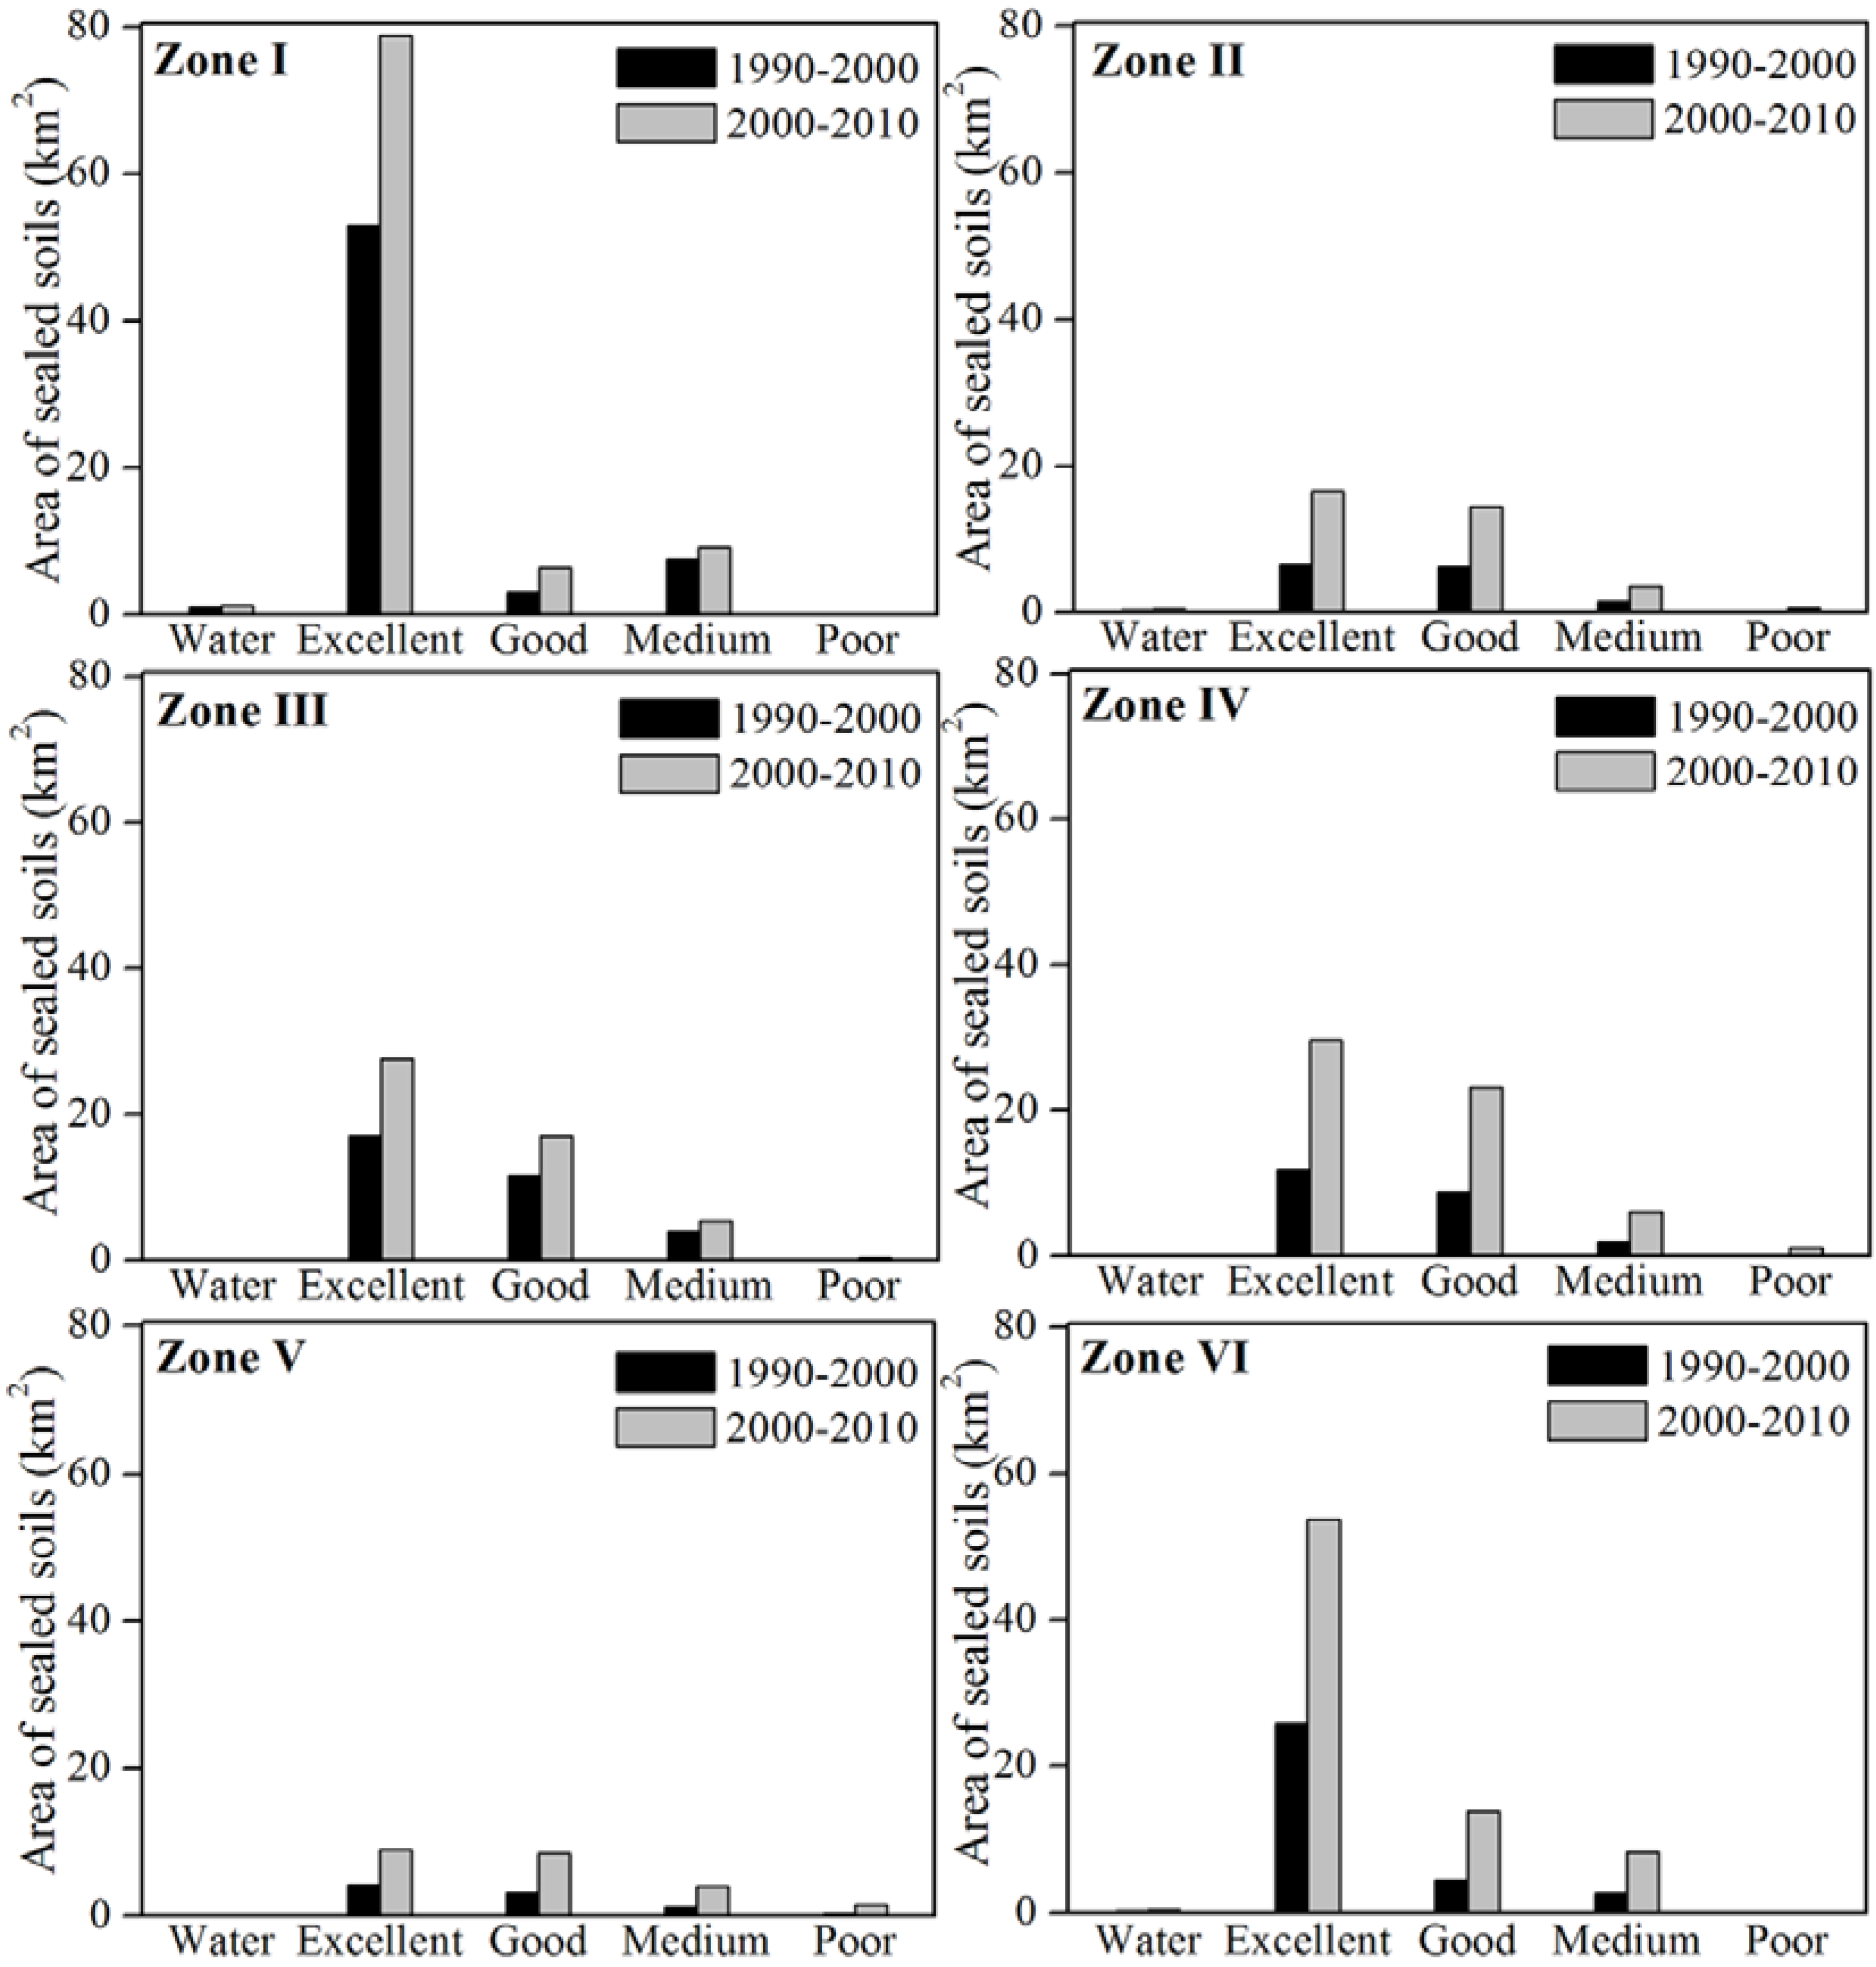
4.3. Quality Estimation of the Sealed Soils

The soil quality evaluation of the sealed soils reveals that better soils have higher risk of being sealed (Figure 5). More seriously, soils of the highest quality (i.e., ranked Excellent in Figure 5) are the dominant composition of sealed soils during the past two decades in Zhejiang Province, accounting for 68.6%. During 2000 to 2010, total area of 2802 km2 of the excellent soils has been sealed, compared to that of 1581 km2 during 1990 to 2000. It is followed by the second-best soils (ranked as good in Figure 5), which makes up 19.0% of the sealed soils. Occupation on fertile soils is also a common phenomenon that happens to most cities, for majority of which are located on river flood plains with high productive land [39]. The consistent and even intensified sealing of high-quality soils leads to significant reduction in agricultural potential and increasing threat to food security for Zhejiang Province.
As exhibited in Figure 5, excellent soils are the most vulnerable to sealing across cities of six geo-zones. When comparing sealed area of excellent soils between two estimated periods, it is found that the area has doubled in the 2000s in cities of four geo-zones (Zone II, IV, V and VI). However, occupation on excellent soils is severest in Zone I considering sealed area. An area of 132 km2 of excellent soils has been occupied by urban sprawl during the past two decades for each city in Zone I. What is more, excellent soils account for 82.3% of the newly expanded built-ups during the past two decades. This region was once known as the “Land of plenty” for its fertile lands and high agricultural productivity, and now is famous for rapid urbanization and industrialization. The large scale of high-quality arable land has been transferred to build-up in this region. Cities of Zone II and V had the least occupation on the excellent soils, with the percentages of 46.1% and 41.3%, respectively. These two zones are located in the mountainous region of Zhejiang Province, where plain regions with fertilized soils are extremely limited. However, local government accelerates economic growth at the expense of consuming the limited high-quality soils.
Zhejiang is one of the richest provinces in economic development, but also the poorest in land resources. The dramatic occupation on productive soils distributed on flat plains has become a serious threat to food security and soil ecological health. Our results reveal that the rampant urban sprawl rate, if not being rationally planned, would lead to exhaustion in excellent soils for agricultural uses by 2050 in Zhejiang Province. Although quite a number of land protection schemes were promulgated in the late 1990s, such as the General Land Use Planning and Arable Land Protection [40,41], our results indicated that the crisis of sealing on productive soils has not been relieved at all. To achieve an effective result, establishing a soil quality database seems more necessary for guiding the implementation of these regulations. Moreover, sustainable regional planning of Zhejiang Province is also especially needed for urbanization intensity allocation and productive soil preservation.
Figure 5. Occupied areas of different quality levels among cities in different geo-zones.
Sustainability 07 07137 g005

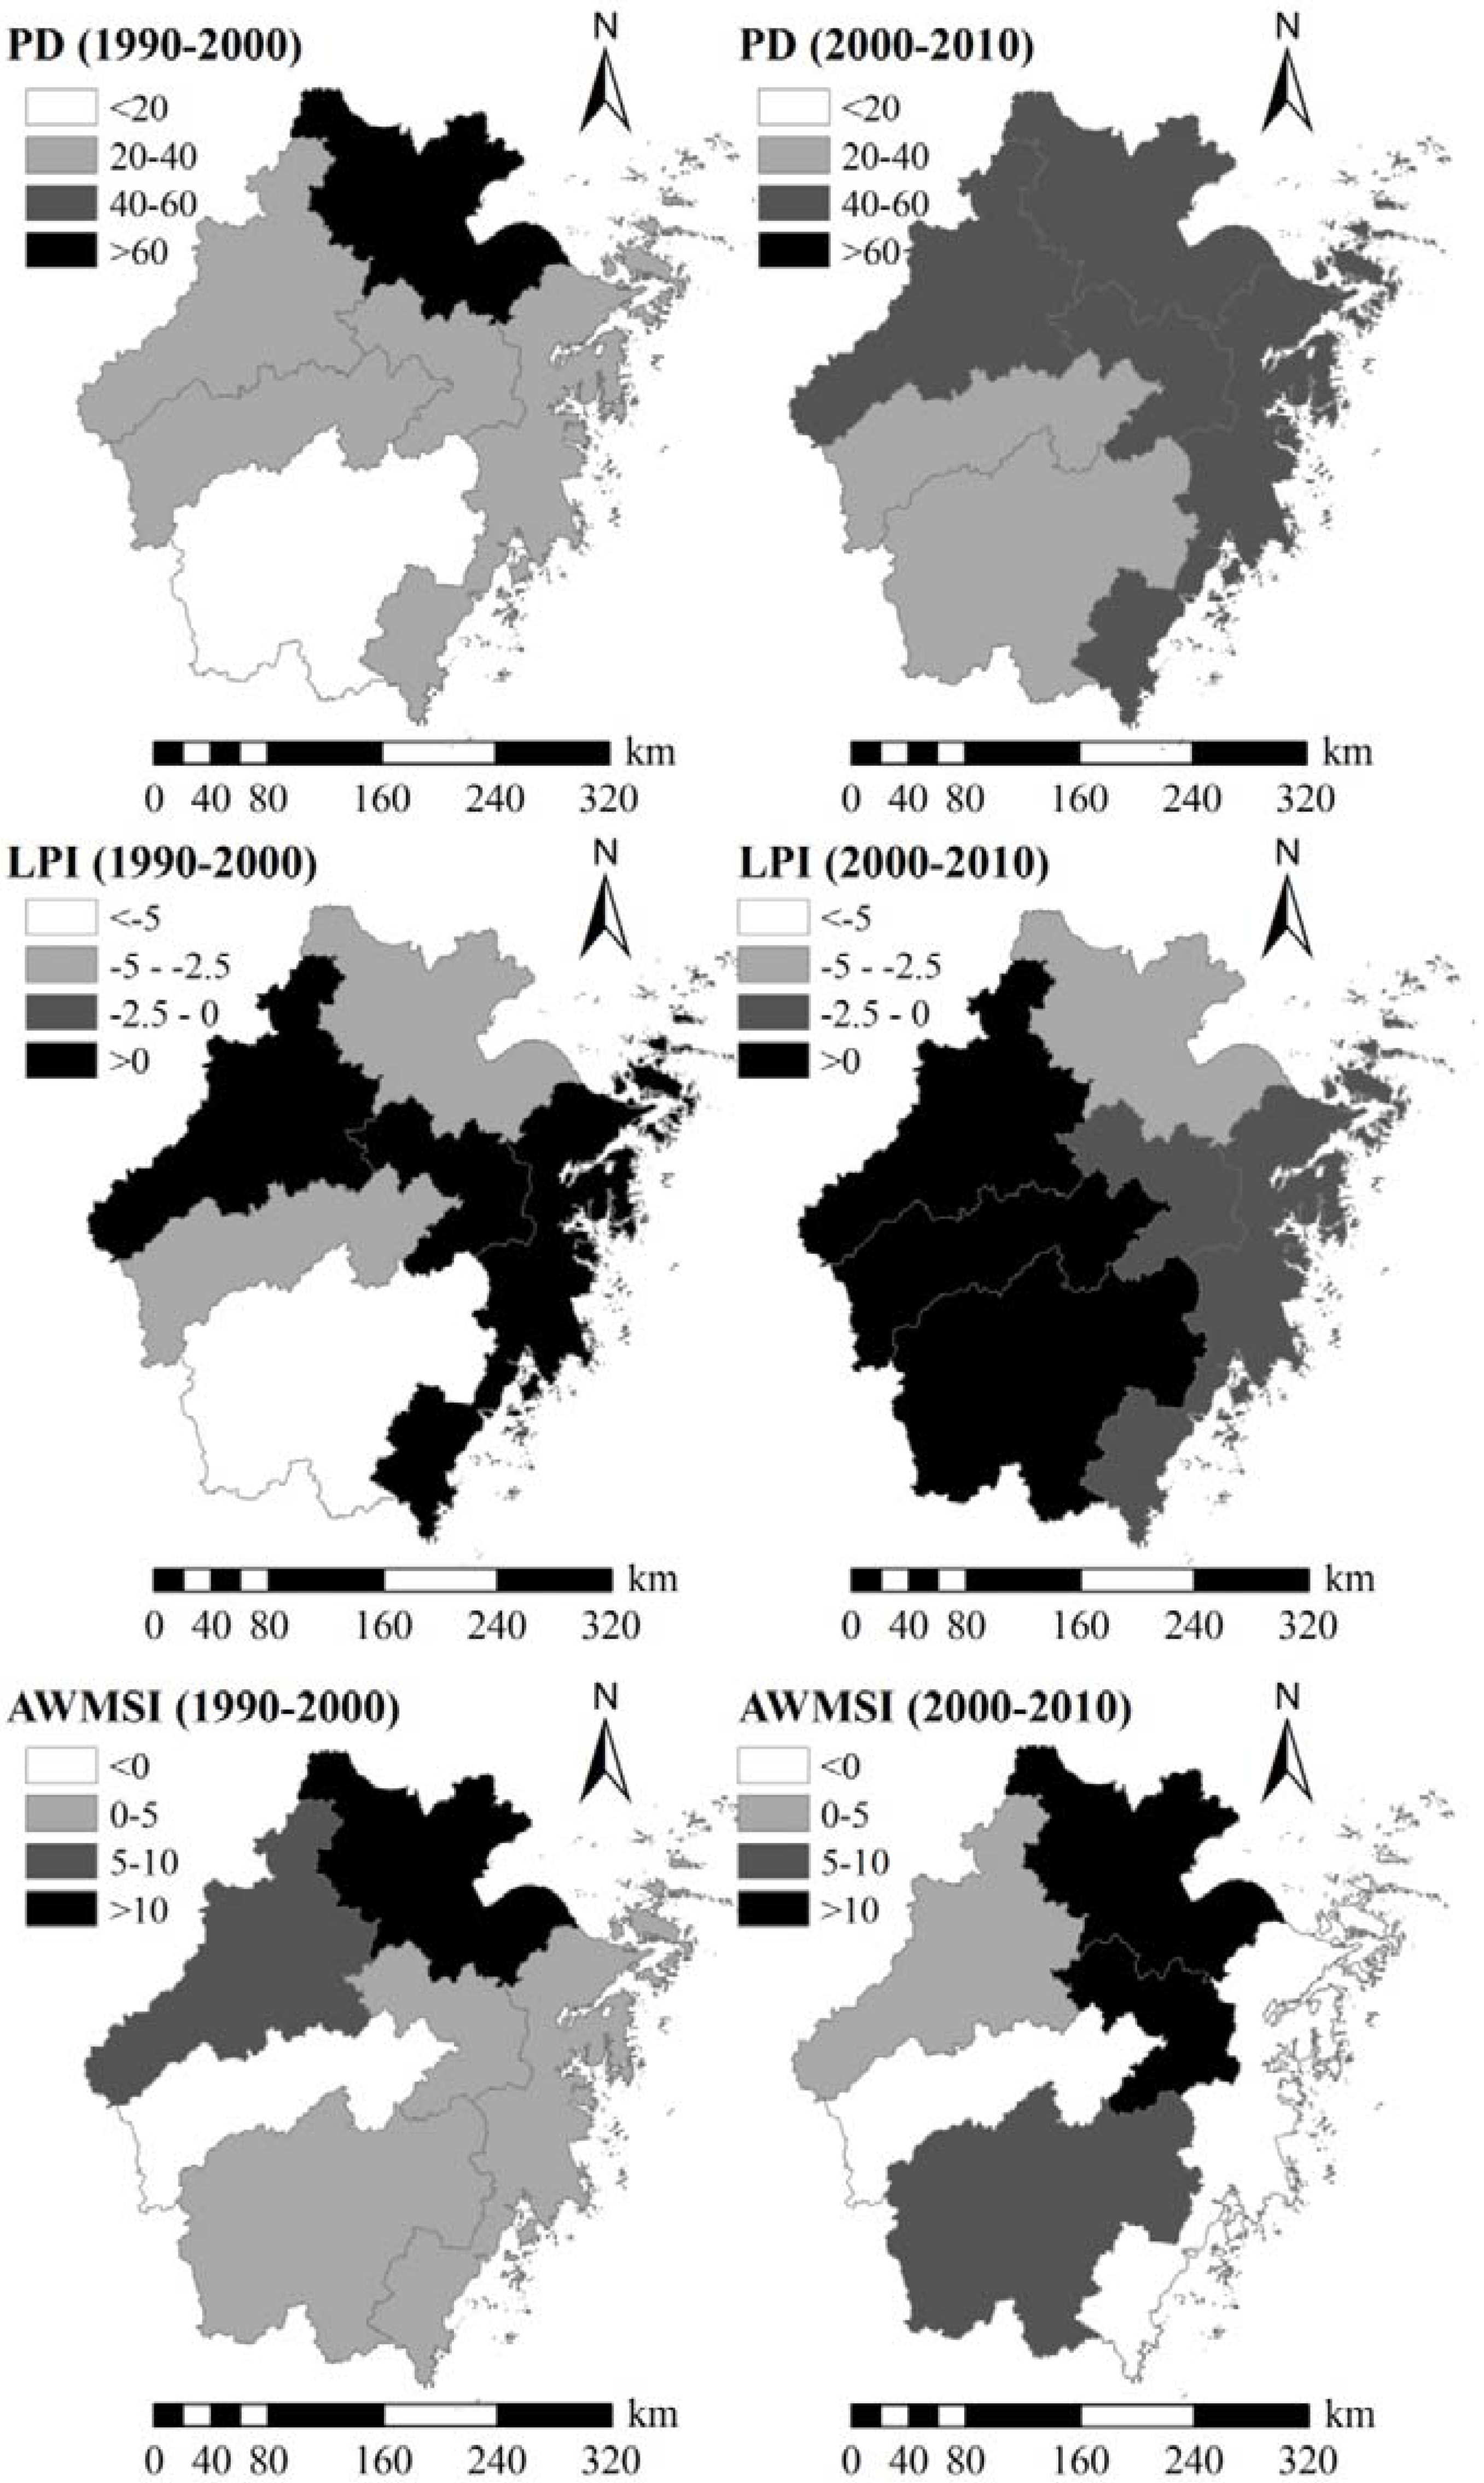
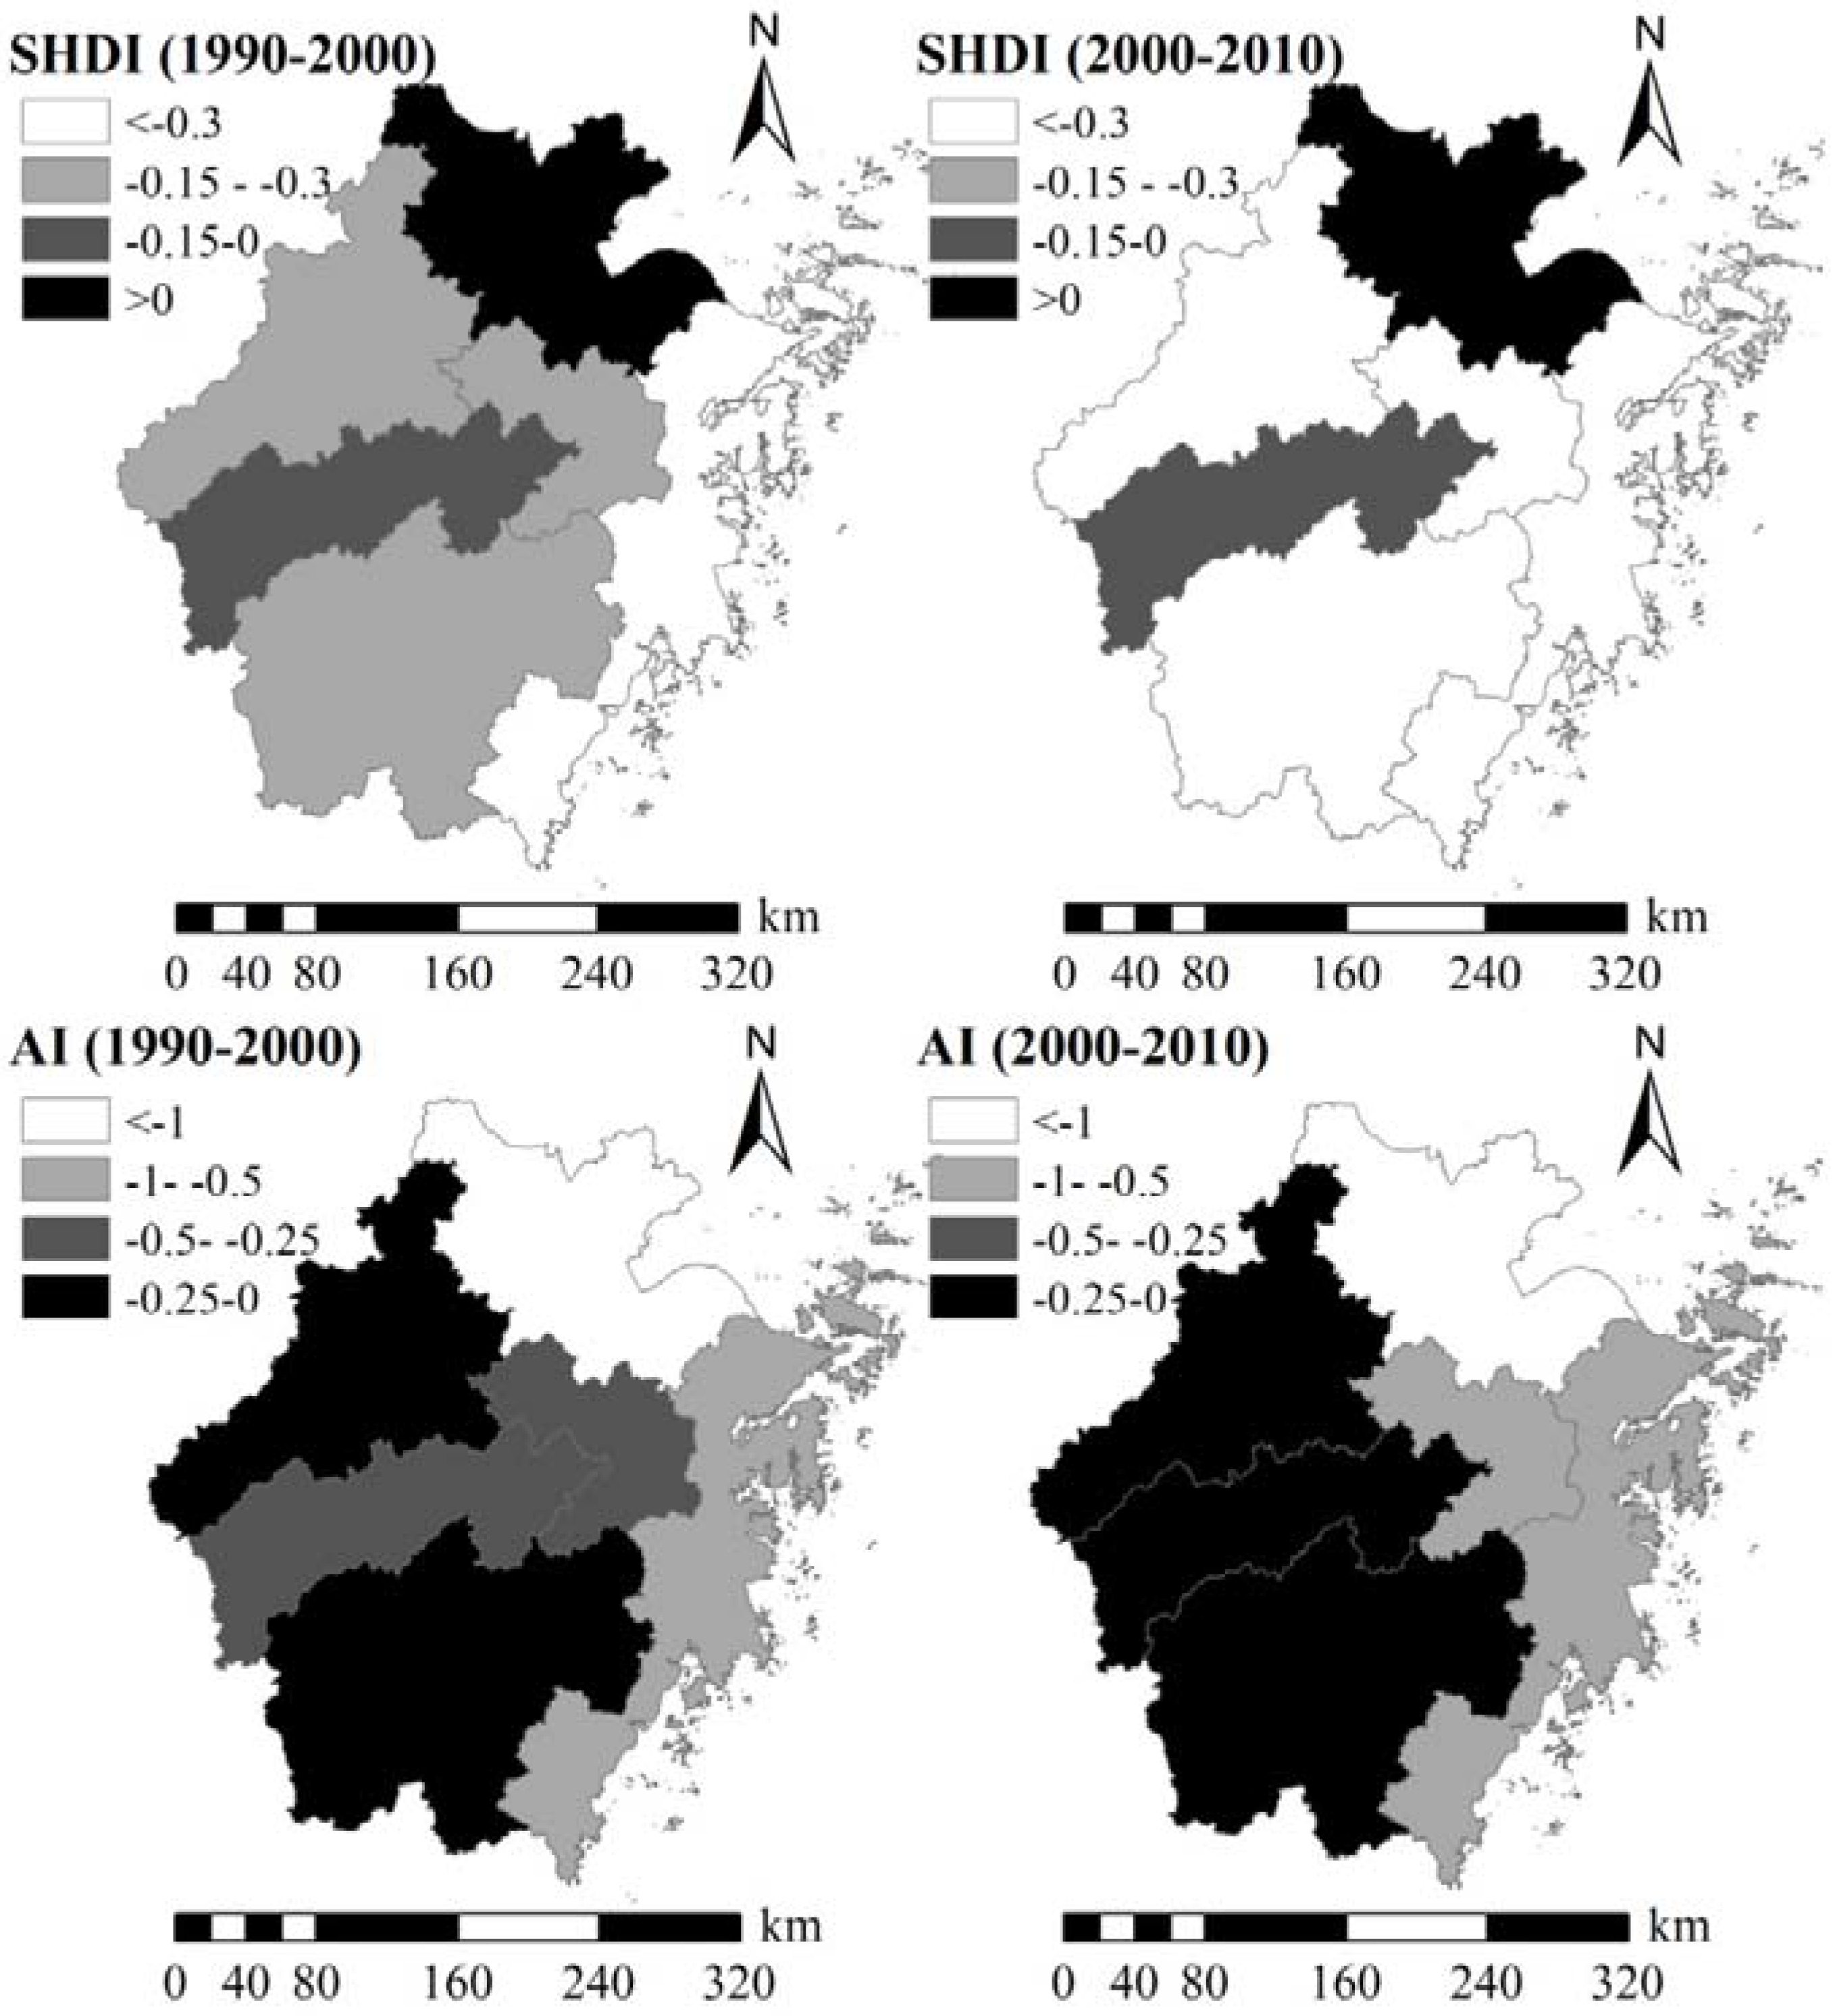
4.4. Soil Landscape Changes Due to Urbanization

Generally, as a result of soil sealing processes under accelerated urbanization, soil landscape patterns have also changed to a great extent (Table 5). For the entire study region, soil landscape patterns have become not only more fragmented and irregular explained by the increase in PD and AWMSI, but also more dispersed due to the decrease in AI. Meanwhile, the intensified sealing of soils reduced the dominance of soil landscapes (decline in LPI) and diversity (decline in SHDI). Urbanization had greater impact on the soil landscape changes in the period of 2000 to 2010 than 1990 to 2000. This could be attributed to the fact that urbanization intensity during 2000 to 2010 was more substantial. Moreover, the massive construction of a transportation network during this period has greatly spread human activities, and thus given rise to soil landscape fragmentation. It is evidence that the length of transportation routes (including railways and highways) in Zhejiang Province increased from 31,028 km in 1990 to 43,163 in 2000, then leapt to 111,938 km in 2010. Among these five indices, SHDI exhibited relatively smooth change, signifying that the number of soil types we considered is too limited to reflect the change of soil diversity in such a wide study region.
Table 5. Change of soil landscape metrics between 1990 and 2010 in Zhejiang Province.
Metrics199020002010R (a) (1990–2000)R (a) (2000–2010)
PD0.280.370.5432.14%45.95%
LPI3.683.503.46−4.65%−1.15%
AWMSI11.1812.0512.897.75%6.96%
AI9.779.749.68−0.36%−0.52%
SHDI1.581.571.56−0.45%−0.57%
(a) R represents change rate.
The change of soil landscape patterns varies among different geo-zones of Zhejiang Province (Figure 6). As exhibited in Figure 6, all of the six geo-zones showed obvious increases in PD and decreases in AI, implying an intensified fragmentation and dispersion of soil landscapes. Majority of the zones experienced increases in AWMSI except for Zone III. We infer that the topographic situation of basin, which is a flat region surrounded by hills and mountains, may contribute to the characteristics of compact and contiguous development. It signifies a pattern of concentrated human activities, with less interference on the surrounded natural soil resources in Zone III. Similar findings were observed in other basin regions [42,43]. Zone I experienced the greatest impact on soil landscapes by a drastic increase in PD and AWMSI, and decrease in LPI and AI during the two estimated periods. By contrast, Zone V experienced the least influence on soil landscapes. As indicated in previous researches, GDP and population have great effect on landscape patterns indirectly through growth in built-up areas [34]. In this study, population density of Zone I is more than four times that of Zone V during the estimated years. Furthermore, GDP per unit area of Zone I is nearly 13 times that of Zone V. Soil resources in Zone V experienced less artificial disturbances compared with other geo-zones.
Soil landscape fragmentation by rampant urbanization is considered as the most serious impacts threatening soil biodiversity and landscape functioning [44]. The increase in edge lengths and soil patches also brings greater risk to soil resources by consistent urban sprawl. The soil landscape analysis of Zhejiang Province exhibited as a typical example experiencing rapid urbanization. Moreover, due to the scale dependence of landscape analysis accomplished through the calculation of landscape indices, we analyzed and compared the temporal change of soil landscape patterns of individual geo-zones to cross scale dependent barriers [45].
Figure 6. Change rate of soil landscape metrics between 1990 and 2010 among different geo-zones.
Sustainability 07 07137 g006aSustainability 07 07137 g006b

5. Conclusions

Urbanization triggered soil sealing has been deemed as a severe threat to soil degradation, eco-environments, food supply and security. The presented study contributes to the analysis of long-term soil sealing and soil landscape dynamics among different geo-zones in a developed region of eastern coastal China. The proposed framework is proven to be feasible and cost-effective, and the results are significant for governments in formulating strategies against land degradation within urban planning and regional development policies.
Results of this study indicate that the rampant urbanization in Zhejiang Province have imposed great challenges on soil resources characterized by dramatic soil sealing and fragmented soil landscape during the past two decades. For the entire region, the percentage of sealed soils increased from 4.4% in 1990 to 6.6% in 2000 and 10.6% in 2010. More seriously, the built-up area expansion occupied preferentially high-quality soils distributed in plain regions, especially Paddy soils. Moreover, the constant urban sprawl resulted in soil landscape fragmentation and irregularity, and even reduction in the dominance of soil landscapes. Furthermore, the present study identifies different characteristics of soil sealing and soil landscape pattern dynamics among cities of different geo-zones. Results indicate that there is an apparent intraprovincial distinction in urbanization intensity, composition of sealed soils and dynamics of soil landscape patterns among different geo-zones in Zhejiang Province owing to socio-economic development and terrain features. Cities of Zone I and VI have experienced the most intense soil sealing and anthropogenic interference to soil landscapes. They were also observed to have the highest occupation on the most fertilized soils and paddy soils.
This drastic soil sealing process, if not controlled, would give rise to the devastating consequences of environmental deterioration, food insecurity crisis and soil ecological instability. From a policy perspective, establishing a timely database and permanent monitoring dynamics of soil sealing on prospects of soil quantity and quality at the national scale may provide useful information to sensitize the public opinion and government at all levels. Especially in those relatively rapid urbanizing regions, protecting fertilized soils from consistent urbanization has become one of the most urgent and pressing missions. (1) Stimulating urban sprawl to areas with low-quality soils in urban planning and design to conserve limited high-quality soils; (2) accelerating rural regeneration and brown-field development in order to control low-density settlement growth and protect contiguous farmland for agricultural production; and (3) aptly adjusting urbanization processes and environment conservation among different geo-zones with regard to natural resources, such as soil quality and terrain features, effectively balances the human activities and soil resources, and thus achieves sustainable development.

Acknowledgments

This research was funded by the Zhejiang Province Key Science Technology Innovation Team (2015BAC02B06), the scientific Project of Ningbo Academy of Agricultural Sciences (2015NKYP002) and the Humanity and Social Science Youth Foundation of Ministry of Education of China (14YJCZH132). The authors thank Editor Xiaoyan Liu and three anonymous reviewers for their constructive comments, suggestions and help in enhancing the manuscript.

Author Contributions

Jiadan Li and Ke Wang had the original idea for the study and all co-authors conceived and designed the methodology. Jiadan Li, Jinsong Deng and Shuquan were responsible for the processing and analysis of the data. Jiadan Li drafted the manuscript, which was revised by Zhihao Xu and Qing Gu. Fangjin Ye helped polish the language of the manuscript. All authors read and approved the final manuscript.

Appendix

Table A1. Conversion Table between Great Groups of Zhejiang Soil Classification and World Reference Base 2014.
Great Group of Zhejiang Soil ClassificationMain CharacteristicsWorld Reference Base Reference Soil Group (b)
Paddy soilModified from any soil material by long-continued cultivation, with an anthraquic horizon and plow soleAnthrosols
Coastal saline soilWeakly developed due to short pedogenic history; have a high concentration of soluble salts; alkaline soil.Solonchaks
Fluvo-aquic soilInfluenced by rainfall, groundwater, and irrigation; the parent material is proluvium, river alluvium, etc.Cambisols
Limestone soilWeakly developed shallow soil with high pebble content; the parent material is limestone.Cambisols
RegosolsWeakly developed mineral soils in unconsolidated materials, with shallow solum and strong acidity.Regosols
Purple soilWeakly developed shallow soil due to erosional influences.Cambisols
Red soilDeveloped under rapid weathering and strong leaching by erosion and deposition, presenting allitization and ferritization, with heavy texture and low ECEC.Cambisols
Yellow soilSimilar to red soil, distributed on higher altitude compared with red soil, characterized by an additional litter layer above humus horizon.Cambisols
(b) According to IUSS Working Group WRB (2014) [46] and Zhi et al. [47].

Conflicts of Interest

The authors declare no conflict of interest.

References

  1. Scalenghe, R.; Malucelli, F.; Ungaro, F.; Perazzone, L.; Filippi, N.; Edwards, A.C. Influence of 150 years of land use on anthropogenic and natural carbon stocks in Emilia-Romagna region (Italy). Environ. Sci. Tech. 2011, 45, 5112–5117. [Google Scholar] [CrossRef] [PubMed]
  2. Depietri, Y.; Renaud, F.G.; Kallis, G. Heat waves and floods in urban areas: A policy-oriented review of ecosystem services. Sustain. Sci. 2012, 7, 95–107. [Google Scholar] [CrossRef]
  3. Zhang, B.; Zhang, Y.; Chen, D.; White, R.E.; Li, Y. A quantitative evaluation system of soil productivity for intensive agriculture in China. Geoderma 2004, 123, 319–331. [Google Scholar] [CrossRef]
  4. Barbero-Sierra, C.; Marques, M.J.; Ruíz-Pérez, M. The case of urban sprawl in Spain as an active and irreversible driving force for desertification. J. Arid. Environ. 2013, 90, 95–102. [Google Scholar] [CrossRef]
  5. Pouyat, R.; Yesilonis, I.; Russell-Anelli, J.; Neerchal, N. Soil chemical and physical properties that differentiate urban land-use and cover types. Soil Sci. Soc. Am. J. 2007, 71, 1010–1019. [Google Scholar] [CrossRef]
  6. D’Angelo, M.; Enne, G.; Madrau, S.; Zucca, C. Soil consumption by urbanisation: A case study in northern Sardinia (Italy). Opt. Méditerr. Sér. A Sémin. Méditerr. 2001, 44, 287–293. [Google Scholar]
  7. Morello, J.; Buzai, G.D.; Baxendale, C.A.; Rodríguez, A.F.; Matteucci, S.D.; Godagnone, R.E.; Casas, R.R. Urbanization and the consumption of fertile land and other ecological changes: The case of Buenos Aires. Environ. Urban. 2000, 12, 119–131. [Google Scholar] [CrossRef]
  8. Gardi, C.; Panagos, P.; Liedekerke, M.V.; Bosco, C.; Brogniez, D.D. Land take and food security: Assessment of land take on the agricultural production in Europe. J. Environ. Plan. Manag. 2015, 58, 898–912. [Google Scholar] [CrossRef]
  9. Munafò, M.; Salvati, L.; Zitti, M. Estimating soil sealing rate at national level-Italy as a case study. Ecol. Indic. 2013, 26, 137–140. [Google Scholar] [CrossRef]
  10. Xiao, R.; Su, S.; Zhang, Z.; Qi, J.; Jiang, D.; Wu, J. Dynamics of soil sealing and soil landscape patterns under rapid urbanization. CATENA 2013, 109, 1–12. [Google Scholar] [CrossRef]
  11. Deng, X.; Zhan, J.; Chen, R. The patterns and driving forces of urban sprawl in China. In Proceedings of the 2005 IEEE International Geoscience and Remote Sensing Symposium, Seoul, Korea, 25–29 July 2005; pp. 1511–1513.
  12. Liu, J.; Zhang, Z.; Xu, X.; Kuang, W.; Zhou, W.; Zhang, S.; Li, R.; Yan, C.; Yu, D.; Wu, S. Spatial patterns and driving forces of land use change in China during the early 21st century. J. Geogr. Sci. 2010, 20, 483–494. [Google Scholar] [CrossRef]
  13. Chen, J. Rapid urbanization in China: A real challenge to soil protection and food security. CATENA 2007, 69, 1–15. [Google Scholar] [CrossRef]
  14. Uuemaa, E.; Roosaare, J.; Kanal, A.; Mander, Ü. Spatial correlograms of soil cover as an indicator of landscape heterogeneity. Ecol. Indic. 2008, 8, 783–794. [Google Scholar] [CrossRef]
  15. Shan, Z. Wang Shixing in Zhejiang Province. Chin. Natl. Geogr. 2012, 1, 1–29. [Google Scholar]
  16. Zhejiang Provincial Bureau of Statistics. Zhejiang Statistical Yearbook; China Statistics Press: Beijing, China, 1991–2014. [Google Scholar]
  17. Soil Survey Office of Zhejiang Province. Zhejiang Soil; Zhejiang Science & Technology Press: Hangzhou, China, 1994. [Google Scholar]
  18. Ditzler, C.A.; Tugel, A.J. Soil quality field tools. Agron. J. 2002, 94, 33–38. [Google Scholar] [CrossRef]
  19. Li, C.; He, Y.; Wang, Y.; Liu, X. Effect of N, P and K fertilizer application on rice grain yield in red paddy soil. Chin. J. Rice Sci. 2007, 21, 179–184. [Google Scholar]
  20. Li, P.; Zhang, T.; Wang, X.; Yu, D. Development of biological soil quality indicator system for subtropical China. Soil Till. Res. 2013, 126, 112–118. [Google Scholar] [CrossRef]
  21. Liao, K.; Xu, S.; Wu, J.; Ji, S.; Lin, Q. Cokriging of soil cation exchange capacity using the first principal component derived from soil physico-chemical properties. Agr. Sci. China 2011, 10, 1246–1253. [Google Scholar] [CrossRef]
  22. Pan, G.; Smith, P.; Pan, W. The role of soil organic matter in maintaining the productivity and yield stability of cereals in China. Agr. Ecosyst. Environ. 2009, 129, 344–348. [Google Scholar] [CrossRef]
  23. Qi, Y.; Darilek, J.L.; Huang, B.; Zhao, Y.; Sun, W.; Gu, Z. Evaluating soil quality indices in an agricultural region of Jiangsu Province, China. Geoderma 2009, 149, 325–334. [Google Scholar] [CrossRef]
  24. Ma, W.; Zhang, M.; Lv, X. Analysis of N, P and K in arable lands of Zhejiang Province. J. Zhejiang Univ. (Agric. Life Sci.) 2012, 38, 71–80. [Google Scholar]
  25. Deng, J.; Qiu, L.; Wang, K.; Yang, H.; Shi, Y. An integrated analysis of urbanization-triggered cropland loss trajectory and implications for sustainable land management. Cities 2011, 28, 127–137. [Google Scholar] [CrossRef]
  26. Zhang, X.; Zhu, X.; Wang, K.; Sheng, Z.; Xu, H.; Ding, X.; Luo, P.; Yu, Z. Evaluation of potential for exploiting arable land in low hilly red soil region in Lanxi based on remote sensing and GIS. Trans. CSAE 2008, 24, 114–118. [Google Scholar]
  27. Deng, J.; Wang, K.; Hong, Y.; Qi, J. Spatio-temporal dynamics and evolution of land use change and landscape pattern in response to rapid urbanization. Landsc. Urban Plan. 2009, 92, 187–198. [Google Scholar] [CrossRef]
  28. Li, J.; Deng, J.; Wang, K.; Li, J.; Huang, T.; Lin, Y.; Yu, H. Spatiotemporal patterns of urbanization in a developed region of eastern coastal China. Sustainability 2014, 6, 4042–4058. [Google Scholar] [CrossRef]
  29. Su, S.; Xiao, R.; Jiang, Z.; Zhang, Y. Characterizing landscape pattern and ecosystem service value changes for urbanization impacts at an eco-regional scale. Appl. Geogr. 2012, 34, 295–305. [Google Scholar] [CrossRef]
  30. Pandey, A.C.; Kumar, A.; Jeyaseelan, A. Urban built-up area assessment of Ranchi township using cartosat-i stereopairs satellite images. J. Indian Soc. Remote. Sens. 2013, 41, 141–155. [Google Scholar] [CrossRef]
  31. Wei, Y.D.; Ye, X. Regional inequality in China: A case study of Zhejiang Province. Tijdschr. Econ. Soc. Geogr. 2004, 95, 44–60. [Google Scholar] [CrossRef]
  32. Li, Z.; Zhang, T.; Chen, B. Changes in organic carbon and nutrient contents of highly productive paddy soils in Yujiang County of Jiangxi Province, China and their environmental application. Agri. Sci. China 2006, 5, 522–529. [Google Scholar] [CrossRef]
  33. Pan, X.; Zhao, Q. Measurement of urbanization process and the paddy soil loss in Yixing city, China between 1949 and 2000. CATENA 2007, 69, 65–73. [Google Scholar] [CrossRef]
  34. Su, S.; Zhang, Q.; Zhang, Z.; Zhi, J.; Wu, J. Rural settlement expansion and paddy soil loss across an ex-urbanizing watershed in eastern coastal China during market transition. Reg. Environ. Chang. 2011, 11, 651–662. [Google Scholar] [CrossRef]
  35. Zhang, W.W.; Wang, W.; Li, X.W.; Ye, F.Z. Economic development and farmland protection: An assessment of rewarded land conversion quotas trading in Zhejiang, China. Land Use Policy 2014, 38, 467–476. [Google Scholar] [CrossRef]
  36. Weng, Y. Spatiotemporal changes of landscape pattern in response to urbanization. Landsc. Urban Plan. 2007, 81, 341–353. [Google Scholar] [CrossRef]
  37. Shi, Z.; Wang, R.; Huang, M.X.; Landgraf, D. Detection of coastal saline land uses with multi-temporal Landsat images in Shangyu city, China. Environ. Manag. 2002, 30, 142–150. [Google Scholar] [CrossRef] [PubMed]
  38. Zhang, H.; Li, J.; Niu, D. Study on spatial optimization allocation of land use in the typical red soil hilly region in south China. Acta. Geogr. Sin. 2003, 58, 668–676. [Google Scholar]
  39. Imhoff, M.L.; Lawrence, W.T.; Elvidge, C.D.; Paul, T.; Levine, E.; Privalsky, M.V.; Brown, V. Using nighttime DMSP/OLS images of city lights to estimate the impact of urban land use on soil resources in the United States. Remote. Sens. Environ. 1997, 59, 105–117. [Google Scholar] [CrossRef]
  40. Skinner, M.W.; Kuhn, R.G.; Joseph, A.E. Agricultural land protection in China: A case study of local governance in Zhejiang Province. Land Use Policy 2001, 18, 329–340. [Google Scholar] [CrossRef]
  41. Zhong, T.; Mitchell, B.; Huang, X. Success or failure: Evaluating the implementation of China’s national general land use plan (1997–2010). Habitat. Int. 2014, 44, 93–101. [Google Scholar] [CrossRef]
  42. Franczyk, J.; Chang, H. The effects of climate change and urbanization on the runoff of the Rock Creek basin in the Portland metropolitan area, Oregon, USA. Hydrol. Process. 2009, 23, 805–815. [Google Scholar] [CrossRef]
  43. Yeh, C.T.; Huang, S. Investigating spatiotemporal patterns of landscape diversity in response to urbanization. Landsc. Urban Plan. 2009, 93, 151–162. [Google Scholar] [CrossRef]
  44. Crist, M.R.; Wilmer, B.; Aplet, G.H. Assessing the value of roadless areas in a conservation reserve strategy: Biodiversity and landscape connectivity in the northern Rockies. J. Appl. Ecol. 2005, 42, 181–191. [Google Scholar] [CrossRef]
  45. Wu, J.; Jenerette, G.D.; Buyantuyev, A.; Redman, C.L. Quantifying spatiotemporal patterns of urbanization: The case of the two fastest growing metropolitan regions in the United States. Ecol. Complex. 2011, 8, 1–8. [Google Scholar] [CrossRef]
  46. IUSS Working Group WRB. World Reference Base for Soil Resources 2014; World Soil Resources Reports No.106; FAO: Rome, Italy, 2014. [Google Scholar]
  47. Zhi, J.; Jing, C.; Lin, S.; Zhang, C.; Wu, J. Estimates of soil organic carbon stocks in Zhejiang Province of China based on 1:50 000 soil database using the PKB method. Pedosphere 2015, 25, 12–24. [Google Scholar] [CrossRef]

