1. Introduction
Empirical-, rather than scientifically-justified application of nitrogen (N) fertilizers in various soil conditions was a management reality in Greek farming lands for over forty years. The consequent increasing phenomena of nitrate infiltration to the aquifer led agronomic authorities to take measures against nitrate mitigation and deliver action plans regarding the reduction of nitrate groundwater pollution [
1]. Under this context, it is of great importance to look thoroughly into fertilizing plans that comply with certain environmental conditions. These conditions are space and time dependent; making it obvious that parameters, like soil, climate and agronomic practices, should count in every fertilizing plan. Indeed, a successful nitrogen management is one in which the key processes to optimize profitability and environmental protection can be identified, characterized and managed at the appropriate locations and times.
Site-specific nitrogen management (SSNM) refers to the predetermination of appropriate, in terms of space and time, nitrogen prescriptions; in order to increase nitrogen use efficiency and diminish adverse environmental effects [
2]. In intensive farming systems, predicting site-specific N requirements is rather difficult, as processes influencing nitrogen kinetics in soil substrate, like plant uptake, mineralization, immobilization, denitrification, leaching and others, interact in complex ways [
3]. Moreover, as soil and weather conditions, tillage practices and the dynamics of crop growth influence various components of the N-cycle, the complexity of controlling nitrogen rises [
4].
As mentioned, there is a demand for the development, calibration and validation of fast-working tools that can assess N fertilizing demands that do not burden the environment with nitrate concentrations in groundwater resources. Various simulation models have been developed and evaluated in the field of nitrogen management [
5]. Many of them have been also linked with spatial modules, enabling fertilizing zone mapping [
6,
7]. The majority of these models require a plethora of data, which in many cases are not easily retrieved. Moreover, their evaluation procedure requires specific knowledge and can be regarded as demanding and complex in terms of computer handling skills.
A crucial component of SSNM is spatial analysis realized through the use of geographical information systems (GIS). Agricultural management interacts with environmental parameters and natural resources that have an obvious spatial character, and hence, GIS are crucial in enhancing agriculture production, especially with reference to field fertilizer application [
8]. In most studies, GIS are usually employed to process model inputs and to visualize results. In order to solve more sophisticated and special problems, like that of fertilizing management, enhanced spatial modelling is needed, in the form of integrated spatial models, which ought to couple and integrate GIS with robust decision methodologies. In classical GIS modelling, multiclass maps are usually converted into binary predication patterns, in which crisp boundaries between areas are assumed. Reality though never involves precise and certain boundaries. As stated in [
9] from the cybernetics point of view, nitrogen management is a typical “control situation under uncertainty”. Furthermore, from the environmental point of view, the nitrogen cycle is typically surrounded by vagueness and inherent uncertainties, as it involves many physicochemical processes and parameters, which are difficult enough to be modelled under the sharp limits of a mathematically crisp logic. Fuzzy logic is a serious candidate for supporting decisions in environmental phenomena, as it introduces subjectivity and vagueness in an analysis and for this reason is incorporated into the present study. Various research works reveal the effectiveness of fuzzy theory in decision problems concerning fertilizing crops [
10,
11].
The objective of this study is to systemize and automate the methodological steps needed towards the identification and map production of discrete nitrogen fertilizing zones for cotton crop. Further, through the design, development and application of a spatial decision support model, we aim to demonstrate that GIS and fuzzy theory can be of valuable help for decision makers in order to delineate agricultural areas according to their actual fertilization needs complying with SSNM. It is envisaged that the development of such a spatial tool will be of valuable help for external agronomic services towards prescribing accurate site-specific fertilizing guidelines, benefiting the producers and the environment.
3. Results and Discussion
The fuzzy methodological approach followed concerned two discrete steps. Firstly, the raster datasets were converted into fuzzy evidence maps via specific membership functions, which transformed raw data into fuzzy sets having values between zero and one. Regarding categorical raster layers, those underwent reclassification in order to gain values at the range of zero to one.
The choice of membership functions for fuzzifying all parameters involved in the two models was based on the semantic import model [
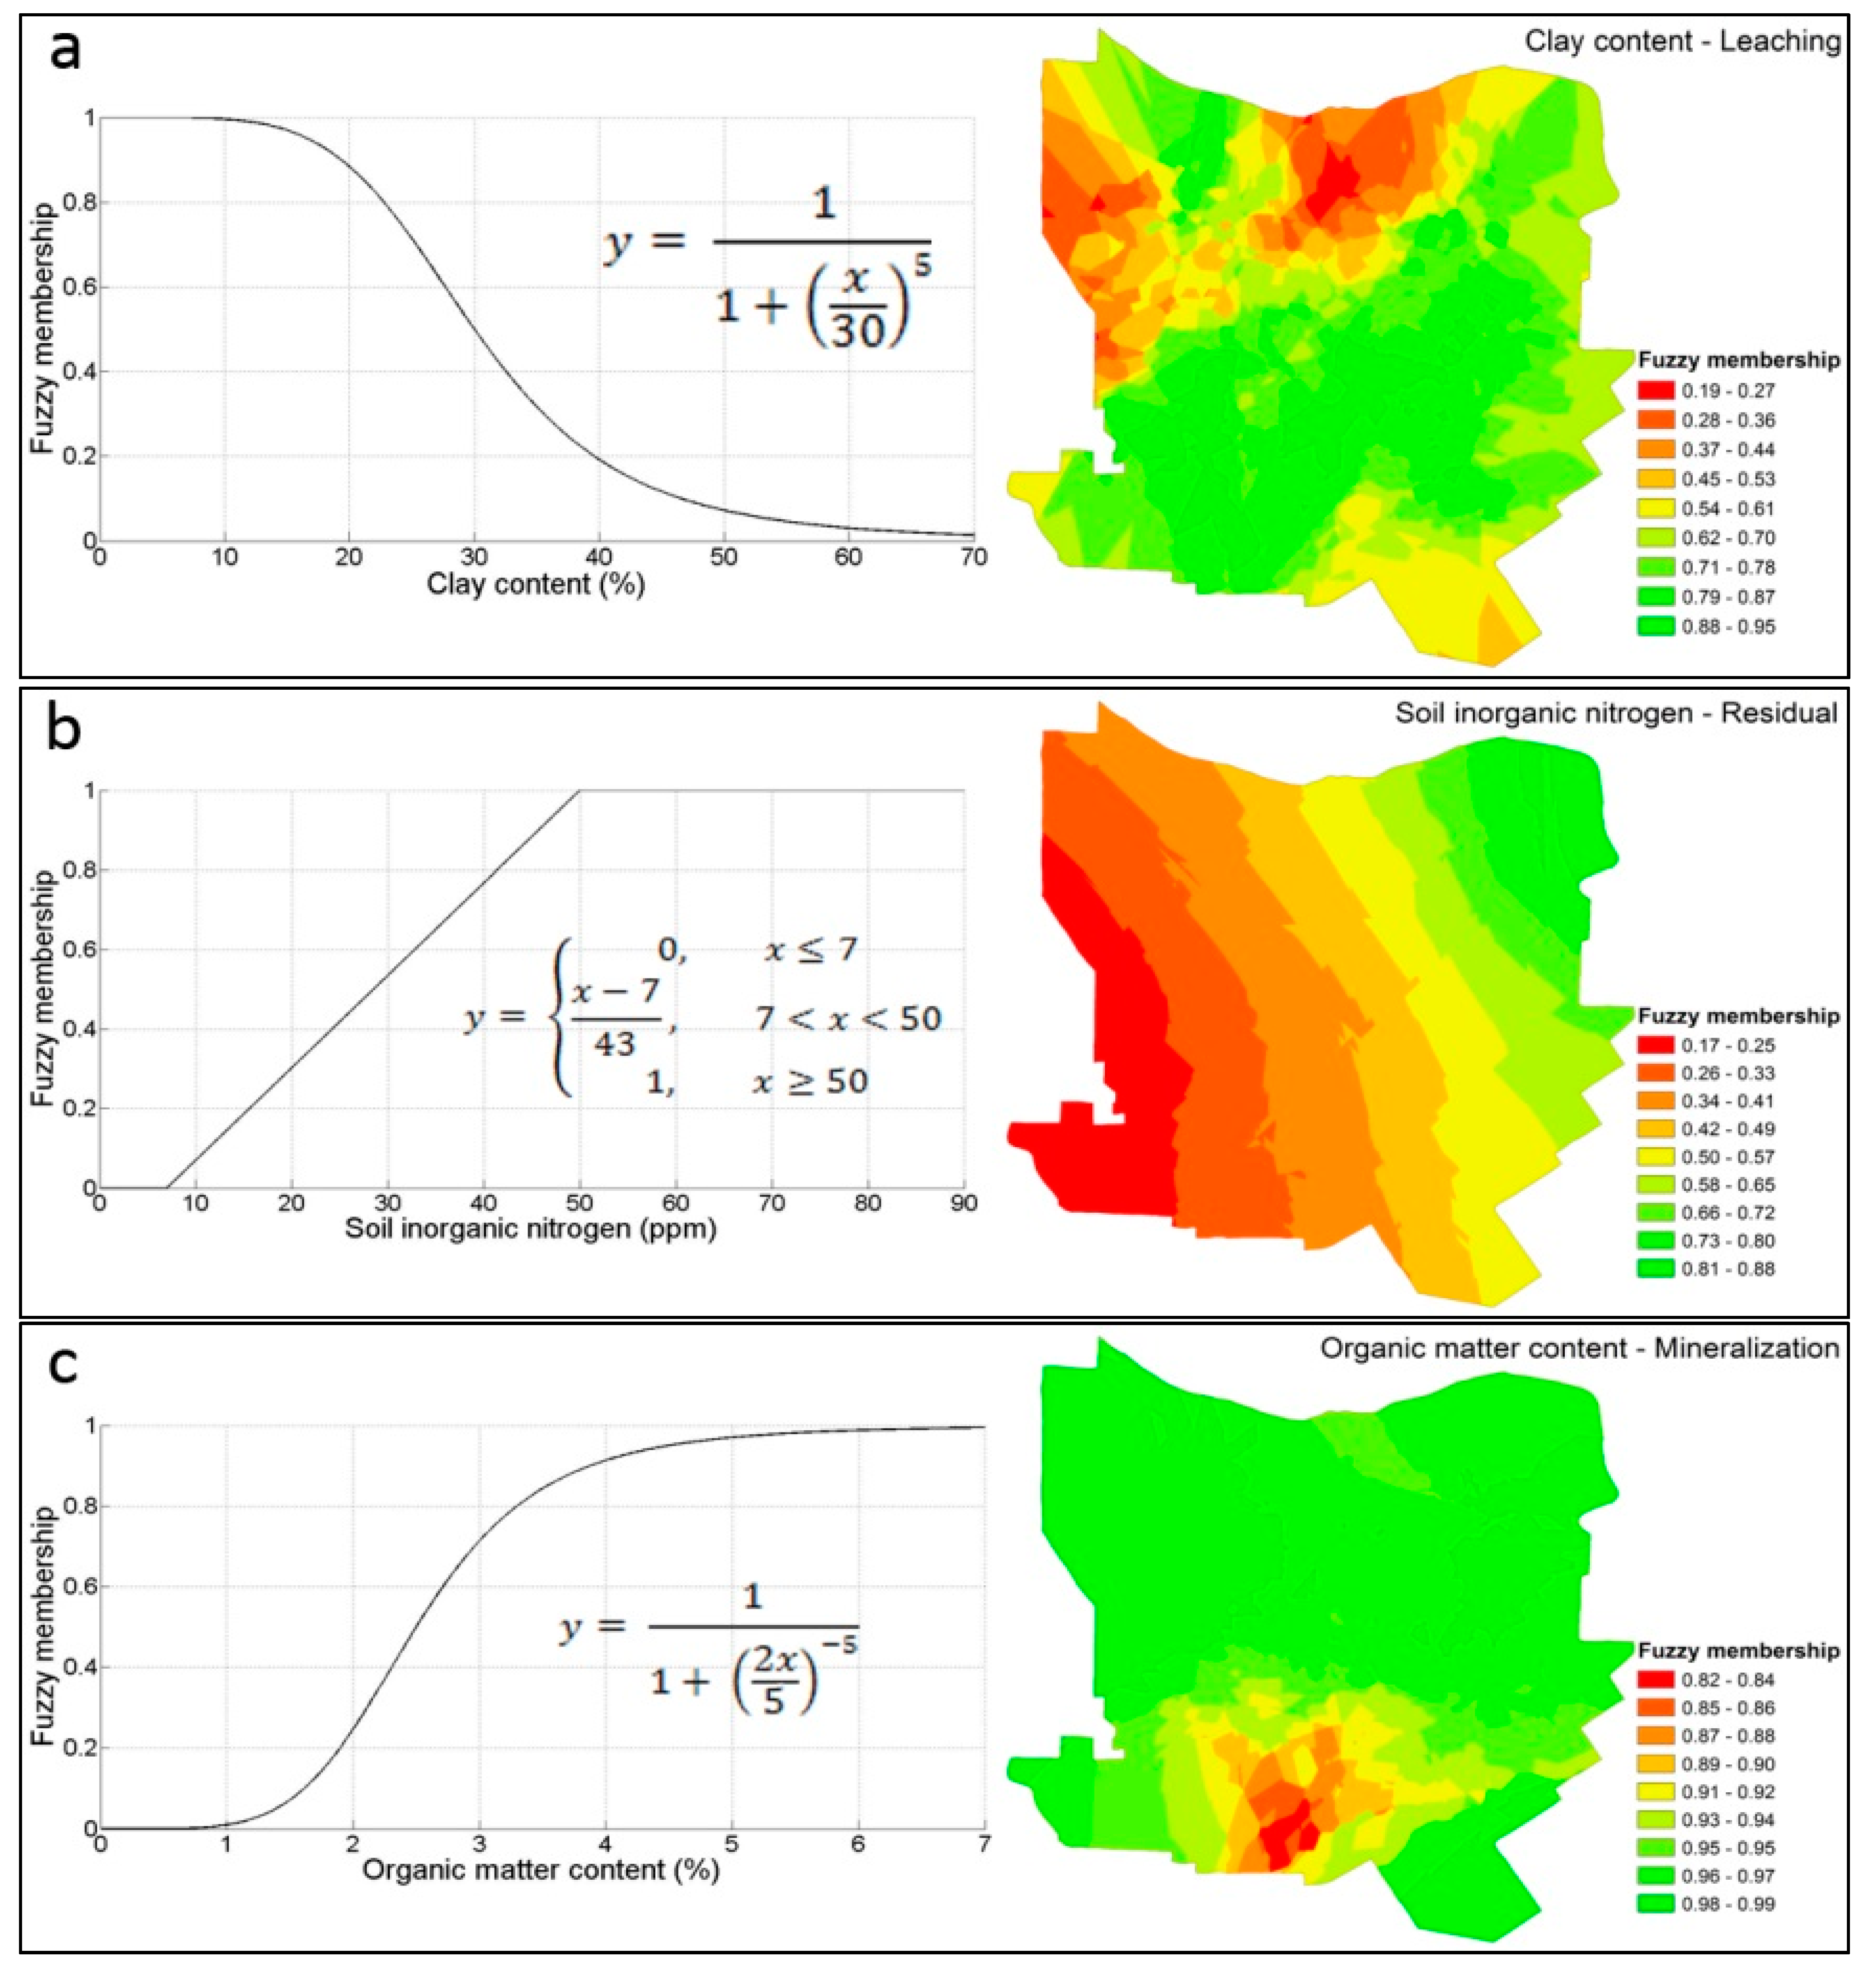
17]. Accordingly, the specific membership functions used to “map” each parameter’s range value to zero to one space were directed by the effect that each parameter had on the controlling process. Indicative membership functions used in each module are presented in
Figure 5a–e. At the left side of the figures, the mathematical equations and the corresponding graphs are presented, while at the right column, the mapping results of the fuzzification procedure are cited.
At this modelling stage, GIS layout capabilities offer representations of the degree of contribution each input variable has on nitrogen balance parameters along with their spatial distribution across the study area. The color symbology presents the membership grading that a state variable has on each nitrogen balance parameter. In
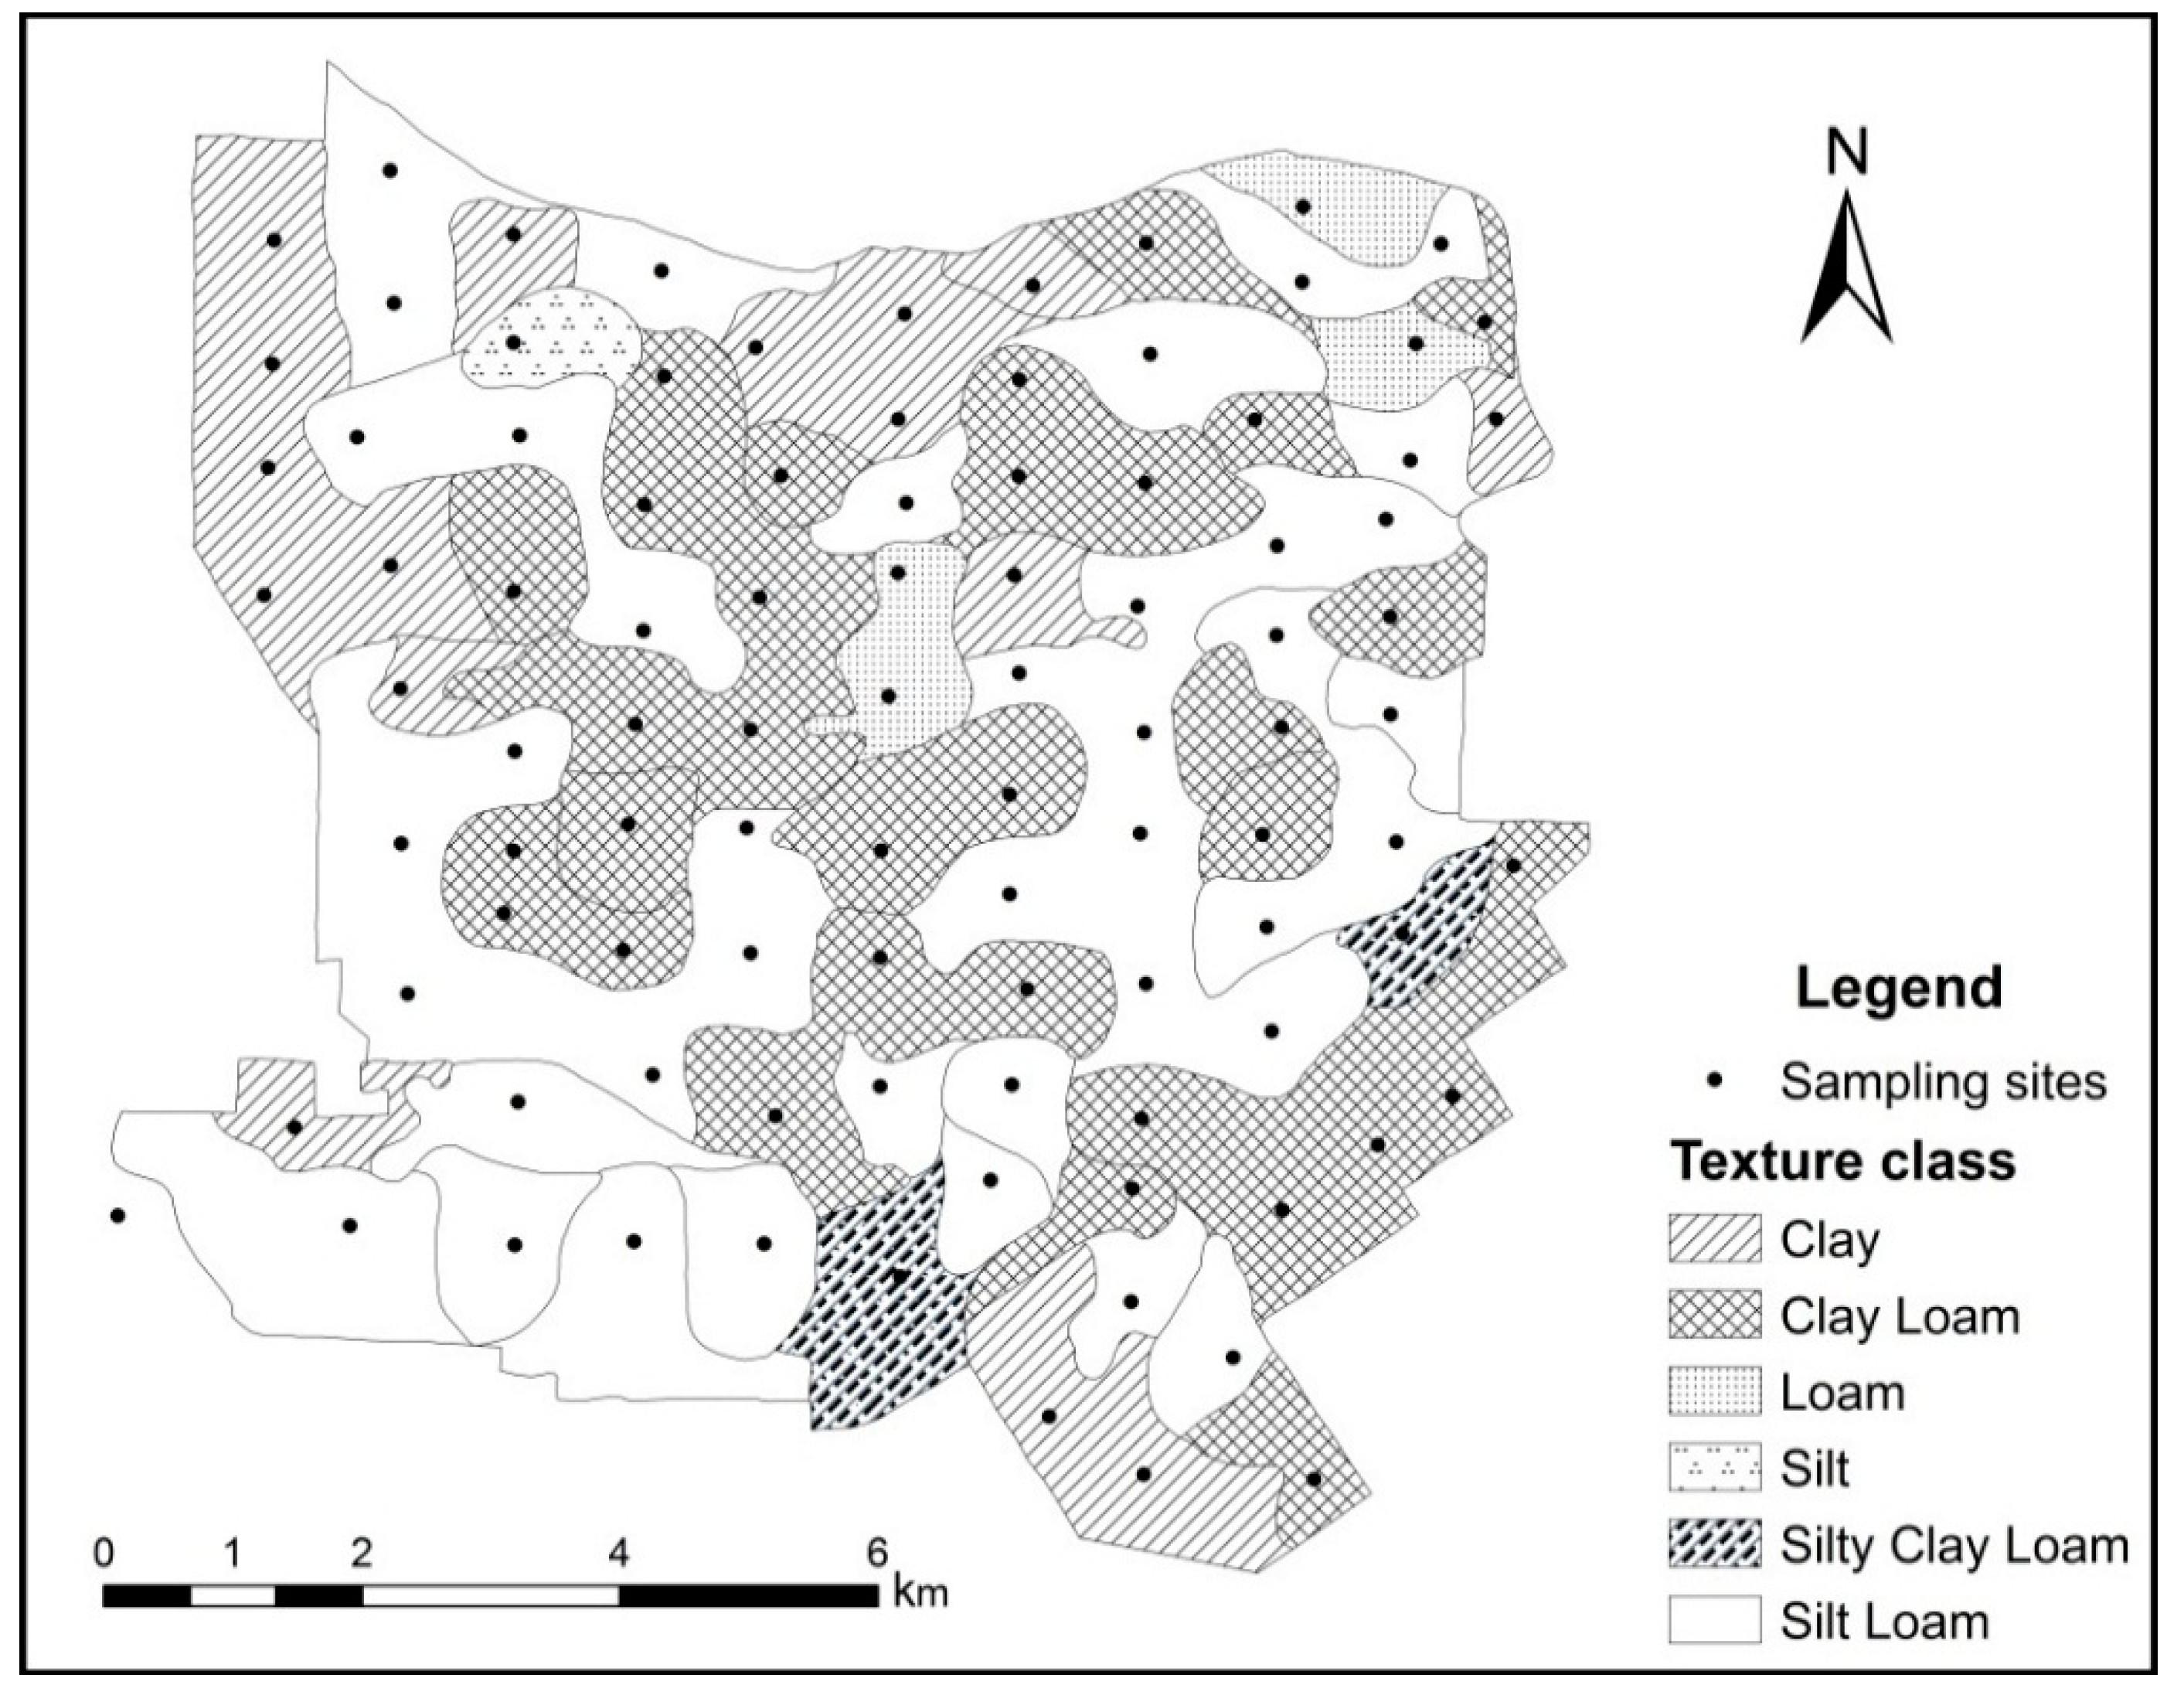
Figure 5a, low clay content values, as presented by the soil types in
Figure 3, are linked to high membership values of leaching potential, which are symbolized with green colors in the map at the right column. Further, the relationship between residual nitrogen and inorganic nitrogen concentration in soil was ascribed with a linear function positively sloped (
Figure 5b), translating that high inorganic N in soil directly leads to increased residual nitrogen values. In addition, nitrogen mineralization, which is considered as an input process to the soil system, is partially affected by organic matter content in a positive way, meaning that high organic matter values with a low C/N ratio advance mineralization, enriching soil with nitrogen inorganic forms. In this case, a sigmoidal function, in which the larger the values of organic matter, the more likely the referenced sites are to be members of the “large” mineralization set, was applied (
Figure 5c). Moreover, when full membership to a fuzzy set ranged between a specific value, a Gaussian or a triangular function was used. In this case, regarding the mineralization “large” set, sites with soil pH around neutral or slightly alkaline would have high (near one) membership values (
Figure 5d). Nitrogen mineralization is a rather complex process concerning various inaccuracies stemming from soil characteristics and is usually quantified through deterministic models [
21,
22]. In the present study, the fuzzification scheme used allows a more structured way of dealing with such uncertainties through the partial inclusion (membership) in one or more linguistic sets. In
Figure 5e, another linear function is presented mapping the effect of yield potential in plant nitrogen uptake. Sites with high yield potential are more likely to provide more nitrogen compounds to cotton plants, given the weather and soil conditions, increasing nitrogen plant uptake, meaning extra losses from the soil system. Triangular-shaped functions are characterized by their simplicity and their ability to simulate every other non-triangular function [
23] and, hence, were integrated into the methodology followed.
Figure 5.
Fuzzy membership functions coupled with GIS mapping representations in the study area, concerning various inputs and nitrogen balance parameters of the system. Red to green color implies stronger membership of the fuzzified variable to the modelled balance parameter. (a) Clay content-Leaching potential; (b) Soil inorganic nitrogen-Residual nitrogen; (c) Organic matter content-Mineralization; (d) Soil acidity-Denitrification; (e) Yield potential-Nitrogen uptake.
The fuzzy overlay operator used in the levels of the two modules was “AND”. The linguistic interpretation of a fuzzy operator is related to the specific decision problem and the fuzzy inference procedure in use. Additionally, the choice of the proper connecting fuzzy operators can be evaluated and altered
a posteriori after successive implementations of a fuzzy system. In the present study, the ascription of the logical operator “AND” is fulfilled through the minimum function, which responds to the intersection of fuzzy sets [
24]. In general, the intersection of fuzzy sets (“AND” operator) is most commonly used in a fuzzy rule-based evaluation. Intersection accounts for the compatibility between two or more fuzzy sets and their range values in order to ascribe truth membership values. The minimum value of these values determines the degree that these sets are being intersected [
25]. Except for the “AND” operator, during the development of the system, various weighted operators were tested, like “SUM”, “PRODUCT” and “GAMMA”. However, these operators tended to balance and diminish various differentiations in raw and intermediate data, resulting in homogeneous spatial patterns.
Mostly, model-oriented research on simulating nitrogen balance that proposes fertilizing rates and prescriptions is based on existing or modified simulation models, which are usually evaluated and validated in various study areas concerning a variety of crop, soil and weather conditions. The majority of such studies compares model simulations with experimental field results with significant findings regarding model usefulness in planning fertilization schemes [
26,
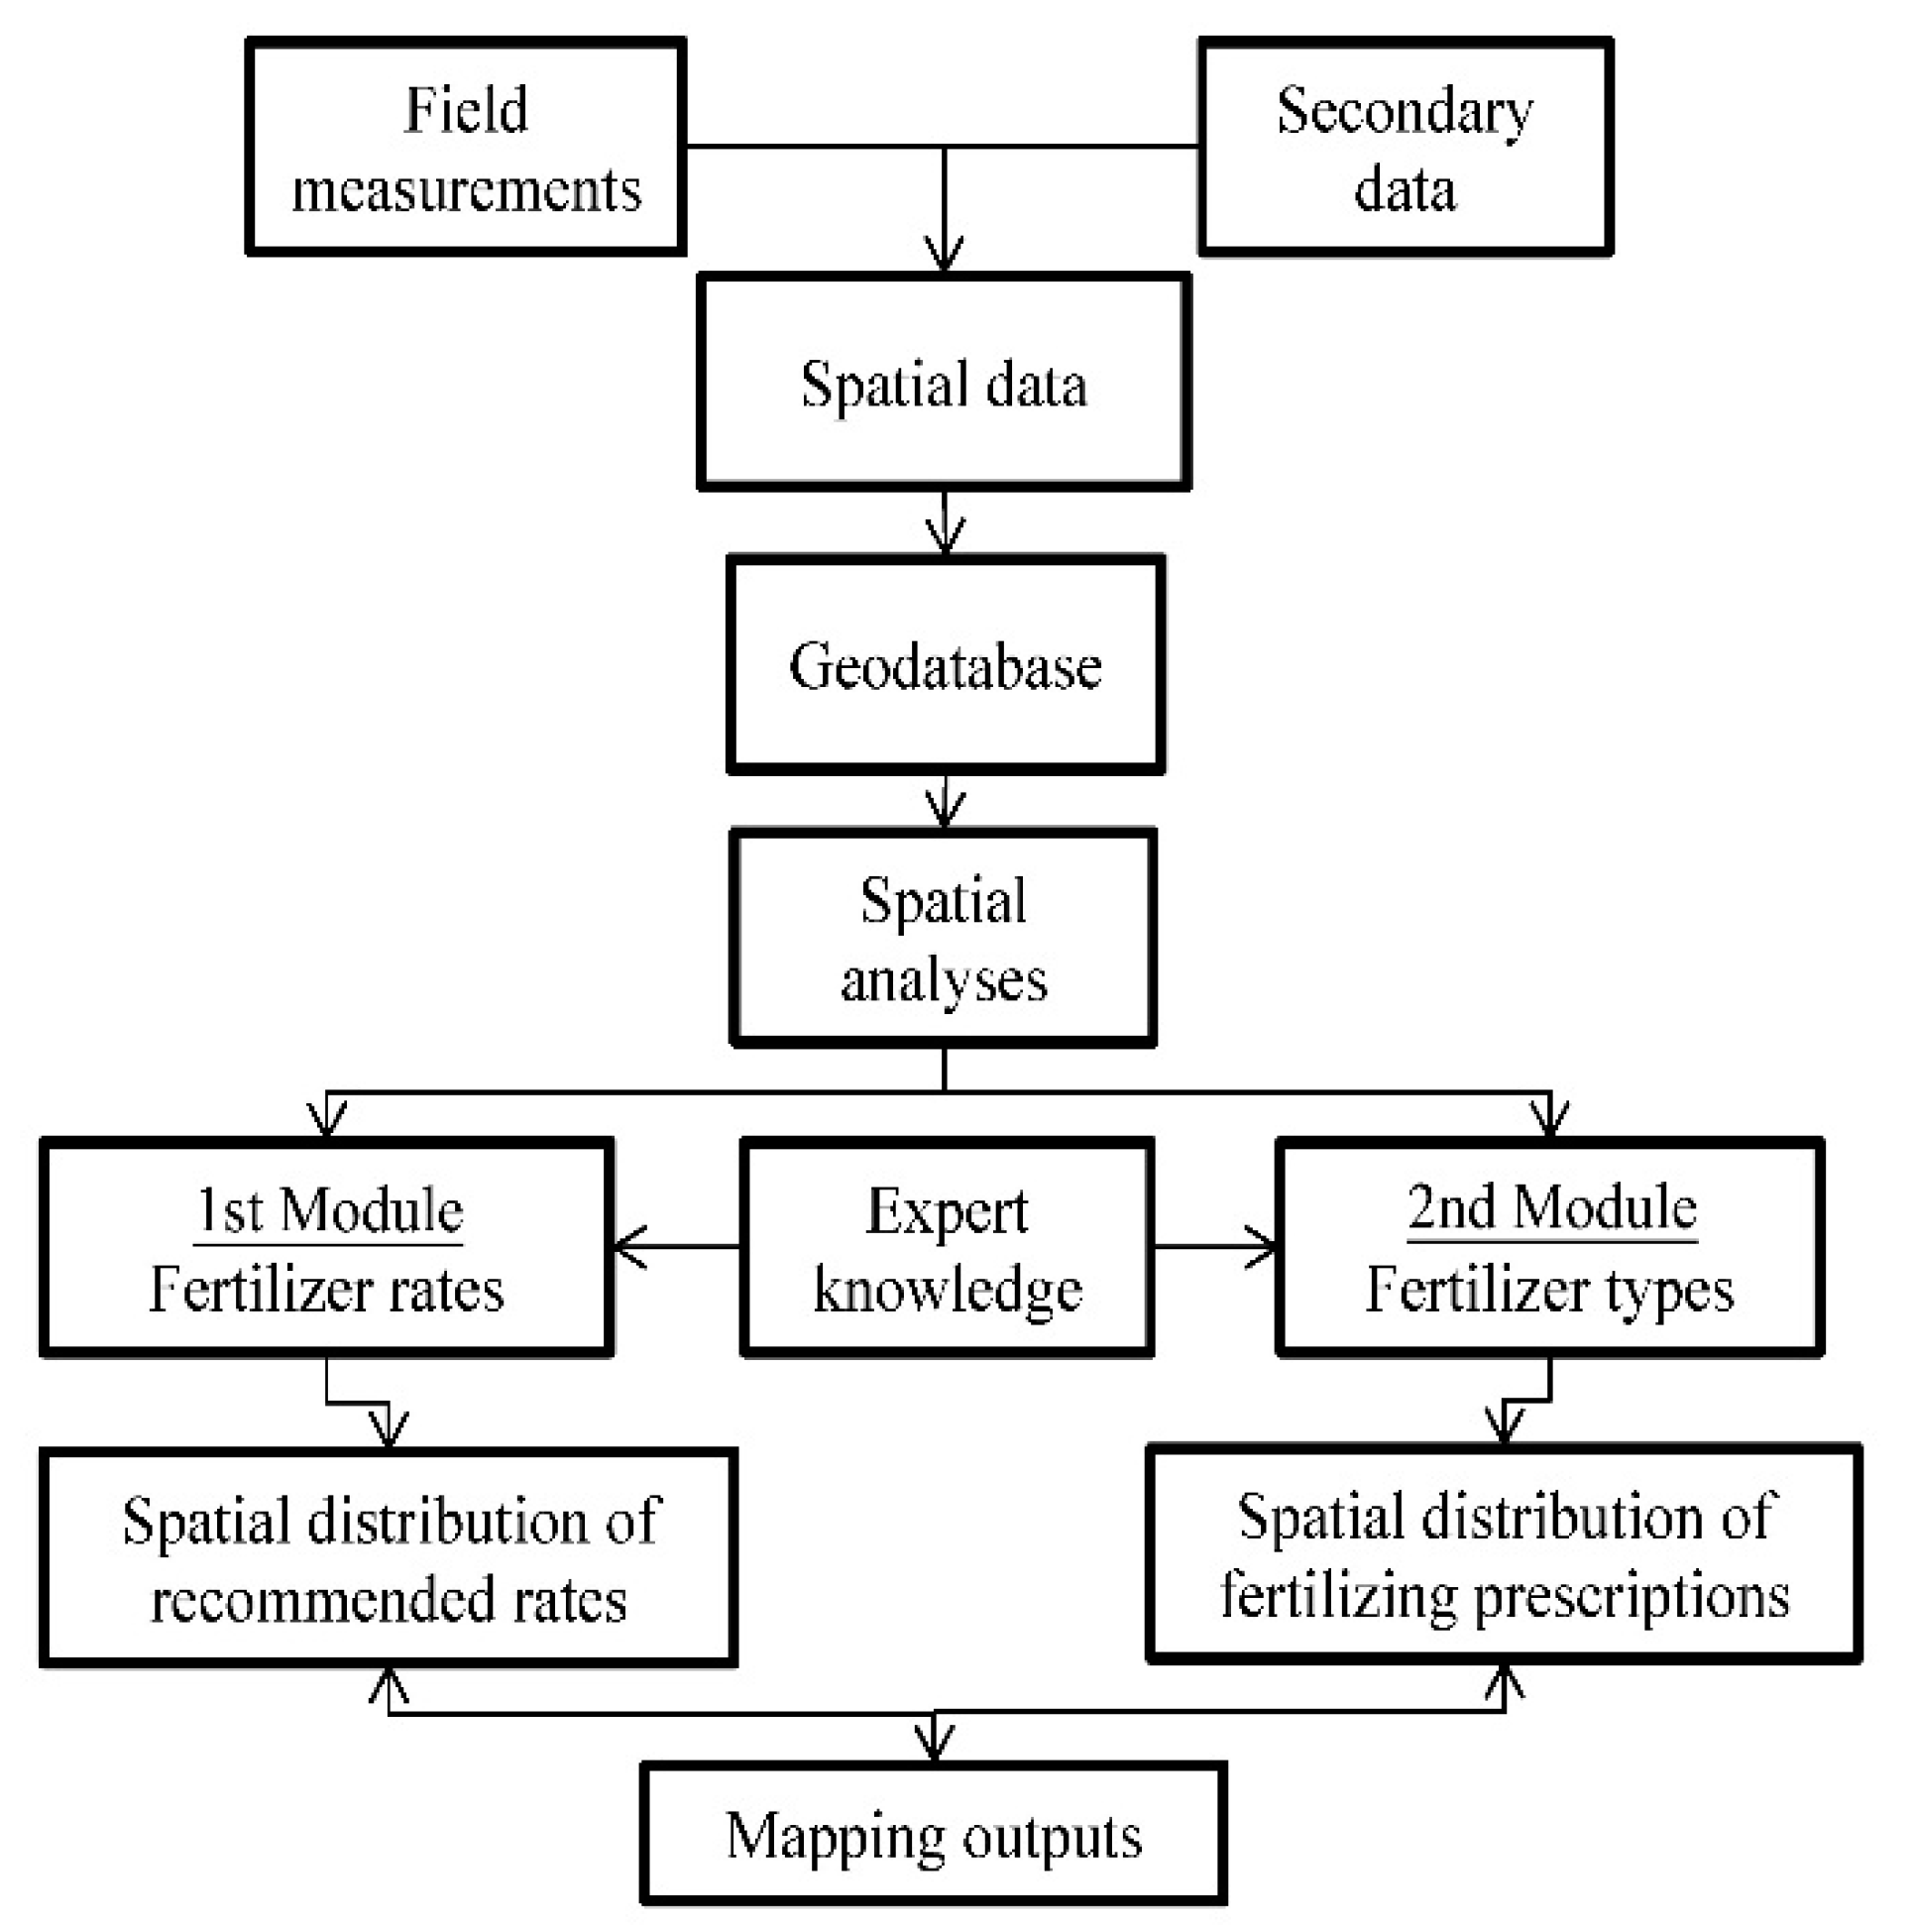
27]. The modules presented here integrate expert knowledge, the elicitation of which was realized through dialogue-based procedures with experts (producers, researchers, academics) in the fields of cotton cultivation and nitrogen fertilizing. System development is overall based on expertise acquisition, which is “translated” via fuzzy logic into fuzzy inference and modelled in a GIS environment with no
in situ experimentation. Through ArcGIS’s model builder environment, the modules’ evaluations are automated by linking data input, GIS tools/functions and final outputs. In other words, all processes can be saved and models can be rerun at any time, which is particularly useful when adjustments have to be made in the analyses. Further all cartographic results of the models (intermediate and final) can be illustrated, making the modelling evaluation a transparent process. This is very helpful at the model development stage, as one can simply change one parameter, rerun the model and see the new results, rather than redoing the entire analysis. Moreover, it enforces the flexibility of the entire system when adaptation and evaluation of the modules to new case studies are involved or when various scenarios are being explored.
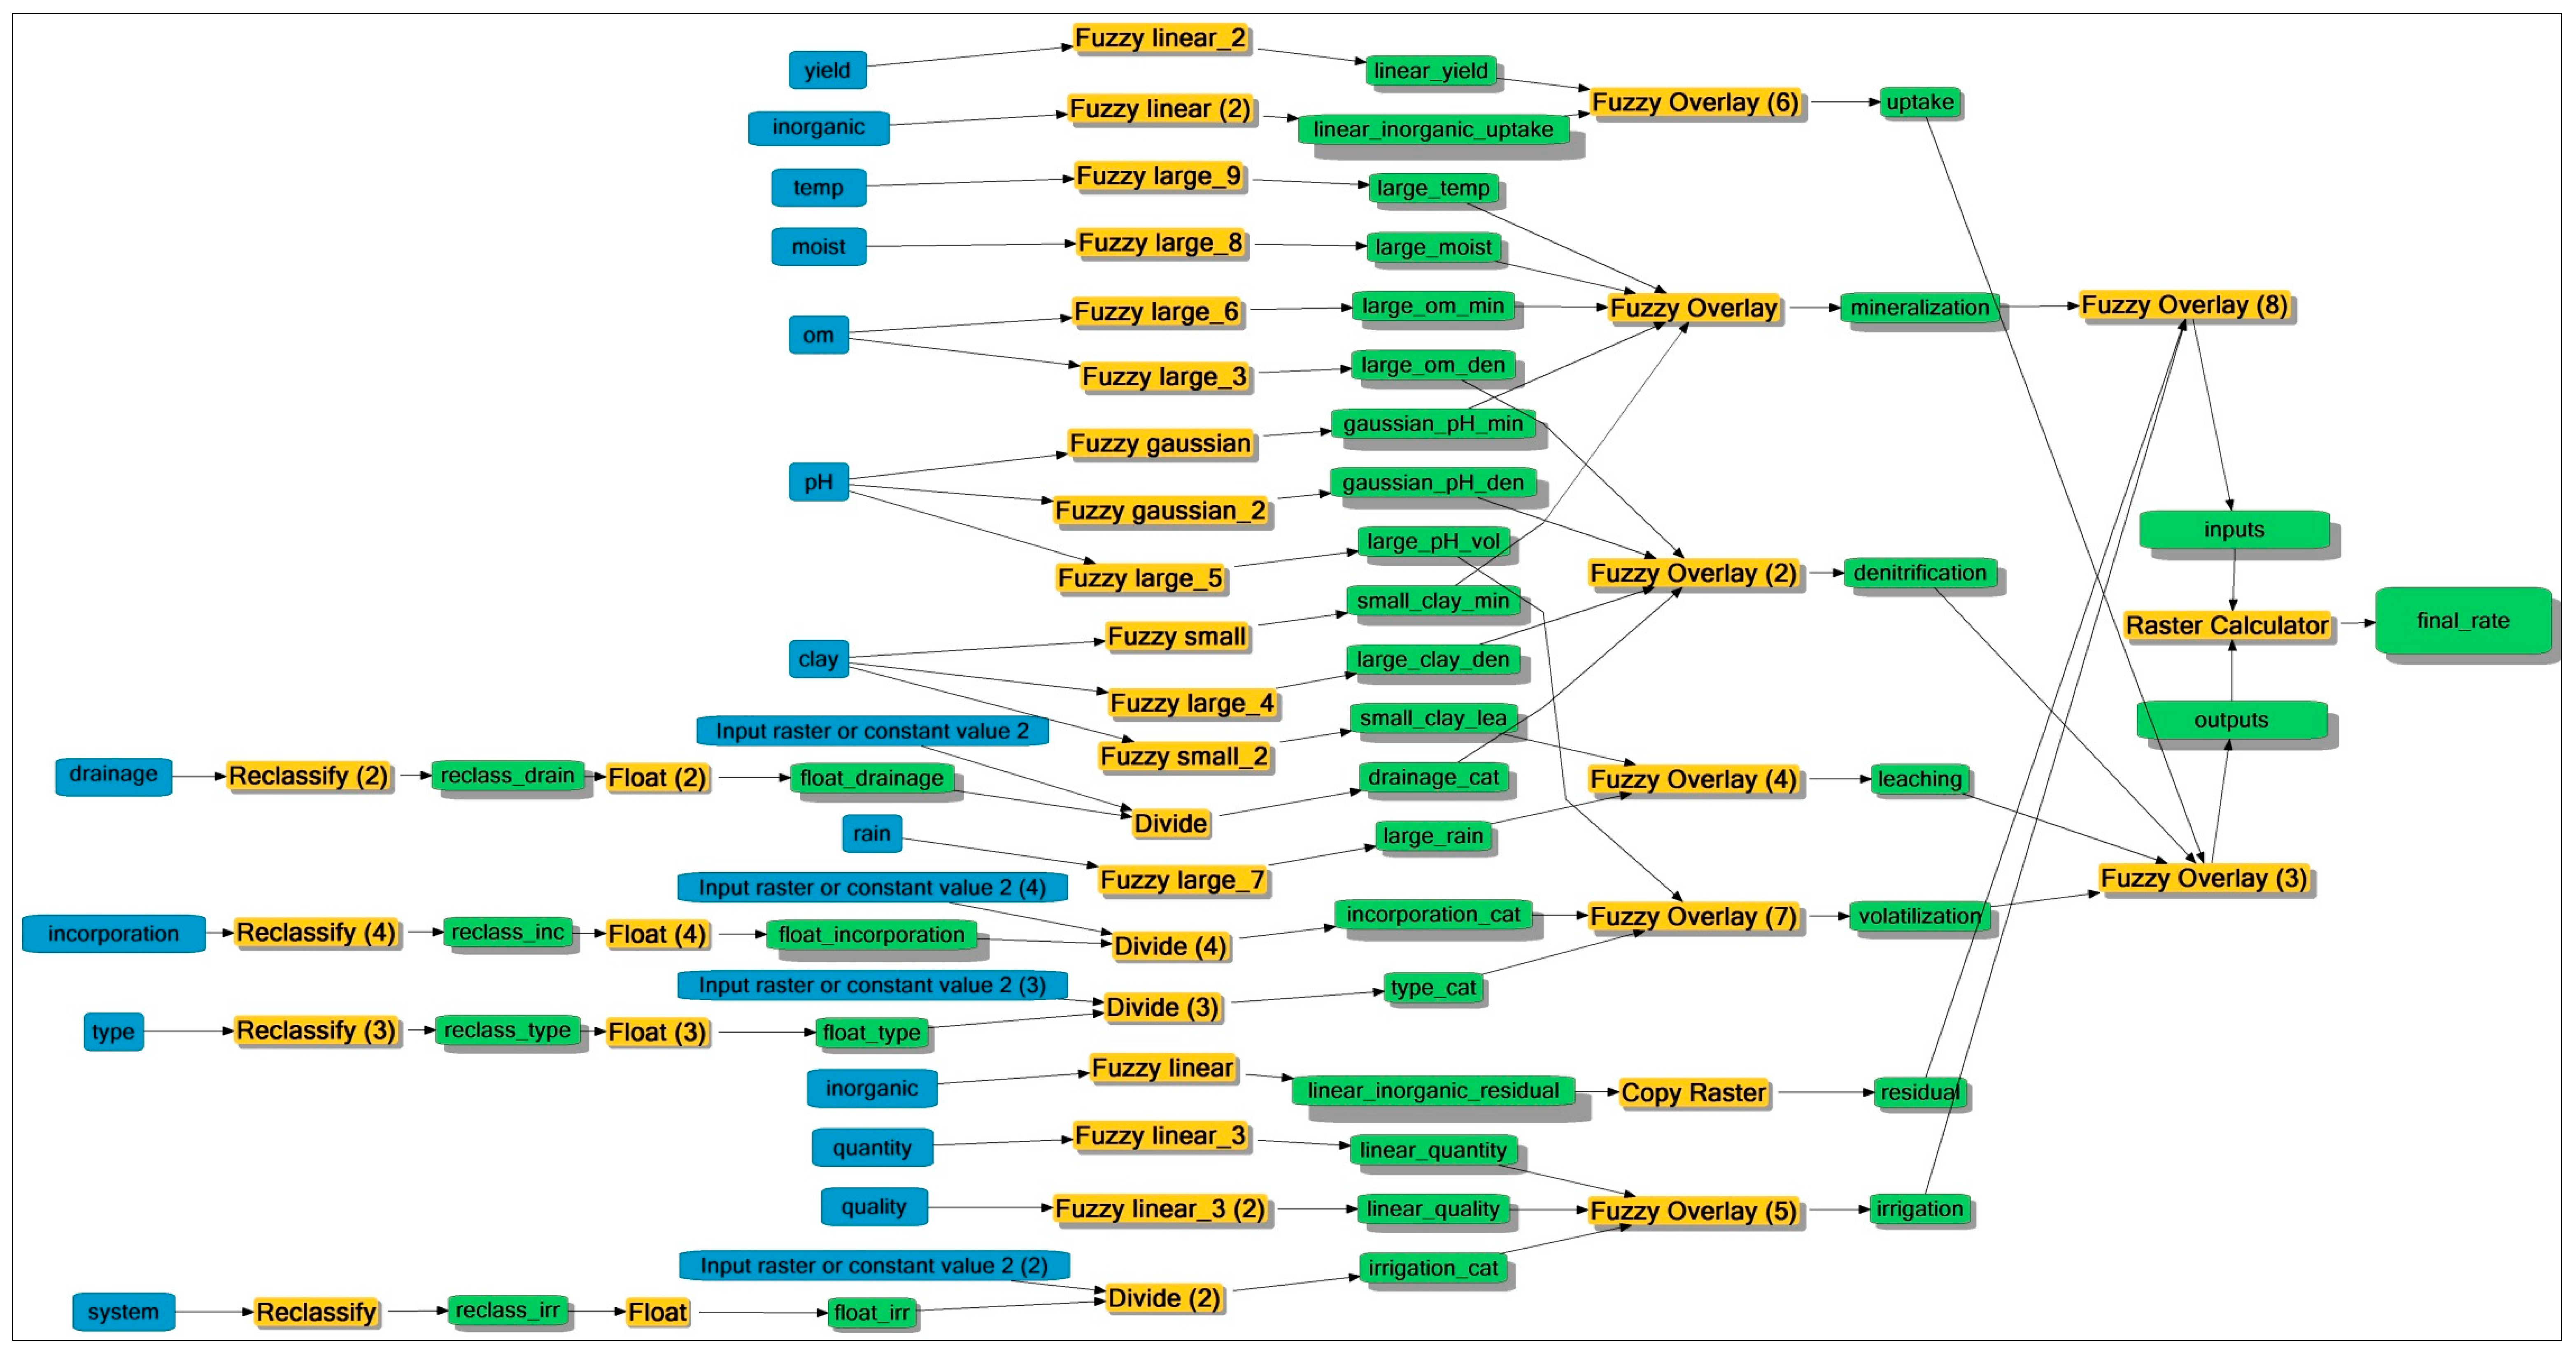
The “fertilizing rate” and “fertilizing type” modules of the system are presented in
Figure 6 and
Figure 7, respectively. In both modules, the containing model elements can be summed into three categories: variables, tools and connectors (ESRI Inc.). Variables are model parameters that hold a specific value or a reference to data stored on disk. In the referenced modules, input variables are depicted in blue color, and derived variables are colored in green. The “tools” elements are the basic building blocks of the modules’ workflows. These geoprocessing tools perform various operations on geographic or tabular data contained in the modules and are presented with yellow rectangles. Lastly, connectors undertake the connection between variables and tools. The connector arrows show the direction of processing, which in
Figure 6 and
Figure 7 is heading from left to right.
Figure 6.
The “fertilizer rate” module presenting the data flow, transformations and final output. Input variables are presented in blue colors, derived variables in green and geoprocessing tools in yellow.
Figure 6.
The “fertilizer rate” module presenting the data flow, transformations and final output. Input variables are presented in blue colors, derived variables in green and geoprocessing tools in yellow.
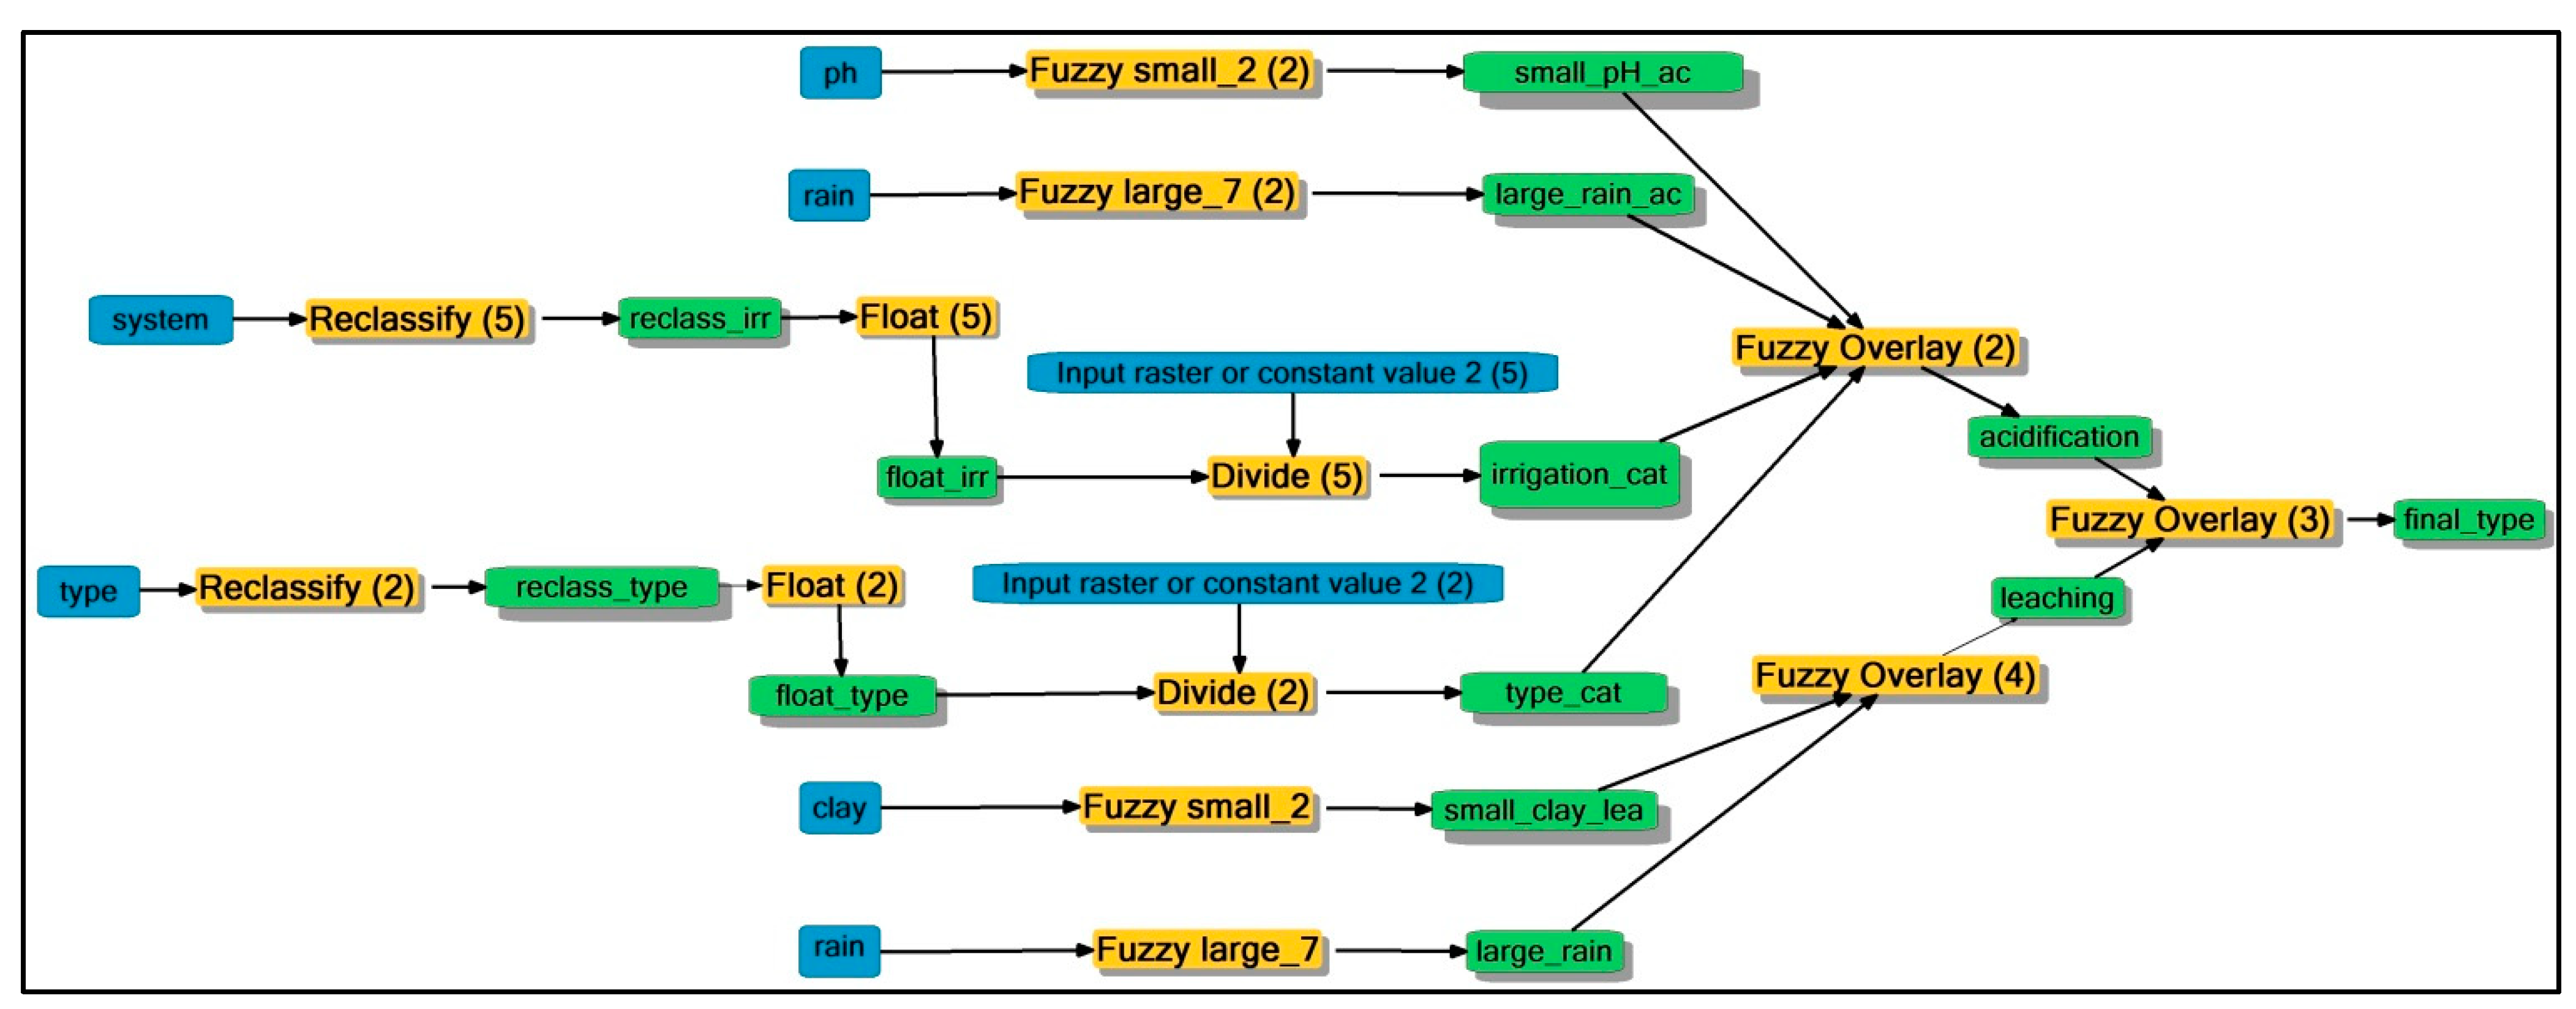
Figure 7.
The “fertilizer type” module in Model Builder view. Input variables are presented in blue colors, derived variables in green and geoprocessing tools in yellow.
Figure 7.
The “fertilizer type” module in Model Builder view. Input variables are presented in blue colors, derived variables in green and geoprocessing tools in yellow.
For the “fertilizing rate” module (
Figure 6), three conceivable levels of data processing can be identified. The first one delivers the conversion of all data into floating-point raster format (floating point raster data store numbers with a decimal portion as the values of each cell) and introduces the fuzzification method of their value ranges. Under this level, continuous variables are directly fuzzified using “fuzzy small”, “fuzzy large”, “fuzzy linear” and “fuzzy Gaussian” membership functions [
28,
29], while categorical data undergo a pre-processing step. This step presupposes the use of reclassification in order to attribute numeric values to string ones (reclassify tool) and to further divide the result by a factor to normalize the output values to be between zero and one (divide tool). The second level performs the fuzzy overlay methodology, which groups the fuzzified parameters into the nitrogen balance factors and, in a further step fuzzy, calculates the nitrogen inputs and outputs. The last level performs the mathematic subtraction between inputs and outputs and yields the final classification of the study area into fertilizing zones. Accordingly, the “fertilizing type” module is composed by two thematic levels (
Figure 7). The first one involves the fuzzification of input parameters and the second their fuzzy overlay. In this case, the final computation of the total risk against soil sustainability is accomplished through the SUM fuzzy operator, aggregating the leaching and acidification risks into an escalating membership value ranging from zero to one.
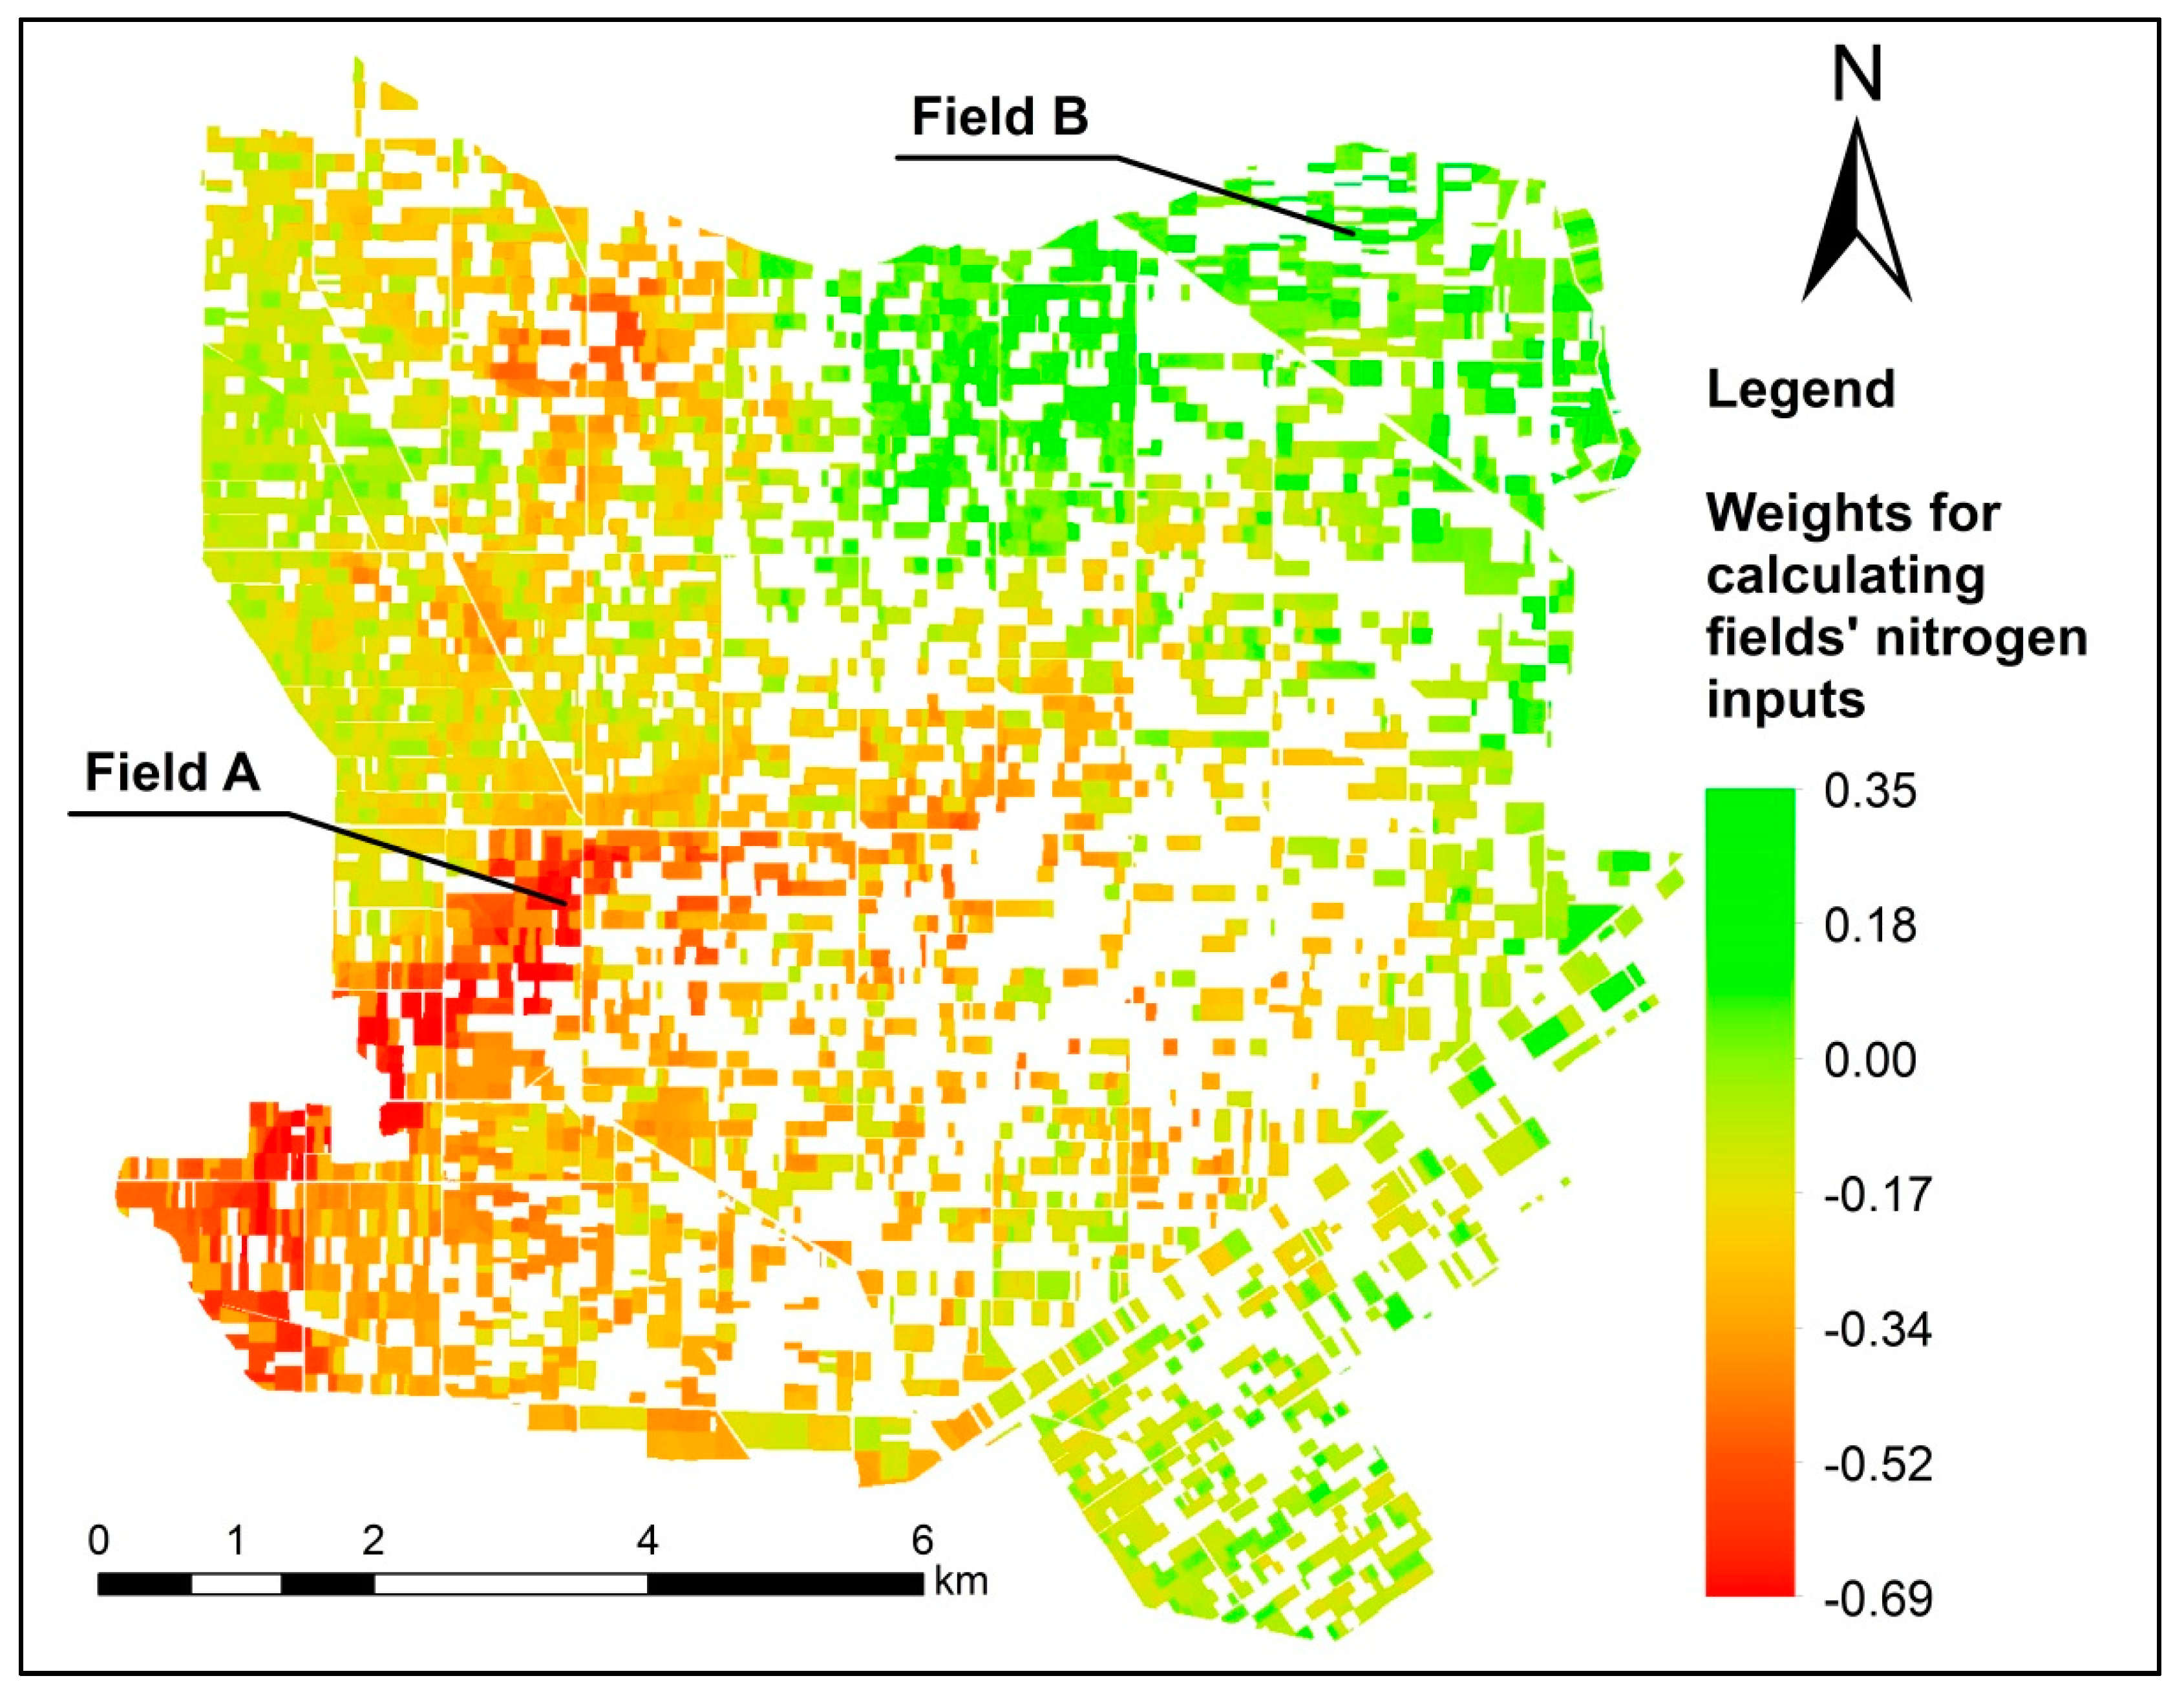
The evaluation of the “fertilizing rate” module in the study area at the beginning of the cotton cultivation period (prior to seeding) produced a classification of the area into continuous values ranging from −0.69 to 0.35 (
Figure 8). The value range involved in the color spectrum originated from the algebraic subtraction of the nitrogen inputs minus the according outputs. According to the module’s results, many sites (yellow to red hues) are attributed with negative values, meaning that for those fields, the outputs of nitrogen equilibrium exceeded the input ones. The area covered by those sites reaches 81.1% of the total area examined. Under the site and time-specific conditions of the respective evaluation of the module, the area under negative membership values needs to be fertilized with nitrogenous fertilizers. The cartographic approach presented offers the per field or even sub-field computation of fertilizing rates by multiplying each pixel value contained in a field with the fertilizing dose that is proposed by the Greek Action Plan for the mitigation of nitrates in water resources of the vulnerable district of Kopaida [
30]. In essence,
Figure 8 grants the study area with a weighting factor under which each producer can calculate his field’s nitrogen needs and further provides a site-specific refinement in previous catchment level fertilizing suggestions, which were presented in the referenced Action Plan. Various research studies have delineated regions into management zones concerning soil fertility indicators using spatio-statistical clustering methods [
31,
32]. Their results indicate that the identification of distinct soil management zones can optimize fertilization scheduling and diminish environmental risks. Management zone delineation in the presented system originates from modelling nitrogen equilibrium using fuzzification and fuzzy overlaying procedures, and it is expert knowledge oriented, rather than data driven. Furthermore, the system is entirely built under GIS software taking advantage of its integrated fuzzy capabilities as a means of managing the integral uncertainty of the environmental phenomena modelled.
Figure 8.
The spatial output of the “fertilizing rate” module.
Figure 8.
The spatial output of the “fertilizing rate” module.
The sites attributed with positive values account for 18.9% of the total examined area, and according to the module’s design and evaluation, the corresponding fields should not need any nitrogen fertilizing inputs prior to or during seeding. However, for those sites, nitrogen fertilization should concern surface applications during the cultivation period adapted to plant needs. The sites needing no or very low fertilizing rates are mainly characterized by high concentrations in inorganic nitrogen, clay particles and organic matter combined with low yield potential. Comparing the characteristics of two fields situated in different parts of the study area, for which the module attributed different weights (
Figure 8), the reasoning of the outcome is revealed. For example, Field A is proposed to be fertilized with rather high amounts of nitrogenous fertilizer (weight factor: −0.65) as opposed to Field B, which is advised not to be fertilized at all (weight factor: 0.30). Indeed, Field A is situated in an area where, according to input data, texture is medium to coarse, soil is well drained, organic matter content is low compared to the average of the area and the levels of inorganic forms of soil nitrogen are also low. These soil conditions favor nitrate leaching, which, in combination with cultivation and irrigation practices, like the absence of fertilizer incorporation and the use of sprinkler irrigation systems, increase nitrogen losses. Consequently, the “fertilizing rate” module fuzzy simulating the relations between those characteristics and the nitrogen balance’s parameters suggests increased fertilizer inputs. On the other hand, in Field B, soil retains more fertile properties in terms of inorganic nitrogen and organic matter content, while the producer uses a drip irrigation system, which reduces nitrate losses. Moreover, the second producer incorporates the applied fertilizer, a practice that diminishes ammonia losses through volatilization. In the case of Field B, the module fuzzy integrates the underlined conditions and proposes minimum fertilizer doses. The aforementioned fields are set two rather extreme cases regarding fertilizing recommendations; however, the module manages to prescribe weighted doses to all cotton fields in the study, through the use of fuzzy inference methodology.
Overall, the results indicate reduced quantities for nitrogen fertilizer applied per unit area, which is consistent not only with fertilizing best practice manuals, but also with the European Commission’s standards for limiting nitrate pollution and for protecting areas within the network “Natura 2000”.
Figure 9.
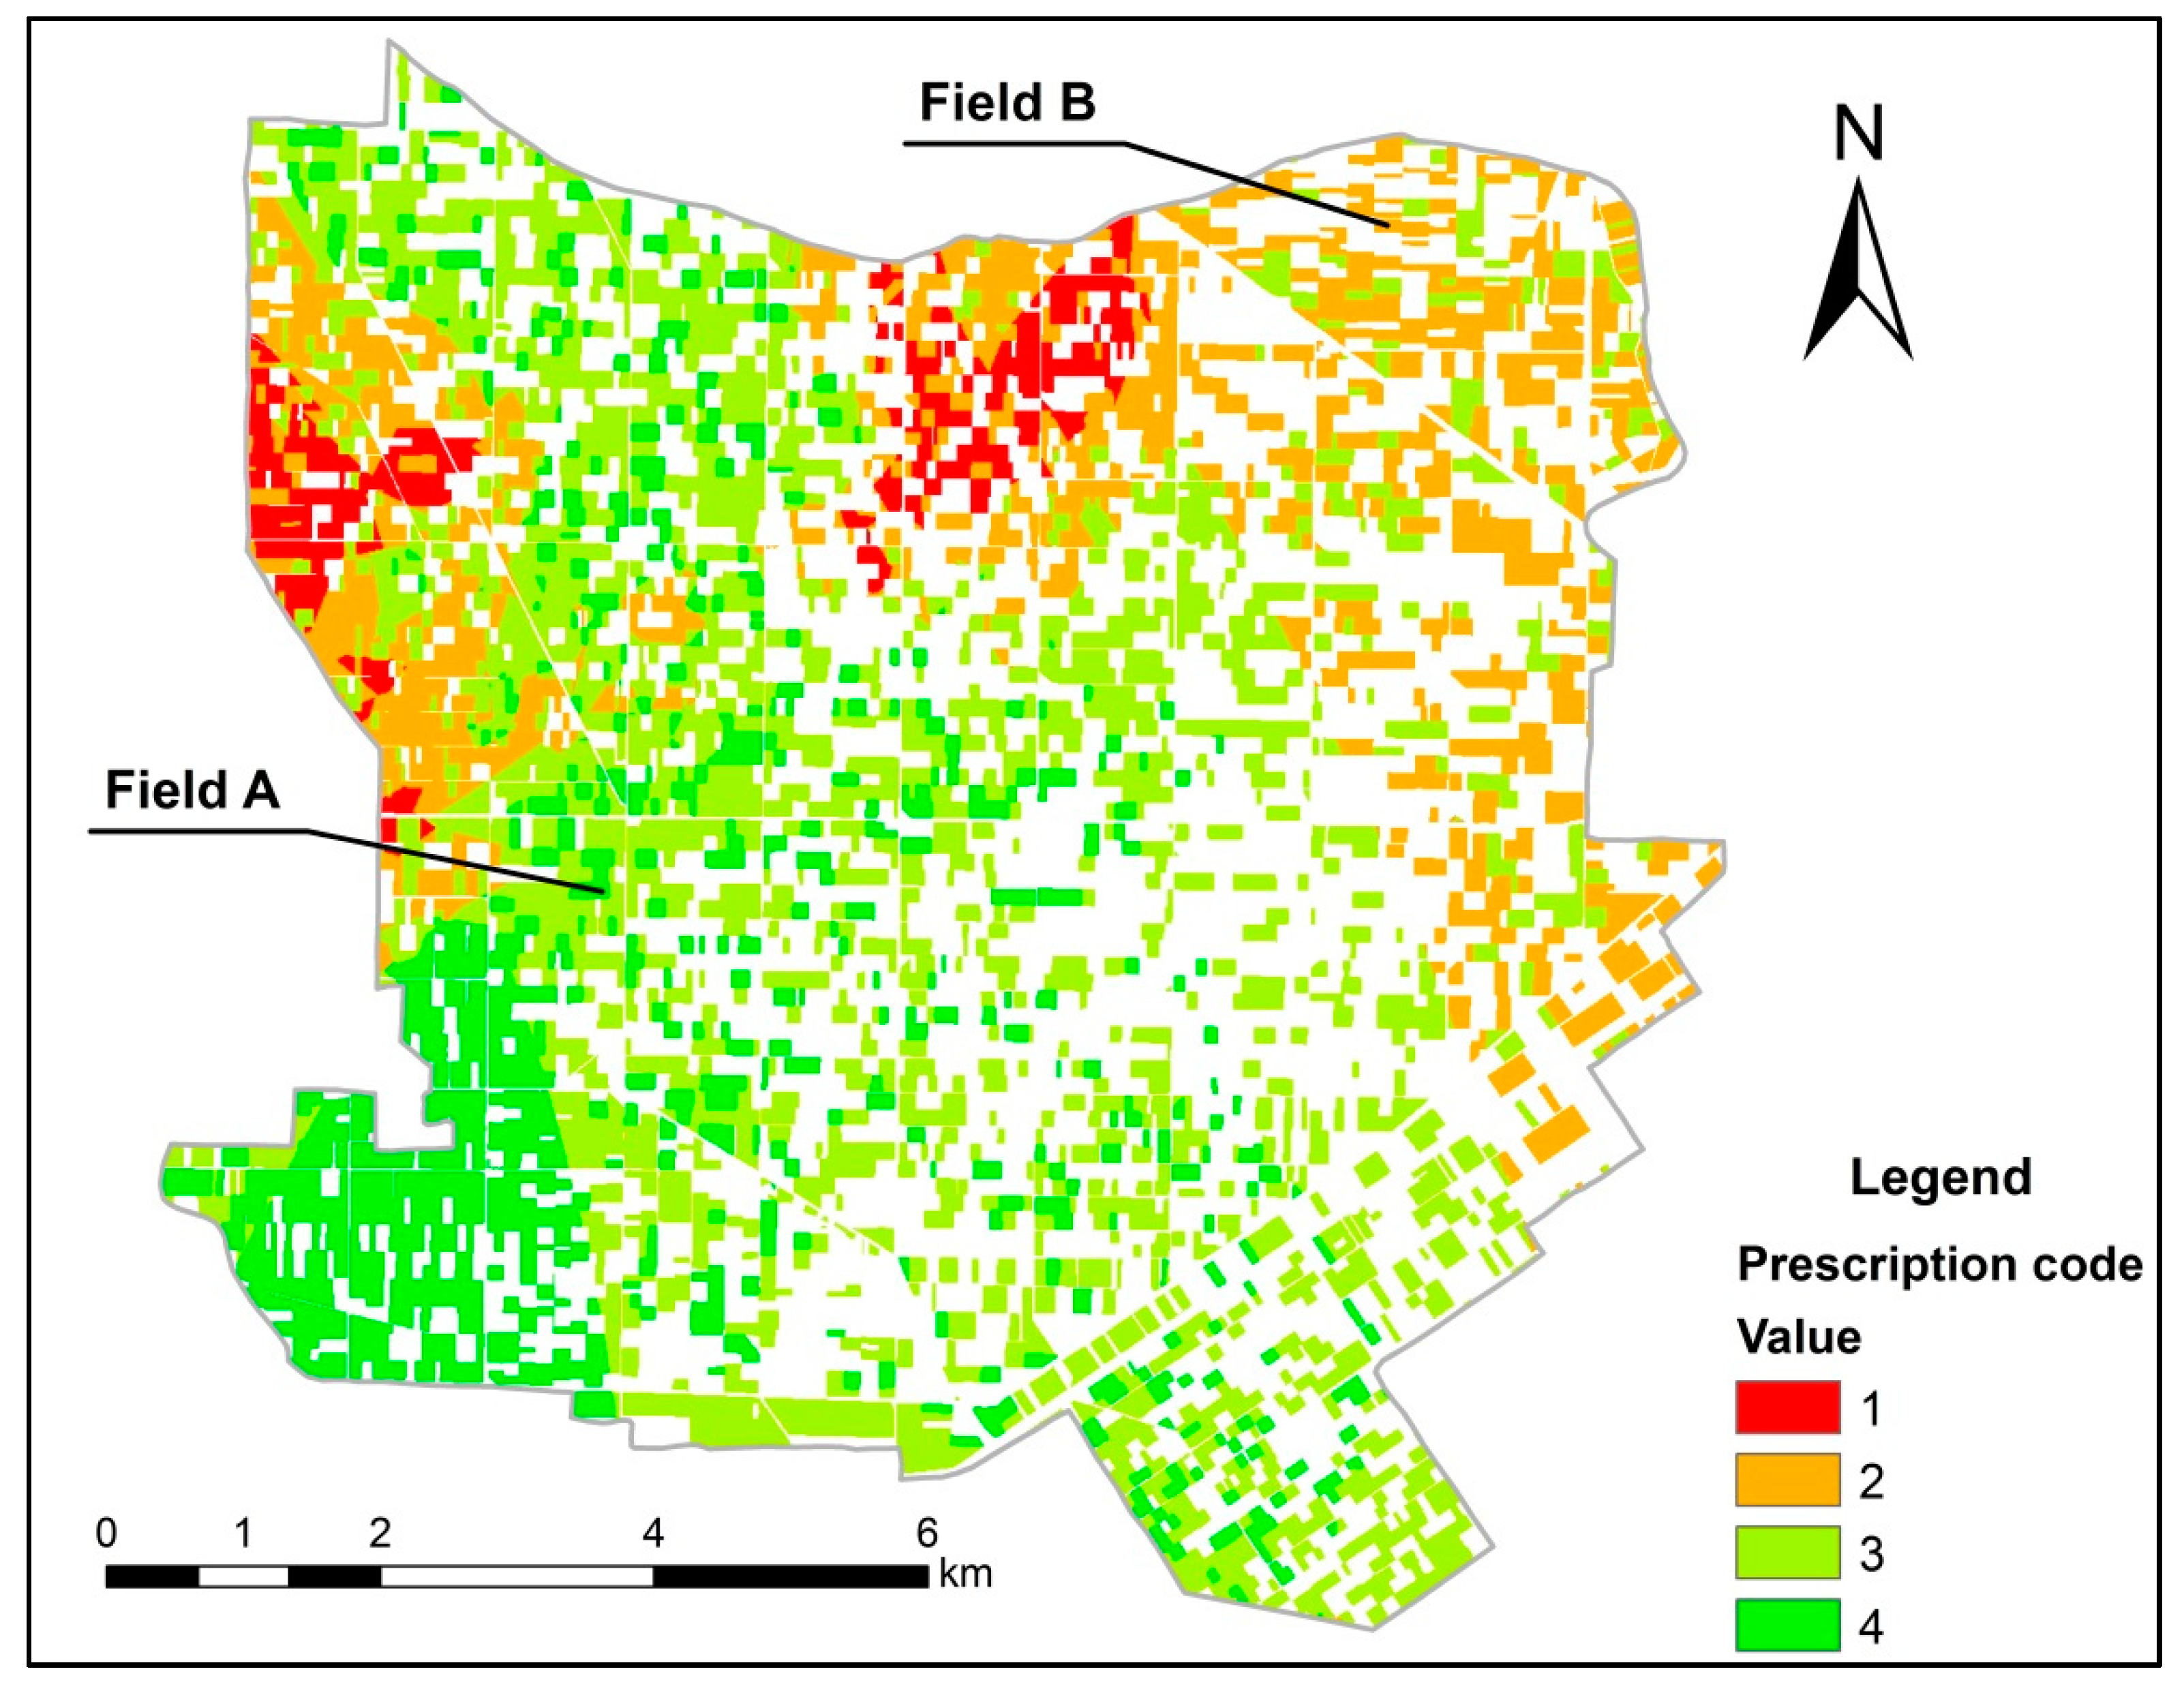
The spatial output of the “fertilizing type” module.
Figure 9.
The spatial output of the “fertilizing type” module.
The evaluation of the “fertilizing type” module produced the map presented in
Figure 9, which classifies the study area into four management zones. The consequent classes are sorted from lower to higher risk of soil degradation stemming from fertilizer use and are symbolized with red to green hues accordingly. Following, the classes were attributed with certain descriptive fertilizing recommendations given the numbers from one to four. The assignment was made with the contribution of experts in the field of soil fertility and nutrient kinetics and refers to the site-specific soil conditions of the study area. The fertilizing recommendations attached to each of the four codes are:
Prescription Code 1: Sites that fall into this category do not run any risk of acidification. Their pH is moderately alkaline, and only acidic fertilizers are proposed. Nitrogen fertilizers can be either in ammonium or nitrate forms. The fertilizer can be surface applied even in a single dose; however, it is recommended to incorporate it at two to three doses, in order to diminish gaseous or leaching losses.
Prescription Code 2: In the case of these sites, only acidic fertilizers that do not contain nitrate or urea nitrogen are proposed. They may well contain ammonium forms of nitrogen. Producers are encouraged to incorporate the fertilizer and apply it in at least two doses.
Prescription Code 3: In this case, the producer should avoid nitrate or urea fertilizers. The fertilizer can be applied on the surface of the field, but the overall application should concern at least three doses, distributed timely along with the crop needs.
Prescription Code 4: The application of all fertilizers is allowed. However, it is preferable not to apply acidic fertilizers due to increased risk of long-term reduction of the soil pH. The measurement of soil acidity in those sites at regular intervals is essential. Furthermore, sprinkler irrigation systems should be avoided for diminishing leaching potential.
The prescription that is dominantly suggested across the interest area (51.0% over the total area) is the third one followed by the second (23.7%) and the fourth (20.1%). The least suggested prescription is the first one, accounting for the 5.2% of the study area. Regarding the referenced Fields A and B, the module attributes different prescriptions, namely 4 and 2 accordingly (
Figure 9). Further, the module suggests substituting the irrigation system in the case of Field A from sprinkler to a drip, yet for Field B, it proposes the incorporation of fertilizer inputs, a practice that the producer has already adopted. In general, the module’s results establish an illustrative zonal fertilizing prescription on the type, dose and time of fertilization across the study area. Indeed, along with the “fertilizing rate” module, past empirical treatment of fertilization on the region is replaced by a structured and methodical spatial approach to the calculation of the necessary fertilizing inputs. Through GIS mapping, the results of the system’s runs are readily available to the end user, who in a single query can retrieve fertilizing prescriptions for any cotton field situated in the reference area.
The sensitivity analysis’ results of “fertilizing rate” module, concerning ten of the fourteen input parameters whose value fields are continuous, are presented in
Table 2. According to these results, the increase of five input parameters (soil inorganic nitrogen, clay content, mean soil temperature, quantity of irrigated water and inorganic nitrogen in irrigated water) resulted in diminishing the suggested average fertilizing rates across the study area. This finding is rather reasonable and expected for soil inorganic nitrogen, the quantity of irrigated water, inorganic nitrogen in irrigated water and the mean soil temperature, since these parameters affect solely the inputs of the nitrogen balance and indeed are positively correlated with those (
Figure 6). In effect, the increase of their values tends to increase nitrogen inputs, driving the module to suggest less fertilizer in places where this occurs.
Table 2.
Results of Sensitivity Index I (dimensionless) for the “fertilizing rate” module.
Table 2.
Results of Sensitivity Index I (dimensionless) for the “fertilizing rate” module.
| No. | Input parameters | % additive variation over the base model |
|---|
| 5 | 10 | 15 | 20 |
|---|
| 1 | Soil inorganic nitrogen | −0.81 | −1.57 | −2.21 | −2.69 |
| 2 | Clay content | −4.32 | −10.06 | −16.01 | −21.82 |
| 3 | pH | 5.38 | 10.57 | 10.85 | 10.95 |
| 4 | Organic matter | −1.23 | −1.11 | 2.76 | 3.97 |
| 5 | Soil moisture | 0.00 | 0.00 | 0.00 | 0.01 |
| 6 | Mean soil temperature | −7.18 | −16.41 | −24.96 | −29.96 |
| 7 | Mean rainfall | 7.19 | 12.09 | 12.68 | 13.90 |
| 8 | Quantity of irrigated water | −0.65 | −1.20 | −1.70 | −2.21 |
| 9 | Inorganic nitrogen in irrigated water | −0.88 | −1.67 | −2.17 | −2.49 |
| 10 | Yield | 2.15 | 4.28 | 7.54 | 9.25 |
Conversely, the clay content influences three parameters of the nitrogen balance (mineralization, leaching, denitrification), making the interpretation of the sensitivity analysis not so straightforward. The analysis’ results showed that, according to the site-specific conditions of the study area, the additive variation in the values of clay percentage increases of nitrogen inputs (mineralization) may be indirect because of the increase in the water availability and further decreases leaching potential through reducing drainage conditions. When referring to the organic matter, an additive increase up to 10% increases nitrogen inputs, but a further increase diminishes them compared to the outputs (
Table 2). This happens because the soil organic matter percentage drives both mineralization (input) and denitrification (output) processes. For small changes, the mineralization’s products surpass the denitrification ones, while for larger variations, the opposite takes place.
The increase of the initial values of the parameters soil pH, mean rainfall and yield potential resulted in increasing amounts of the proposed fertilizers. Finally, changes in the initial values of soil moisture did not substantially change the results of the module.
Classifying the input variables based on the results of the sensitivity analysis, the “fertilizing rate” module proved more sensitive to changes in soil temperature, clay content, rainfall, soil pH, yield potential, organic matter content, soil inorganic nitrogen and “quality” and quantity of irrigation water, in the order reported.
The values in
Table 3 refer to the area, as a percentage of the total study area, for which the fertilizing prescription code changed after the application of each variation (5%, 10%,
etc.).
Table 3.
Results of the sensitivity analysis for the “fertilizing type” module (percentage of the changes over the total study area).
Table 3.
Results of the sensitivity analysis for the “fertilizing type” module (percentage of the changes over the total study area).
| No. | Input parameters | % Additive variation over the base model |
|---|
| 5 | 10 | 15 | 20 |
|---|
| 1 | Clay content | 0.0 | 0.0 | 0.1 | 1.1 |
| 2 | pH | 15.0 | 81.6 | 81.6 | 97.9 |
| 3 | Mean rainfall | 0.0 | 43.8 | 63.5 | 63.5 |
According to
Table 3, the most important input variable, in terms of the sensitivity of this module, is soil pH followed by the precipitation and, finally, the clay content.


