1. Introduction
By combining a range of sea level rise (SLR) scenarios for 2050 with the potential maximum storm surge level for the current 100-year storm, this paper analyzes permanently inundated lands and temporary flood zones in the Red River delta region of Vietnam. The approach is consistent with methods generally applied to estimate the long-term hazards and related risks needed for coastal planning and decision-making [
1]. US Geological Survey’s HydroSHEDS 90-m elevation data is used to identify the inundated and flooded areas [
2]. Three SLR scenarios are considered, each with a different level of rise: low (0.25 m), medium (0.33 m) and high (0.5 m). The sea, lake, and overland surge from hurricanes (SLOSH) model is used to define the potential maximum surge for simulated storm activity in the study area [
3].
This paper is one of four papers that document the findings from a UNU-WIDER research project: “Development under Climate Change”. As one of the project’s country level case studies, these four papers estimate climate change’s biophysical and economic impacts on Vietnam using an integrated or multi-sector modeling framework. Additional impact channels include water, agriculture and hydropower [
4] and road infrastructure [
5]. These sectoral impact channels are combined to provide an economy-wide assessment of climate change for Vietnam [
6]. This paper on cyclones and storm surges includes three sections: (1) background information on coastal flooding in the Red River delta; (2) a thorough description of the applied methodology and (3) the results of the analysis. The paper concludes by discussing the findings.
2. Coastal Flooding in the Red River Delta
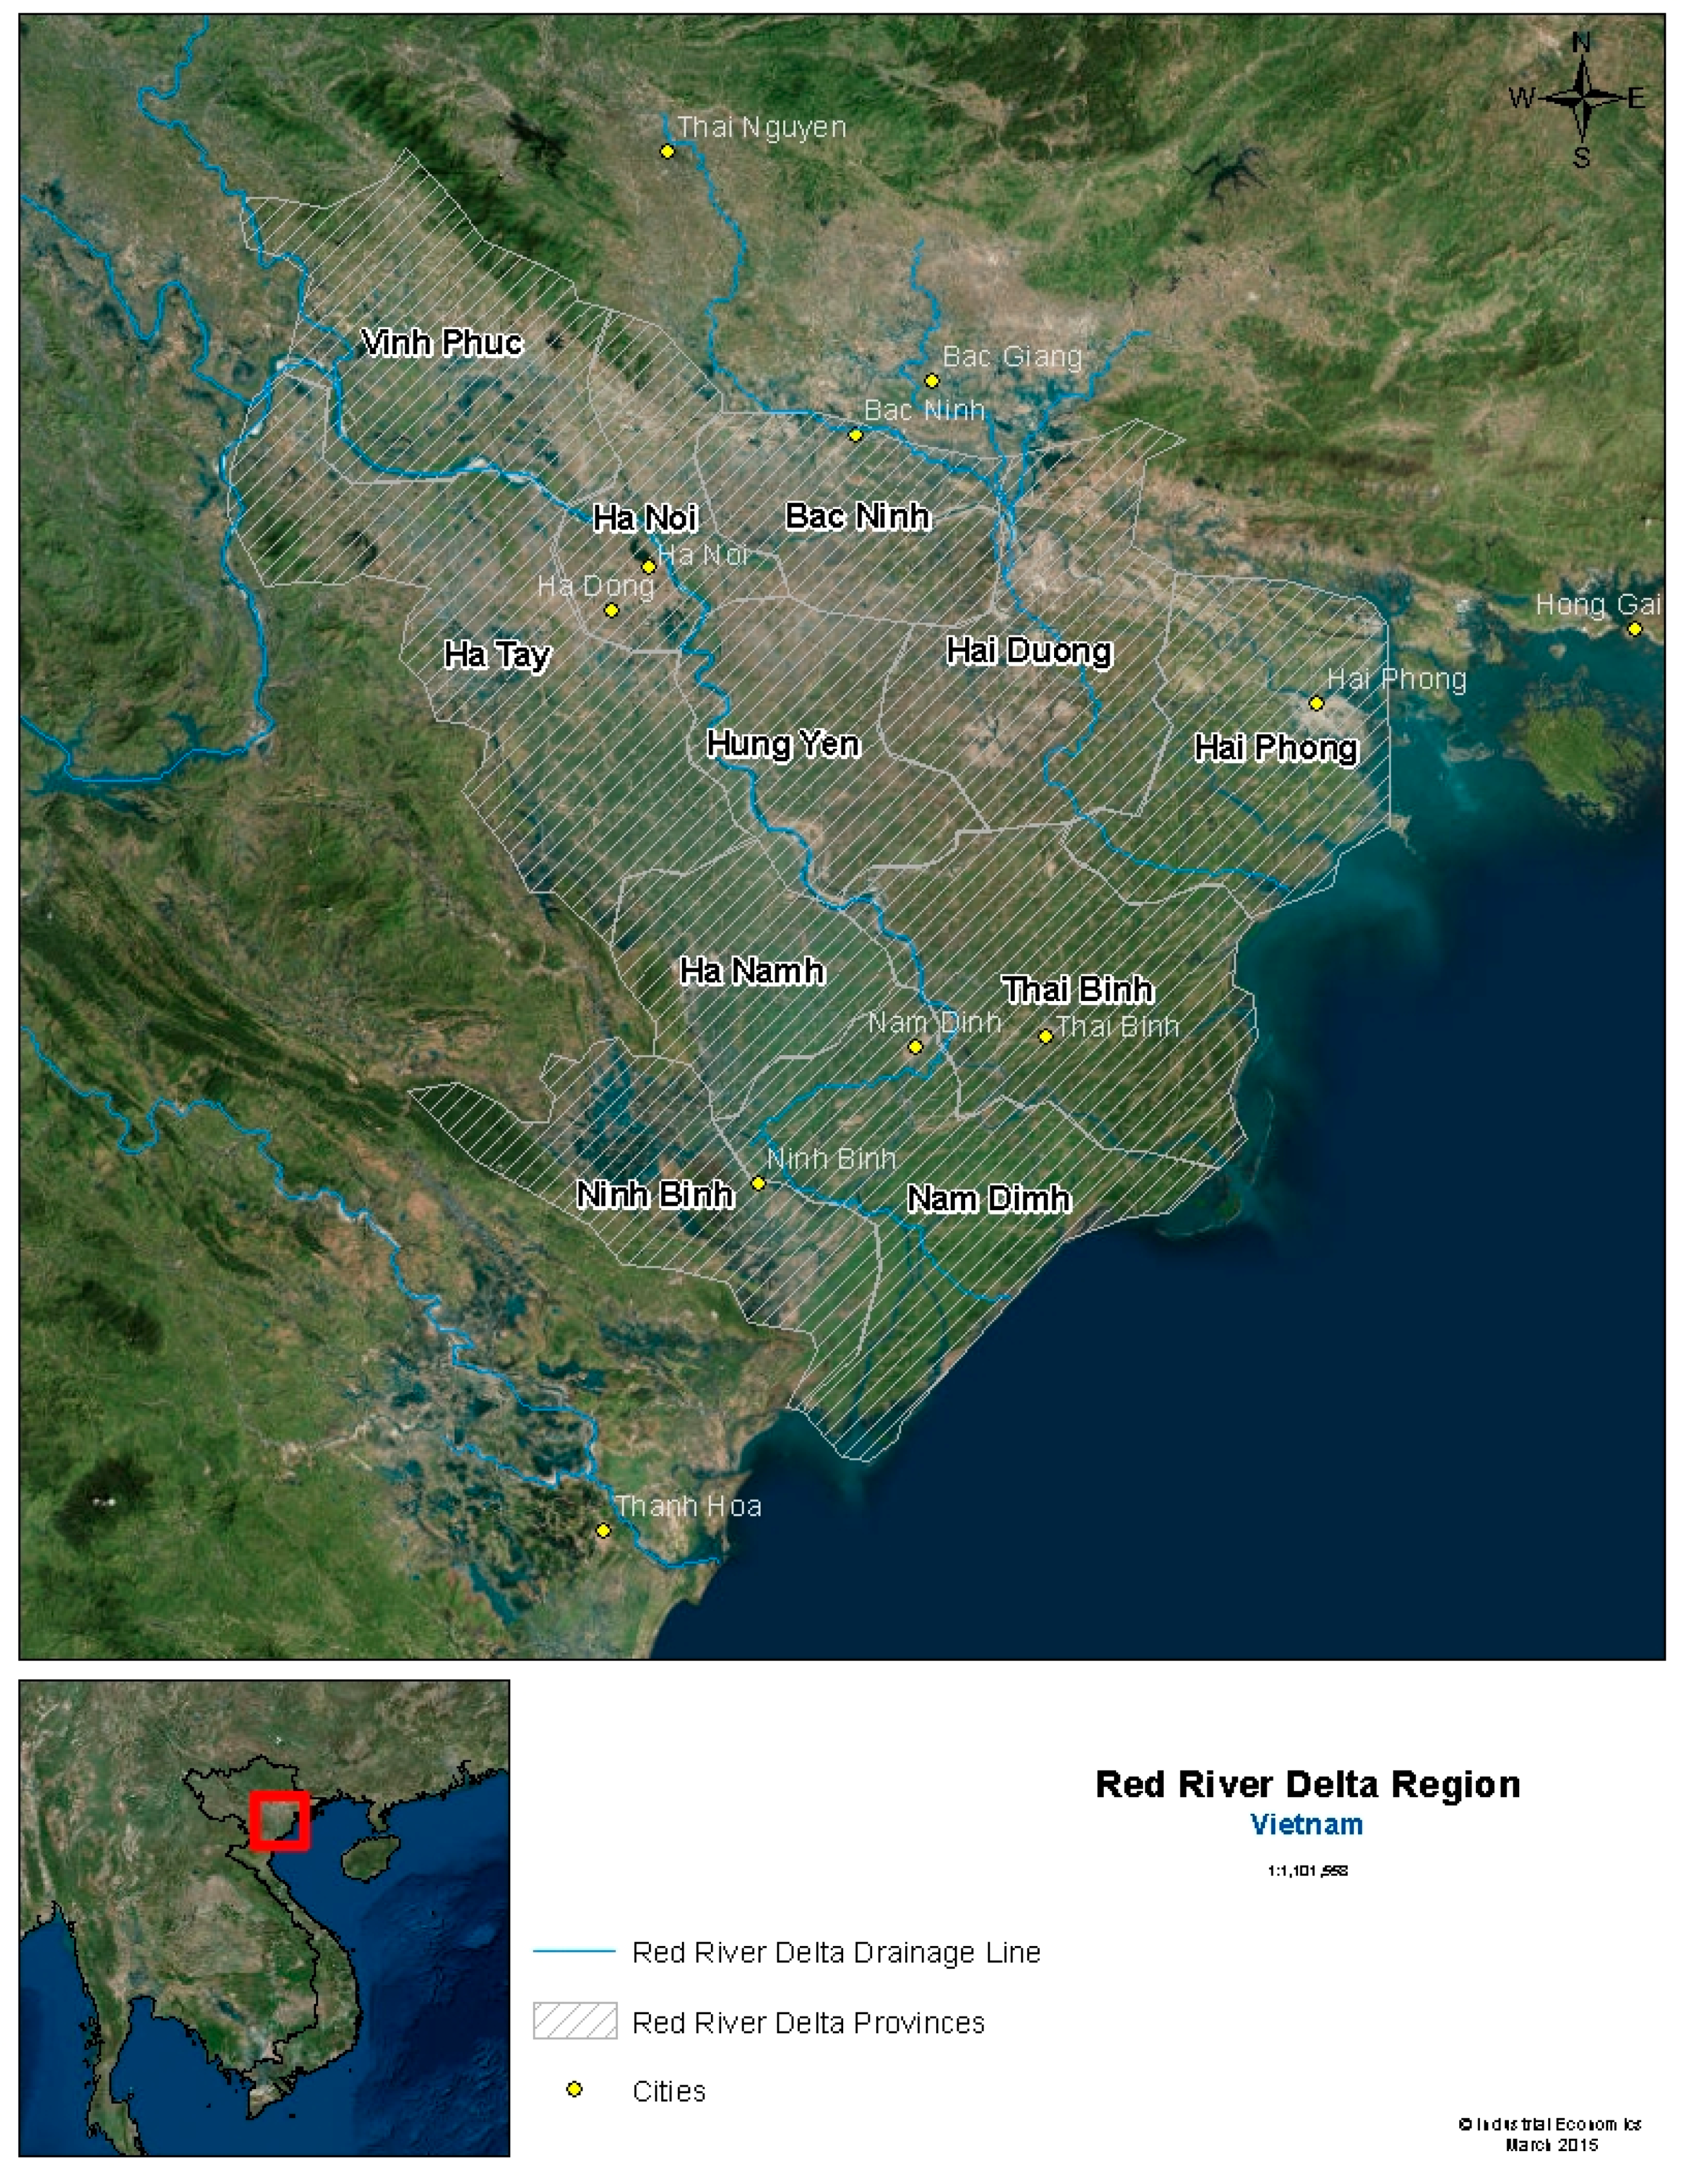
The Red River delta region consists of nine provinces: Bac Ninh, Ha Namh, Hai Duong, Hung Yen, Nam Dimh, Ninh Binh, Thai Binh, Ha Tay and Vinh Phuc; and two municipalities: Hanoi and Hai Phong. Much of the delta area is characterized by low elevations. The capital city of Hanoi is located eight meters above sea level, on average. Other major cities in the region include Hai Phong and Nam Dinh, which are both located three meters above sea level, on average.
Figure 1 depicts the study area for this analysis.
Of all developing countries, recent studies have shown Vietnam to be one of the most vulnerable to sea level rise. Using six indicators, Dasgupta
et al. (2009) [
7] assess the impact of SLR on 84 coastal developing countries. Considering the use of land, population, gross domestic product, urban extent, agricultural extent and impacted wetlands, they demonstrate that Vietnam, with one meter of SLR, ranks among the top five most-impacted countries [
7]. Additionally, the World Bank [
8] ranks Vietnam among the 12 World Bank client countries most at risk from sea level rise due to climate change.
Figure 1.
Red River delta region study area, delineated by the delta drainage area.
Figure 1.
Red River delta region study area, delineated by the delta drainage area.
Vietnam is likely to be one of the most vulnerable nations in the word due in part to the location of major urban centers and intensely cultivated lands in low-lying areas. In 2010, the Red River delta region, which surrounds Hanoi, was home to approximately 23% of Vietnam’s total population [
9]. The provinces in this region represent the most densely populated in Vietnam outside of Ho Chi Minh City [
9].
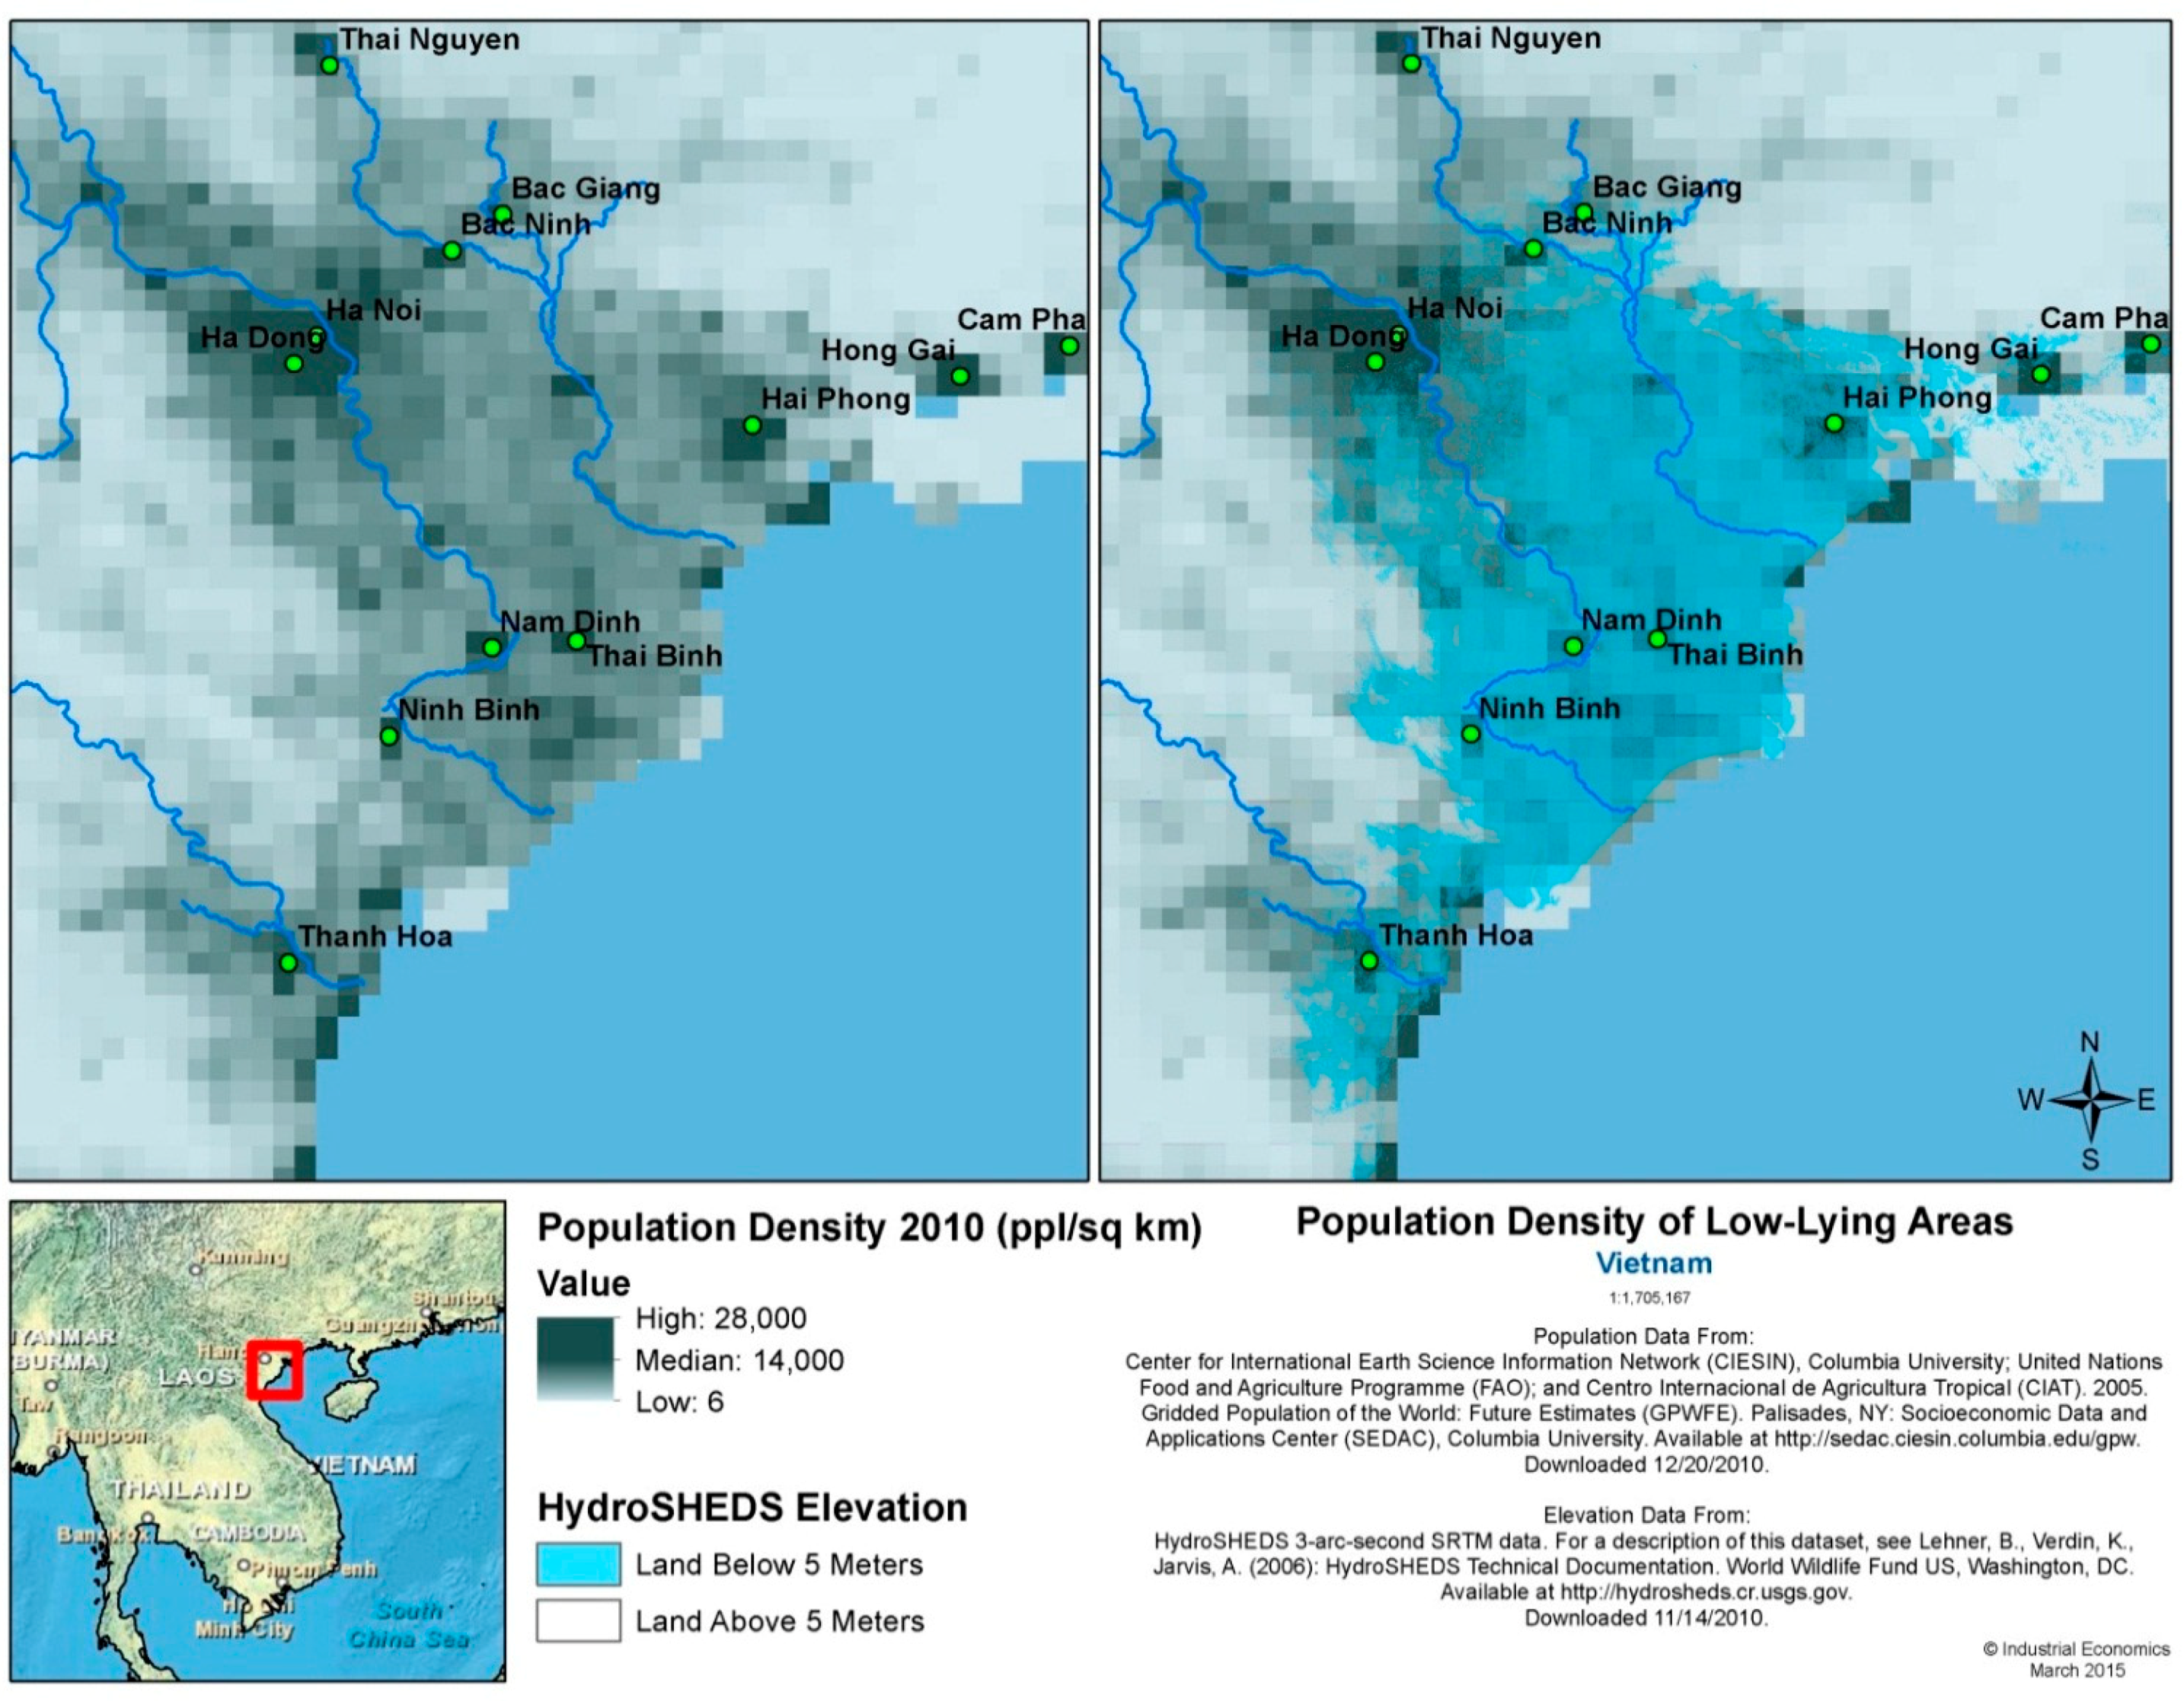
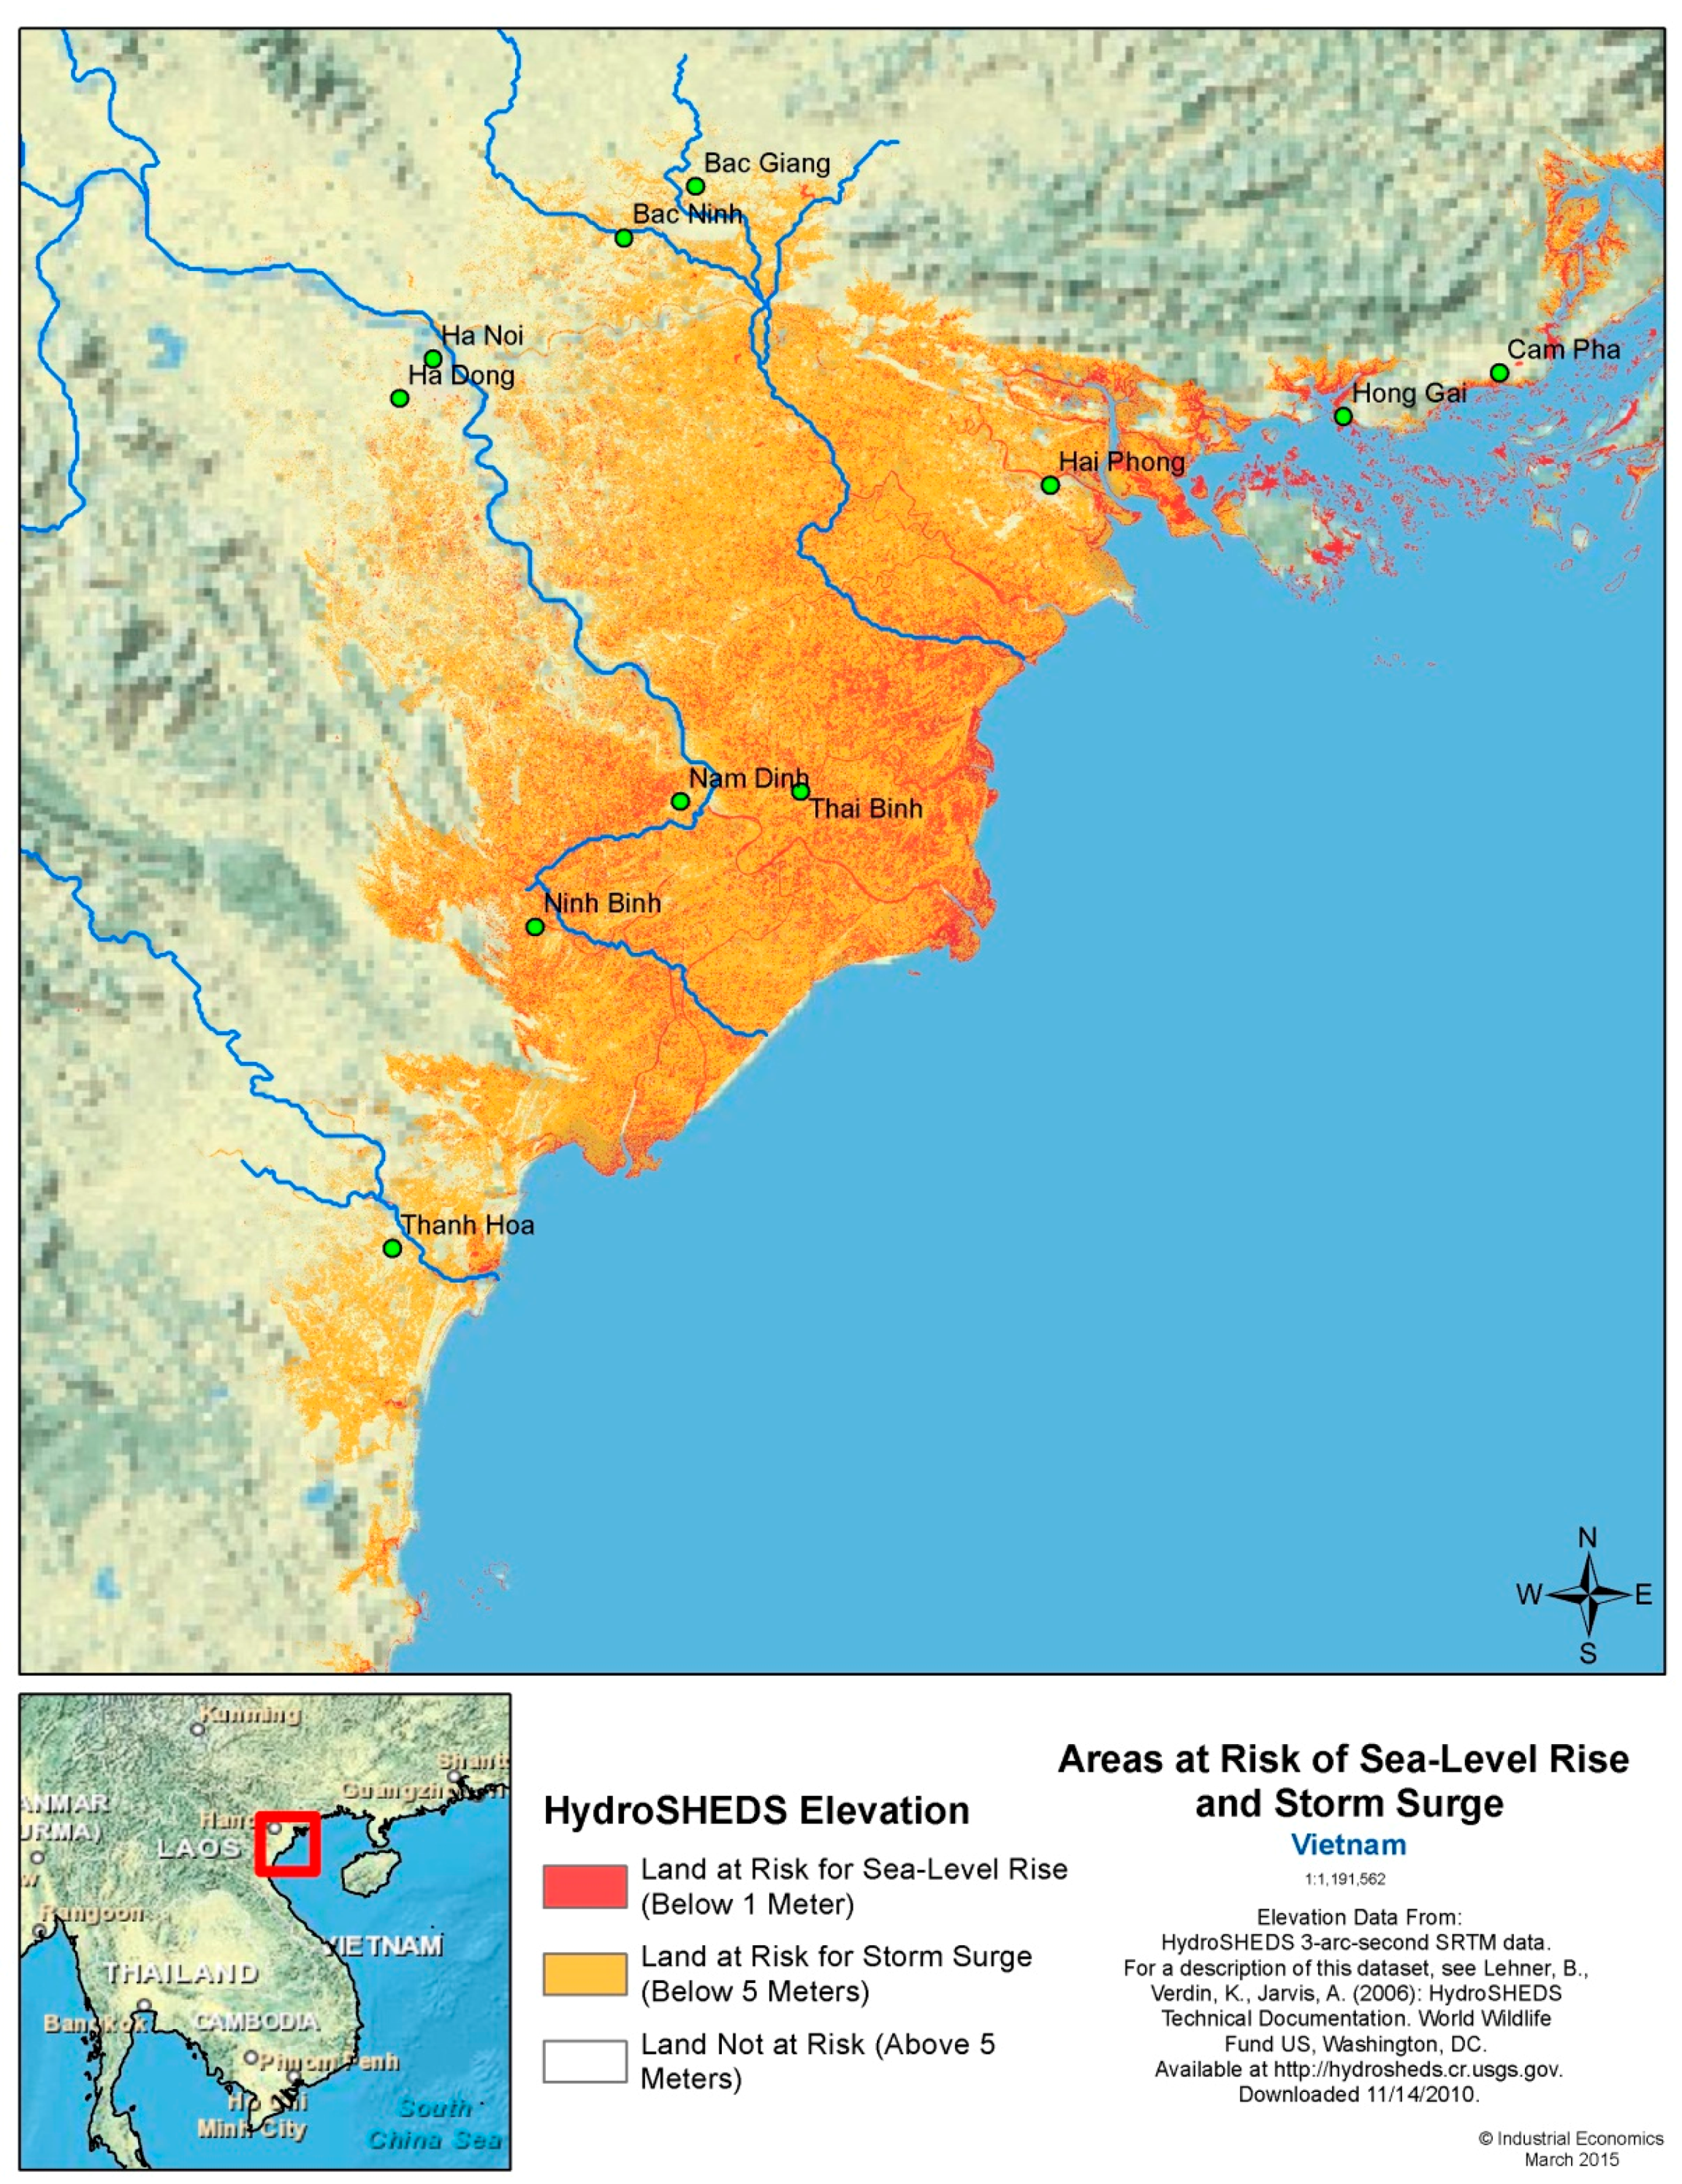
Figure 2 illustrates the confluence of population density and low-coastal land in the Red River delta region. The Red River delta region is also one of the country’s major agricultural regions. Nearly 60% of households in the region depend on income provided by agriculture [
10].
Figure 2.
Population density of low-lying areas in Red River delta region. The left panel shows population density, while the right panel shows an overlay of elevation categories. The area below 5 m, as estimated by the models employed in this paper, represents the area most at risk of storm surge events. Note: Elevation data from HydroSHEDS (2010) database [
2]; see [
11] for further explanation. Population data from [
12].
Between 1954 and 2000, an average of 6.9 typhoons per annum made landfall along Vietnam’s coast [
13]. The high winds and storm surges associated with these typhoons inflict a vast amount of damage on the coastal region. Precipitation that accompanies these typhoons also induces widespread flooding in regions at an elevation of less than one meter above sea level. These floods result in significant damage to those low-lying regions, like those within the Red River delta and floodplain.
Table 1 outlines the historic cyclone events that have caused damage to the Red River delta region between 1990 and 2008.
Table 1.
Historic tropical cyclone incidents which have caused damage to the Red River delta region during 1990–2008.
Table 1.
Historic tropical cyclone incidents which have caused damage to the Red River delta region during 1990–2008.
| Date | Storm name | Provinces impacted | Housing lost (number of houses) | Agriculture lost (hectares) |
|---|
| Collapsed, washed away | Submerged | Rice fields, damaged | Rice fields, lost | Farm produce, damaged | Farm produce, lost |
|---|
| September 2005 | Storm no. 7 (Damrey) | Hai Phong, Thai Binh, Nam Dinh, Ninh Binh | 626 | 35,886 | 139,649 | 1300 | 12,128 | 1000 |
| September 2005 | Storm no. 6 | Hai Phong, Thai Binh, Nam Dinh, Ninh Binh | 1 | 138 | 42,129 | | | |
| July 2005 | Storm no.2 (Saola) | Hai Phong, Thai Binh, Nam Dinh, Ninh Binh, Ha Nam | 2 | 206 | 48,534 | | 4027 | |
| August 2003 | Storm no. 3 | Hoa Binh, Ha Tay, Bac Giang, Bac Ninh, Hai Duong, Ha Nam, Hung Yen, Hai Phong, Thai Binh, Ninh Binh, Nam Dinh | | 201 | 3400 | 130 | | |
| September 1996 | Storm no. 4 | Nam Ha, Thai Binh, Hai Phong, Ninh Binh | 3190 | 74,050 | 21,411 | 2615 | 8420 | 3190 |
| August 1996 | Storm no. 2 | Nam Ha, Thai Binh, Hai Phong, Ninh Binh, Hoa Binh, Hanoi, Ha Tay | 29,842 | 444,017 | 117,002 | 39,504 | 11,773 | 7645 |
| August 1995 | Storm no. 5 | Ninh Binh, Nam Ha, Thai Binh | | | 1500 | | | |
| July 1991 | Storm no. 3 | Hai Phong | 5 | | 1500 | | | |
Two of the strongest typhoons to hit Vietnam in the last 30 years made landfall in 2005 [
15]. Typhoon Saola, the smaller of the two, made landfall on 31 July, predominantly affecting the coastal areas of Quang Ninh and Hai Phong provinces. Wind force near the eye of the storm reached nine on the Beaufort scale (75–88 km/h). Saola caused several kilometers of sea dike damage, especially on the island of Cat Hai where dikes needed to be completely replaced [
15].
Typhoon Damrey, which made landfall in Vietnam on 27 September, is considered the most severe storm to hit Vietnam in the last 50 years. Damrey affected all coastal provinces of the Red River delta region with Beaufort scale 12 (118–133 km/h) wind forces in the eye of the storm. High storm surges coincident with high tides led to extensive overtopping of sea dikes in the area. Storm surges from Damrey reached a height of three to four meters and the seawater penetrated inland three to four kilometers. Flash floods following Damrey destroyed at least 1194 houses and damaged another 11,576 in upland areas. More than 130,000 hectares of rice fields were submerged and damaged, most of which had not been harvested prior to Damrey [
15]. Although it is difficult to associate singular events like the damaging typhoons of 2005 with climate change, events like these clearly demonstrate the extreme vulnerability of the region to exaggerated climate variability.
The threat from cyclones in Vietnam is compounded by the potential impacts of climate change, including sea level rise and increased rainfall. Sea levels in Vietnam are estimated to increase two and a half to three centimeters per decade due to climate change [
13]. In addition, delta areas are expected to subside over time, which may exacerbate damage caused by sea level rise in the Red River delta. Unless a sufficiently high and strong dike system is built, sea level rise will further decrease land area in the Red River delta. Climate change is expected to increase climate variability in Vietnam, decreasing rainfall during the dry season and increasing rainfall in the wet season. Overall, annual rainfall is expected to increase [
16]. Inundation, the loss of land and saltwater intrusion caused by sea level rise, increased rainfall and cyclone events will pose serious threats to farmers. Between 1976 and 2005, flooding and saltwater intrusion contaminated 40,000 hectares of cultivated land and destroyed over 100,000 tons of food [
15]. The rate of destruction may increase due to climate change. These impacts may be felt through agricultural exports and could possibly affect national food security [
17].
Cyclones also contribute to serious coastal erosion in Vietnam, which is expected to worsen due to climate change [
15]. Vietnam has experienced both structural longshore erosion, which takes place along unprotected coastlines, and foreshore erosion, which leads to a deepening of the foreshore in front of sea dikes [
15]. In Vietnam, structural erosion occurs at about 10 to 20 m per year, while foreshore erosion occurs at a rate of 0.3 to 0.6 m per year. Over the past 100 years the shoreline in Vietnam has retreated some 3000 m and approximately 18,000 hectares of land have been lost [
15].
3. Materials and Methods
The effects of climate change on cyclones can include changes in the intensity, frequency, and the track of individual storms. Changes in temperature are a potentially important factor in altering storm patterns, but, because cyclones are relatively rare events, differences in storm generation activity that might be experienced by 2050 are difficult to discern with current methods. Because historical data on storm surges in Vietnam is sparse, extrapolating trends of past storm activity is generally not useful.
The effect of sea level rise is an equally important effect of climate change on the potential damage that may result from cyclones. Higher sea level provides storm surges with a higher “launch point” for the surge, which may increase both the real extent and the depth of the surge in areas already vulnerable to coastal storms. In addition, future sea level rise, while uncertain, is more reliably projected to 2050 than future storm activity. In general, the increase in sea level would make existing storms significantly more damaging, even for minimal changes in storm activity. This analysis focuses on the more reliably projected marginal effect of SLR on the extent and effective return period of these already damaging storms. Using a simulated dataset for storms and surges along with three alternative scenarios for future SLR in Vietnam, we estimate the effect of climate change induced SLR on surge risk due to cyclones. The overall method involves four steps:
- (l)
Simulate storm generation activity over the twenty-first century. The method generates 3000 potential storm events, and estimates which of these events become cyclones and where they might track, based on simulation of the environmental conditions that exist to support cyclone formation (more details of this model are provided in the next section). The approach itself is not new, having been developed in [
18], but the linking of this approach to subsequent storm surge risk approaches to estimate the change in storm return time associated with changes in sea level is new for Vietnam and areas with sparse data in general.
- (2)
Use wind fields as inputs to a storm surge model. We use the US National Weather Service’s SLOSH model to estimate how wind-driven water during a cyclone event generates a storm surge over coastal land.
- (3)
Generate a cumulative distribution function of storm surge height for selected key locations in the SLOSH domain. SLOSH results generated for each of the simulated events provide a base case of surge heights for future storms, absent sea level rise.
- (4)
Estimate effect of SLR on return time of storms. Using the distribution of storm surge in the base case, we then estimate how SLR effectively increases the frequency of damaging storm surges, for three scenarios of future SLR in 2050.
The sequencing of models described above has been developed over several applications. For example, steps 1 to 3 have been described and applied in detail in [
19] for New York City. Step 4 is based on an application in [
20] for the northeast United States. Steps 1 to 3, with a modified treatment of Step 4, have recently been applied for an economic assessment of the US coastline in [
21]. This application to Vietnam, however, is novel in that it applies these techniques to an area where only sparse data is available to characterize elevations and vulnerable assets at risk, while still yielding useful and potentially actionable results for risk management, land use policy, and infrastructure planning purposes. We describe each of these steps in more detail in the remainder of this section.
3.1. Storm Generation
Existing event set generation techniques begin with historical compilations of hurricane tracks and intensities, such as the so-called “best track” data compilations maintained by forecasting operations such as the National Oceanic and Atmospheric Administration’s Tropical Prediction Center (TPC) and the US Navy’s Joint Typhoon Warning Center (JTWC). These records typically contain the storm’s center-position every six hours together with an estimated intensity, either maximum wind speed or central pressure, for every time period. Early risk assessments (e.g., [
22,
23]) fit standard distribution functions, such as lognormal or Weibull distributions, to the distribution of maximum intensities of all historical storms coming within a specified radius of the point of interest. Then, by drawing randomly from such distributions, these early risk assessments used standard models of the radial structure of storms, together with translation speeds and landfall information, to estimate the maximum wind achieved at the point of interest. A clear drawback of this historical extrapolation approach is that frequency estimates for high-intensity events are quite sensitive to the shape of the tail of the assumed distribution. Mainly because there is little supporting data, these tails are, by nature, notoriously difficult to quantify.
Many wind risk assessment methods rely directly on historical hurricane tracking data to estimate the frequency of storms passing close to points of interest, and must therefore assume that the intensity evolution is independent of the particular track taken by the storm. Moreover, the relative intensity method must fail when storms move into regions of small or vanishing potential intensity. This is often the case in higher latitudes, where enormously destructive storms have occurred, though infrequently. In such regions the historical record is extremely sparse, resulting in vanishing potentials.
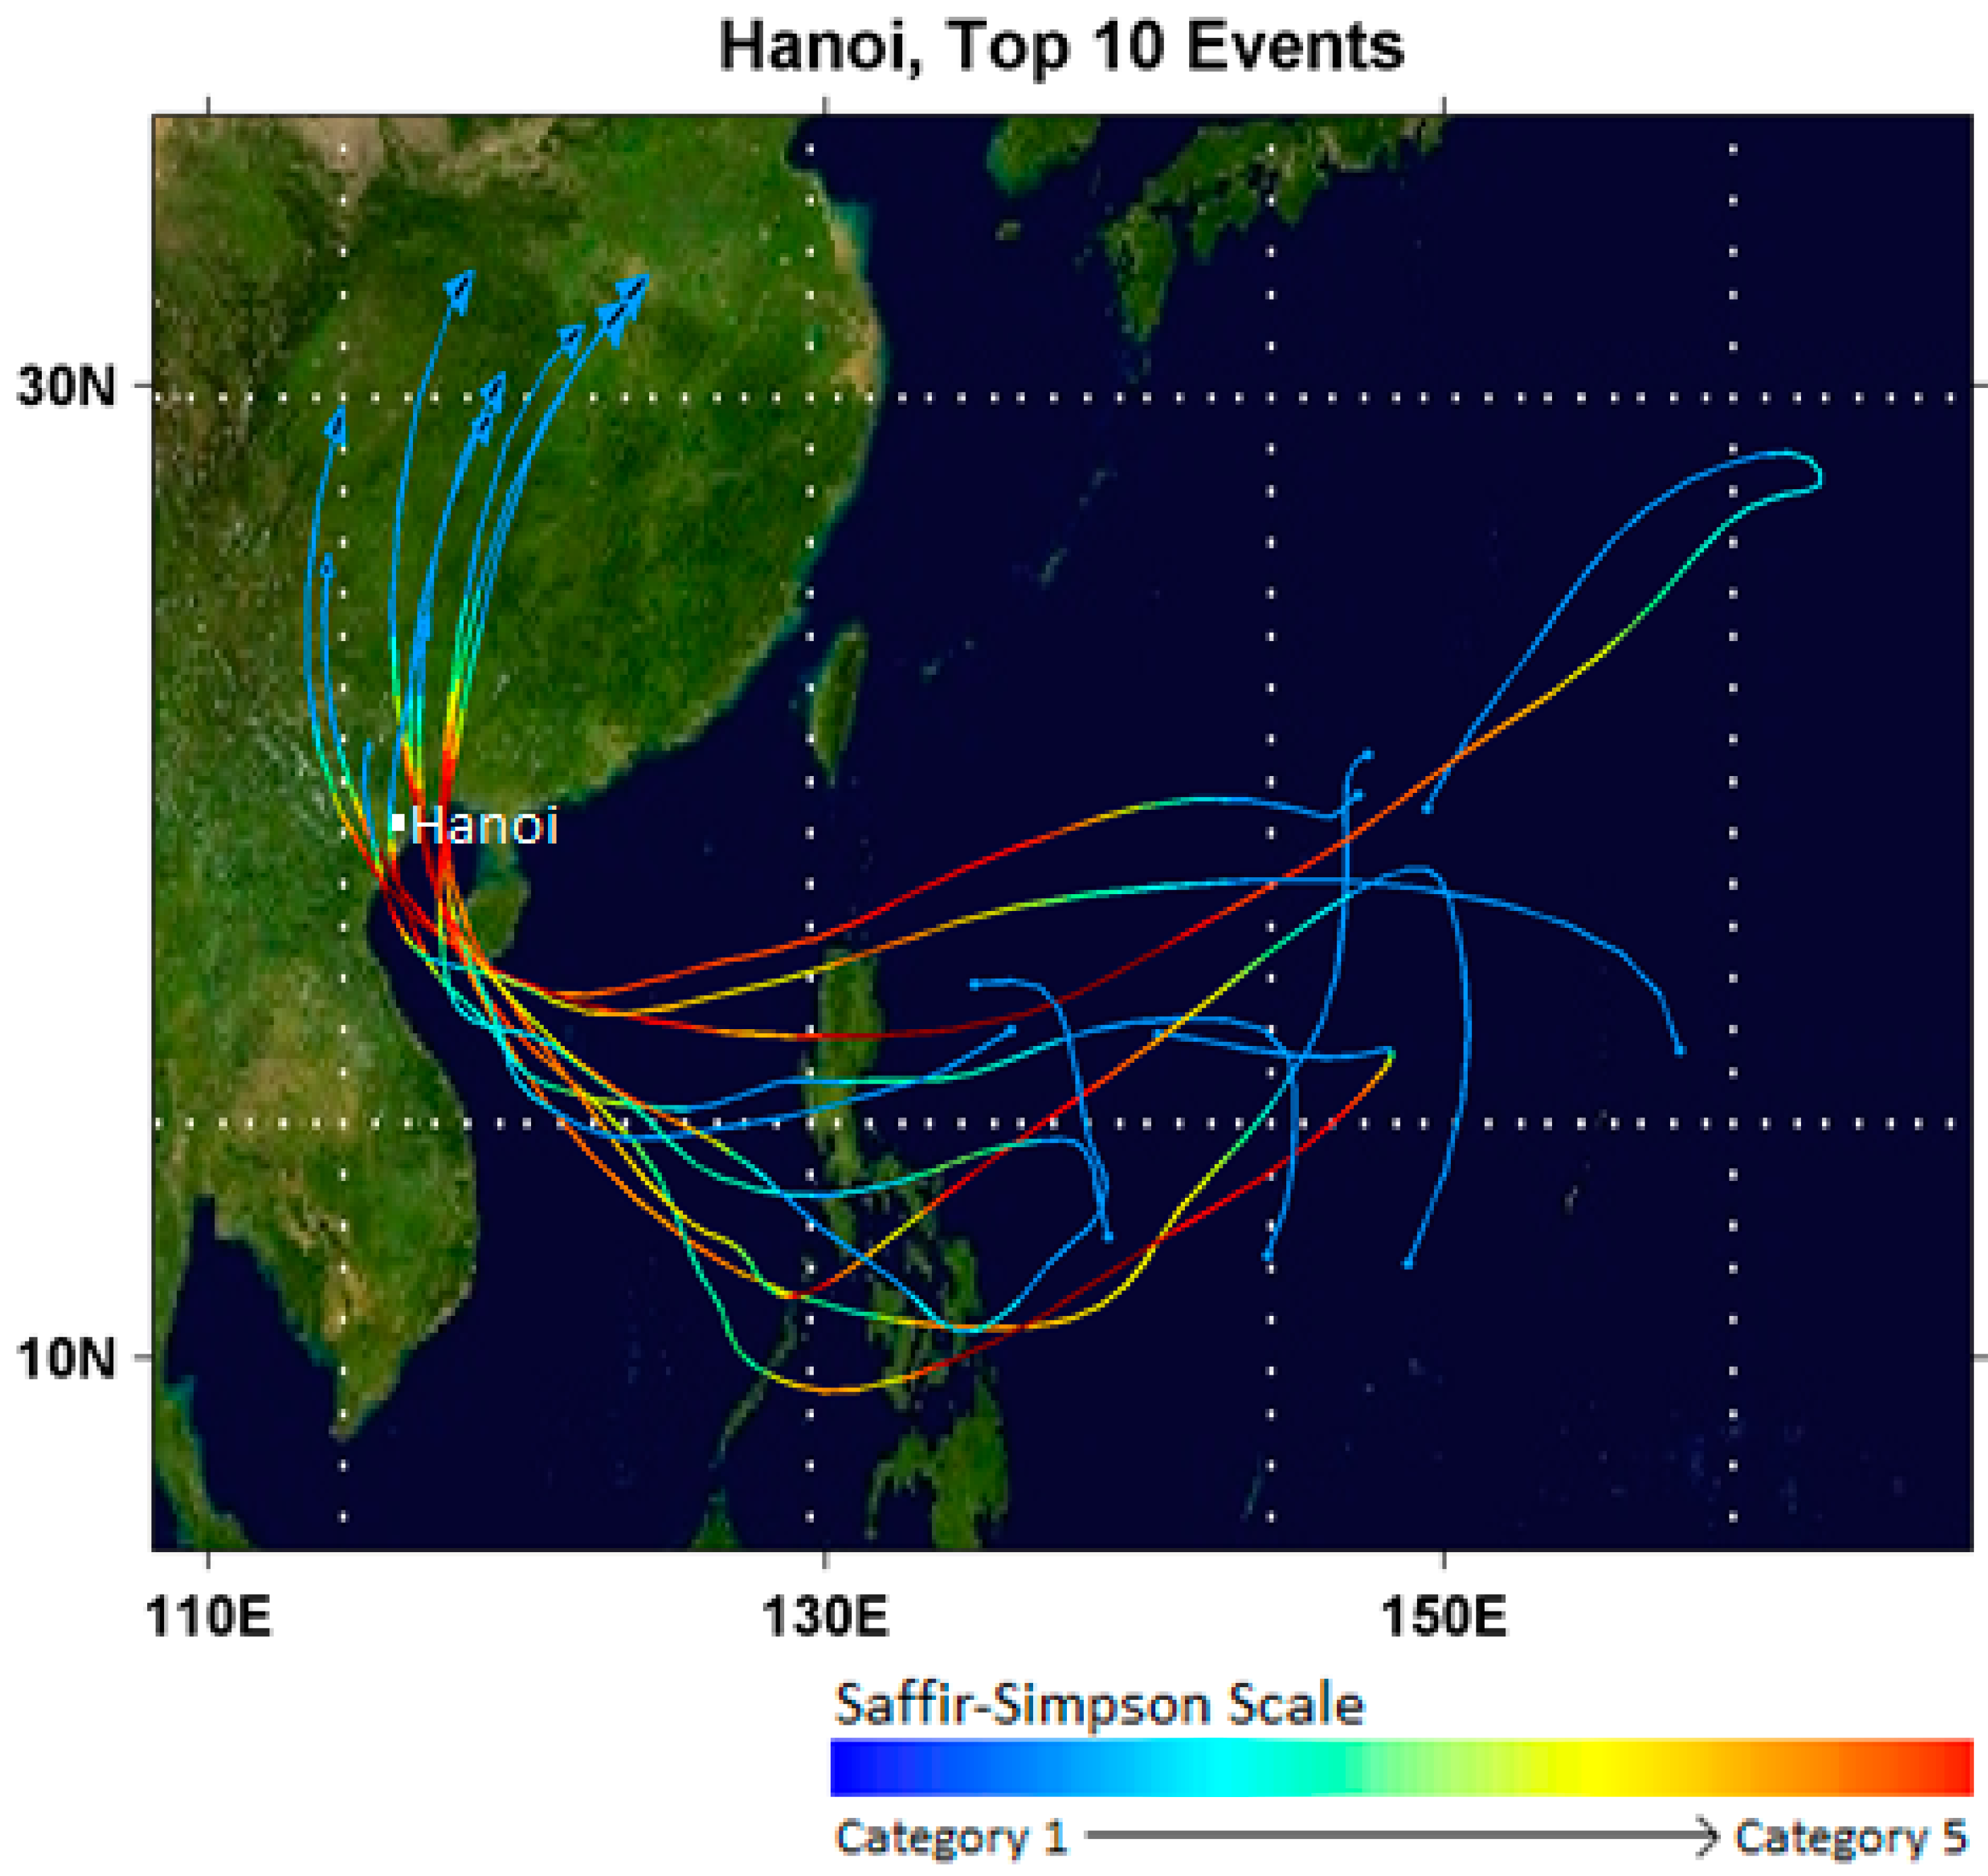
As a step toward circumventing some of these difficulties, we have developed a technique for generating large numbers of synthetic hurricane tracks, along each of which we run a deterministic, coupled numerical model to simulate storm intensity. The method is based on randomly seeding a given ocean basin with weak tropical cyclone-like disturbances, and using an intensity model to determine which of these develop to tropical storm strengths [
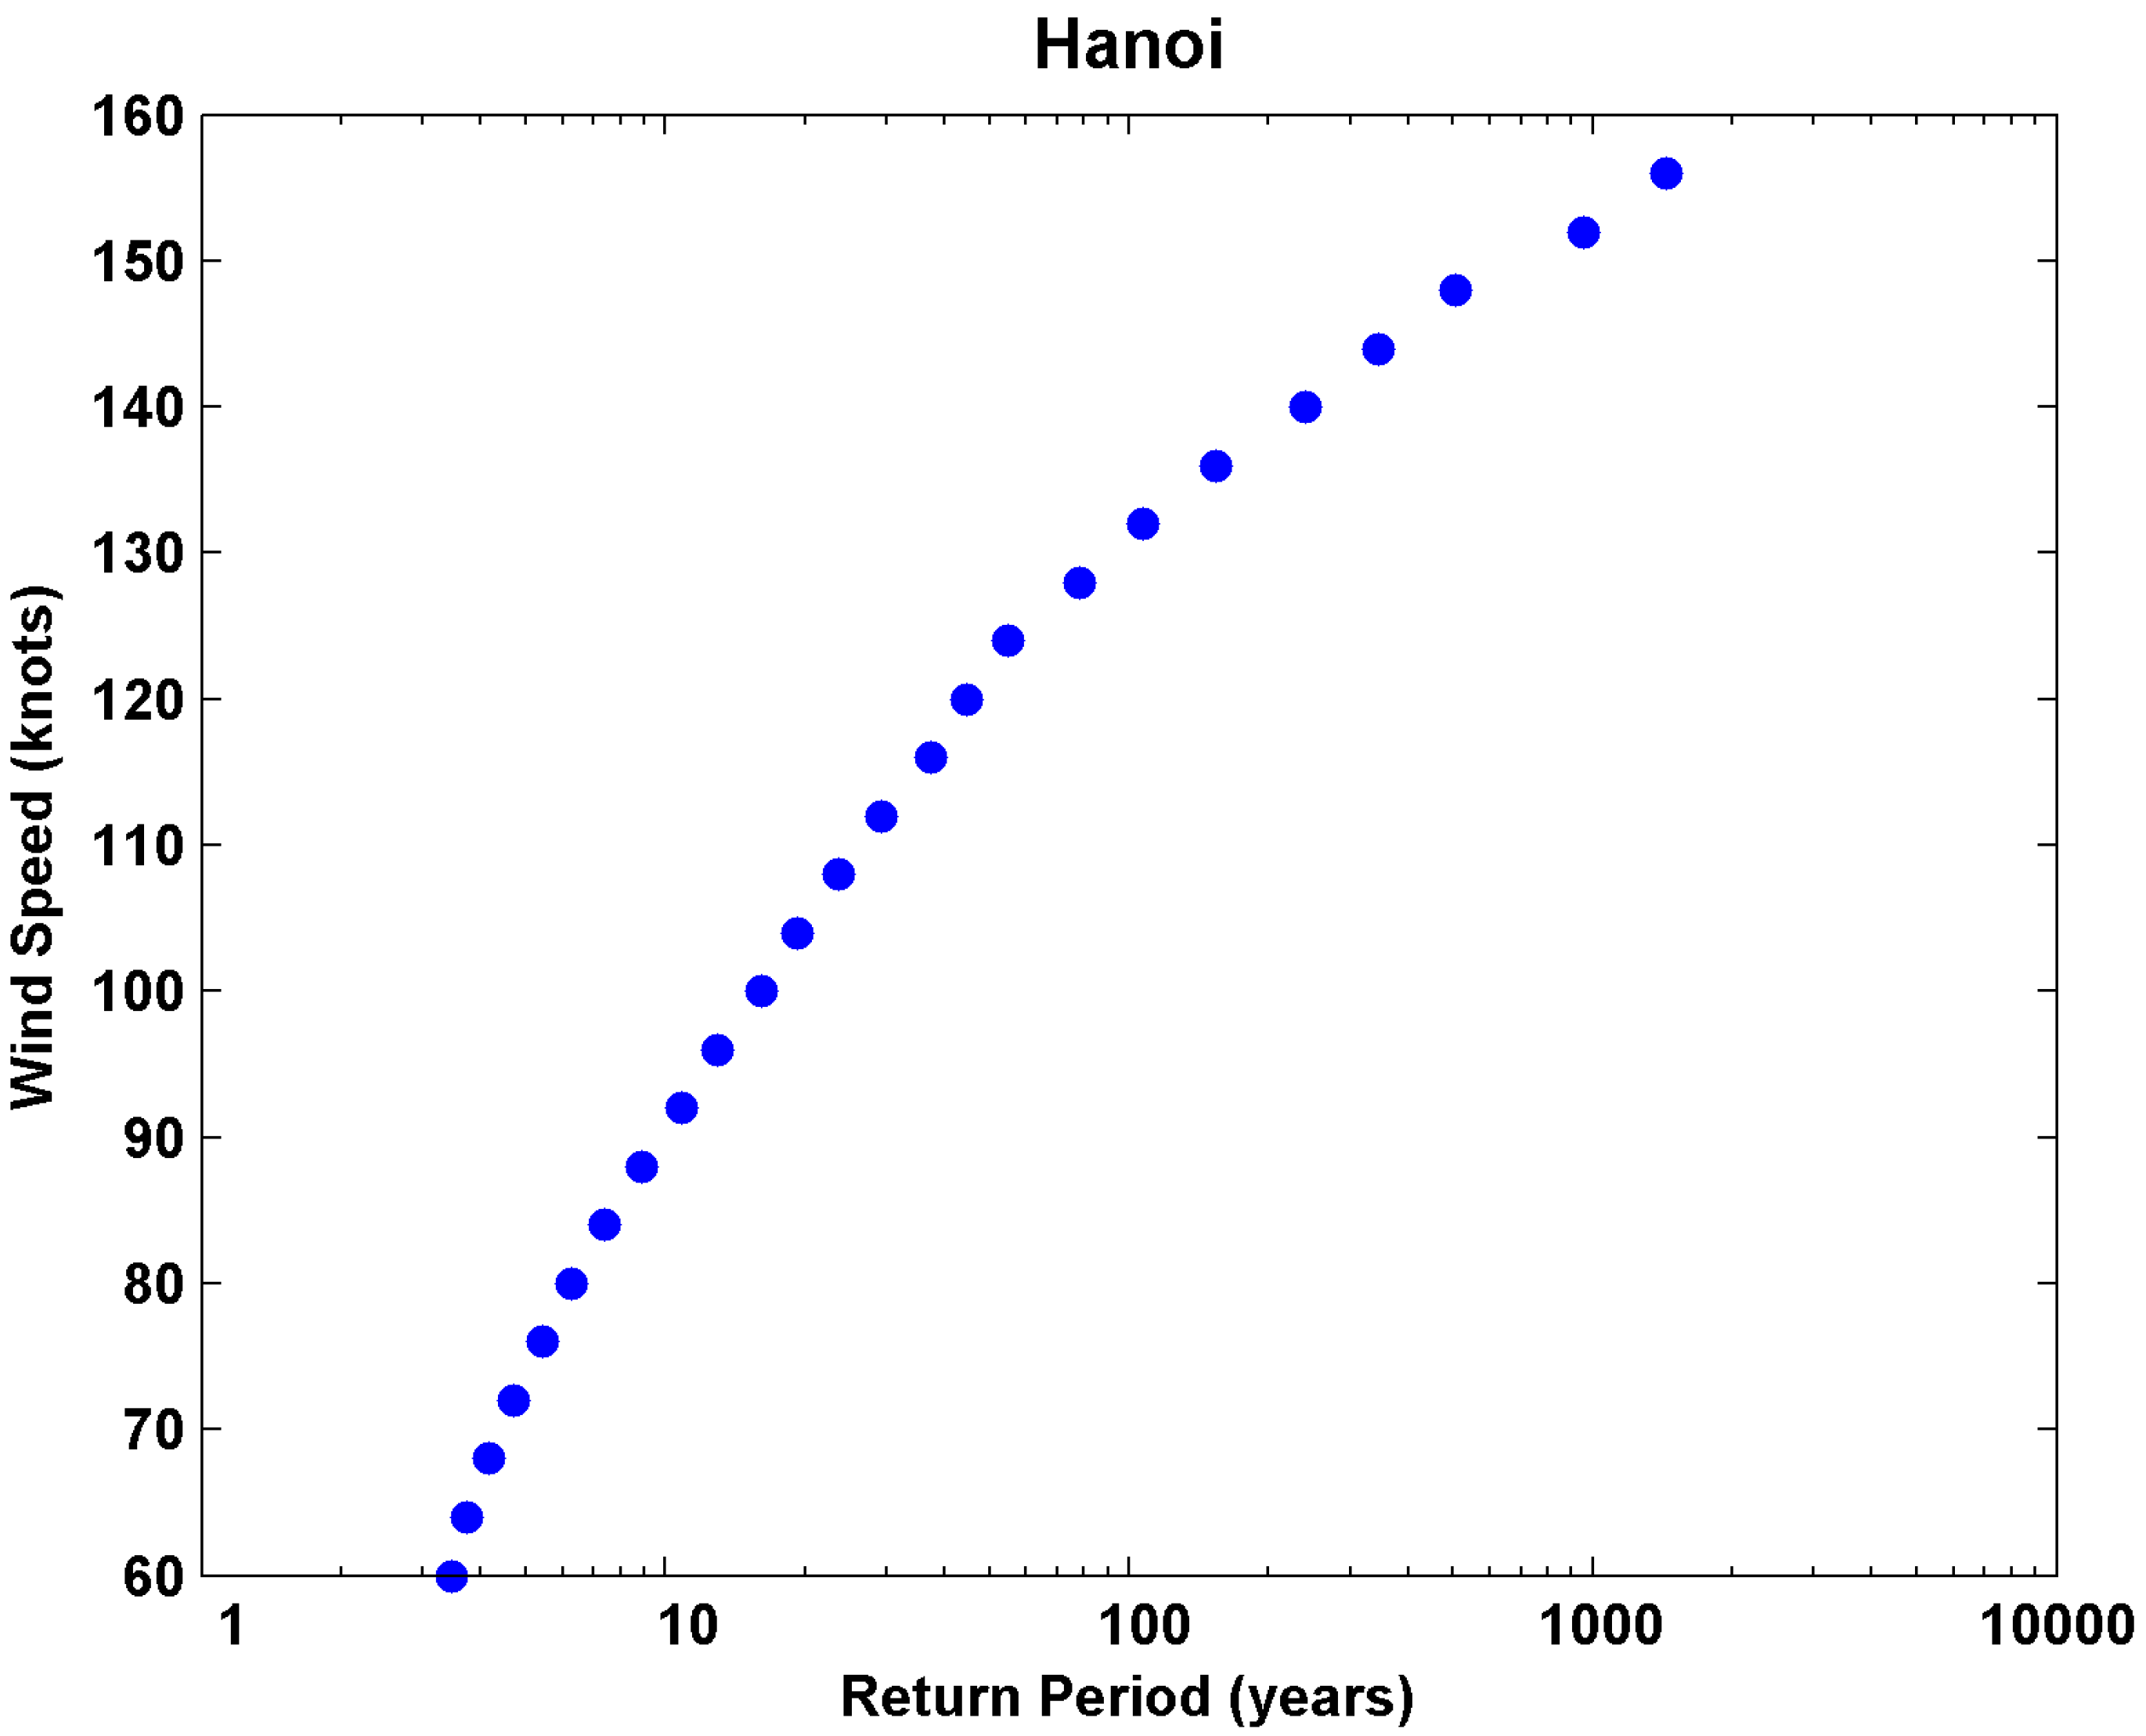
18]. A filter is applied to the track generator to select tracks coming within a specified distance of a point or region of interest, such as a city or county. In filtering the tracks, a record is kept of the number of discarded tracks; this is used to calculate the overall frequency of storms that pass the filter. In this work, we selected the city center of Hanoi, Vietnam as the focal point; as a result, we also capture storms that have major impacts seaward of Hanoi, in the Red River delta.
Once the tracks have been generated, a coupled hurricane intensity model is then run along each of the selected tracks to produce a history of maximum wind speeds. This model is driven by monthly climatological, atmospheric and upper ocean thermodynamic information, but also considers ambient environmental wind shear that varies randomly in time according to the procedure described previously. This coupled deterministic model produces a maximum wind speed and a radius of maximum winds, but, owing to the coarse spatial resolution of the model, the detailed aspects of the radial storm structure are not used here. Instead, we use an idealized radial wind profile, fitted to the numerical output, to estimate maximum winds at fixed points in space away from the storm center. The overall method has been described in [
18].
For each point of interest, the intensity model is run in a Monte Carlo simulation with several thousand iterations to produce desired statistics, such as wind speed exceedance probabilities. Computationally, synthetic track generation and intensity models impose little cost relative to a full scale model. This allows us to explicitly simulate a large number of storms to resolve extreme events that would otherwise be difficult to do.
3.2. The SLOSH Model
SLOSH is a computerized numerical model developed by the Federal Emergency Management Agency (FEMA), United States Army Corps of Engineers (USACE) and the National Weather Service (NWS) to estimate storm surge depths resulting from historical, hypothetical or predicted hurricanes by taking into account a storm’s pressure, size, forward speed, forecast track, wind speeds and topographical data. The model consists of a set of physics equations describing fluid motion and surge height that are applied to a location’s shoreline in order to relate wind fields to surge height [
3].
Graphical output from the model displays color-coded storm surge heights for a particular area. Heights are presented as feet above the model’s reference level, the National Geodetic Vertical Datum (NGVD), which is the elevation reference for most maps. Among other things, the SLOSH model is driven by wind fields derived from the storm generation techniques presented above.
Storm surge generation calculations are applied to a specific location’s shoreline, incorporating the unique bay and river configurations, water depths, bridges, roads and other physical features. The SLOSH model resolves flow through obstacles, inland inundation, overtopping and coastal reflections of surges. Astronomic tide and initial water level anomalies are also included as model forcing, but we performed simulations without this forcing and initialize with a quiescent ocean. The SLOSH model is computationally efficient and ensembles of runs can quickly be simulated. However the model doesn’t explicitly include the impacts of waves, river flows or rain flooding. In this research we used the SLOSH model, with no further extensions or developments and without coupling to wave action, restricting our study to purely that of surge. A 150 × 110 polar grid was developed for the Red River Delta from the available topography and bathymetry data. Due to the polar nature of this grid, the resolution of the gridcells ranged between 1.5 km and 10 km, with a ten second time step.
The SLOSH model is generally accurate within plus or minus 20%. For example, if the model calculates a peak storm surge of 10 feet for the event, users can expect the observed peak to range from 8 to 12 feet. The model accounts for astronomical tides, which can add significantly to the water height, by specifying an initial tide level, but does not include rainfall amounts, riverflow or wind-driven waves. Only wind-driven “stillwater” flood heights are accounted for in SLOSH.
The point of a hurricane’s landfall is crucial to determining which areas will be inundated by the storm surge. This information is also available from the storm generation methods discussed above, but the synthetic nature of those results and the fact that it represents a simulation, adds uncertainty to the landfall location. We apply the SLOSH model as its developers suggest: to define the potential maximum surge for a location when the precise landfall location is uncertain.
3.3. SLR Overlay and Effect on Storm Return Times
Storm surge results from the base case, which has no SLR, provide a probabilistic representation of the likelihood of storm surge heights at a particular point on the coast over a future period. We use this to define the probabilistic behavior of storm surges in the twenty-first century. This storm surge exceedance curve can then be modified to reflect the effects of sea level rise on surge height by increasing the surge height by the height of relative SLR for all points along the curve. This method does not capture potential non-linear effects of SLR on surge height and has been shown to underestimate the effect when nonlinearities are also considered [
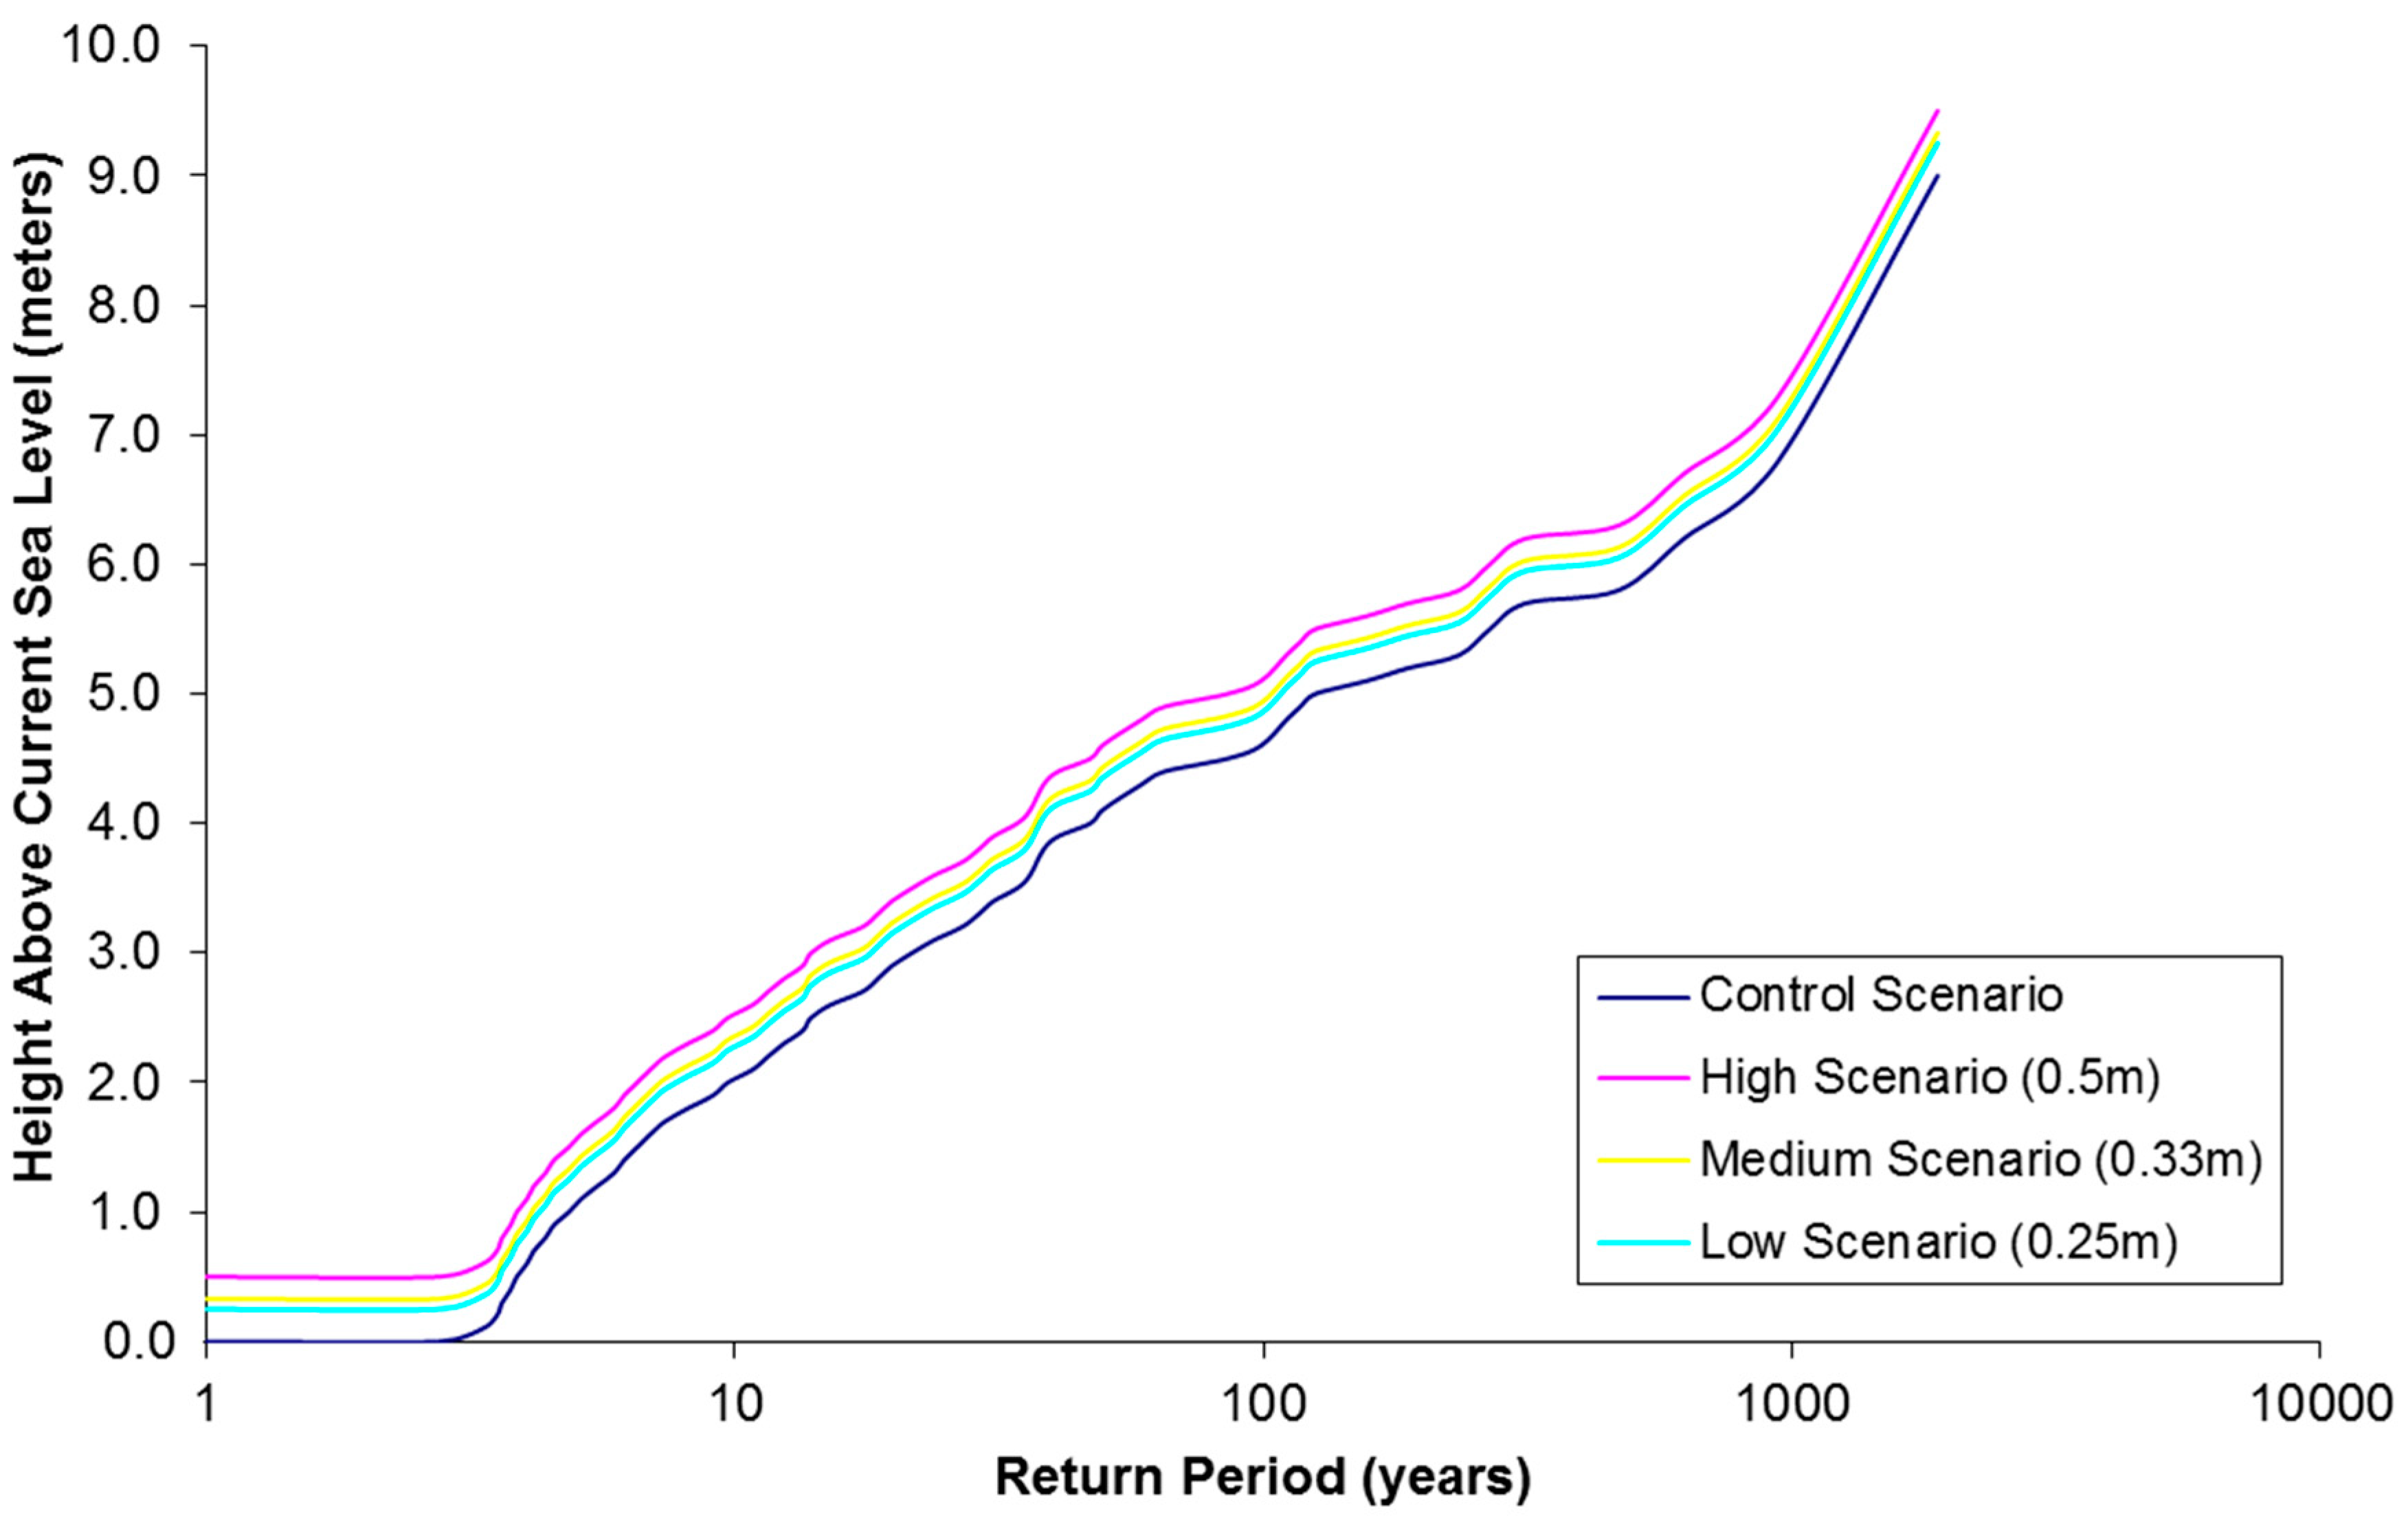
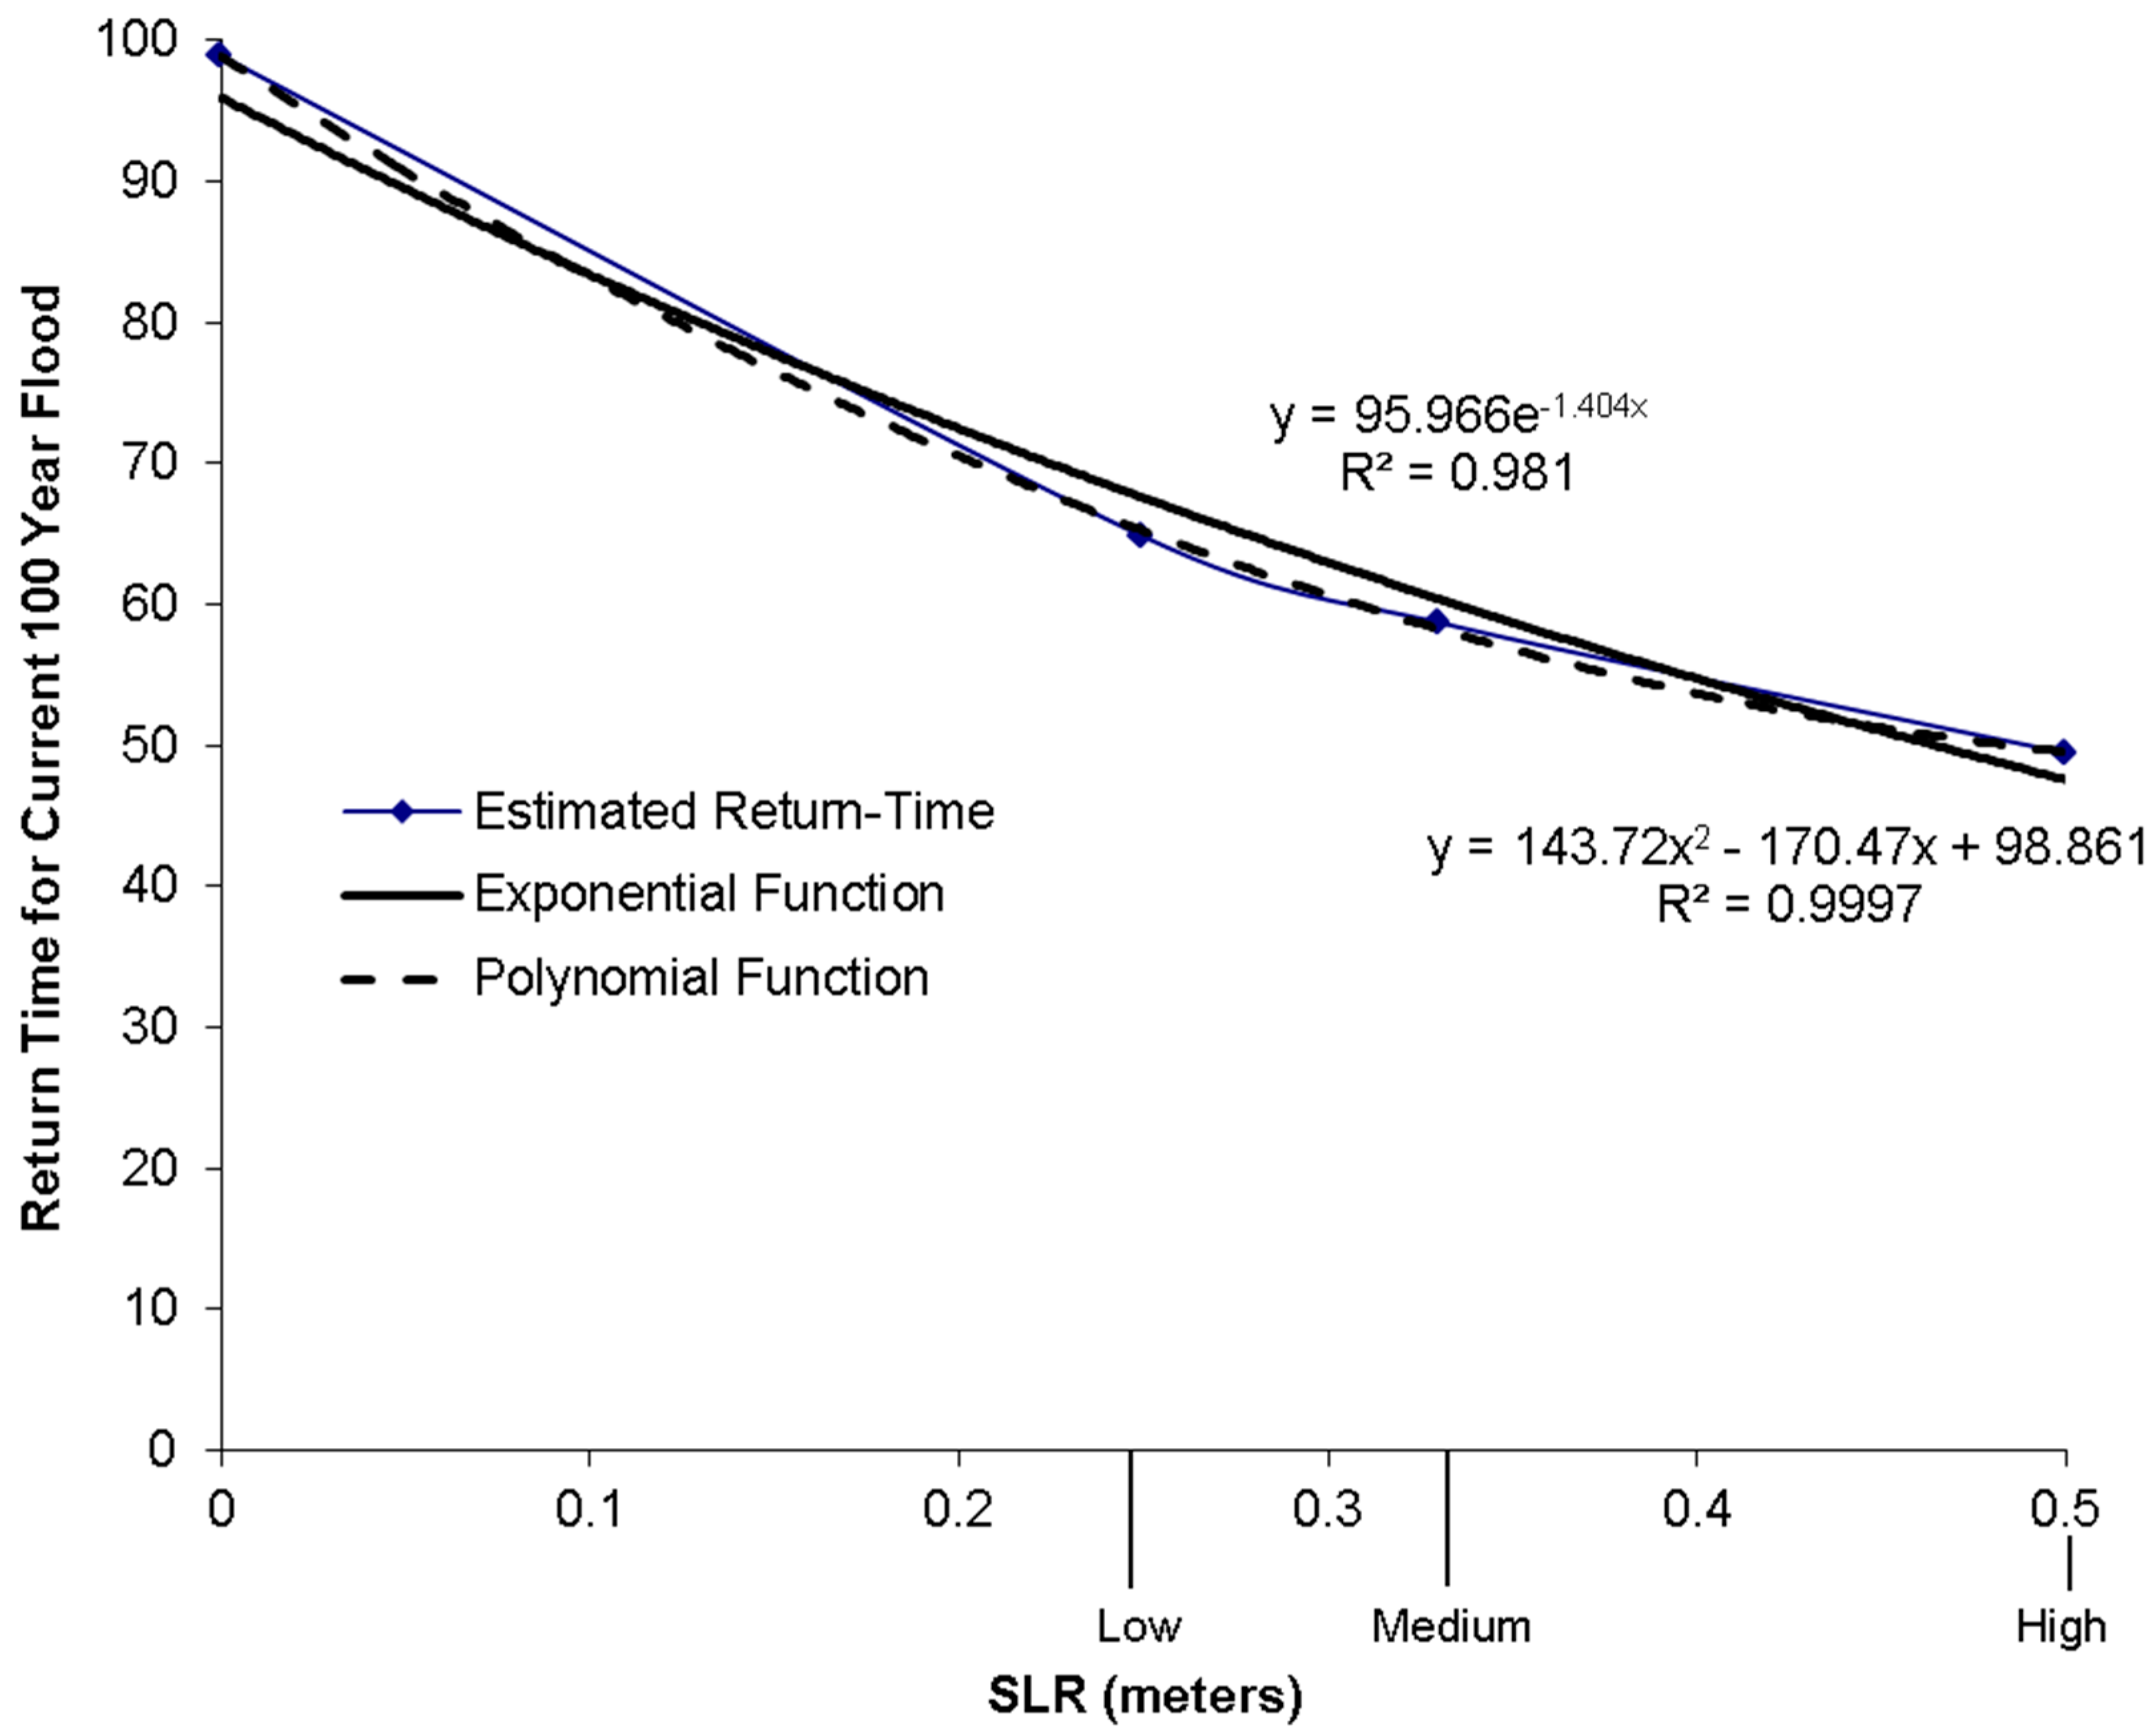
24]. The effect of SLR on the effective return time can then be quantified. The modification of the exceedance curve is done for three future SLR scenarios through 2050.
The impact of land subsidence was also used to assess impact sea levels in the region. Unfortunately, no tide gauge data were available for locations within the Red River delta. However, using mean sea level trend data for nearby Hon Dau from the Permanent Service for Mean Sea Level [
25], subsidence in the Red River delta was approximated at 0.03 m (30 millimeters) by 2050. A change this small will not have a measurable impact on our results and was thus ignored.
The three SLR scenarios used are low (0.25 m), medium (0.33 m) and high (0.5 m). Similar scenarios were used in analyses supporting the World Bank’s Economics of Adaptation of Climate Change (EACC) [
26] project, which were based on the work of the Intergovernmental Panel on Climate Change (IPCC) Fourth Assessment (AR4, [
27,
28]). In this case, we have updated the scenarios to reflect the newer IPCC AR5 results [
29], as well as other sources where SLR scenarios are suggested, primarily to support coastal adaptation planning. The low scenario is based on the midpoint of the range of general circulation model (GCM) results reported in the IPCC AR5 ([
29], see Table TS.1); these are generally acknowledged to represent a low SLR scenario because they exclude the effects of dynamic ice-sheet melting [
30,
31]. The high scenario is based on multiple sources, including the high mid-century results from [
1]; our interpretation of a mid-century result from [
31], representing the 95th percentile result for a high emissions scenario (the Representative Concentration Pathway 8.5); high scenarios from NOAA [
32] used in the US National Climate Assessment; a scenario used in a recent US assessment [
33], and high scenarios derived from Vermeer and Rahmstorf (2009) [
34] used in Neumann
et al. (2014) [
21]. The medium scenario represents a midpoint between the low and high scenarios.
A function for the effect of SLR on effective return time is generated through the following procedure. First, the storm surge height for a particular “reference storm” in the base case data is identified. In the results presented below, we chose the 100-year storm surge height without any sea level rise as our reference. We then examine the modified exceedance curves of the three SLR scenarios to determine the modified return period for that storm surge height under each of three scenarios. Finally, least squares regression techniques are used to define the relationship between return period and SLR magnitude. Typically this relationship is not linear.
5. Discussion and Conclusions
This analysis demonstrates a proof of concept for storm surge and SLR risk analysis for a region of Vietnam. Although several data limitations were identified, a method was developed for assessing spatial risk from SLR and storm surges with existing data in the Red River delta region of Vietnam. In the current baseline scenario without SLR, our simulated storm generation activity and storm surge modeling showed that cyclones in the Red River delta region are infrequent but severe. Modifying the storm surge exceedance curve from the current baseline scenario to account for SLR modestly increases risk. Cumulative areas affected across several land uses and relative GDP values were used to estimate the economic impact and increased risk from sea level rise and storm surges. Due to limitations of the elevation data used, affected areas could only be defined at the integer level. Therefore, only minimal distinction can be made between areas impacted by SLR versus those impacted by storm surge.
The implications of this analysis for adapting the Red River delta to future climate change present an interesting direction for future research. Options for adapting the area to address these potentially severe risks of inundation and episodic flooding include constructing or reinforcing new and existing levees, constructing dike systems to address episodic flooding of agricultural areas, elevating vulnerable structures in low-lying areas subject to episodic flooding and planning a managed retreat from the areas which face the most severe risks. Alternative adaptation approaches could utilize financial mechanisms, such as crop and property insurance programs. Such programs, like all others, should be carefully analyzed for their financial and economic implications. In the case of financial mechanisms, care should be taken to ensure that insurance premiums are both actuarially fair and, if they are to be effective, reasonably affordable.
Typically, such strategies would be analyzed and recommended only after a benefit-cost assessment that considered the value of the lands and structures at risk, the costs of adaptation and the timing of the risks. Such an approach is demonstrated for areas of the USA, for example (see [
21,
37]). Unfortunately, elevation and economic data currently available for this study in Vietnam was not sufficiently well resolved to support such an analysis. With continued cooperation and dialogue among local stakeholders and analysts, creative approaches to filling these data gaps could be designed that would support better risk and adaptation analyses, which may, in turn, support more refined adaptation planning in this region.


