Article

Influence of Precipitation on Maize Yield in the Eastern United States

1
College of Economics and Management, Sichuan Agricultural University, Ya'an, Sichuan 625014, China
2
Plant Science Department, Agriculture Science College, The Pennsylvania State University, University Park, PA 16802, USA 3 Resource and Environment Research Institute, Chengdu land and Resource Information Center, Chengdu, Sichuan 610072, China
*
Author to whom correspondence should be addressed.
Sustainability 2015, 7(5), 5996-6010; https://doi.org/10.3390/su7055996
Submission received: 11 February 2015 / Revised: 21 April 2015 / Accepted: 29 April 2015 / Published: 15 May 2015

Abstract

:
Most General Circulation Models predict more infrequent but larger precipitation events in the eastern United States combined with a warmer climate. This could have a negative effect on maize production. To understand the sensitivity of maize production to future changes in precipitation, we analyzed growing season precipitation and average state maize yields in the eastern United States for the period 1963–2011. Growing season precipitation did not show a strong trend during this period. However, crop yields increased at 3.90% in the southern, 2.62% in the central, and 2.31% in the northern part of the eastern United States, which we attributed to technology and management. To separate technology and management effects from precipitation variability, we corrected maize yields for these yield trends. We then correlated maize yield corrected for advances in technology and management with total growing season precipitation and precipitation in the critical month of pollination, from the regional to state scale. Maize yield - precipitation relationships showed that moisture shortage rather than excess determined maize yield in the Eastern United States. The relationship between total growing season precipitation-maize yield was stronger in the southeastern than in the northeastern U.S., but the critical month precipitation-maize yield relationship was stronger in the northeastern than in the southeastern U.S. If climate model predictions are accurate and total growing season precipitation will not decrease in this region but variability will, it is likely that maize yields in the northeastern U.S. will be more significantly affected.

1. Introduction

Climate change is expected to affect U.S. precipitation quantity and distribution. Most General Circulation Models forecast slightly increased precipitation that will fall during more intense and hence infrequent events in the eastern United States [1,2,3,4,5]. The trends of climate change are generally increased precipitation at middle and high latitudes of this region where precipitation amount and intensity will very likely increase in the winter and spring. Moreover, evapotranspiration is also expected to increase as temperature increases, especially at low latitudes of the eastern U.S. [6,7]. The changing precipitation patterns are likely to affect crop yields depending on when the crop is grown (winter vs. summer), crop water requirements, critical periods of water stress, and the crop’s ability to withstand water stress. Of particular importance will be the impacts of climate change on maize production because of its prominence among U.S. crops and importance for global food production. Fourty-five percent of U.S. crop receipts were from maize in 2011 [8], whereas 40% of world maize is produced in the U.S. [9]. Most maize in the U.S. is grown without irrigation and depends on natural rainfall, particularly in the maize growing season and especially during the critical time of pollination [10,11,12,13,14,15,16,17,18,19,20,21,22]. As reported by Andresen et al. [23], low precipitation and resulting moisture stress were the chief limitations to maize yields in the period 1895–1996 in Michigan, Minnesota, and Wisconsin. Hu and Buyanovsky [24] reported that within-season variations and distribution of the growing season precipitation variations and distribution of the growing season precipitation from 1895–1998 greatly affected yield variability of maize in Missouri. Wilhelm et al. [25] found that maize yield from 1986–2001 increased with less spring and more summer precipitation in Nevada, suggesting excessive spring precipitation and insufficient summer precipitation are major constraints for maximum maize yield. Malone et al. [26], using 1960–2006 data in Iowa, showed that high (low) yields are due in part to sufficient (insufficient) rainfall in the second half of the growing season. Studies show that although total growing season precipitation affects maize yields the crop is particularly sensitive to drought stress during pollination [27,28]. Though other factors such as population, temperature, fertility level, plant management, and insect, disease, and weed pressures also affect maize yield, [29,30], there is no doubt that precipitation is one of the most important factors controlling maize yield. The objectives of this study were therefore to (1) analyze the characteristics of growing season precipitation during the second half of the 20th century in the Eastern United States; (2) determine if there was a relationship between growing season precipitation and/or precipitation in the month of pollination and maize yield in this region.

2. Materials and Methods
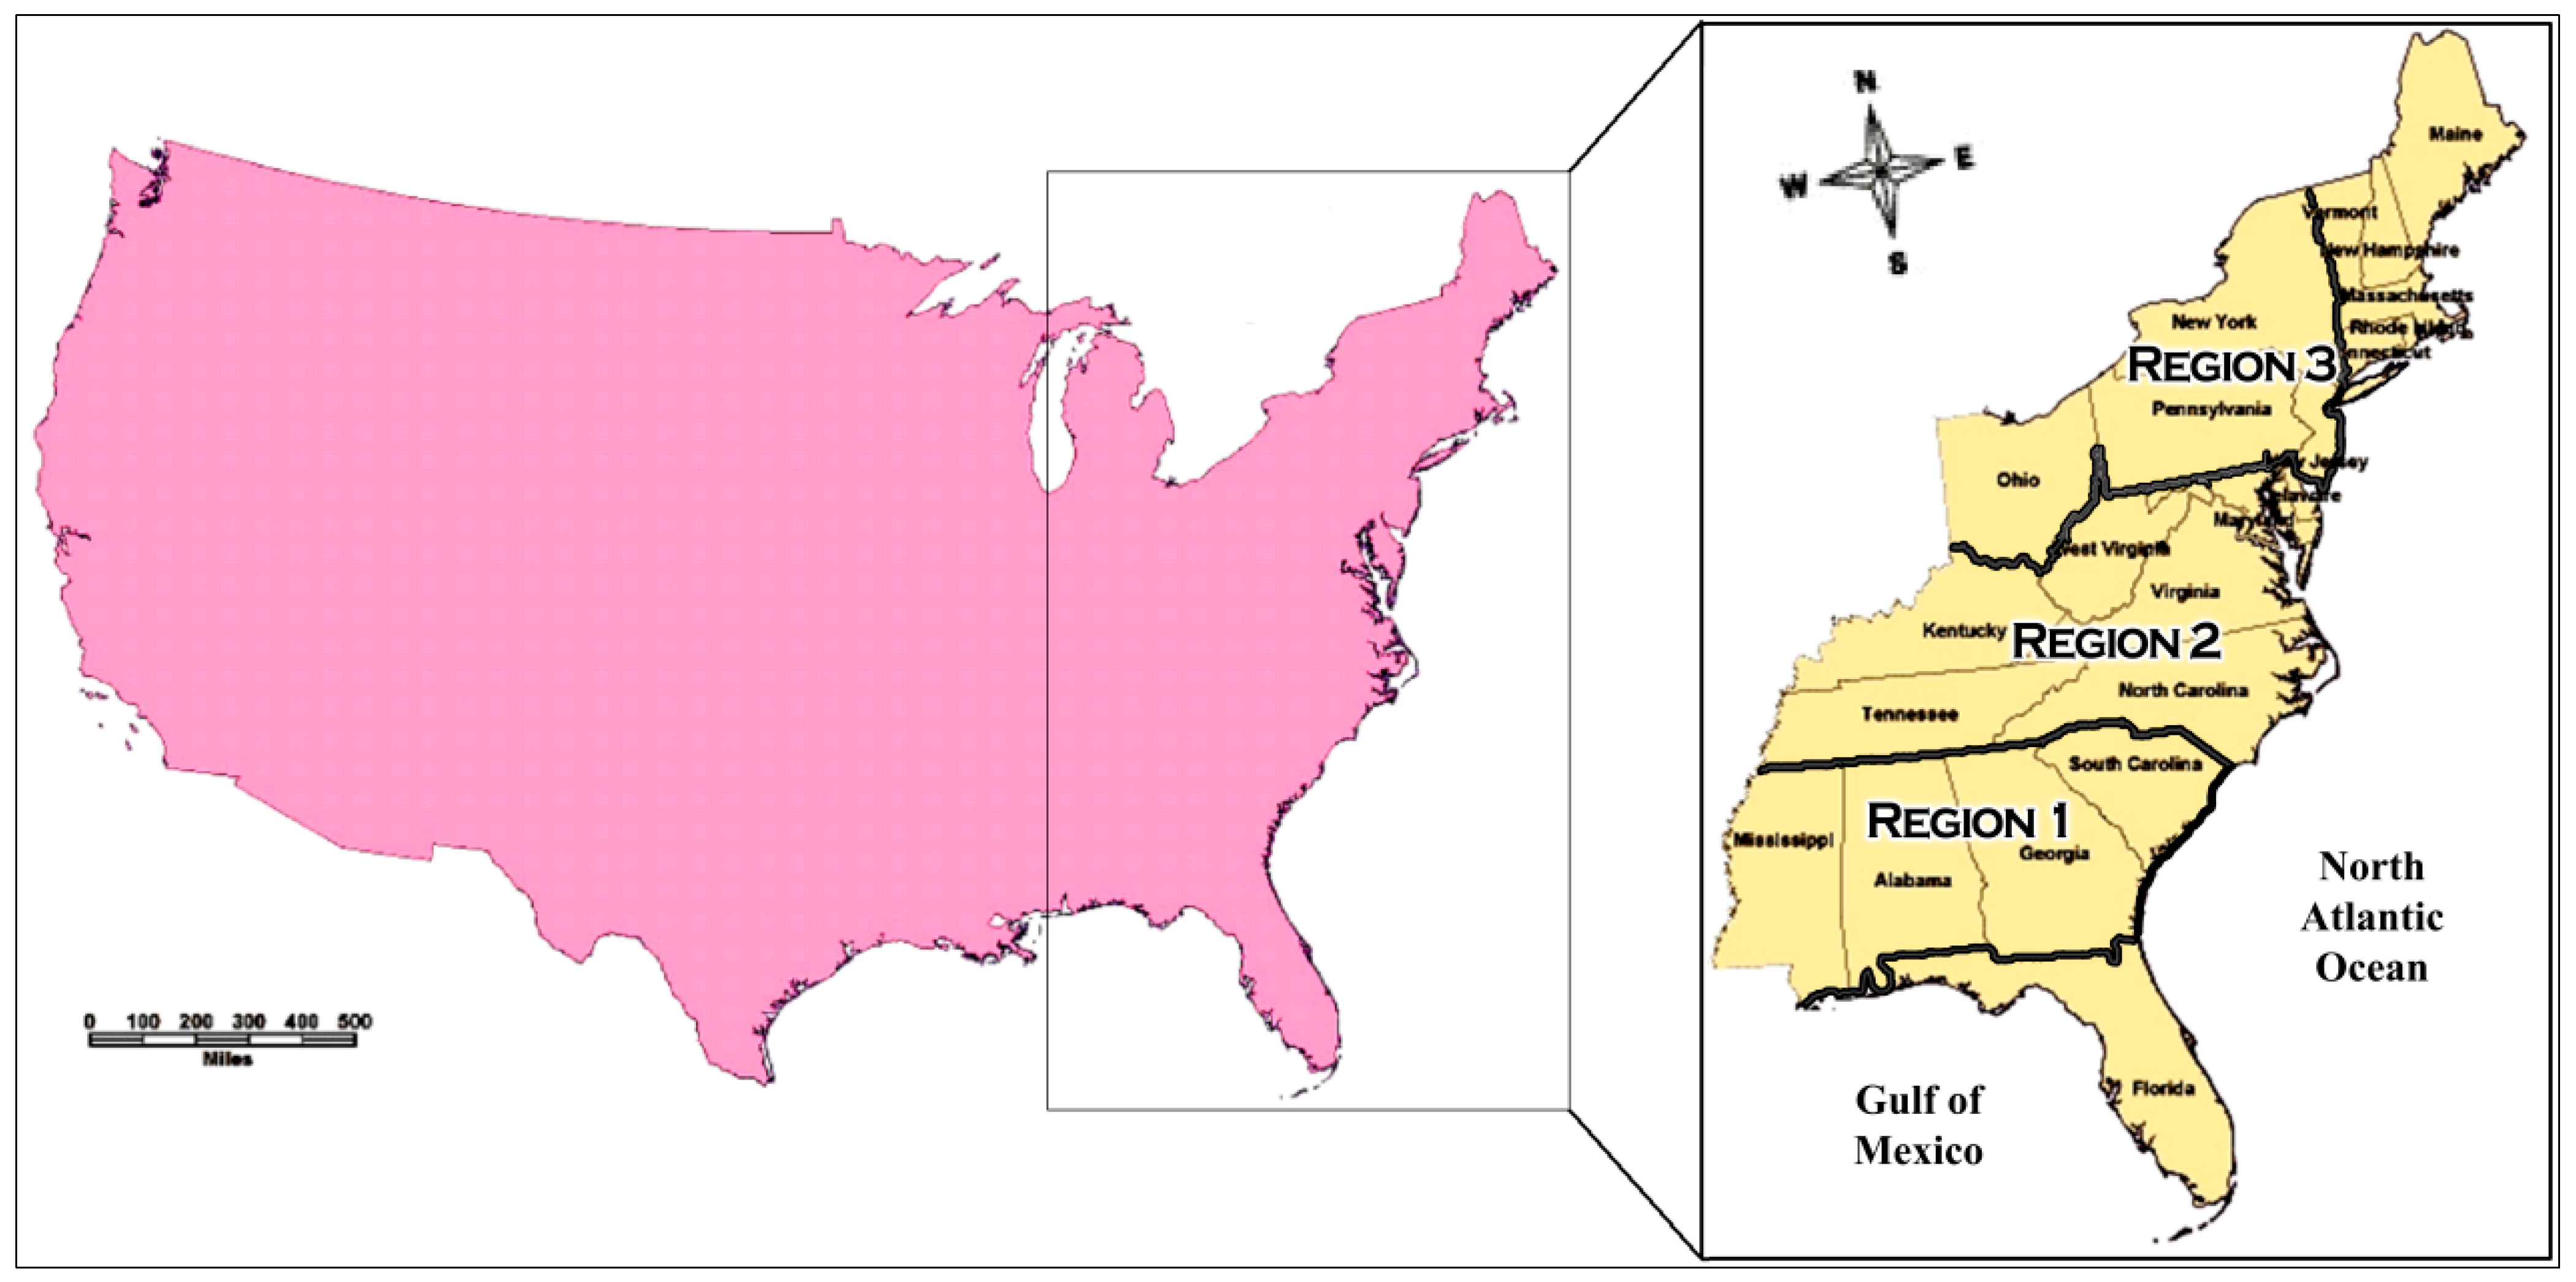
2.1. Study Area

The study was conducted in the eastern United States, situated between 30°12ʹ and 45°1ʹ northern latitudes and between 71°51ʹ and 91°39ʹ western longitudes. We chose 14 important maize-producing states in this region (Figure 1) responsible for about 1/8 of the total maize production of the country (United States Department of Agriculture’s National Agricultural Statistics Service (USDA-NASS)). Average monthly precipitation in the entire region ranges from 117 mm in the month of July to 86 mm in the month of October. Regional precipitation is relatively uniformly distributed over the months of the year, with slightly higher precipitation normally occuring in the months of May to July which received more than 1/3 of the total annual precipitation during the last 50 years. Because average monthly precipitation is relatively uniformly distributed over the year the maize growing season is primarily affected by latitudinal temperature differences in the study area. Correspondingly, the study area was divided into three regions based on typical maize planting and harvesting time (Table 1). Based on USDA-NASS data, the maize growing period was estimated to be from early March to late September in Region 1, from April to October in Region 2, and from May to November in Region 3, with the critical precipitation month during which most maize pollinates being May in Region 1, June in Region 2, and July in Region 3.
Figure 1. The eastern United States and three maize growing period regions defined in this study.Region 1 includes Alabama, Georgia, Mississippi and South Carolina; Region 2 includes Delaware, Maryland, Kentucky, North Carolina, Tennessee and Virginia (West Virginia was excluded because of its small maize acreage); and Region 3 includes New Jersey, New York, Ohio and Pennsylvania.
Sustainability 07 05996 g001
Table 1. Maize growing season precipitation in the eastern United States (1963–2011).
RegionStateAverage (mm)Maximum Monthly (mm)Minimum Monthly (mm)Coefficient of Variation
Region 1 (maize growing season from March to September)Alabama8623561744%
Georgia7863131644%
Mississippi8463652146%
South Carolina7832751944%
Average8193651644%
Region 2 (maize growing season from April to October)Delaware697350450%
Maryland685280446%
Kentucky727298442%
North Carolina776338342%
Tennessee7592650.841%
Virginia682266242%
Average7213500.844%
Region 3 (maize growing season from May to November)New Jersey714435850%
New York678216834%
Ohio632233640%
Pennsylvania690285638%
Average678435642%

2.2. Data Sources and Statistical Analyses

Average monthly precipitation data for each state for each year from 1963–2011 were obtained from the National Climatic Data Center (NOAA-NCDC). Growing-season precipitation was calculated by summing precipitation during the maize production season. Average regional precipitation was calculated by averaging state precipitation in that region. Maize yield data used in this article were the average state yields reported by the United States Department of Agriculture’s National Agricultural Statistics Service (USDA-NASS). For regional analyses, the average of maize yield of the states in that region was calculated. Precipitation was correlated with yield using a general linear univariate model and variance analysis. All statistical analyses were performed using Minitab version 16.

3. Results

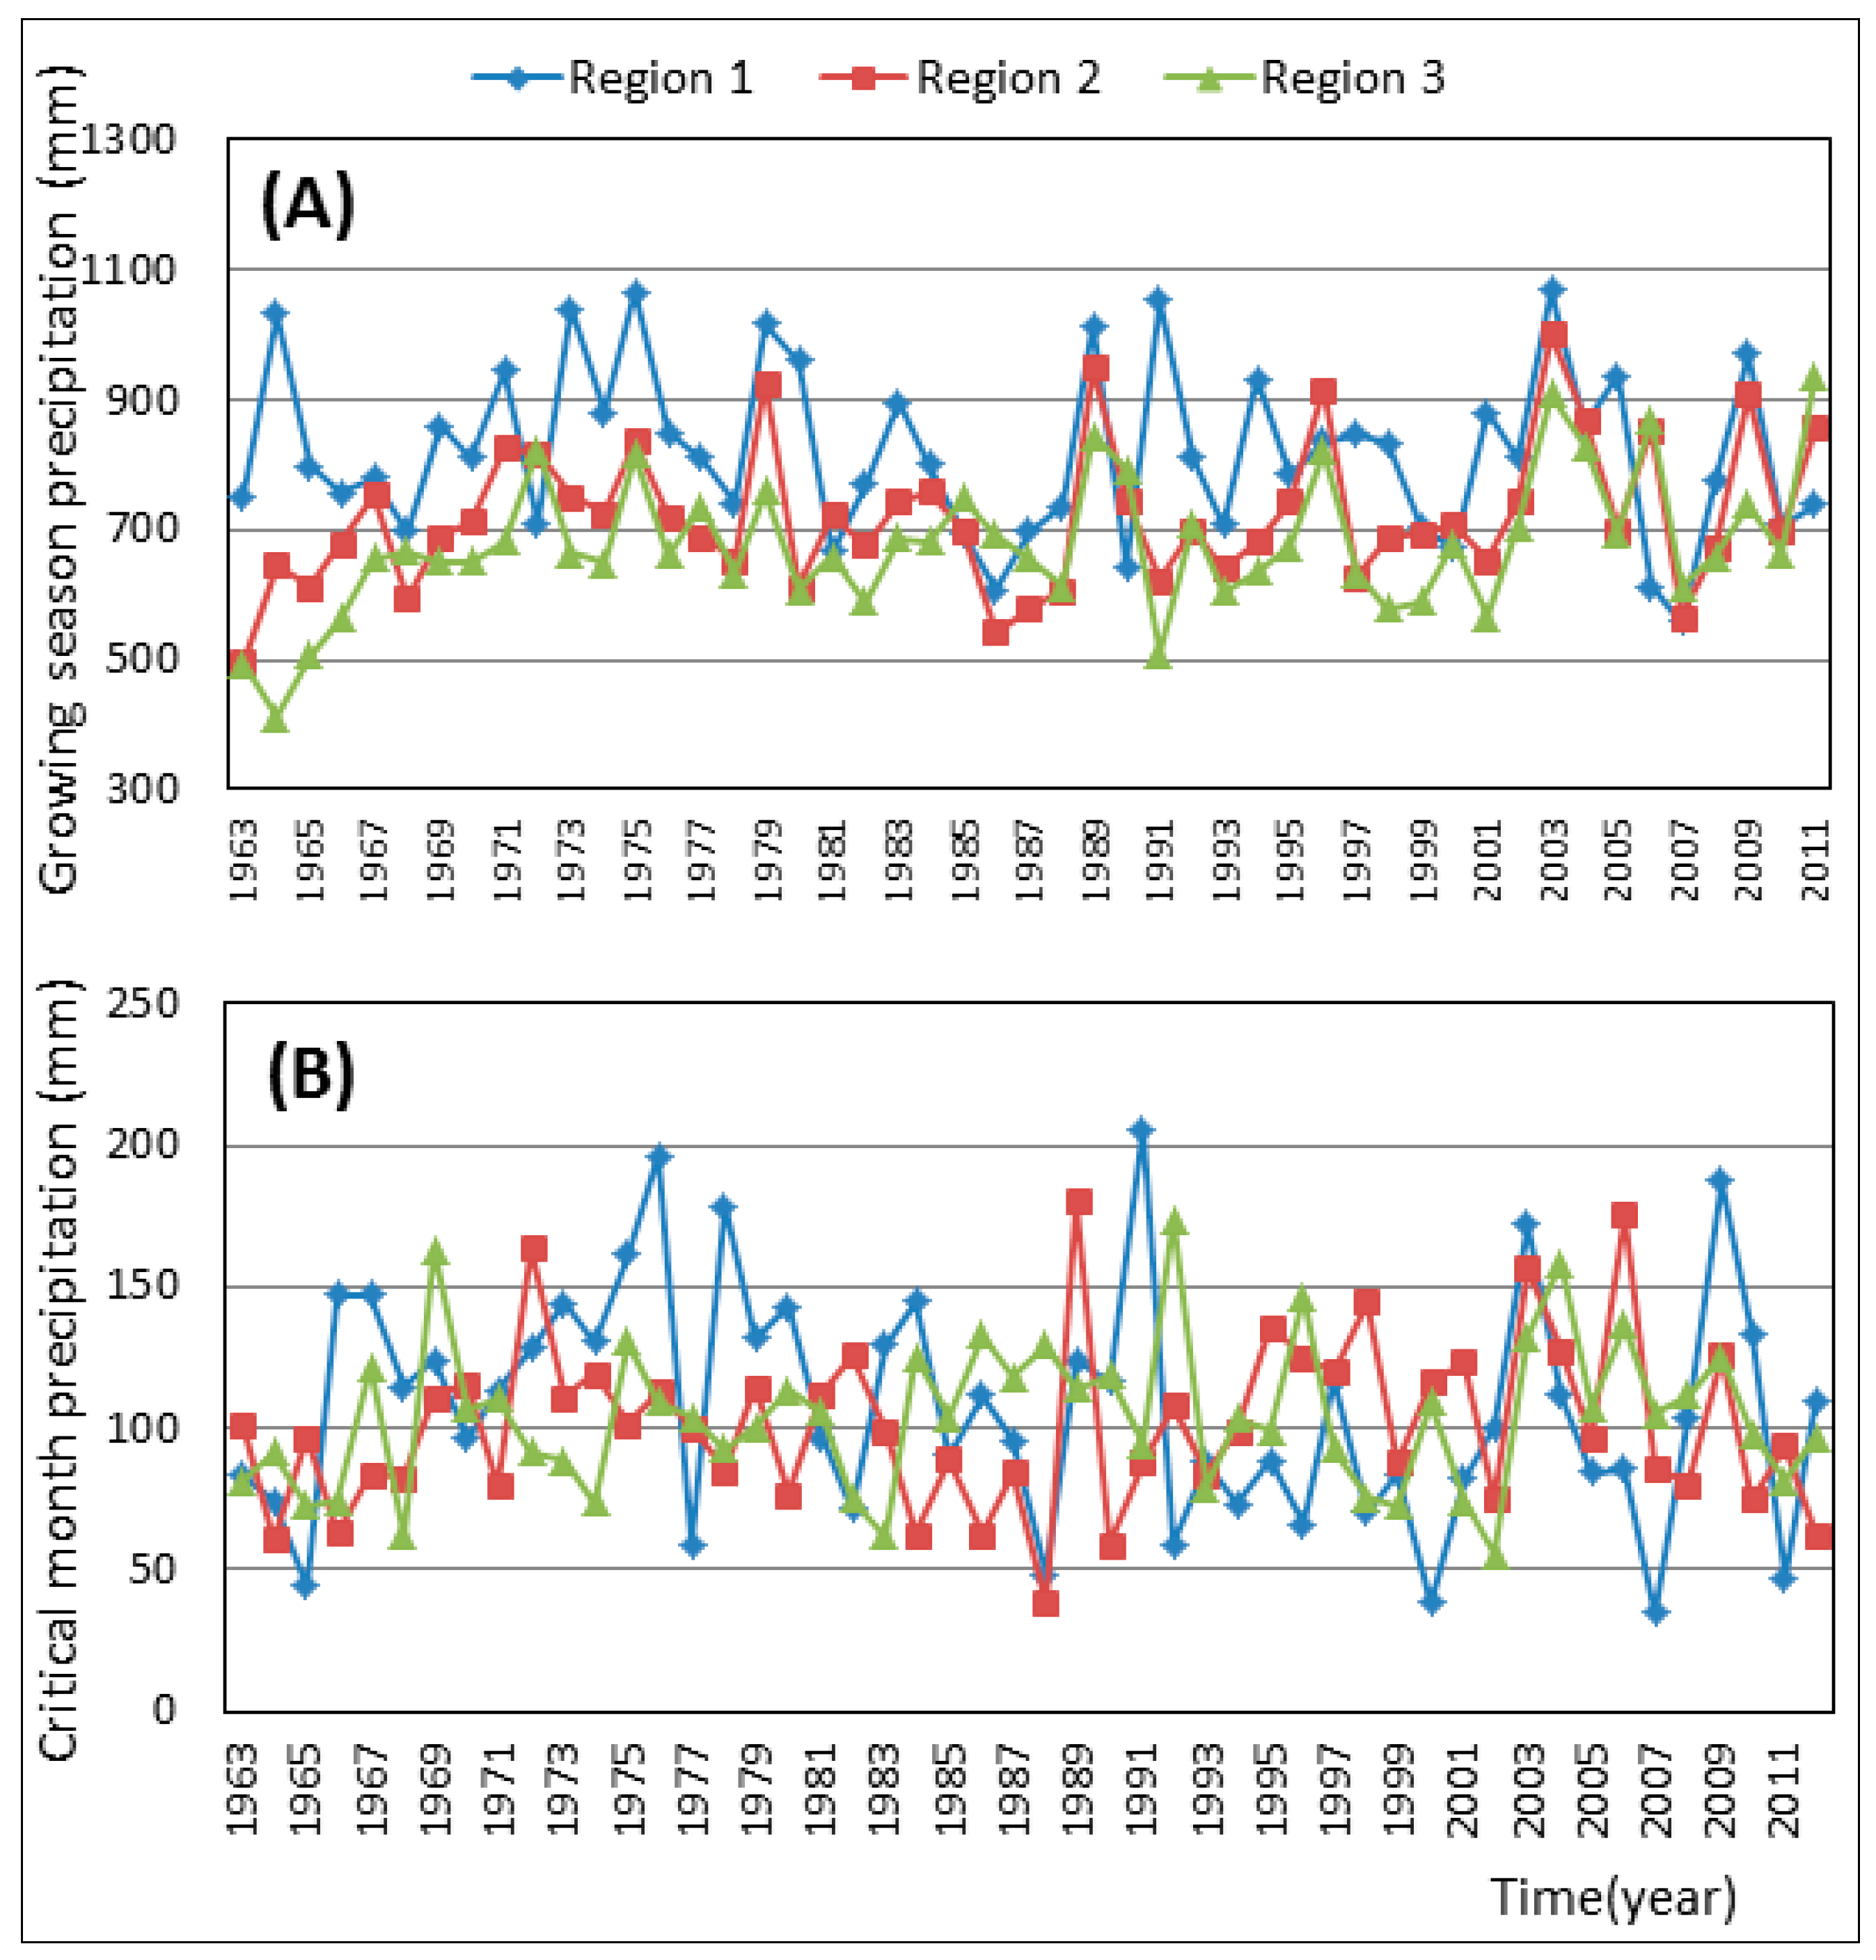
3.1. Precipitation Characteristics of Maize Growing Season

Total growing season precipitation and monthly precipitation during the maize growing season in the three regions for the period 1963–2011 is shown in Table 1. During 1963 to 2011, average total growing season precipitation was 819 mm in Region 1, 721 mm in Region 2, and 678 mm in Region 3. The average monthly growing season precipitation was 105–140 mm in Region 1, 90–115 mm in Region 2, and 85–105 mm in Region 3. The state with the highest growing season precipitation was Alabama (862 mm). The state with the lowest growing season precipitation was Ohio (632 mm). The monthly precipitation in the maize growing season varied greatly in different states, years, and months, with the highest (435 mm) in New Jersey in Region 3 in August 2011 and the lowest (0.8 mm) in Tennessee in Region 2 in October 1963. The coefficients of variation of monthly growing season precipitation ranged from 34% to 50% in the eastern U.S. during the study period, with the highest CV in New Jersey in Region 3 and Delaware in Region 2, and the lowest in New York in Region 3.
Maize growing season precipitation in Regions 1, 2 and 3 for the period 1963–2011 is shown in Figure 2. Growing season precipitation varied considerably among the three regions. The annual-average of total growing season precipitation was highest in Region 1 (819 mm) and varied from 559 mm (2002) to 1068 mm (1996). In Region 2, annual-average of total growing season precipitation was intermediate (721 mm) with a maximum of 1001 mm (2003), and a minimum of 497 mm (1963). Annual-average of growing season precipitation was lowest in Region 3 (678 mm), with a high of 936 mm (2011) and a low of 412 mm (1964).
Figure 2. Maize growing season precipitation and critical month precipitation in three regions of the eastern United States (1963–2011). Region 1 includes Alabama, Georgia, Mississippi and South Carolina; Region 2 includes Delaware, Maryland, Kentucky, North Carolina, Tennessee and Virginia (but not West Virginia); and Region 3 includes New Jersey, New York, Ohio and Pennsylvania. The critical month of maize production is in May in Region 1, June in Region 2 and July in Region 3.
Sustainability 07 05996 g002
The precipitation in the critical month when most maize pollination would take place in the three regions is shown in Figure 2. The critical month precipitation did not vary much among the regions. Average critical month precipitation in Region 1 was 108 mm which was higher than that in the other regions, and varied from 16 mm (2007) to 280 mm (1991). In Region 2, the critical month precipitation averaged 103 mm with a maximum of 280 mm (1972), and a minimum of 15 mm (1988). In Region 3, critical month precipitation averaged 104 mm, with a maximum of 244 mm (1969) and a minimum of 36 mm (1999).

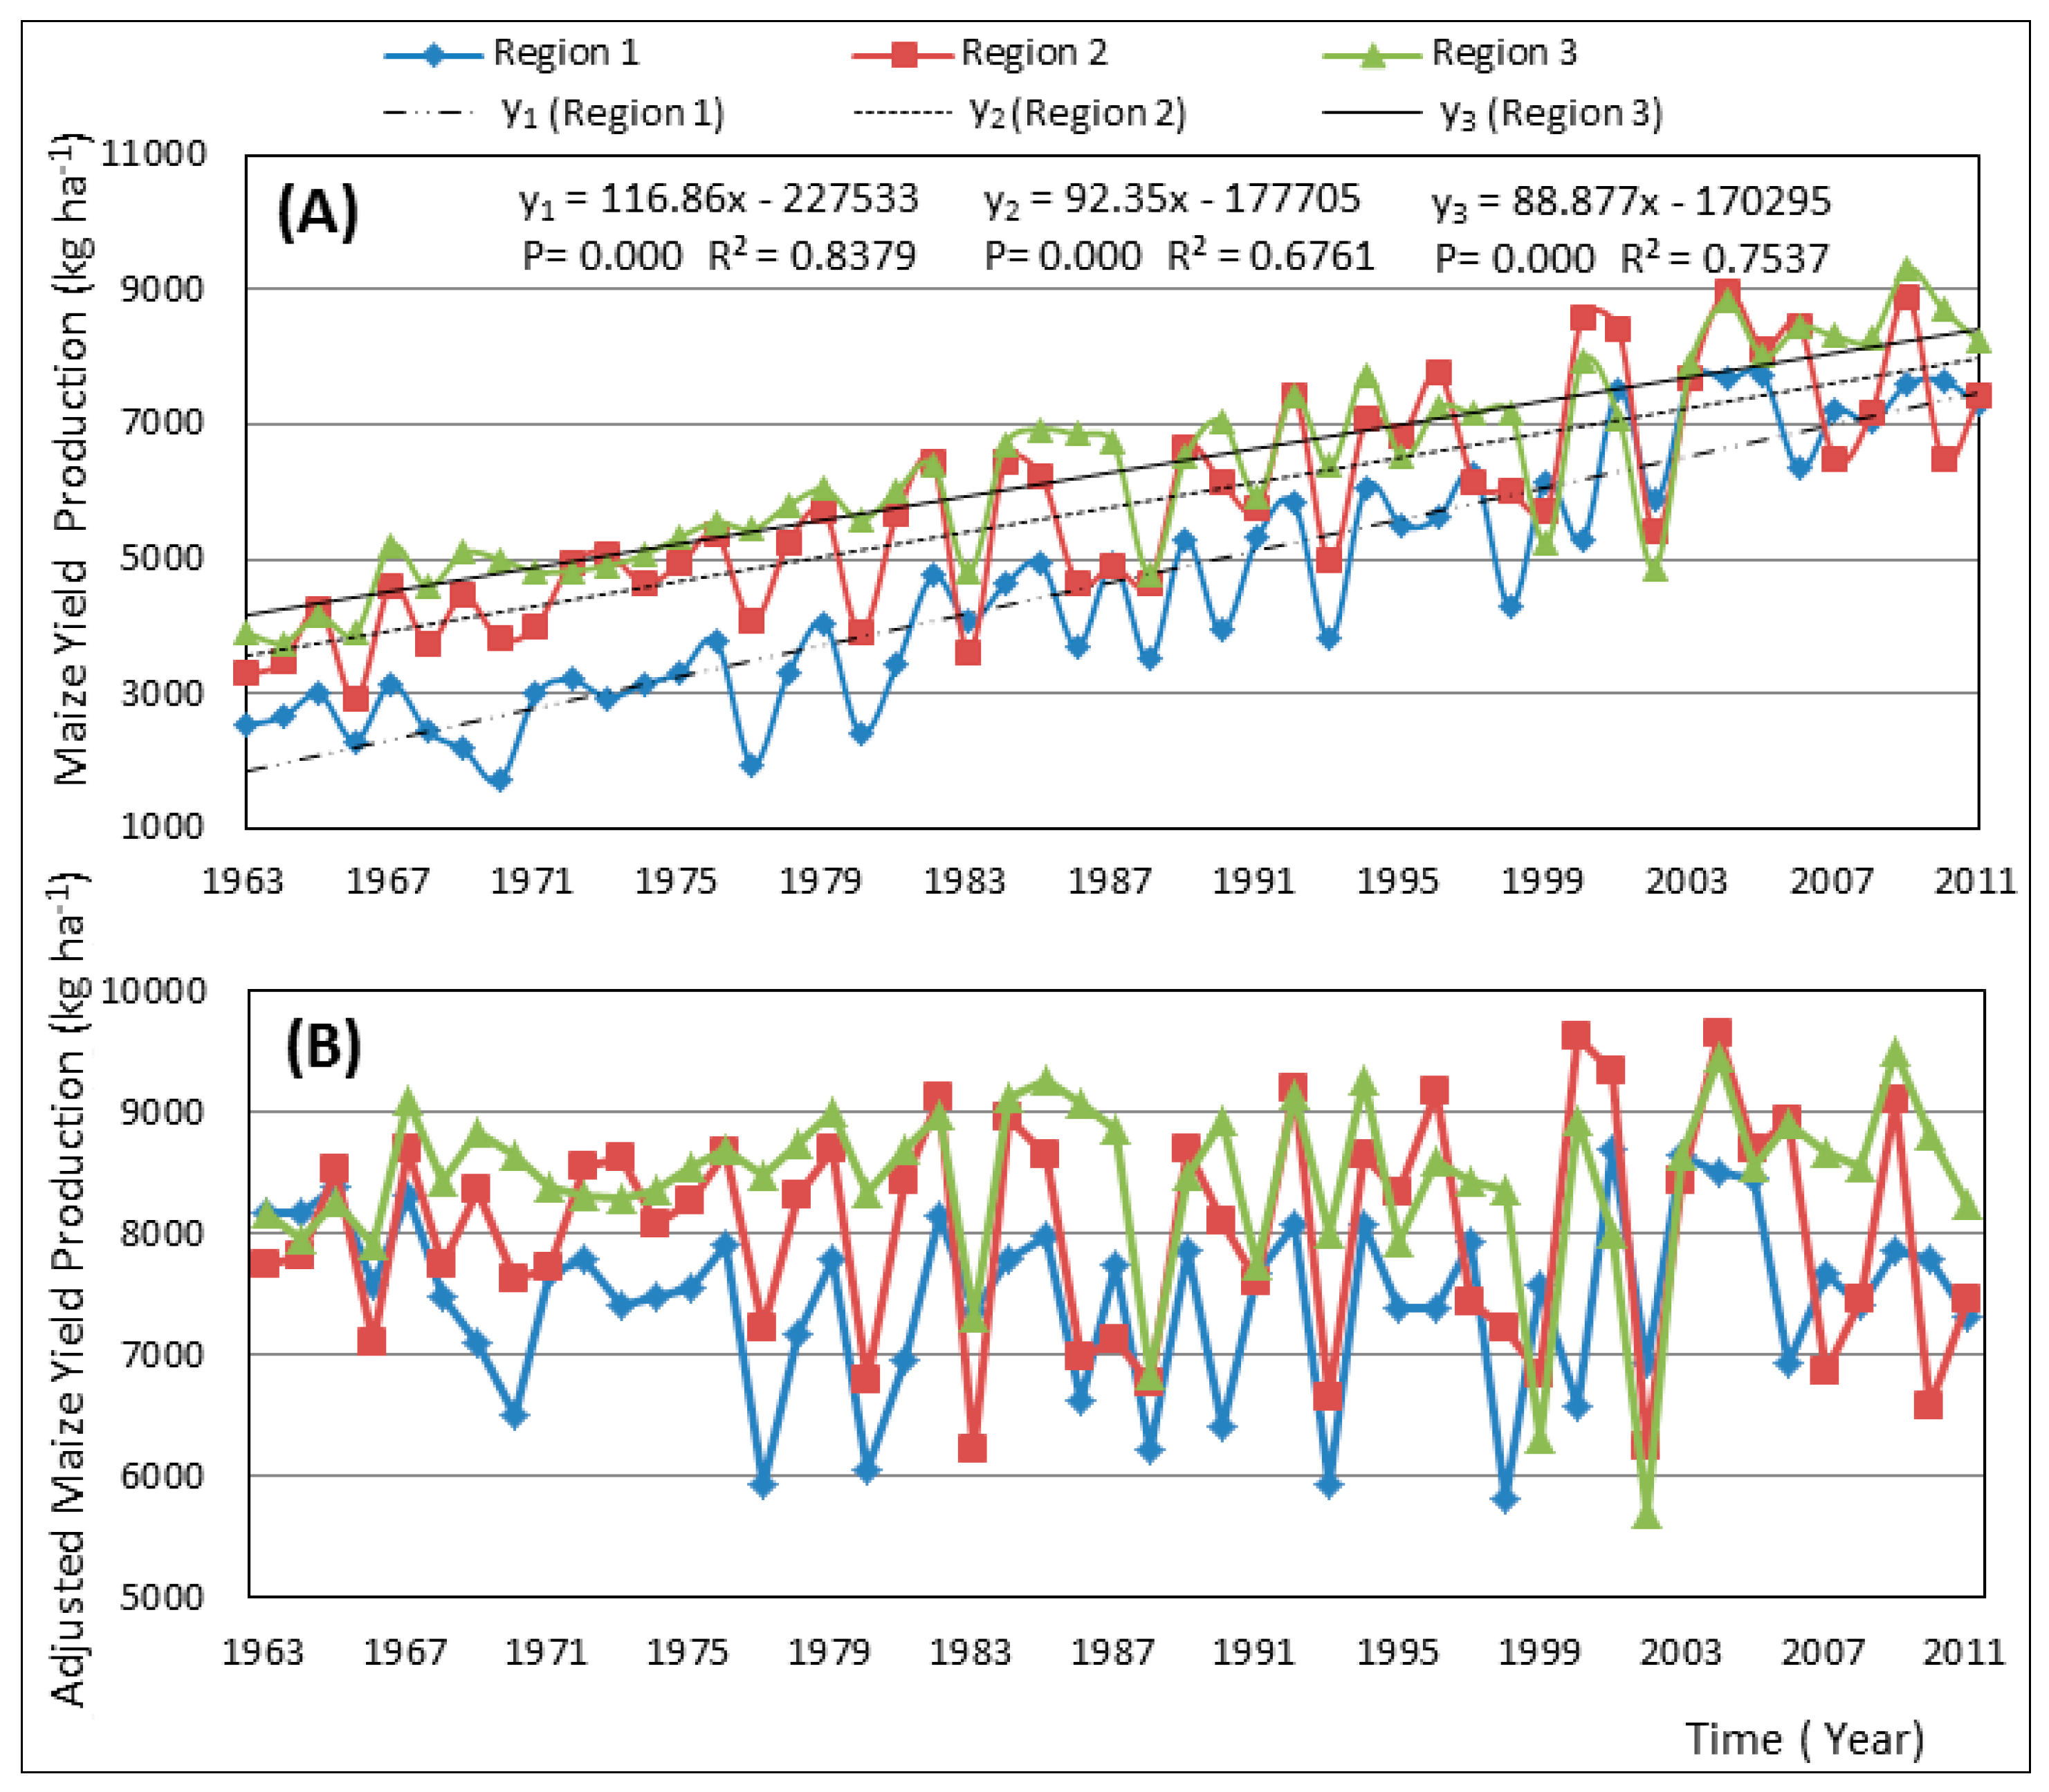
3.2. Maize Yield Trends

Mean maize yields in each region are shown in Figure 3. Although the yields fluctuated, the mean yield increased substantially in each region between 1963 and 2011. Over 48 years, maize yield increased from 2542 kg·ha−1 to 7297 kg·ha−1 in region 1, from 3295 kg·ha−1 to 7438 kg·ha−1 in Region 2, and from 3907 kg·ha−1 to 8238 kg·ha−1 in region 3. Maize yield increased on average 3.90% per year in Region 1, 2.62% per year in Region 2, and 2.31% in Region 3. Although average yields were much lower in Region 1 than in Regions 2 and 3 in 1963, maize yield differences between the regions have become smaller over the years. Maize yield changes over time were probably not the result of changing precipitation, because total growing season precipitation decreased in Region 1 and increased in Regions 2 and 3 and critical month precipitation decreased in Region 1 but increased or remained constant in Regions 2 and 3 (see Section 3.1). Therefore, it is likely that other factors explain the faster rate of yield increase in Region 1, such as temperature trends, or faster improvements in maize genetics and crop management practices and their adoption.
Figure 3. Maize yield & technology and management-adjusted maize yield in three regions of the Eastern United States (1963–2011). Region 1 includes Alabama, Georgia, Mississippi and South Carolina; Region 2 includes Delaware, Maryland, Kentucky, North Carolina, Tennessee and Virginia (but not West Virginia); and Region 3 includes New Jersey, New York, Ohio and Pennsylvania.
Sustainability 07 05996 g003
To calculate the relationship between precipitation and maize yield variability, the effect of long-term technology and management improvements on maize yields had to be removed from the analysis. We therefore used the residuals from the linear regression analysis of yield over time to calculate the technology-adjusted yield values (Equation (1)). This normalized the yields respective to the year 2011. The subsequent analysis in the study will use yield variations from this linear trend [19].
Y i j = Y i j + ( T n T i ) × K j
where Y i j is the adjusted maize yield in region (j) in year (i), Y i j the maize yield for region (j) in year (i), T n the final year of the study period (2011), T i year i, K j the slope of the maize yield vs. year linear regression line in region (j).
Adjusted maize yield in the three regions of study area are shown in Figure 3.

3.3. Precipitation-Maize Yield Relationships

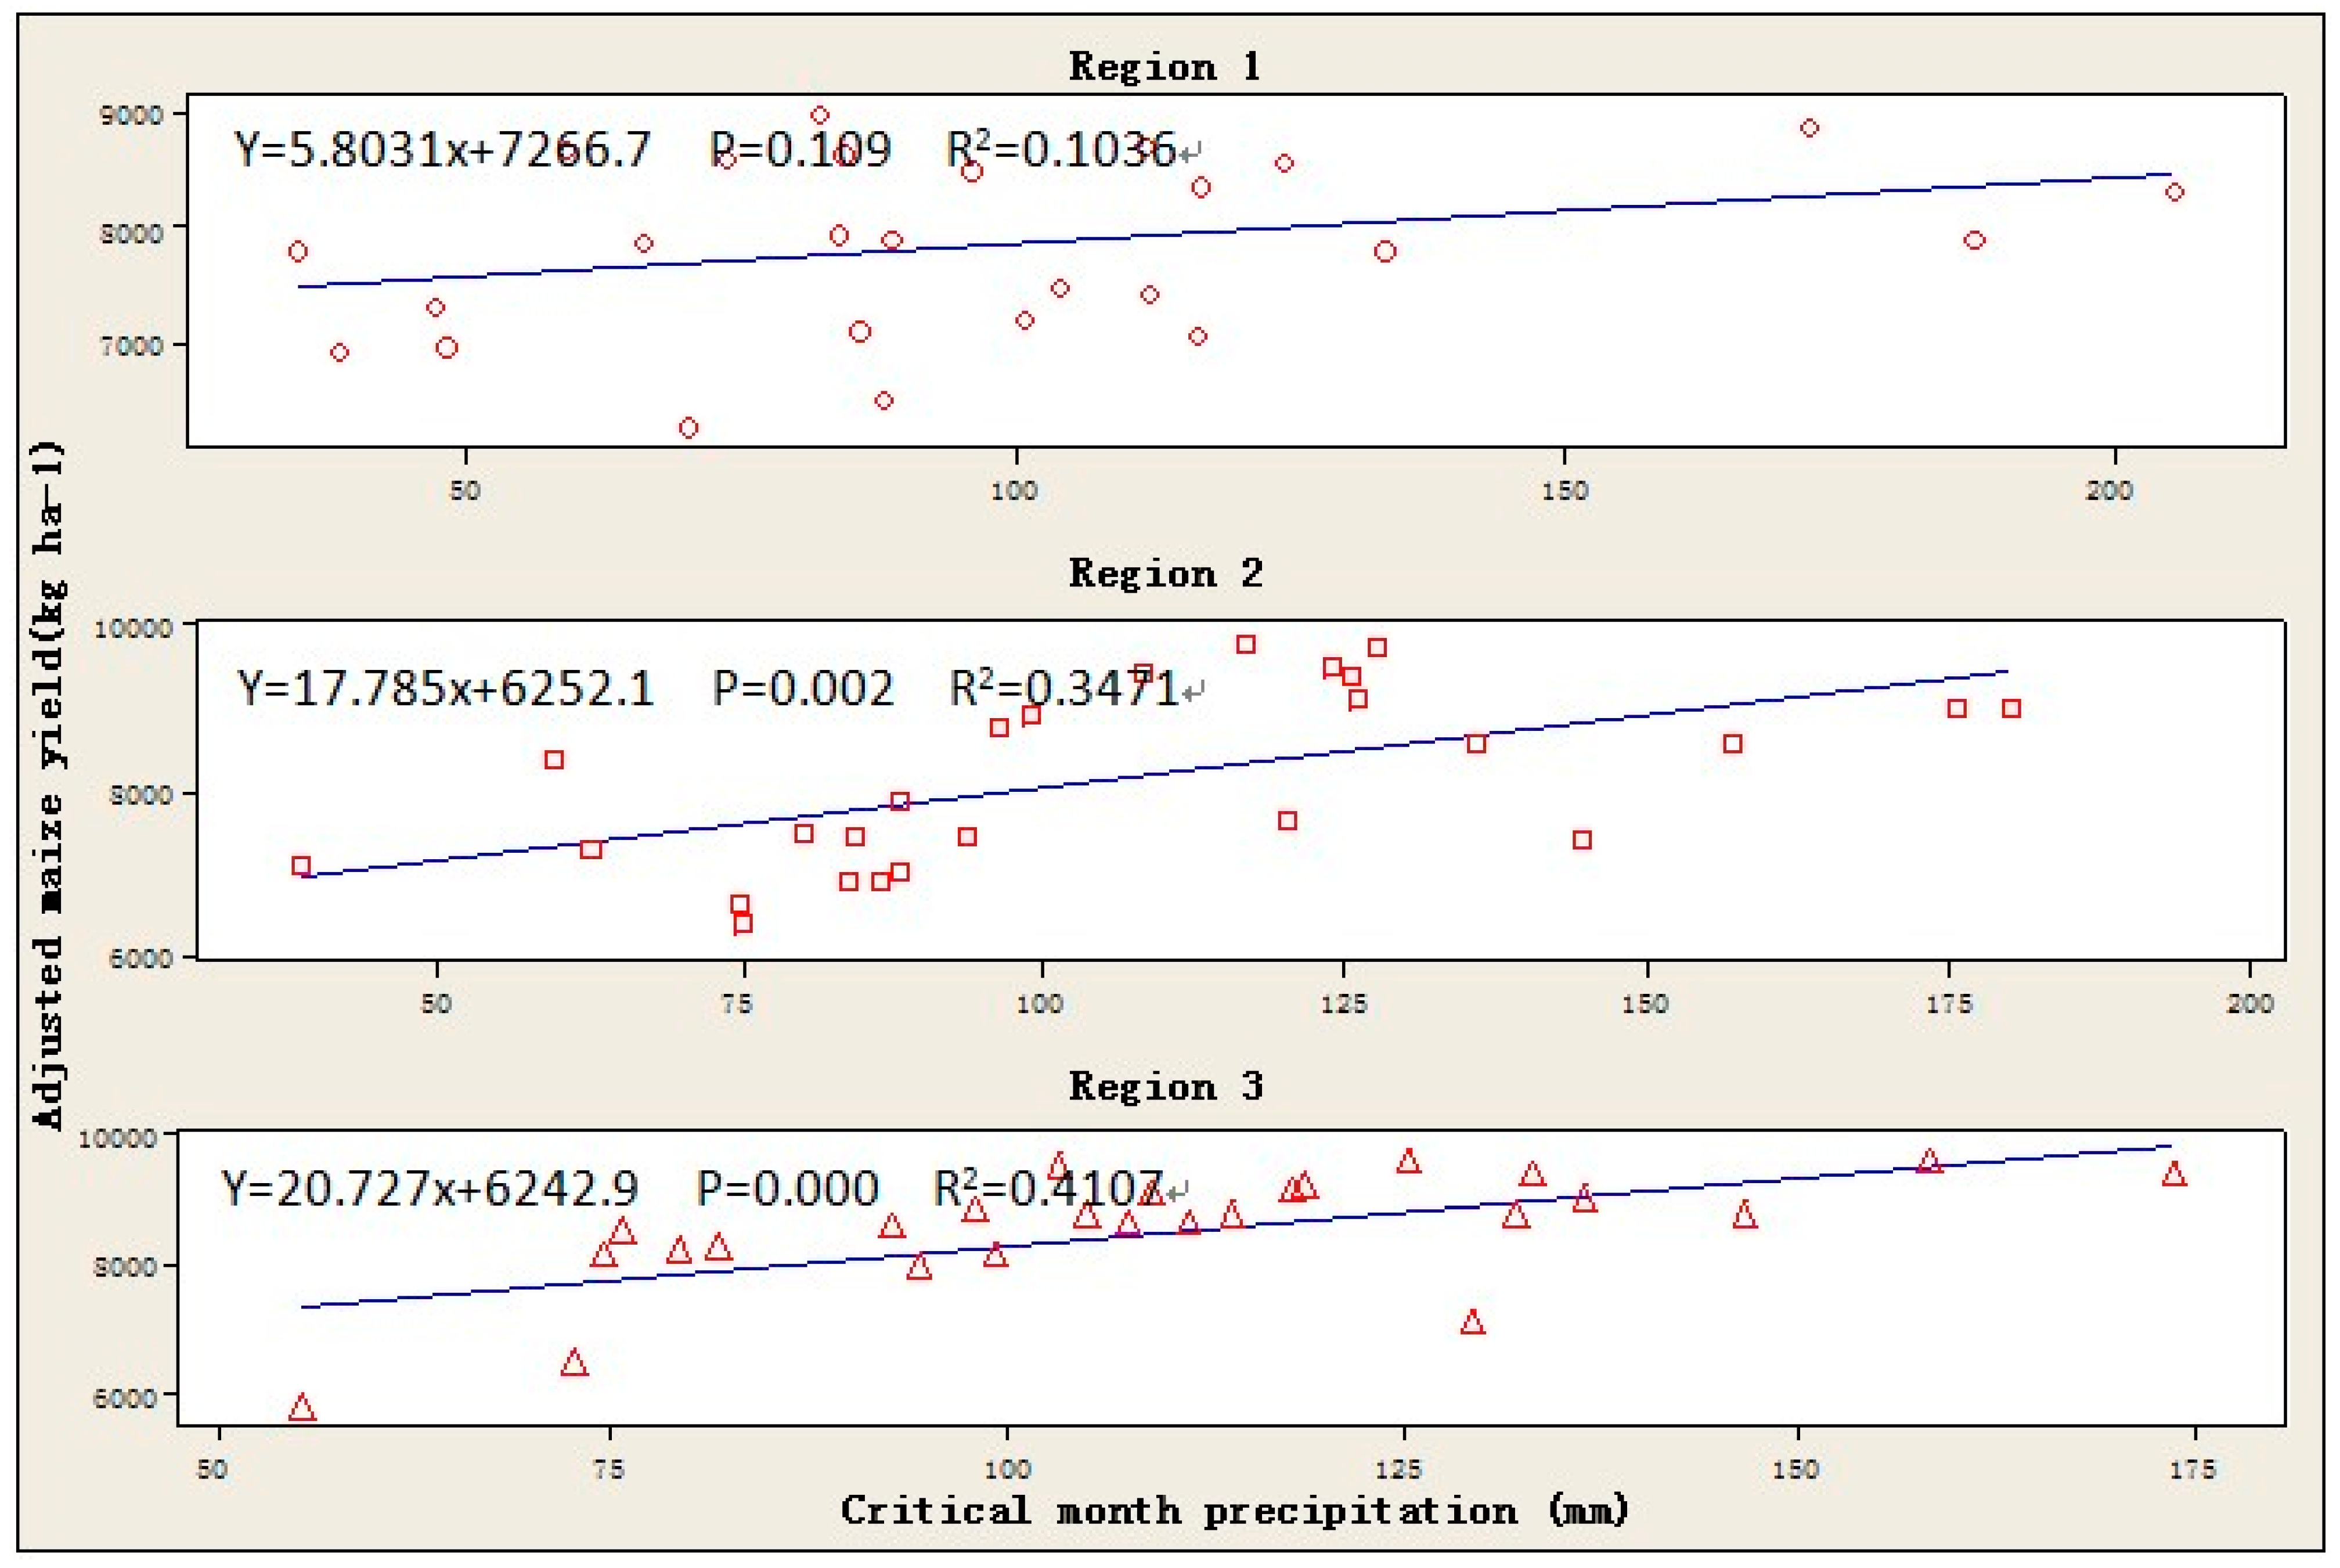
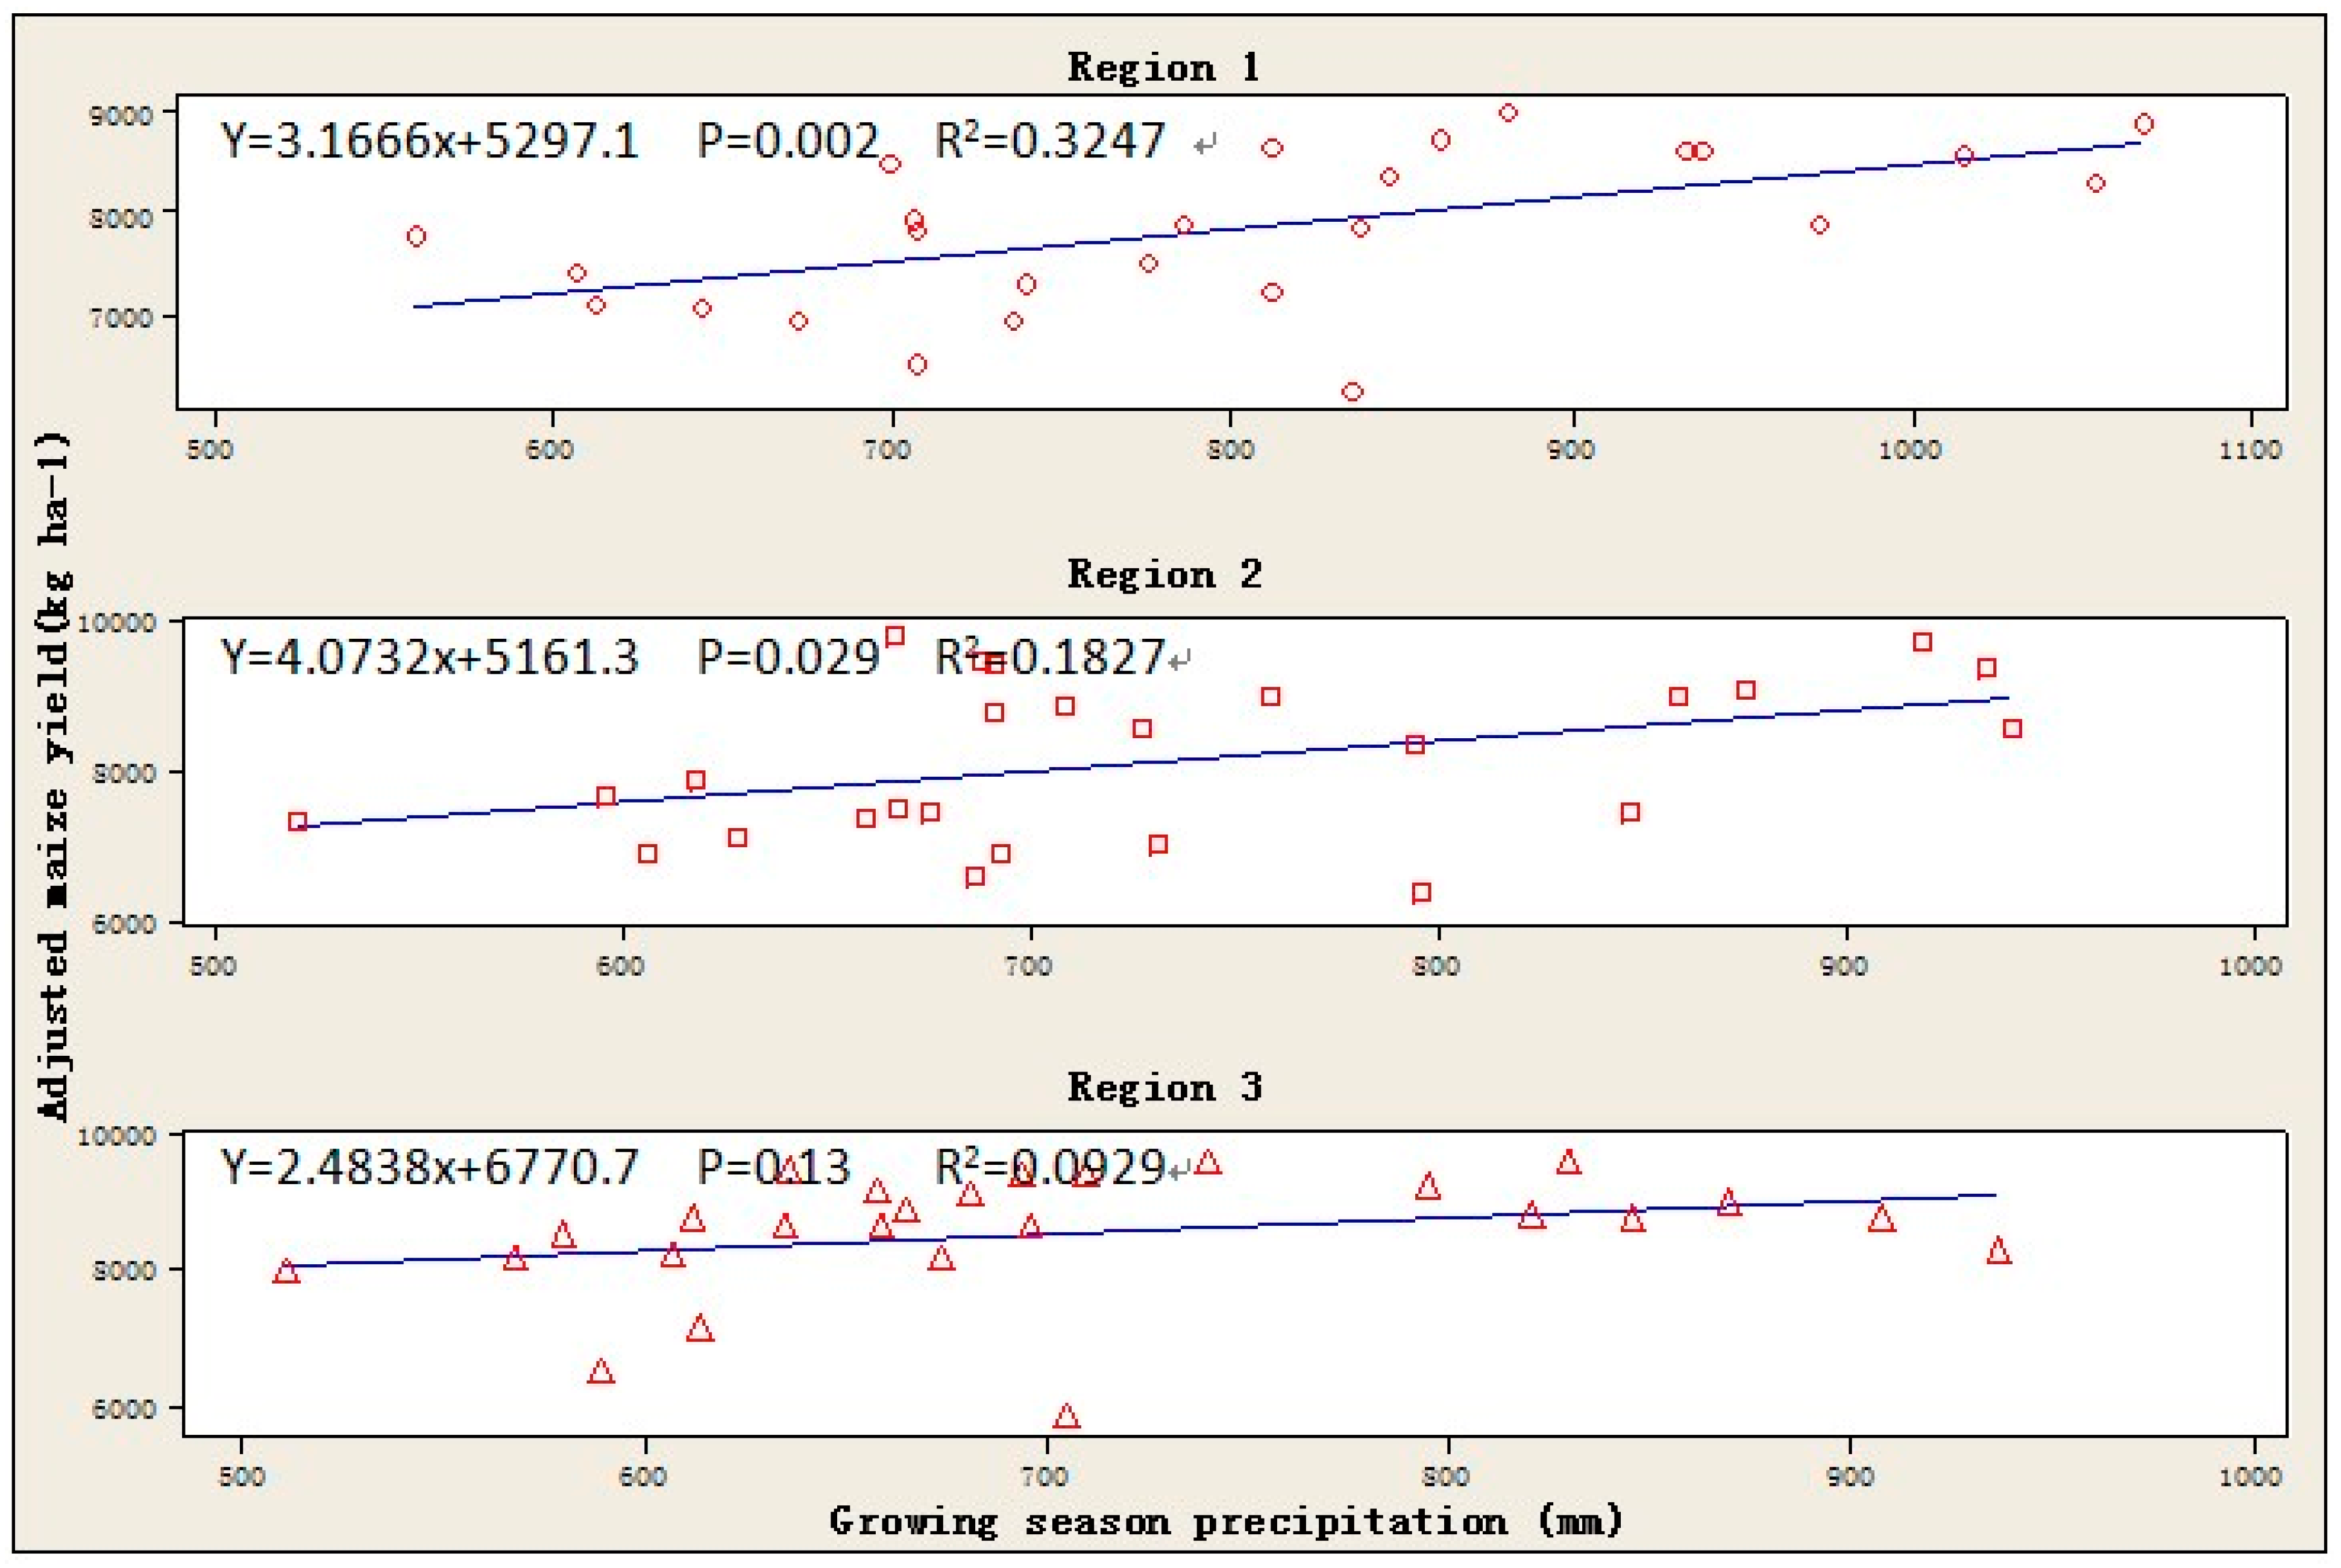
3.3.1. Maize Yield-Precipitation Relationships at Regional Level

(1) Growing Season Precipitation-Yield Relationships
We first assessed the relationship between total growing season precipitation and maize yield at the regional scale. There was a significant positive correlation (p < 0.05) between maize yield and growing season precipitation in the period 1963–2011 in the three regions of our study, but the coefficient of determination was small (Table 2). The reason might be that widespread regional-scale maize yield variability may have decreased over time, similar to that in the U.S. Maize Belt since the mid-1980s [31]. Therefore, we chose the period 1986–2011 as another historical scenario to analyze the maize yield-precipitation relationships. The results were a better correlation between growing season precipitation and maize yield during the period 1986–2011 than 1963–2011 (Figure 4). Focusing on the latter period, there was a significant positive correlation (coefficient of determination = 0.3247; p = 0.002) between the adjusted maize yield and growing season precipitation in region 1. In Region 2 the coefficient of determination was lower (0.1827) but still significant at p = 0.029. In Region 3, however, the relationship between maize yield and total growing season precipitation was not significant with an r2 of 0.09 (p = 0.13). The positive relationship between growing season precipitation and maize yield indicates that moisture shortage rather than excess is a major factor determining maize yield in the eastern U.S. However, the relationship is stronger in the southeast and weakens as one moves to the northeast. Moreover, differences in temperature and soil properties between southern and northern parts of the eastern U.S. may also have played a role in determining a weaker growing season precipitation-maize yield relationship in the north than in the south. In the north, temperatures are cooler while poorly drained soils are commonly used for maize production in states such as Ohio and New York. This may have led more often to excess moisture in the planting season which would inhibit soil aeration and increase disease pressure interfering with seed germination, and seed emergence [10,19,32,33], with a consequent reduction of maize grain yield [34]. On the other hand, as shown in Figure 3, despite having higher average total growing season precipitation in Region 1, the average maize yield in this region was lower than in the other regions, at least at the beginning of our study period. This suggests that higher evaporative demand of the atmosphere led to more common moisture deficit in the southeast than in the northeast and a better correlation between growing season precipitation and maize yield.
Table 2. Growing season precipitation (x)-maize yield (Y) relationship at the regional scale (1963–2011).
RegionRegression EquationPR2
Region 1Y = 1.7764x + 6008.20.0270.099
Region 2Y = 2.9582x + 5879.70.0200.109
Region 3Y = 1.9594x + 7109.30.0460.082
Figure 4. Growing season precipitation-maize yield relationship at the regional scale (1986–2011). Region 1 includes Alabama, Georgia, Mississippi and South Carolina; Region 2 includes Delaware, Maryland, Kentucky, North Carolina, Tennessee and Virginia (but not West Virginia); and Region 3 includes New Jersey, New York, Ohio and Pennsylvania.
Sustainability 07 05996 g004
(2) Critical Month Precipitation–Yield Relationships
Considering the greater likelihood that moisture shortage will affect maize yield during the time of pollination, a better relationship would be expected between precipition in the critical month and maize yield. From 1963–2011, there was a significant positive correlation (p < 0.001) between maize yield and critical month precipitation in Regions 2 and 3, but not in Region 1 (Table 3). During the period 1986–2011, the critical month precipitation explained 41% of adjusted maize yield variation (p = 0.000) in Region 3 and explained 35% of variability of maize yields in Region 2 (p = 0.002) (Figure 5). Using crop simulation models, O’Neal et al. [35] predicted that maize yield in the midwestern U.S. would decrease as precipitation during silking decreased. Tannura et al. [36] also reported that precipitation during silking contributed more to 1960–2006 maize yields in Illinois and Indiana than precipitation during any other period of the growing season. However, we did not find a strong correlation between critical month precipitation from 1986–2011 and maize yield in Region 1, and the critical month precipitation-yield relationship became progressively weaker from the northeastern to southeastern U.S. In summary, our regional analysis suggests that total growing season precipitation has a greater impact on maize yield in the southeast than in the northeast, whereas the precipitation in the critical month of pollination has a greater impact on maize yields in the northeast instead of in the southeast.
Table 3. Critical month precipitation (x)-maize yield (Y) relationship at the regional scale (1963–2011).
RegionRegression EquationpR2
Region 1Y = 3.0852x + 7131.30.2280.031
Region 2Y = 15.449x + 6428.20.0000.258
Region 3Y = 14.99x + 6876.40.0000.301
Figure 5. Critical month precipitation–maize yield relationship at the regional scale (1986–2011). Region 1 includes Alabama, Georgia, Mississippi and South Carolina; Region 2 includes Delaware, Maryland, Kentucky, North Carolina, Tennessee and Virginia (but not West Virginia); and Region 3 includes New Jersey, New York, Ohio and Pennsylvania. The critical month of maize production is in May in Region 1, June in Region 2 and July in Region 3.
Sustainability 07 05996 g005

3.3.2. Maize Yield-Precipitation Relationships at State Level

(1) Growing Season Precipitation-Yield Relationships
Analysis of the relationship between total growing season precipitation from 1963–2011 and adjusted maize yield at the state level show similar results to that at the regional level, with more significant coefficients of determination in the southern states than in the north (Table 4). For the period 1963–2011 the correlation was significant (p < 0.05) in Alabama, Georgia, South Carolina, Delaware, Maryland, Kentucky, North Carolina, Tennessee, Virginia, and Pennsylvania. For the 1986–2011 period, the maize growing season precipitation was significantly correlated with maize yield (p < 0.05) in the southern states Alabama, Georgia, South Carolina, Tennessee, and Virginia, but not in the other states in the region.
Table 4. Growing season precipitation (x)-maize yield (Y) relationship at the state scale.
RegionStatePeriodRegression EquationpR2
Region 1Alabama1963–2011Y = 2.1315x + 4976.80.0050.158
1986–2011Y = 3.7039x + 3933.50.0010.377
Georgia1963–2011Y = 2.1952x + 6861.20.010.132
1986–2011Y = 2.4158x + 7385.60.0050.283
Mississippi1963–2011Y = −1.0583x + 9448.70.1290.048
1986–2011Y = 0.1193x + 8941.10.9020.001
South Carolina1963–2011Y = 3.4316x + 3209.90.010.133
1986–2011Y = 5.0969x + 2128.30.0210.204
Region 2Delaware1963–2011Y = 2.8362x + 6632.30.0130.125
1986–2011Y = 3.3357x + 6293.40.0570.143
Maryland1963–2011Y = 3.3147x + 5888.80.0050.157
1986–2011Y = 4.1137x + 5425.60.220.200
Kentucky1963–2011Y = 2.0501x + 7417.20.0460.082
1986–2011Y = 2.2939x + 7504.70.0710.130
North Carolina1963–2011Y = 2.5844x + 4699.50.0250.102
1986–2011Y = 2.7872x + 4683.20.0810.121
Tennessee1963–2011Y = 2.65x + 6421.80.0050.156
1986–2011Y = 3.3481x + 5908.90.0050.281
Virginia1963–2011Y = 4.735x + 4016.30.0010.228
1986–2011Y = 5.7514x + 3328.40.0060.279
Region 3New Jersey1963–2011Y = 0.9469x + 71550.3990.015
1986–2011Y = 1.7361x + 6349.20.3780.033
New York1963–2011Y = 0.6157x + 7835.10.3890.016
1986–2011Y = 0.6803x + 79860.5970.012
Ohio1963–2011Y = 1.9521x + 8563.10.1040.055
1986–2011Y = 3.0991x + 7951.20.090.115
Pennsylvania1963–2011Y = 2.8929x + 5869.70.0130.125
1986–2011Y = 2.8143x + 5987.50.1160.100
(2) Critical Month Precipitation-Yield Relationships
Similar to the regional analysis, the critical month precipitation-yield interaction was stronger in more northern states (Table 5). In the period 1963–2011, the coefficients of determination were significant in Delaware, Maryland, North Carolina, Virginia, New Jersey, Ohio, and Pennsylvania, but not in any of the states in Region 1. All states in Region 3 showed a positive correlation between critical month precipitation and maize yield (with the exception of the state of New York, where growing season nor critical month precipitation was signficantly correlated with maize yield). In Region 2, the critical month precipitation did show a positive correlation with maize yield in some states but not in other states. The correlation analysis was very similar for the period 1986–2011. Similar to the regional analysis, our state scale analysis provides evidence that total growing season precipitation is well correlated with maize yield in the southeast, but that precipitation during pollination is better correlated with maize yield in the northeast.
Table 5. Critical month precipitation (x)-maize yield (Y) relationship at the state scale.
RegionStatePeriodRegression EquationpR2
Region 1Alabama1963–2011Y = 3.676 x + 6387.90.1220.050
1986–2011Y = 6.4583 x + 6356.50.0720.129
Georgia1963–2011Y = 3.3058 x + 8278.50.2440.029
1986–2011Y = 5.0053 x + 8849.20.2030.067
Mississippi1963–2011Y = −1.1608 x + 8702.60.5210.009
1986–2011Y = 0.7804 x + 8942.80.7410.005
South Carolina1963–2011Y = 7.0327 x + 5242.80.1180.051
1986–2011Y = 9.9701 x + 5209.30.3110.043
Region 2Delaware1963–2011Y = 10.136x + 7645.20.0060.148
1986–2011Y = 13.627x + 7370.10.0090.251
Maryland1963–2011Y = 9.465x + 7237.80.0070.147
1986–2011Y = 15.844 x + 6778.10.0040.292
Kentucky1963–2011Y = 6.4777 x + 8219.20.0660.070
1986–2011Y = 4.3095x + 86800.3370.038
North Carolina1963–2011Y = 17.144x + 4766.40.0000.503
1986–2011Y = 17.554x + 4854.60.0000.570
Tennessee1963–2011Y = 5.3704x + 7857.10.0670.070
1986–2011Y = 7.0461x + 7633.10.0460.156
Virginia1963–2011Y = 15.995x + 5713.50.0000.250
1986–2011Y = 21.43x + 51980.0010.353
Region 3New Jersey1963–2011Y = 13.577x + 6326.90.0000.289
1986–2011Y = 24.122x + 4850.50.0000.447
New York1963–2011Y = 3.5821x + 7906.50.1580.042
1986–2011Y = 4.5763x + 79840.2420.057
Ohio1963–2011Y = 11.739x + 8571.80.0050.156
1986–2011Y = 15.199x + 8306.10.0140.225
Pennsylvania1963–2011Y = 19.047x + 58630.0000.383
1986–2011Y = 21.455x + 5663.90.0000.408

4. Discussion

Our analysis of maize growing season precipitation in the eastern United States in the period 1963–2011 showed an average-annual increase of 1.5% to 1.9% in Regions 2 and 3, respectively, but a decrease of 0.04% per year in Region 1. The precipitation in the critical month of pollination in this time period decreased 0.91% per year in Region 1, increased 0.15% per year in Region 2 and was level in Region 3. In this period, maize yields increased at an annual rate of 3.90% in Region 1, 2.62% in Region 2, and 2.31% in Region 3. The faster pace of yield improvement in the southernmost region was clearly not due to higher precipitation but had to be attributed to other factors, most likely improvements in technology and management, although trends in temperature may also have been a contributing factor. We normalized the maize yields to 2011 yields by adjusting for the improvements in technology and management. Subsequently, we correlated these technology and management-adjusted yields with total growing season precipitation and precipitation in the critical month of pollination. The results indicated that total growing season precipitation had a better relationship with maize yield in the southeastern than in the northeastern United States. Conversely, critical month precipitation had a better relationship with maize yield in the northeastern than in the southeastern United States. These trends were confirmed when individual state precipitation and maize yields were correlated. In the southeastern U.S., it seems that precipitation deficit in the entire growing season is most important for maize yield. This suggests that crop water stress takes place there at all growth stages and impacts maize yield. On the other hand, in the northeastern states, drought stress is less important except when it occurs in the month of pollination. Precipitation in the critical month of pollination seems to play a more important role in determining maize production in these states. If climate model predictions are correct, variability in precipitation will change but total precipitation will not be much affected in the eastern U.S.

5. Conclusions

Though other factors such as population, temperature, hail, fertility level, plant management, and insect, disease, and weed pressures also affect maize yield, there is no doubt that precipitation is one of the most important factors controlling maize yield. Meanwhile, moisture shortage rather than excess determined maize yield in the eastern U.S. Our analysis suggests that these changes in precipitation patterns will have a greater impact on maize yields in the northeastern U.S. because of its sensitivity to precipitation in the critical month of pollination. In the southeastern U.S., on the other hand, maize yields may be impacted less if total growing season precipitation does not change.

Acknowledgments

This research was supported by USDA-Hatch funds and “Development and Demonstration of the major technology for the Promotion of Constructing New Socialist Rural Area in Sichuan province of China” research program.

Author Contributions

Chengyi Huang: Designed and wrote the manuscript, collected and analyses all the data.
Sjperd Willem Duiker: Modify the manuscript, analyses all the data with First Author.
Liangji Deng: Analyses the maize yield data with First Author.
Conggang Fang: Modify the figures.
Weizhong Zeng: Analyses the data.

Conflicts of Interest

The authors declare no conflict of interest.

References

  1. Claudia, T.; Katharine, H.; Julie, M.A.; Gerald, A.M. Going to the extremes an intercomparison of Model- Simulated listorical and future changes in extreme events. Clim. Chang. 2006, 79, 185–211. [Google Scholar] [CrossRef]
  2. Raymond, G.N.; Christopher, R.P.; Mary, B.A.; Denise, B.; Carl, H.; Michael, K.; Robert, H.; Margaret, R.M.; Michael, P.; David, S.; et al. Potential climate-change impacts on the Chesapeake Bay. Estuarine Coast. Shelf Sci. 2010, 86, 1–20. [Google Scholar] [CrossRef]
  3. Dawson, J.; Scott, D. Systems Analysis of Climate Change Vulnerability for the US Northeast Ski Sector. Tour. Hosp. Plan. Dev. 2010, 7, 219–235. [Google Scholar] [CrossRef]
  4. Vivian, K.A. Behavioral Adaptation of Skiers and Snowboarders in the US Northeast to Climate Variability and Change. Master’s Thesis, University of Waterloo, Waterloo, ON, Canada, 2011. [Google Scholar]
  5. Andrew, R.; Charlotte, B.; David, A.; Denice, W.; James, S.; Marc, M.; Matthew, R.; Raymond, N.; Richard, R.; Seth, B.; et al. Pennsylvania Climate Impacts Assessment Update; The Pennsylvania State University: University Park, PA, USA, 2012; pp. 6–18. [Google Scholar]
  6. Allison, M.T.; Robert, A.B.; Norman, J.R. Climate change impacts for the conterminous USA: An integrated assessment, Part 4: Water resources. Clim. Chang. 2005, 69, 67–88. [Google Scholar] [CrossRef]
  7. Rachel, H.; Steve, A.; Peter, B.; Jerry, H.; Anthony, J.L.; Mike, G.R.; David, S.; Margaret, W. The Effects of Climate Change on U.S. Ecosystems. Available online: http://www.usda.gov/img/content/EffectsofClimateChangeonUSEcosystem.pdf (accessed on 29 April 2015).
  8. USDA-National Agricultural Statistics Service. Available online: http://www.nass.usda.gov/ (accessed on 29 April 2015).
  9. Food and Agriculture Organization of the United Nations. Statistics Division. Available online: http://www.fao.org/statistics/en/ (accessed on 29 April 2015).
  10. Hall, A.J.; Vilella, F.; Trapani, N.; Chimenti, C.A. The effects of water stress and genotype on the dynamics of pollen-shedding and silking in maize. Field Crops Res. 1982, 5, 349–363. [Google Scholar] [CrossRef]
  11. Bacsi, Z.; Thornton, P.K.; Dent, J.B. Impacts of future climate change on Hungarian crop production: An application of crop growth simulation models. Agric. Syst. 1991, 37, 435–450. [Google Scholar] [CrossRef]
  12. Tollenaar, M.; Dwyer, L.M.; Stewart, D.W. Ear and kernel formation in maize hybrids representing three decades of grain yield improvements in Ontario. Crop Sci. 1992, 32, 432–438. [Google Scholar] [CrossRef]
  13. Downing, T.E. (Ed.) Climate Change and World Food Security NATO ASI Series I: Global Environmental Change 37; Spring: Berlin, Germany, 1996; p. 662.
  14. Watson, R.; Zinyowera, M.; Moss, R. (Eds.) Climate change 1995: Impacts, adaptation and mitigation of climate change. In Contribution of Working Group II to the Second Assessment Report of the IPCC; Cambridge University Press: Cambridge, UK, 1996.
  15. Gommes, R. Climate Related Risk in Agriculture. Available online: http://www.fao.org/uploads/media/climrisk.pdf (accessed on 29 April 2015).
  16. Andrade, F.H.; Vega, C.; Uhart, S.; Cirilo, A.; Cantarero, M.; Valentinuz, O. Kernel number determination in maize. Crop Sci. 1999, 39, 453–459. [Google Scholar] [CrossRef]
  17. Burhan, O.; Handan, A. Impacts of climate factors on yields for selected crops in Southern Turkey. Mitig. Adapt. Strateg. Glob. Chang. 2002, 7, 367–380. [Google Scholar] [CrossRef]
  18. Adams, R.M.; Wu, J.; Houston, L. Climate Change and California, Appendix IX: The effects of Climate Change on Yields and Water Use of Major California CROPS. Available online: http://www.energy.ca.gov/reports/500-03-058/2003-10-31_500-03-058CF_A09.PDF (accessed on 29 April 2015).
  19. Lobell, D.B.; Cahill, K.N.; Field, C.B. Historical eddects of temperature and precipitation on California crop yields. Clim. Chang. 2007, 81, 187–203. [Google Scholar] [CrossRef]
  20. Kovaţeviš, V.; Jolankai, M.; Birkas, M.; Lonţariš, Z.; Ńońtariš, J. Influences of precipitation and temperature trend on maize yields. In Proceedings of the 44th Croatian and 4th International Symposium on Agriculture, Opatija, Croatia, 16–20 February 2009; pp. 541–545.
  21. Sun, H.Y.; Shen, Y.J.; Yu, Q.; Gerald, N.F. Effect of precipitation change on water balance and WUE of the winter wheat- summer maize rotation in the North China Plain. Agric. Water Manag. 2010, 97, 1139–1145. [Google Scholar] [CrossRef]
  22. Daniel, U.; Michael, J.R.; Wolfram, S. Projected temperature changes indicate significant increase in interannual variability of U.S. maize yields. J. Clim. Chang. 2012, 112, 525–533. [Google Scholar] [CrossRef]
  23. Andresen, J.A.; Alagarswamy, G.; Ritchie, J.T.; Rotz, C.A.; LeBaron, A.W. Assessment of the impact of weather on maize, soybean, and alfalfa production in the Upper Great Lakes Region of the United States, 1895–1996. Agron. J. 2001, 93, 1059–1070. [Google Scholar] [CrossRef]
  24. Hu, Q.; Buyanovsky, G. Climate effects on corn yield in Missouri. J. Appl. Meteorol. 2003, 42, 1626–1635. [Google Scholar] [CrossRef]
  25. Wilhelm, W.W.; Wortmann, C.S. Tillage and rotation interactions for corn and soybean grain yield as affected by precipitation and air temperature. Agron. J. 2004, 96, 425–432. [Google Scholar] [CrossRef]
  26. Malone, R.W.; Ma, L. N Uptake Affects Model (RZWQM). In New Advances in Understanding and Quantification of Plant N Uptake; Ma, L., Bruulsema, T., Ahuja, L., Eds.; CRC Press: Boca Raton, FL, USA, 2009; pp. 259–275. [Google Scholar]
  27. Nielsen, D.C.; Vigil, M.F.; Benjamin, J.G. The variable response of dryland corn grain yield to soil water content at planting. Agric. Water Manag. 2009, 96, 330–336. [Google Scholar] [CrossRef]
  28. Nielsen, D.C.; Halvorson, A.D.; Vigil, M.F. Critical precipitation period for dryland maize production. Field Crops Res. 2010, 118, 259–263. [Google Scholar] [CrossRef]
  29. Campbell, C.A.; Janzen, H.H.; Paustian, K.; Gregorich, E.G.; Sherrod, L.; Liang, B.C.; Zentner, R.P. Carbon storage in soils in the North American Great Plains: Effect of cropping frequency. Agron. J. 2005, 97, 349–363. [Google Scholar] [CrossRef]
  30. Nielsen, D.C.; Unger, P.W.; Miller, P.R. Efficient water use in dryland cropping systems in the Great Plians. Agron. J. 2005, 97, 364–372. [Google Scholar] [CrossRef]
  31. Kucharik, C.J.; Ramankutty, N. Trends and Variability in U.S. Corn Yields Over the Twentieth Century. Earth Interact. 2005, 9, 1–29. [Google Scholar] [CrossRef]
  32. Silberfaden, F. Evaluación cuantitativa del efecto de las bajas temperaturas yel contenido hídrico del suelo sobre la germinación y emergencia en semillas de maíz. Tesina de grado, Facultad de Agronomia, Universidad de Buenos Aires, Buenos Aires, Argentina, 2010. [Google Scholar]
  33. Gustavo, A.M. Analysis of the climatic constraints to maize production in the current agricultural region of Argentina—A probabilistic approach. Theor. Appl. Climatol. 2012, 107, 325–345. [Google Scholar] [CrossRef]
  34. Liu, W.; Tollenaar, M.; Stewart, G.; Deem, W. Response of corn grain yield to spatial and temporal variability in emergence. Crop Sci. 2004, 44, 847–854. [Google Scholar] [CrossRef]
  35. O’Neal, M.R.; Nearing, M.A.; Vining, R.C.; Southworth, J.; Pfeifer, R.A. Climate change impacts on soil erosion in MidwestUnited States with changes in crop management. Catena 2005, 61, 165–184. [Google Scholar] [CrossRef]
  36. Tannura, M.A.; Irwin, S.H.; Good, D.L. Weather, Technology, and Corn and Soybean Yields in the U.S. Corn Belt; Marketing and Outlook Research Report. Department of Agricultural and Consumer Economics, University of Illinois at Urbana-Champaign: Urbana, IL, USA, February 2008; pp. 17–18. Available online: http://www.farmdoc.illinois.edu/marketing/morr/morr_08-01/morr_08-01.pdf (accessed on 29 April 2015).

