
Using Water Footprints for Examining the Sustainable Development of Science Parks


1
School of Health Diet and Industry Management, Chung Shan Medical University, No.110, Sec.1, Jianguo N. Rd., Taichung City 40201, Taiwan
2
Department of Medical Management, Chung Shan Medical University Hospital, No.110, Sec.1, Jianguo N. Rd., Taichung City 40201, Taiwan
Sustainability 2015, 7(5), 5521-5541; https://doi.org/10.3390/su7055521
Submission received: 5 February 2015
/
Revised: 24 April 2015
/
Accepted: 4 May 2015
/
Published: 7 May 2015
(This article belongs to the Special Issue Water Footprints and Sustainable Water Allocation)
Abstract
:The Hsinchu Science Park was established in Taiwan in the 1980s, replacing traditional industries with high value-added and technology-intensive industries. Taiwan has become one of the Newly-Industrialized Economies (NIEs). However, the continued expansion of high-tech enterprises in science parks requires large amounts of resources to be consumed, deteriorating the quality of the environment, for which society must pay a high cost. In this study, the input-output model was used to explore the water footprints of the Hsinchu Science Park. The study results revealed that among the six industries at the Hsinchu Science Park, the integrated circuit industry (whether in 2001, 2004, or 2006) had the lowest total water consumption per unit of output. From a water footprint perspective, compared with the other industries of the science park, the development of the integrated circuit industry has had a lower impact on the environment. Furthermore, the integrated circuit industry, precision machinery industry, and biotechnology industry have become increasingly dependent on foreign water resources to alleviate the water shortage in Taiwan. In contrast to previous studies on water consumption, this study incorporated indirect water usage into the analysis; thus, a comprehensive view of the water consumption of each industry was analyzed from a broad perspective.
1. Introduction
Economic development and population increases in recent decades have caused the rapid increase of fresh water consumption, which may hinder societal development. Currently, approximately one-third of the world’s population is threatened by a lack of freshwater for fulfilling daily needs [1]. Furthermore, increased water scarcity in numerous regions is expected in the future because of various factors such as population growth, pollution of existing resources, climate change, and urbanization. Nearly seven billion people worldwide are predicted to encounter a water crisis by the mid-21st century.
The average annual rainfall in Taiwan is 2467 mm, which is approximately 2.6 times the world average (which is 973 mm). In addition, Taiwanese people have experienced low prices and easy access to tap water; thus, a majority of Taiwanese people consider water an infinite natural resource and lack crisis awareness regarding water resources. However, because Taiwan is a country with limited living space, a dense population, steep mountains, concentrated rainfall, and fast-running rivers, the temporal and spatial distributions of rainfall in Taiwan are extremely uneven. This uneven distribution of rainfall increases the difficulty of preserving and using water resources. The annual rainfall per capita in Taiwan is 4074 m3, which is lower than one-fifth of the world average (21,796 m3). Based on the criteria for the amount of water available worldwide, the United Nations ranked Taiwan 18th among countries with the least water resources per capita.
Since 1960, Taiwan has transformed the labor-intensive light industries into technique-intensive high-technology and high value-added industries. After the occurrence of industrial transformation in Taiwan, the government established the Hsinchu Science Park (HSP) in 1980 to satisfy the development needs of high-technology industries. The HSP is the development base of high-technology industries, including the information, semiconductor, and foundry industries. Subsequently, the government established the Southern Taiwan Science Park (STSP) and Central Taiwan Science Park (CTSP) in 1995 and 2002, respectively. The three science parks occupy a total area of 4610 ha, forming the core area of high-technology industries in Taiwan. According to the statistics obtained by the Water Resources Agency (WRA) [2]. Executive Yuan, Taiwan, the total revenue generated from the science parks in Taiwan in 2012 was NT$2.004132 trillion, and the HSP, CTSP, and STSP, respectively, accounted for 52.83%, 16.13%, and 31.03%. The total revenue of the science parks accounted for approximately one-seventh of the gross domestic product of Taiwan. The high production value, considerable amounts of investment, and breakthroughs in research and development contributed by the high-technology science parks have elevated the international position of Taiwan. Because of these achievements, advanced countries in Europe and North America dubbed the HSP as the Silicon Valley of Taiwan. However, as various high-technology enterprises in the science parks continue to expand their scales of production, the amount of water resources consumed increases considerably (e.g., water used during the manufacturing process, boiler water, and cooling water), thereby depleting water resources and deteriorating environmental quality, resulting in a substantial social cost [3].
Under the wave of sustainable development, the international society began to develop tools or indicators that can evaluate sustainable development one by one. They want to reflect ecological environment really and reasonably, meanwhile analyzing resource consumption effectively and exploring the relationship among different kinds of environmental impact [4]. Generally speaking, the current evaluation indicators or measurement models of sustainable development established or developed internationally or domestically have their own features. Most of them can manage to include various aspects of sustainable development factors of society, economy, ecology and environment [5]. Among them, water scarcity has been studied by numerous researchers based on various indicators such as the Falkenmark indicator [6], the physical and economical scarcity indicators [7], the water poverty index [8], and the water vulnerability index [9]. However, collecting and disseminating meaningful water-related information is complex and difficult, because corporate water accounting methods are still under development and require further refinement [10].
The impact of human consumption on global water resources can be mapped using water footprints. The concept of water footprints was proposed and defined as “…a measure of humans’ appropriation of freshwater resources” [11]. Water footprints are indicators of water use in which both water consumption and pollution are incorporated; they can also be applied for broadening water resource evaluation systems and providing water utilization information for decision-making [12,13,14,15]. Several studies have focused on developing the concept of water footprints and quantifying the water footprints of a wide variety of products from a consumption perspective, on either global or national scales [16,17,18,19,20].
Recently, several studies have used the input-output (IO) model, a top-down method, to quantify national or regional water footprints. Some of these studies have evaluated the water footprint of China [21], especially in water deficient regions such as Zhangye City [22] and the Haihe River basin [23]. IO models have been used as an effective method for assessing the flow of resources and how environmental burdens are transferred in supply chains [24]. Thus, the IO model accurately quantifies intersectoral virtual water flows, representing both direct and indirect water inputs during industrial production processes. Extensive research has been conducted on virtual water and water footprints in recent years. Many studies have focused on the microlevel, such as the virtual water content of products or the water footprint of consumers. For example, the virtual water content of products such as coffee, tea, rice, and meat [16,25], and the water footprint of industrial production processes [20] have been explored. Other studies have focused on the macrolevel, such as the national water footprint or virtual water flow, and numerous case studies have been conducted in Spain, the United Kingdom, and China [21,26,27]. Two widely accepted methods for assessing national water footprints are the bottom-up approach, which entails considering the sum of goods and services consumed by inhabitants multiplied by their virtual water content; and the top-down approach, which involves calculating the total use of domestic water resources, plus the imported virtual water flow, minus the exported virtual flow. Furthermore, grey water footprints, which refer to water used to dilute pollutants emitted during industrial production, are often ignored because of a lack of data; therefore, the effects of environmental pollution during industrial production are ignored.
Gerbens-Leenes et al. [28] evaluated the water footprint of each unit of bioenergy and compared the water footprints of bioenergy with those of fossil and renewable energies. Their results indicated that the water footprints of bioenergy were 70–400-fold higher than those of other energies. Thus, if bioenergy is used as an alternative energy for reducing the effects of fossil energy on climate change, a substantial influence would be exerted on the water resources. Van Oel and Hoekstra [29] conducted an empirical study in the Netherlands by investigating the blue and green water footprints of paper products throughout the entire supply chain. The results revealed that according to the current paper recovery rate, the water footprints of printing and writing paper were estimated to be between 300 m3/ton and 2600 m3/ton (the specific value depends on the type and source of paper). When paper is recovered for recycling, nearly 40% of the water used in the paper-making process can be conserved, indicating that using recycled paper is extremely beneficial for reducing water footprints.
Mekonnen and Hoekstra [30] measured the water footprints of various farm animals and animal products globally and showed that the animal products worldwide require 2422 m3 water annually. The primary factors that influence the water footprints of animal products are the feed conversion efficiency of the animal, feed composition, and origin of the feed. The type of production system used (a grazing, mixed, or industrial system) can influence these three factors.
From an Italian dietary and cultural perspective, Aldaya and Hoekstra [13] analyzed the influence of pasta and pizza Margherita on water resources based on the concept of water footprints. The results showed that the water footprints of 100 g of pasta and a 725 g pizza were 192.4 L and 1216 L, respectively, which far exceeded the household water use per capita per day in Italy (380 L). Chapagain and Hoekstra [25] found that the average global water footprint of rice from 2000 to 2004 was 1325 m3/ton, and that green, blue, and grey water accounted for 48%, 44%, and 8%, respectively.
The water footprint concept, which is closely linked with virtual water or embedded water approaches [12], was first introduced in 2002 as an analogy to the ecological footprint [31]. In contrast to the ecological footprint, the water footprint is a volumetric measure of water consumption and pollution. Diverse accounting perspectives have led to different water footprint categories, which may include process, product, consumer, consumer groupings, business, and geographic area, and regional water footprints [32]. Although differences exist among the various types of water footprints, the water footprint of one process could be considered a building block of all water footprint accounts [33].
Zhao and Chen [34] applied a log-mean Divisia index (LMDI) model to evaluate agricultural water footprint in China, The results reveal that the Chinese agricultural water footprint has risen from the 94.1 Gm3 in 1990 to 141 Gm3 in 2009. Zhao et al. [35] explored the influencing factors of population, affluence, urbanization level, and diet structure on agriculture products-related water footprint change based on an extended STIRPAT model. Empirical results reveal that the all examined factors as positive driving forces have pushed forward Chinese agricultural sector water footprint increases from 549.68 Gm3 in 1990 to 1016.64 Gm3 in 2009. Fang et al. [36] investigated an embodied socio-economic water system using network analysis developed originally for ecological systems. This study provides a novel perspective and methodology for assessing the structure and efficiency of water utilization system with a whole perspective.
According to Hoekstra and Mekonnen [20], water resources are subjected to the effects of industrial production and consumption activities through both consumptive use and pollution. Such effects can be local or external to the area of production, as when water-intensive commodities are traded. Several studies in the previous decade have explored alternative methodologies for quantifying virtual water transfers [37,38,39,40,41].
Based on the aforementioned concerns and developments regarding water footprints, numerous studies have focused on calculating the water footprints of products, especially those of agricultural products. However, few studies have analyzed the water footprints in specific regions or countries. Moreover, in the regional studies available, the regions of a nation were divided by county, city, or province, and small regions such as a science park were not discussed. Water footprint analysis can determine the extent of water consumption and scarcity and represent the embedded or virtual water in imports and exports. However, the application of such a method in Taiwan is still at its early stage, especially in the science parks where water shortage is severe. Thus, conducting such a study is critical so that appropriate water management policies can be developed by considering local conditions.
Therefore, the primary objective of this study was to apply a water footprint model for evaluating the sustainable development of the HSP in Taiwan. First, an IO method was used to establish the water footprint model for the HSP. Second, we used the model to analyze the historical water footprint of the six major industries in the HSP. Finally, we analyzed the empirical results. The research results are expected to be used as a reference for planning the sustainable development of science parks. For achieving these objectives, the remainder of this paper begins with an overview of previous water footprint-related studies. Details on the research methodology are provided, including an overview of the IO-based analysis framework and data collection process. Subsequently, we present the case study results and provide policy implications. Finally, we draw research conclusions and identify limitations and directions for future research.
The first contribution of this study is the generation of direct water use intensity and total water use intensity indicators for each economic sector. These critical indicators can facilitate evaluating sectoral water use efficiency and identifying sources of pressure in water resources for supporting policy decisions related to water allocation under scarcity conditions. The second contribution is the quantification of both direct and indirect water use in the economies of. This is essential for assessing how commodity supply chains that use water as an input to economic production affect water resources.
2. Methods
This section describes the water footprint analysis framework, some background information regarding the case study region, and data collection and preparation.
2.1. General IO Model of Production
IO analysis, which is a top-down economic technique that involves using sectoral monetary transactions data to account for the complex interdependencies of industries in modern economies, was first developed by Leontief in the 1930s [42,43]. Based on IO tables and factor decomposition analysis, Kondo [44] found that Japanese industrial goods manufacturers depended on virtual water imports from domestic and foreign subsidiaries to strengthen their competitiveness. Extending a regional IO model enabled Guan and Hubacek [45] to analyze water pollution processes, and they found that North China receives a large amount of wastewater from consumption activities in other regions. Similar to separate analyses by Wang and Wang [22], Guan and Hubacek [45] found that although water is scarce in North China, the region was a net virtual exporter; therefore, these studies have concluded that reducing the amount of exported agricultural products is necessary. Guan and Hubacek [45] investigated five provinces in China as case study areas to evaluate the virtual water trade between North and South China and concluded that North China, which has limited water resources, exports freshwater to other regions, whereas South China, which has abundant water resources, virtually imports water from other regions.
Chou and Lee [46] implemented input-output (IO) analysis to estimate the virtual water imported and exported among the agricultural, industrial, and service sectors of Taiwan. The analysis results showed that the virtual water in the agricultural sector of Taiwan exhibited substantial imports, whereas that in the industrial sector exhibited net exports, indicating that the virtual water trade considerably contributed to mitigating the pressure caused by the overall Taiwanese water usage and satisfying the food demand in Taiwan.
Zhang et al. [47] quantitatively evaluated the water footprint of Beijing by using an interregional input-output (IRIO) framework, although the derivation process of the IRIO table is quite complex. Feng et al. [48] and Zhao et al. [23] have applied multiregional IO models to calculate water footprints in the Yellow and Haihe River basins in China by using consumption-based approaches.
In this paper, we mainly refer to the IO method for water footprints proposed by Chou and Lee [46]. To avoid a decomposition process, we slightly revised the IO method, which entailed revising the research methodology and related equations.
The general IO model of production [42] is the foundation on which the water IO model was developed. The model portraying how the production of an economy depends on interactions between different sectors and final demand can be specified using a system of linear equations, such as Equation (1), and can be summarized as expressed in Equation (2):
where Xi is the gross output of Sector i, Yi is the final demand of Sector i, and Xij represents the inputs from Sector i to Sector j. Equation (1) is solved as two essential matrices. The first is the technical coefficient matrix:
where aij is the direct input from Sector i required to increase one monetary unit output in Sector j, and Xj is the gross output of Sector j. The second matrix is the Leontief inverse matrix:
where bij is the gross input from Sector i necessary for one monetary unit of final demand in Sector j. This matrix links the final demand and corresponding direct and indirect input.
2.2. Data Description
The data collected in this study included the following: (a) Taiwan IO tables for 2001 (162 sectors), 2004 (161 sectors), and 2006 (166 sectors), which were compiled by the DGBAS, Executive Yuan. Subsequently, the sectors were combined to fulfill the research requirements, and the tables were divided into two categories of producer price trade and domestic product trade; (b) Water consumption statistics, which included the Agricultural Water Consumption in Taiwan, Industrial Water Consumption in Taiwan, Domestic Water Consumption in Taiwan, and Water Consumption in Taiwan for 2001, 2004, and 2006 published by the Water Resources Agency, Ministry of Economic Affairs. After obtaining data from the IO tables and the water consumption statistics of various sectors, we combined the sectors according to the collected data and research requirements. When the water consumption of specific sectors cannot be obtained, we divided the water consumption data according to the ratio of output values of each sector. When water consumption data for each sector and the combined IO tables were obtained, the mixed IO tables for water resources were compiled to construct a water footprint calculation model.
First, the sectors of the IO tables were combined into the 33 sectors required for this study. The elements in rows and columns corresponding to the combined sectors were added. If m sectors are to be combined into n sectors (m > n), the equation can be expressed as Equation (4).
m = total number of sectors nationwide; n= the number of sectors that are combined in this study;
represents the element of the combined sector trade table; and represents the element of the noncombined sector trade table.
Based on Equation (4), we combined the 162, 161, and 166 sectors of producer price and domestic product trade tables for 2001, 2004, and 2006 into 33 sectors, as shown in Table 1. In this study, we primarily discussed Sector 14 (biotechnology), Sector 23 (computers and peripherals), Sector 24 (communication), Sector 25 (integrated circuits), Sector 26 (optoelectronics), and Sector 27 (precision machinery), which are the six major industries in HSP.

| The 33 Sectors Compiled in this Study | IO Table Codes for the 162 Sectors in 2001 | IO Table Codes for the 161 Sectors in 2004 | IO Table Codes for the 166 Sectors in 2006 | |
|---|---|---|---|---|
| Code | Name | |||
| 1 | Agriculture | 1–12 | 1–12 | 1–11 |
| 2 | Mining | 13, 14, 16 | 13, 14, 16 | 12–15 |
| 3 | Food and beverage manufacturing | 15, 17–31 | 15, 17–31 | 16–29 |
| 4 | Tobacco manufacturing | 32 | 32 | 30 |
| 5 | Textiles | 33–38 | 33–38 | 31–36 |
| 6 | Clothe production, apparel, and other textile product manufacturing | 39–41 | 39–41 | 37–39 |
| 7 | Leather, fur, and other related product manufacturing | 42–44 | 42–44 | 40–42 |
| 8 | Wood and bamboo product manufacturing | 45–47 | 45–47 | 43–45 |
| 9 | Furniture and ornament manufacturing | 48, 80 | 48, 80 | 103, 104 |
| 10 | Pulp and paper products | 49, 50 | 49, 50 | 46, 47 |
| 11 | Printing and associated businesses | 51, 52 | 51, 52 | 48 |
| 12 | Chemical material manufacturing | 53–59 | 53–59 | 51–57 |
| 13 | Chemical product manufacturing | 60, 63, 64 | 60, 63, 64 | 59–61 |
| 14 | Biotechnology | 61, 62 | 61, 62 | 58, 62 |
| 15 | Petroleum and coal product manufacturing | 65, 66 | 65, 66 | 49, 50 |
| 16 | Rubber product manufacturing | 67, 68 | 67, 68 | 63 |
| 17 | Plastic product manufacturing | 69 | 69 | 64 |
| 18 | Nonmental mineral product manufacturing | 70–74 | 70–74 | 65–69 |
| 19 | Basic metal industries | 75–78 | 75–78 | 70–73 |
| 20 | Fabricated metal production manufacturing | 79, 81–85 | 79, 81–85 | 74–78 |
| 21 | Machinery and equipment manufacturing and repairing | 86–90 | 86–90 | 94–97, 107 |
| 22 | Electrical machinery, supplies, and equipment manufacturing and repairing | 91–95 | 91–95 | 89–93 |
| 23 | Computers and peripherals | 96–99 | 96–99 | 81, 83, 84, 87 |
| 24 | Communication | 100, 101 | 100, 101 | 85, 86 |
| 25 | Integrated circuits | 103 | 102 | 79 |
| 26 | Optoelectronics | 104 | 103 | 80 |
| 27 | Precision machinery | 111 | 110 | 88 |
| 28 | Other electronic components | 102, 105 | 104 | 82 |
| 29 | Transport equipment manufacturing and repairing | 106–110 | 105–109 | 98–102 |
| 30 | Other industrial product manufacturing | 112, 113 | 111, 112 | 105, 106 |
| 31 | Electric power and gas | 114, 115 | 113, 114 | 108, 109 |
| 32 | Water | 116 | 115 | 110 |
| 33 | Services | 117–162 | 116–161 | 111–166 |
Source: IO tables released by DGBAS, Executive Yuan; compiled by the researchers of this study.
2.3. Data Processing
In this study, water resources were divided into tap water and raw water (i.e., surface water and groundwater) based on the source. The compilation process is shown as follows:
2.3.1. Tap Water Consumption
There are three kinds of water data available for industrial sectors, water withdrawal, industrial water use and consumptive water use [2]. Water withdrawal is the total fresh water drawn from water sources to meet the demand for industrial production, including normal industrial production, auxiliary production and municipal use in those industries. Water withdrawal is equivalent to the concept of blue water [33]. Industrial water use is the total water used by all regional industrial production, including fresh and recycled water. Industrial water use can be regarded as the sum of water withdrawal and recycled water. If no recycled water is used, then the industrial water use equals the water withdrawal value. Consumptive water use is water that cannot be directly recycled, including water leakage and evaporated water, wastewater discharged to the local sewers, and water embedded in products. Based on the compilation method by Chou and Lee [49] and the IO tables, we compiled the tap water consumption of each sector. The data compilation method comprised three steps: (a) The tap water input value of each sector (excluding the water sector) in the domestic product trade table was used as the numerator and the overall output value of the water sector from which the tap water input value of the sector was subtracted (i.e., water loss defined in the IO tables) was used as the denominator to calculate the weighting of each sector; (b) The total tap water sold by the Taiwan Water Corporation, combined with the aforementioned weighting calculation, was used to calculate the tap water consumption for each sector; (c) The total water sold was subtracted from the total water output of the Taiwan Water Corporation, yielding the tap water consumption of the water sector (i.e., water loss).
2.3.2. Surface Water and Groundwater Consumption
According to a water consumption survey involving various manufacturing industries that was conducted by the WRA [2], which evaluated the self-drawn industrial water consumption under structures of 45 sectors, we organized the 33 sectors after we allocated industrial water consumption to the corresponding 162 sectors by using the comparison table of the 49 and 162 sectors in the report of IO tables. The allocation conformed to the weighting calculated based on the proportion of the output value of a corresponding sector to the total output value of relevant sectors. For example, when we compared the electronic parts and components sector in the report with the 162 sectors proposed by the DGBAS, the sector actually consisted of electron tube, semiconductor, optoelectronic components and materials, and electronic components sectors. Thus, the proportion of the output value of each of these four sectors to that of the electronic parts and components sector was treated as the weighting for dividing the water consumption of the electronic parts and components sector proportionally to the four sectors (i.e., electron tube, semiconductor, optoelectronic components and materials, and electronic components sectors). Specifically, semiconductor and optoelectronic components and materials belong to Sectors 25 and 26 of this study, respectively, and both electron tube and electronic components belong to Sector 28 of this study.
2.4. Establishing the Water Footprint Model
Water is a primary input in economic production, and this relationship is reflected through the freshwater use coefficient of each economic sector. In our methodology, we extended the regional IO table of each state by adding a row vector of direct water use coefficients (measured in physical units). The coupling of water data to IO tables for quantifying the effects of sectoral demands throughout the supply chain is not new and has been widely applied in previous studies [45,48,50].
Our application of the IO methodology involves extending regional IO tables for the states of California and Illinois to incorporate sectoral water use. This technique has been widely applied in previous studies such as Lenzen et al. [51], Wang and Wang [22], Zhao et al. [21], and Blackhurst et al. [52]. In recent years, numerous hypotheses and analytical techniques have been proposed and discussed to reflect the real situation. One successful example is the quantity-value mixed IO table, which represents an alternative application of IO analysis. The quantity-value mixed design is frequently adopted in discussions related to energy issues. In this study, we used the quantity-value mixed design to explore issues related to water resources and compiled mixed IO tables for water resources for relevant analysis.
Traditional IO tables presented relevant figures in monetary values. To evaluate the virtual water flows by using IO models, researchers must include physical data of water resources in the traditional IO tables to generate a mixed IO table for water resources. The horizontal vector of the IO tables represents the value of using specific products by each sector (i.e., the value of the products produced by specific sectors available for each sector). Thus, the physical input table used for recording the usage of natural resources is attached as a horizontal vector below the traditional IO table. The IO table structure for water resources is shown in Table 2.
| InputOutput | Intermediate Demand | Final Demand | Total Output | Import | |||
|---|---|---|---|---|---|---|---|
| Sector 1 … Sector n | Domestic Consumption | Export | |||||
| Intermediate input | Domestic input | Sector 1 ↓ Sector n | |||||
| Import | |||||||
| Added value | |||||||
| Total input | |||||||
| Water consumption | |||||||
Source: Constructed by this study.
2.4.1. Input Coefficient of Water Resources ()
The input coefficient of water resources represents the direct input amount of water resources per unit of output by sector j. This variable reflects the direct water use during the production process. If the input coefficient is large, the water consumed during the production process is large, indicating that increased water resources are required to be input for the same output value.
The input coefficient of water resources can be considered a technical indicator for various sectors to conserve water. We observed the changes in this indicator to identify whether the water conservation technique of a sector improved or deteriorated.
Based on this structure, we defined the input coefficient of water resources as Equation (5):
where , , respectively represent the input coefficient of resources, water consumption, and output by sector j.
2.4.2. IO Correlation Matrix (B)
The variable B represents the influence caused by changing a unit of final demand. However, we analyzed the direct and indirect water consumption per unit of output to identify the amount of water consumed for a unit of production output, rather than identifying the water consumption required to change a unit of final demand. Thus, the equation was revised as expressed in Equation (7).
2.4.3. Water Footprint
The water footprint includes not only the direct water consumption for sector production, but also the indirect water consumption generated by intermediate input that involves purchasing products from other sectors. Thus, an expression of unit output reflects the actual water consumed per unit of output of a sector. The total water consumption of the sector can be determined by combining the unit output and the sector output value. The water footprint of sectors is defined in Equation (8):
where represents the water footprint of sector ; represents the input coefficient of water resources by sector ; and represents the IO correlation matrix coefficient divided by the diagonal coefficient. In other words, , where is the output value of sector j.
By placing Equation (8) into a matrix, we obtained Equation (9) as follows:
where diag (H) is the diagonal matrix of the input coefficient vector of water resources.
2.5. Water Footprint Index
The water footprint index directly reflects the water consumption of various sectors. For this index, items such as unit area, unit number of employees, and water consumption per unit product are often used. After considering the applicability of each index to analysis targets, we used the water consumption per unit of output index as the tool for analyzing the following investigation results and determining the substantial effectiveness generated by per unit of water consumption of sector in the HSP. The water consumption per unit of output refers to the amount of water consumed to produce a unit of output value during a given time, representing the ratio of total original water consumption to the total output value. This index exhibits the industrial water use efficiency of a country or a region. Generally, when the ratio of industrial water consumption to manufacturing production value decreases, the industrial water use efficiency increases, thereby positively affecting sustainable development.
3. Results and Discussion
3.1. Water Footprint Analysis of the Six Major Industries at the HSP
3.1.1. Analysis of Industrial Structures
To analyze the water footprint of the HSP, we must understand the water footprint of each sector at the HSP and the distribution of industrial structures. Thus, we compiled the historical industrial structures of the HSP (Table 3).
In 2006, the sector that contributed the most to the revenue of the HSP was the integrated circuit sector, yielding an output value of NT$795.362 billion and accounting for 71.07% of the total revenue. The second most contributory sector was the optoelectronics sector, with an output value of NT$161.290 billion, accounting for 14.41% of the total revenue. The remaining sectors are arranged in order of revenue contribution: Computers and peripherals (9.07%), communication (4.04%), precision machinery (1.14%), and biotechnology (0.26%).
Based on these data, the integrated circuit sector was the most crucial to the HSP. Moreover, the revenue contribution of this sector continued to grow from 56.81% in 2001 to 68.48% in 2004, and reached 71.07% in 2006. Although the computers and peripherals sector was the second most crucial sector in the HSP, its generated revenue declined from NT$161.209 billion in 2001 to NT$138.245 billion in 2004, and further to NT$101.496 billion in 2006. In addition, the revenue contribution of this sector dropped to the third place in 2006. In contrast, the optoelectronics sector exhibited growing revenues and replaced the computers and peripherals sector as the second most crucial sector of the HSP in 2006. Similar to the computers and peripherals sector, the communication sector presented declining revenues; however, it remained the fourth crucial sector of the HSP. Although the precision machinery sector ranked in the fifth place and contributed little to HSP, the revenue continued to grow. Compared with the other sectors, the biotechnology sector exhibited the lowest revenue and the smallest scale, and its revenue fluctuated minimally.
3.1.2. Internal and External Water Footprints
Based on empirical results, the internal and external water footprints of the HSP in 2001, 2004, and 2006 were compiled (Table 3). The water footprint of the HSP in 2001 was 1911.51 million tons, where approximately 925.62 million tons originated from internal water footprint (accounting for 48.42% of HSP water footprint) and 985.88 million tons were from external sources (accounting for 51.58% of HSP water footprint). The water footprint in 2004 was 3153.45 million tons, where approximately 1589.04 million tons were from internal sources (50.39%) and 1564.4 million tons were from external sources (49.61%). The water footprint in 2006 was 3074.67 million tons, where approximately 1556.57 million tons originated from the internal water footprint (50.63%) and 1518.1 million tons were from external sources (49.37%).
| Sector | Output Value (in NT$ Million) | Water Footprint (10,000 tons) | |||||||||||
|---|---|---|---|---|---|---|---|---|---|---|---|---|---|
| 2001 | 2004 | 2006 | 2001 | 2004 | 2006 | ||||||||
| Internal | External | Sum | Internal | External | Sum | Internal | External | Sum | |||||
| 1 | Biotechnology | 1848 | 2343 | 2869 | 473 | 123 | 596 | 645 | 230 | 875 | 734 | 322 | 1056 |
| 2 | Computers and peripherals | 161,209 | 138,245 | 101,496 | 13,238 | 36,765 | 50,003 | 13,242 | 34,080 | 47,322 | 13,302 | 27,203 | 40,505 |
| 3 | Communication | 56,123 | 60,530 | 45,266 | 5183 | 11,751 | 16,934 | 4710 | 14,634 | 19,344 | 4741 | 12,162 | 16,903 |
| 4 | Integrated circuit | 375,719 | 742,738 | 795,362 | 63,772 | 36,410 | 100,182 | 118,443 | 83,065 | 201,508 | 108,865 | 81,117 | 189,982 |
| 5 | Optoelectronics | 62,217 | 131,871 | 161,290 | 9245 | 12,866 | 22,111 | 20,681 | 22,916 | 43,597 | 26,285 | 28,058 | 54,343 |
| 6 | Precision machinery | 4284 | 8835 | 12,797 | 652 | 673 | 1325 | 1183 | 1515 | 2698 | 1729 | 2948 | 4677 |
| Total | 661,400 | 1,084,562 | 1,119,080 | 92,563 | 98,588 | 191,151 | 158,904 | 156,440 | 315,345 | 155,657 | 151,810 | 307,467 | |
Overall, although the proportions between the internal and external water footprints to the total water footprint of HSP fluctuated in 2001, 2004, and 2006, the fluctuation was minimal. The proportion remained approximately at 50% for both internal and external water footprints. Therefore, the total water consumption requirements highly depended on the virtual water implied in foreign materials in addition to the domestic input.
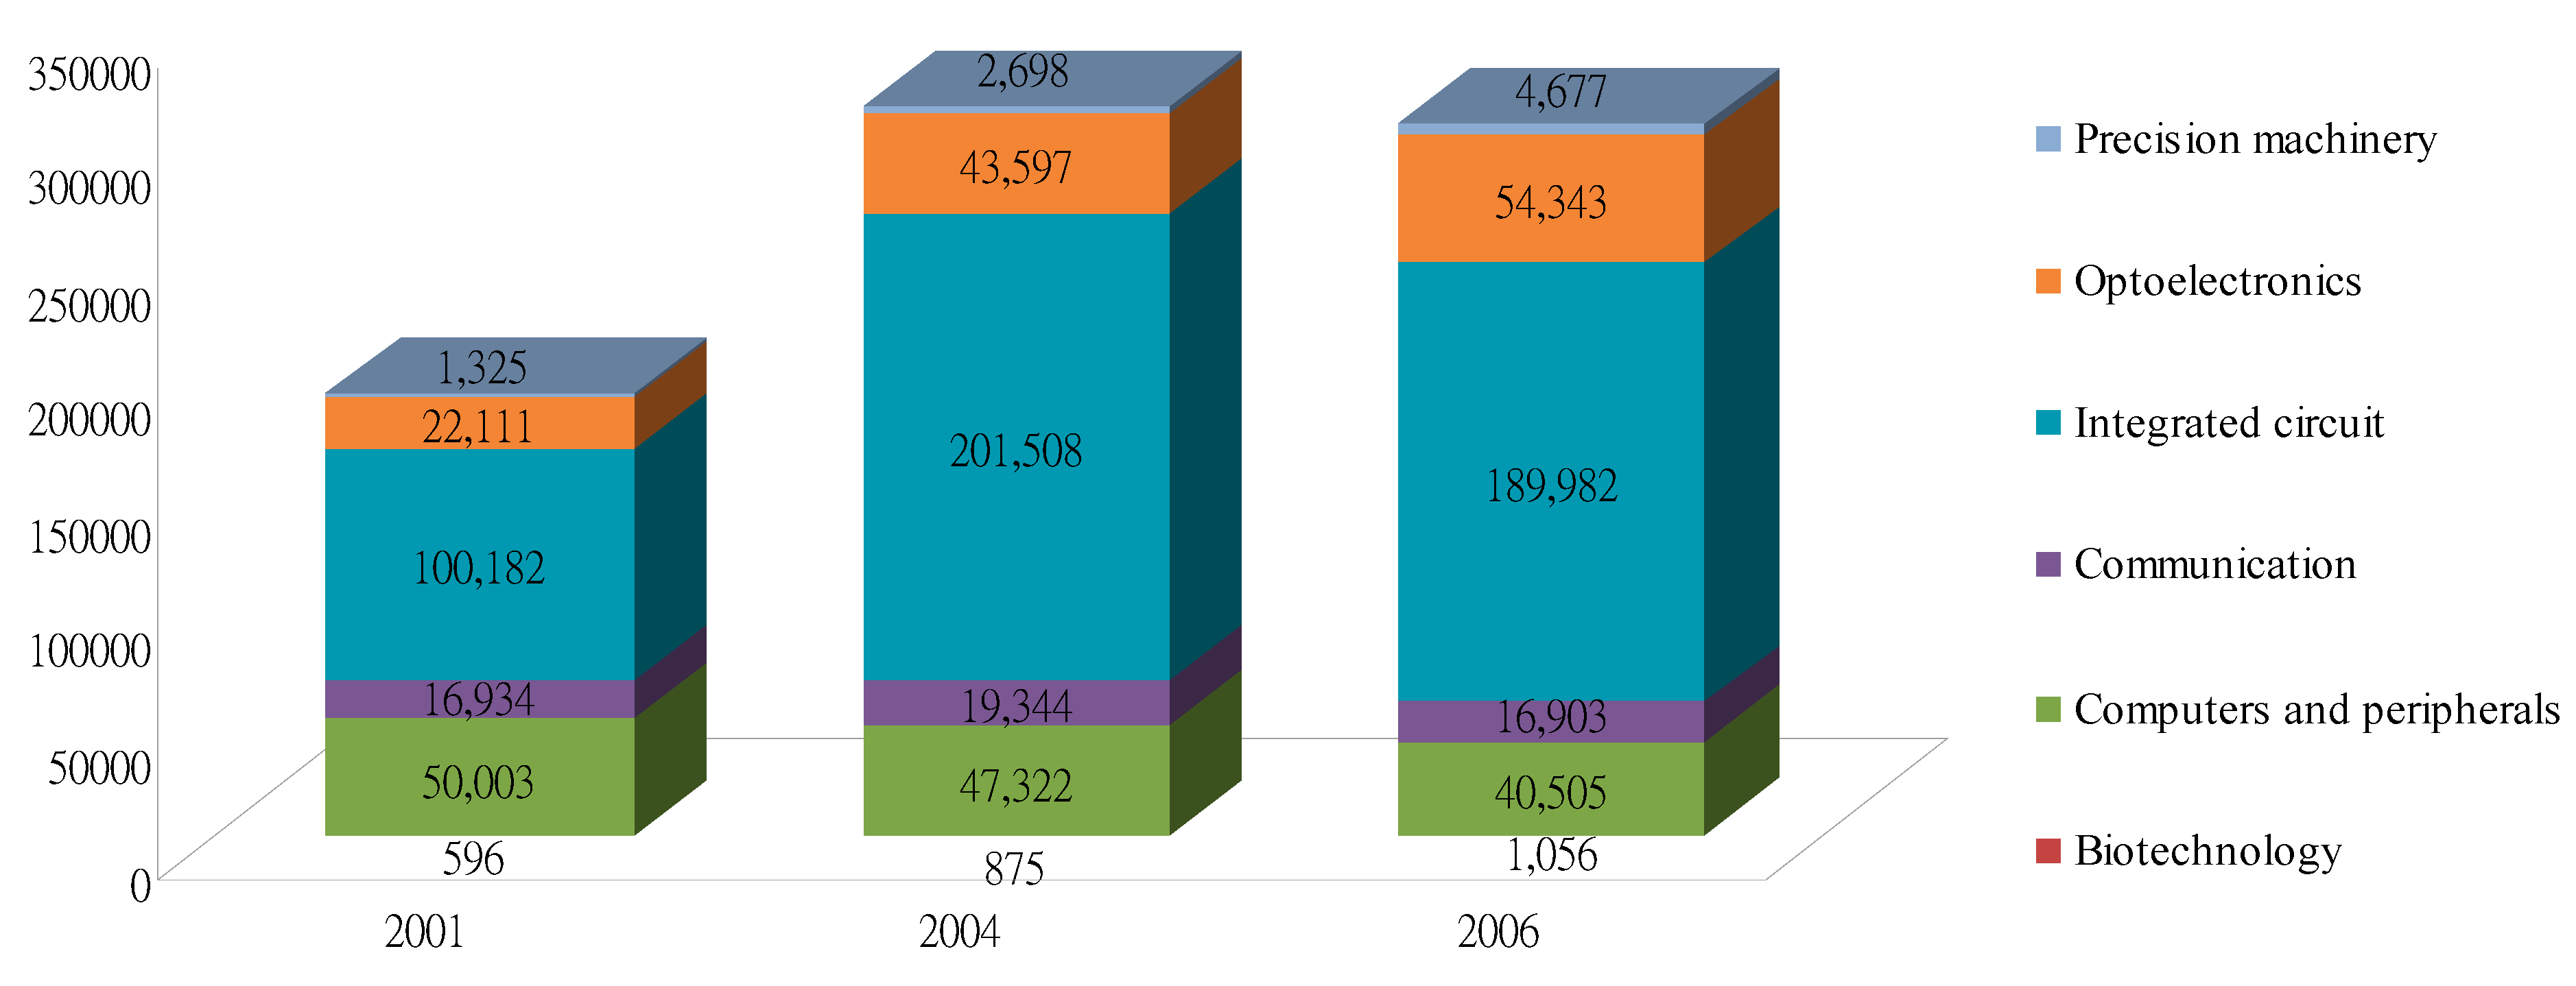
An analysis by sector (Table 3) showed that the water footprint for the integrated circuit sector in 2006 was 1899.82 million tons, accounting for 61.79% of the total water footprint of the HSP, followed by optoelectronics (543.43 million tons; 17.67%), computers and peripherals (405.05 million tons; 13.17%), communication (169.03 million tons; 5.50%), precision machinery (46.77 million tons; 1.52%), and biotechnology (10.56 million tons; 0.34%).
In summation, the historical water footprints of the HSP were mainly contributed by the integrated circuit sector, followed by the computers and peripherals sector. However, the contributory proportion of the computers and peripherals sector exhibited a declining tendency and was surpassed by that of the optoelectronics sector in 2006, which demonstrated annual growth. Therefore, the water footprints resulting from the integrated circuit and optoelectronics sectors were the most influential to the HSP. Exploring the cause of this phenomenon shows a correlation with the industrial structure of the HSP.
3.1.3. Direct and Indirect Water Footprints
Based on empirical results, the direct and indirect water footprints of the HSP in 2001, 2004, and 2006 were compiled (Figure 1). The water footprint of the HSP in 2001 was 1892.42 million tons, where approximately 36.58 million tons originated from direct water footprint (accounting for 1.93% of HSP water footprint) and 1855.84 million tons were from indirect sources (accounting for 98.07% of HSP water footprint). The water footprint in 2004 was 3095.54 million tons, where approximately 59.69 million tons were from direct sources (1.93%) and 3035.85 million tons were from indirect sources (98.07%). The water footprint in 2006 was 2986.45 million tons, where approximately 62.14 million tons originated from the direct water footprint (2.08%) and 2924.31 million tons were from indirect sources (97.92%).
Figure 1.
Direct and indirect water footprints of the HSP.
Through the analysis results, we examined the changes in the industrial and input structures of the HSP, the historical water footprints of the HSP were mainly contributed by the indirect sources, which influenced the water footprint values, and evaluated the water use characteristics of each sector in the HSP by using water footprints. The results can be used as references by management authorities for evaluating industrial development in science parks.
3.2. The Water Footprint Index
To determine the water footprint of a sector, the indirect water consumption of raw materials input by other sectors must be considered in addition to the direct water consumption input by the sector during product production. To present the results using water footprint per unit of output, this study conducted empirical analysis, yielding the water footprint per unit of output values of each sector in the HSP as shown in Table 4.
| Sector | Water Footprint per Unit of Output(ton/NT$1000) | |||||||||
|---|---|---|---|---|---|---|---|---|---|---|
| 2001 | 2005 | 2006 | ||||||||
| Internal | External | Sum | Internal | External | Sum | Internal | External | Sum | ||
| 1 | Biotechnology | 2.56 | 0.67 | 3.23 | 2.75 | 0.98 | 3.74 | 2.56 | 1.12 | 3.68 |
| 2 | Computers and peripherals | 0.82 | 2.28 | 3.10 | 0.96 | 2.46 | 3.42 | 1.31 | 2.68 | 3.99 |
| 3 | Communication | 0.92 | 2.09 | 3.02 | 0.78 | 2.42 | 3.20 | 1.05 | 2.69 | 3.73 |
| 4 | Integrated circuit | 1.70 | 0.97 | 2.67 | 1.59 | 1.12 | 2.71 | 1.37 | 1.02 | 2.39 |
| 5 | Optoelectronics | 1.47 | 2.08 | 3.55 | 1.57 | 1.73 | 3.31 | 1.63 | 1.74 | 3.37 |
| 6 | Precision machinery | 1.52 | 1.57 | 3.09 | 1.34 | 1.72 | 3.05 | 1.42 | 2.23 | 3.65 |
| Total | 8.99 | 9.66 | 18.66 | 8.99 | 10.43 | 19.43 | 9.34 | 11.48 | 20.81 | |
In 2006, the water footprint per unit of output in the biotechnology sector was 3.68 tons/NT$1000, where internal water footprint accounted for approximately 2.56 tons/NT$1000 (69.65% of the sector water footprint) and the external water footprint accounted for approximately 1.12 tons/NT$1000 (30.35% of the sector water footprint). The water footprint per unit of output in the computers and peripherals sector was 3.99 tons/NT$1000, of which internal and external water footprint accounted for approximately 1.31 tons/NT$1000 (32.90%) and 2.68 tons/NT$1000 (67.10%), respectively. The water footprint per unit of output in the communication sector was 3.73 tons/NT$1000, where internal and external water footprint accounted for approximately 1.05 tons/NT$1000 (28.08) and 2.69 tons/NT$1000 (71.92%), respectively. The water footprint per unit of output in the integrated circuit sector was 2.39 tons/NT$1000, where internal and external water footprint accounted for approximately 1.37 tons/NT$1000 (57.23%) and 1.02 tons/NT$1000 (42.77%), respectively. The water footprint per unit of output in the optoelectronics sector was 3.37 tons/NT$1000, where internal and external water footprint accounted for approximately 1.63 tons/NT$1000 (48.39%) and 1.74 tons/NT$1000 (51.61%), respectively. The water footprint per unit of output in the precision machinery sector was 3.65 tons/NT$1000, where internal and external water footprint accounted for approximately 1.42 tons/NT$1000 (38.90%) and 2.23 tons/NT$1000 (61.10%), respectively. The sectors ranked in descending order based on the water footprint per unit of output were computers and peripherals, communication, biotechnology, precision machinery, optoelectronics, and integrated circuits.
Based on the information provided, analyzing the sectors by year showed that the integrated circuit sector consumed the lowest amount of water per unit of output value in 2001, 2004, and 2006. Thus, from the perspective of water footprints, developing the integrated circuit sector exerts the minimum influence on the imports water resources and environment compared with the other sectors in the HSP. In addition, the water consumed per unit of output in the biotechnology and integrated circuit sectors mainly originated from domestic water resources, whereas approximately 70% of the water consumed per unit of output in the computers and peripherals and communication sectors originated from imports sources. Nonetheless, imports water resources consumed per unit of output in the integrated circuit, precision machinery, and biotechnology sectors increased annually, indicating that these sectors increasingly rely on imports water input, which positively contributes to the mitigation of water deficiency in Taiwan.
4. Conclusions and Recommendations
4.1. Conclusion
In this paper, we have described a new method to calculate regional water footprints values by using the IO analysis, we calculated the water footprints of the HSP and its six major industries in 2001, 2004, and 2006. The general advantages of utilizing IO to measure water footprints include standard environmental-economic accounting, systematic calculation of six major industries water footprints, and utilization of environmentally extended IO modeling techniques to identify key nodes within supply networks that are responsible for changes in the environmental performance of the economy. The IO method described in this paper provides a new approach for researchers and practitioners that the physical water footprints accounts and harmonizes the water footprints methodologies. The IO model opens the way for a new set of sustainable consumption and production analyses simultaneously among the footprint indicators.
In summation, unlike previous studies that included only internal water use when evaluating industrial water use characteristics, this study explored the water consumption of the industrial supply chain in the HSP to examine the water consumed by each sector in the HSP from a macroscopic and overall perspective. Through the analysis results, we examined the changes in the industrial and input structures of the HSP, which influenced the water footprint values, and evaluated the water use characteristics of each sector in the HSP by using water footprints. The results can be used as references by management authorities for evaluating industrial development in science parks.
Moreover, regardless of domestic or foreign literature, most studies have mainly focused on analyzing the water footprints of countries, provinces, counties, or cities. This study is the first to analyze the water footprints of a science park, thereby extending the application of water footprints. We hope this study can positively influence and contribute to enhancing water footprint knowledge and promoting relevant research topics domestically and internationally.
The water footprint of the HSP in 2001 was 1911.51 million tons, where 925.62 (48.42%) and 985.88 (51.58%) million tons originated from internal and external water footprints, respectively. The water footprint of the HSP in 2004 was 3153.45 million tons, of which 1589.04 (50.39%) and 1564.4 (49.61%) million tons originated from internal and external water footprints, respectively. The water footprint of the HSP in 2006 was 3074.67 million tons, where 1556.57 (50.63%) and 1518.1 (49.37%) million tons originated from internal and external water footprints, respectively.
4.2. Recommendations
4.2.1. Emphasizing Indirect Water Use
Previous water-conservation policies tended to emphasize direct water use and overlooked the volume of water used indirectly during production processes. Currently, water consumption based on product scale is typically measured using water footprints. In this study, water footprints based on industrial scales were examined using the IO correlation, which revealed the indirect effect and water use. The results can be used as a reference for establishing water-conservation policies.
4.2.2. Including Grey Water Footprint for Evaluation
Currently, the grey water footprint evaluation method remains immature. In practice, many situations are not elaborated on or discussed in The Water Footprint Assessment Manual. For example, although various pollution standards and regulations regarding bodies of water have been established in Taiwan, several deficiencies still exist, such as insufficient river classification information, failure to periodically examine factory water discharge, and incomplete water quality standards and specifications. Thus, when the grey water footprint technique matures, we recommend that future studies should incorporate grey water footprints to investigate the amount of water consumed in various industries.
4.2.3. Increasing the Awareness of the Government and Enterprises on Water Footprints
Industries and businesses are required to evaluate water footprints for factors such as international image, environmental protection, export competitiveness, international competitiveness, water conservation, and cost and risk reduction. We recommend that the Taiwanese government provide adequate incentives or guidance to help Taiwanese enterprises learn that evaluating water footprints is an international trend to which they should actively respond.
Acknowledgments
The author would like to thank Chia-Yon Chen and Yi-Shuan Huang, Department of Resource Engineering, National Cheng Kung University for their helpful suggestions. The author also would like to thank anonymous reviewers who gave valuable suggestion that has helped to improve the quality of the manuscript.
Conflicts of Interest
The author declares no conflict of interest.
References
- Lambooy, T. Corporate social responsibility: Sustainable water use. J. Clean. Prod. 2011, 19, 852–866. [Google Scholar] [CrossRef]
- Water Resources Agency (WRA). Ministry of Economic Affairs, Taiwan. Available online: http://wuss.wra.gov.tw/facarea.aspx (accessed on 12 January 2013).
- Chen, H.S.; Chien, L.H.; Hsieh, T. A study of assessment indicators for environmental sustainable development of science park in Taiwan. Environ. Monit. Assess. 2013, 185, 7001–7012. [Google Scholar] [CrossRef] [PubMed]
- Chen, Y.; Chen, C.Y.; Hsieh, T. Establishment and applied research on environmental sustainability assessment indicators in Taiwan. Environ. Monit. Assess. 2009, 155, 407–417. [Google Scholar] [CrossRef] [PubMed]
- Chen, Y.; Chen, C.Y.; Hsieh, T. Exploration of sustainable development by applying green economy indicators. Environ. Monit. Assess. 2011, 182, 279–289. [Google Scholar] [CrossRef] [PubMed]
- Falkenmark, M. Comparative hydrology—A new concept. In Comparative Hydrology: An Ecological Approach to Land and Water Resources; Falkenmark, M., Chapman, T., Eds.; Unesco: Paris, France, 1989; pp. 10–42. [Google Scholar]
- Seckler, D.; Amarasinghe, U.; Molden, D.; de Silva, R.; Barker, R. World Water Demand and Supply, 1990 to 2025: Scenarios and Issues; Research Report 19; International Water Management Institute: Colombo, Sri Lanka, 1998. [Google Scholar]
- Sullivan, C.A.; Meigh, J.R.; Giacomello, A.M. The water Poverty Index: Development and application at the community scale. Nat. Resour. Forum 2003, 27, 189–199. [Google Scholar] [CrossRef]
- Raskin, P.; Gleick, P.; Kirshen, P.; Pontius, G.; Strzepek, K. Water Futures: Assessment of Long-Range Patterns and Problems; Comprehensive Assessment of the Freshwater Resources of the World; Stockholm Environment Institute: Stockholm, Sweden, 1997. [Google Scholar]
- Morrison, J.; Schulte, P.; Christian-Smith, J.; Orr, S.; Hepworth, N.; Pegram, G. The CEO Water Mandate Guide to Responsible Business Engagement with Water Policy. Available online: http://www.unglobalcompact.org/docs/issues_doc/Environment/ceo_water_mandate/Guide_Responsible_Business_Engagement_Water_Policy.pdf (accessed on 16 February 2011).
- Hoekstra, A.Y.; Chapagain, A.K. Globalization of Water: Sharing the Planet’s Freshwater Resources; Blackwell: Oxford, UK, 2008. [Google Scholar]
- Hoekstra, A.Y.; Chapagain, A.K. Water footprints of nations: Water use by people as a function of their consumption pattern. Water Resour. Manag. 2007, 21, 35–48. [Google Scholar] [CrossRef]
- Aldaya, M.M.; Hoekstra, A.Y. The water needed for Italians to eat pasta and pizza. Agric. Syst. 2010, 103, 351–360. [Google Scholar] [CrossRef]
- Velázquez, E.; Madrid, C.; Beltrán, M.J. Rethinking the concepts of virtual water and water footprint in relation to the production-consumption binomial and the water-energy nexus. Water Resour. Manag. 2011, 25, 743–761. [Google Scholar] [CrossRef]
- Ercin, A.E.; Aldaya, M.M.; Hoekstra, A.Y. Corporate water footprint accounting and impact assessment: The case of the water footprint of a sugar-containing carbonated beverage. Water Resour. Manag. 2011, 25, 721–741. [Google Scholar] [CrossRef]
- Chapagain, A.K.; Hoekstra, A.Y. The water footprint of coffee and tea consumption in The Netherlands. Ecol. Econ. 2007, 64, 109–118. [Google Scholar] [CrossRef]
- Chapagain, A.K.; Orr, S. An improved water footprint methodology linking global consumption to local water resources: A case of Spanish tomatoes. J. Environ. Manag. 2009, 90, 1219–1228. [Google Scholar] [CrossRef]
- Bulsink, F.; Hoekstra, A.Y.; Booij, M.J. The water footprint of Indonesian provinces related to the consumption of crop products. Hydrol. Earth Syst. Sci. 2010, 14, 119–128. [Google Scholar] [CrossRef]
- Mekonnen, M.M.; Hoekstra, A.Y. The green, blue and grey water footprint of crops and derived crop products. Hydrol. Earth Syst. Sci. 2011, 15, 1577–1600. [Google Scholar] [CrossRef]
- Hoekstra, A.Y.; Mekonnen, M.M. The water footprint of humanity. Proc. Natl. Acad. Sci. 2012, 109, 14–25. [Google Scholar]
- Zhao, X.; Chen, B.; Yang, Z.F. National water footprint in an input-output framework—A case study of China 2002. Ecol. Model. 2009, 220, 245–253. [Google Scholar] [CrossRef]
- Wang, H.; Wang, Y. An input-output analysis of virtual water uses of the three economic sectors in Beijing. Water Int. 2009, 34, 451–467. [Google Scholar] [CrossRef]
- Zhao, X.; Yang, H.; Yang, Z.F.; Chen, B.; Qin, Y. Applying the input-output method to account for water footprint and virtual water trade in the Haihe River basin in China. Environ. Sci. Technol. 2010, 44, 9150–9156. [Google Scholar] [CrossRef] [PubMed]
- Aviso, K.B.; Tan, R.R.; Culaba, A.B.; Cruz, J.B., Jr. Fuzzy input-output model for optimizing eco-industrial supply chains under water footprint constraints. J. Clean. Prod. 2011, 19, 187–196. [Google Scholar] [CrossRef]
- Chapagain, A.K.; Hoekstra, A.Y. The blue, green and grey water footprint of rice from production and consumption perspective. Ecol. Econ. 2011, 70, 749–758. [Google Scholar] [CrossRef]
- Elena, G.C.; Esther, V. From energy to water: The virtual water content and water foot print of biofuel consumption in Spain. Energy Policy 2010, 38, 1345–1352. [Google Scholar] [CrossRef]
- Yu, Y.; Hubacek, K.; Feng, K.; Guan, D. Assessing regional and global water footprints for the UK. Ecol. Econ. 2010, 69, 1140–1147. [Google Scholar] [CrossRef]
- Gerbens-Leenes, P.W.; Hoekstra, A.Y.; van der Meer, T.H. Water footprint of bio-energy and other primary energy carriers. In Value of Water Research Report Series No. 29; UNESCO-IHE: Delft, The Netherlands, 2008. [Google Scholar]
- Van Oel, P.R.; Hoekstra, A.Y. The green and blue water footprint of paper products: Methodological considerations and quantification. In Value of Water Research Report Series No. 46; UNESCO-IHE: Delft, The Netherlands, 2010. [Google Scholar]
- Mekonnen, M.M.; Hoekstra, A.Y. The green, blue and grey water footprint of farm animals and animal products. In Value of Water Research Report Series No. 48; UNESCO-IHE: Delft, The Netherlands, 2010. [Google Scholar]
- Hoekstra, A.Y.; Hung, P.Q. Virtual water trade: A quantification of virtual water flows between nations in relation to international crop trade. In Value of Water Research Report Series No. 12; Hoekstra, A.Y., Ed.; UNESCO-IHE: Delft, The Netherlands, 2003; pp. 25–48. [Google Scholar]
- Hoekstra, A.Y.; Chapagain, A.K.; Aldaya, M.M.; Mekonnen, M.M. The Water Footprint Assessment Manual: Setting the Global Standard; Earthscan: London, UK, 2011. [Google Scholar]
- Hoekstra, A.Y.; Chapagain, A.K.; Aldaya, M.M.; Mekonnen, M.M. Water Footprint Manual: State of the Art 2009; Water Footprint Network: Enschede, The Netherlands, 2009. Available online: http://www.waterfootprint.org/downloads/WaterFootprintManual2009.pdf (accessed on 2 February 2011).
- Zhao, C.F.; Chen, B. Driving force analysis of the agricultural water footprint in China based on the LMDI method. Environ. Sci. Technol. 2014, 48, 12723–12731. [Google Scholar] [CrossRef] [PubMed]
- Zhao, C.F.; Chen, B.; Hayat, T.; Alsaedi, A.; Ahmad, B. Driving force analysis of water footprint change based on extended STIRPAT model: Evidence from the Chinese agricultural sector. Ecol. Indic. 2014, 47, 43–49. [Google Scholar] [CrossRef]
- Fang, D.L.; Fath, B.D.; Chen, B.; Ursula, S. Network environ analysis for a socio-economic water system. Ecol. Indic. 2014, 47, 80–88. [Google Scholar] [CrossRef]
- Hoekstra, A.Y.; Hung, P.Q. Virtual water trade, a quantification of virtual water flows between nations in relation to international crop trade. In Value of Water Research Report Series No. 11; UNESCO-IHE: Delft, The Netherlands, 2002. [Google Scholar]
- Chapagain, A.K.; Hoekstra, A.Y. Water footprint of nations. In Value of Water Research Report Series No. 16; UNESCO-IHE: Delft, The Netherlands, 2004. [Google Scholar]
- Oki, T.; Kanae, S. Virtual water trade and world water resources. Water Sci. Technol. 2004, 49, 203–209. [Google Scholar] [PubMed]
- Aldaya, M.M.; Hoekstra, A.Y.; Allan, J.A. Strategic importance of green water in international crop trade. In Value of Water Research Report Series No. 25; UNESCO-IHE: Delft, The Netherlands, 2008. [Google Scholar]
- Hanasaki, N.; Inuzuka, T.; Kanae, S.; Oki, T. An estimation of global virtual water flow and sources of water withdrawal for major crops and livestock products using a global hydrological model. Hydrol. Earth Syst. Sci. 2010, 384, 232–244. [Google Scholar]
- Leontief, W. Technological change, prices, wages, and rates of return on capital in the U.S. economy. In Input-Output Economics, 2nd ed.; Oxford University Press: New York, NY, USA, 1986. [Google Scholar]
- Munksgaard, L.; Jensen, M.B.; Pedersen, L.J.; Hansen, S.T.; Matthews, L. Quantifying behavioural priorities—Effects of time constraints on behaviour of dairy cows, Bos taurus. Appl. Anim. Behav. Sci. 2005, 92, 3–14. [Google Scholar] [CrossRef]
- Kondo, K. Economic analysis of water resources in Japan: Using factor decomposition analysis based on input-output tables. Environ. Econ. Policy Stud. 2005, 7, 109–129. [Google Scholar] [CrossRef]
- Guan, D.; Hubacek, K. Assessment of regional trade and virtual water flows in China. Ecol. Econ. 2007, 61, 159–170. [Google Scholar] [CrossRef]
- Chou, C.E.; Lee, G.E. Virtual water flows and food security in Taiwan. In Proceedings of the Joint Annual Conference of Taiwan Economic Association, Taiwan Society of Health Economics and Taiwan Agricultural and Resources Economics Association, Taipei, Taiwan, 12–15 December 2009.
- Zhang, Z.; Shi, M.; Yang, H.; Chapagan, A. An input-output analysis of trends in virtual water trade and the impact on water resources and uses in China. Econ. Syst. Res. 2011, 23, 431–446. [Google Scholar] [CrossRef]
- Feng, K.; Siu, Y.L.; Guan, D.; Hubacek, K. Assessing regional virtual water flows and water footprints in the Yellow River Basin, China: A consumption based approach. Appl. Geogr. 2012, 32, 691–701. [Google Scholar] [CrossRef]
- Chou, C.E.; Lee, G.E. Establishment of Environment Value Matrix of Green Accounting and Index Systems; Research project commissioned by the National Science Council: Taipei, Taiwan, 2006. [Google Scholar]
- Wiedmann, T.; Lenzen, M.; Turner, K.; Barrett, J. Examining the global environmental impact of regional consumption activities—part 2: Review of input-output models for the assessment of environmental impacts embodied in trade. Ecol. Econ. 2007, 61, 15–26. [Google Scholar] [CrossRef]
- Lenzen, M.; Gallego, B.; Wood, R. Matrix balancing under conflicting information. Econ. Syst. Res. 2009, 21, 23–44. [Google Scholar] [CrossRef]
- Blackhurst, B.M.; Hendrickson, C.I.; Vidal, J.S. Direct and indirect water withdrawals for U.S. industrial sectors. Environ. Sci. Technol. 2010, 44, 2126–2130. [Google Scholar] [CrossRef]
© 2015 by the authors; licensee MDPI, Basel, Switzerland. This article is an open access article distributed under the terms and conditions of the Creative Commons Attribution license (http://creativecommons.org/licenses/by/4.0/).
Share and Cite
MDPI and ACS Style
Chen, H.-S. Using Water Footprints for Examining the Sustainable Development of Science Parks. Sustainability 2015, 7, 5521-5541. https://doi.org/10.3390/su7055521
AMA Style
Chen H-S. Using Water Footprints for Examining the Sustainable Development of Science Parks. Sustainability. 2015; 7(5):5521-5541. https://doi.org/10.3390/su7055521
Chicago/Turabian StyleChen, Han-Shen. 2015. "Using Water Footprints for Examining the Sustainable Development of Science Parks" Sustainability 7, no. 5: 5521-5541. https://doi.org/10.3390/su7055521