Article

Changes in Arable Land Demand for Food in India and China: A Potential Threat to Food Security

1
Center for Monsoon System Research, Institute of Atmospheric Physics, Chinese Academy of Sciences, Beijing 100029, China
2
State Key Laboratory of Earth Surface Processes and Resource Ecology, College of Global Change and Earth System Science, Beijing Normal University, Beijing 100875, China
3
Key Laboratory of Middle Atmosphere and Global Environmental Observations, Institute of Atmospheric Physics, Chinese Academy of Sciences, Beijing 100029, China
*
Author to whom correspondence should be addressed.
Sustainability 2015, 7(5), 5371-5397; https://doi.org/10.3390/su7055371
Submission received: 3 March 2015 / Revised: 14 April 2015 / Accepted: 24 April 2015 / Published: 30 April 2015

Abstract

:
India and China are two similar developing countries with huge populations, rapid economic growth and limited natural resources, therefore facing the massive pressure of ensuring food security. In this paper, we will discuss the food security situations in these two countries by studying the historical changes of food supply-demand balance with the concept of agricultural land requirements for food (LRF) from 1963–2009. LRF of a country is a function of population, per capita consumption/diet, cropping yield and cropping intensity. We have attempted to discuss and compare our results in a framework which links consumption of different groups of food items to diet patterns; then, to the total land requirement for food in a scenario when population is growing rapidly and diet diversification and urbanization due to economic reform impose excessive pressure on food security of both countries. We also elaborate on the role of technology dissemination and critically analyze the achievements and drawbacks of government policies to ensure food self-sufficiency and food security of nations. Our results show that the total LRF increases approximately by 42% and 40%, whereas per capita LRF decreases significantly by about 48% and 30% from 1963–2009, for India and China, respectively. Furthermore, our studies reveal that population growth dominates most of the increase in total LRF for India; whereas diet pattern change induced by income growth drives the major increase in LRF for China. Therefore, sustainable management of agricultural land resource is an urgent need both for India and China as there will be demand for more food to meet the diet requirement for the entire population. We also demonstrate the role of India and China in future global food security programs and the challenges to implement the new land reform policies domestically.

1. Introduction

China and India are the two most populated countries in the world, ranked respectively first (1.4 billion) and second (1.2 billion) ([1], 2012; Figure 1, left panel). However, the current rate of population growth in India is about 1.4% per year, more than double that in China (0.5%) and it is projected that India will surpass China by 2030 with a capacity of 1.53 billion and continue to increase thereafter when China starts to decline. China, due to one child policy in the late 1970s, is able to control its population growth. However, the rate of urbanization in China is much higher than that in India; for example, in 2011, the urban population of India and China was 377.1 million (31.16% of total) and 690.79 million (49.2% of total), respectively, and for China it will reach 900 million in 2030 [2,3,4]. Urbanization influences food preferences because the average incomes of the urban population are higher and rural populations demonstrate different food consumption patterns than their rural counterparts [5,6,7]. Moreover, the urban people consume more affluent animal-based food products compared to the rural population due to higher income, particularly in low-income countries [8,9,10,11,12]. This higher consumption of affluent food items exerts more pressure on the agricultural land demand of the countries.
Along with population growth, both the countries exhibit high aggregate and per capita income growth rates with substantial reduction in poverty and rapid globalization [13]. For China, rural economy and agriculture is the backbone for its escalating growth and development [14,15,16,17]. In micro scale, overall rural economy development affects the economy of the country as a whole [18]. Per capita income gap between urban and rural population lies between 1.5–1.7 and 3–3.5 for India and China, respectively [19]. Both for India and China, agriculture is the key component of the national economies, which accounted for more than 54% and 60% of total national employment in 2011 [20,21] and approximately 19% and 10% of GDP, respectively. In view of total agricultural production values, India and China rank third and first highest in the world [22], respectively.
Figure 1. Left panel indicates the temporal trend in agricultural land requirement for food and Gini Index, whereas right panel denotes the temporal trend in population growth and GDP for India (black) and China (blue).
Sustainability 07 05371 g001
There are a number of similarities between India and China in terms of socio-economic structures and development scenarios, which justify the comparison between the two nations. Firstly, both for India and China, the economies are highly planned in terms of future reform and growth. Secondly, the recent trend of industrialization and diet diversification induce several inequalities and regional disparities in per capita income, food habits and living standards, both for India and china [23]. Thirdly, the societies of both the countries have strong differences in rural–urban development scenarios. Lastly, both India and China are currently undergoing tremendous transformations due to reform and globalization, which substantially affect income distribution and inequality [23]. Despite these similarities, the institutional conditions, particularly the macroeconomic imbalances, unemployment and income inequality are very different in both the countries. Poor economic and land reform policies affect the substantial redistribution of assets among the people of India. On the other hand, for China the policies eliminated the landlordism and resulted in greater equality of access to land and other assets among the small holder peasants [13]. Despite economic reforms in India around 1990, the macroeconomic balances remain substantial.
In the present manuscript, we have attempted to quantify and compare the differences in the historical changes in land requirement for food due to economic reforms, population growth and diet diversification in the light of government policies and initiatives. Section 2 describes the geographical and socio economic background of the study area, i.e., India and China, Section 3 the data and the methodology adopted to estimate the total LRF, and Section 4 discusses the results which include the trend in total food, consumption, diet pattern changes, production, cropping yield, and total and per capita LRF. We have also implemented a sensitivity analysis to quantify the individual impact of population, diet and technology on the net national LRF of India and China. Section 5 elaborates on the government policies for food security, food self-sufficiency, income support to the farmers and sustainable agriculture. Finally, Section 6 concludes and summarizes the results with future projections.

2. Study Area: India and China

The Indian peninsula comprises of varied landscape from extreme mountains (Himalayas) in the North to vast oceans (Bay of Bengal, Indian Ocean, and Arabian Sea) in the South. It experiences two types of monsoons, the summer (June–September) and the winter monsoon (October–November), which strongly modulates the agricultural system, development and economy of the whole country. In the field of agriculture, India ranks second worldwide in farming output. As a major developing nation in South Asia, agriculture and allied sectors accounted for 19% of the GDP in 2011 [22]. The agricultural land area corresponds to 57% of the total geographic landmass (328.73 MHa) of the country [23].
On the other hand, China experiences complex and diverse landscapes with a significant East Asian monsoonal climate, which is strongly affected by several natural disasters like droughts, floods, cold waves, uneven distribution of water resources, etc. China is the world’s largest producer of food as it constitutes around 22% of the world’s population, but only 13% of the nation’s landmass is arable and suitable for agriculture [21]. Agriculture accounted for 10% of the nation’s GDP in 2011 [22]. The rate of urbanization in China has increased from 20% in 1979 to 49% in 2010, accounting for a growth rate twice the world average in the same period [24]. On the other hand, the average per capita agricultural land area has decreased from 0.14 ha in 1979 to 0.09 ha in 2009, which is far below the world average of 0.22 ha capita [20]. Although several studies [25,26] estimate the per capita agricultural land demand in regional and national scale, respectively, they do not provide a credible estimate on the amount of agricultural land required to meet the food consumption and human nutritional demands in China [27]. Figure 1 (left panel), shows that from 1963–2009, the total arable land for India and China increased from 106 Mha and 120 Mha in 1963 to 162 and 170 Mha [27] in 2009, respectively.
From the economic development scenario, both for India and China, per capita GDP adjusted for purchasing power parity (PPP) in constant 2005 international dollars increases strikingly from 1000$ in 1980 to 3000$ and 6000$ in 2011, respectively (Figure 1, right panel). Nevertheless, per capita GDP only reflects the whole economic condition; it cannot reveal the entire complexity of the system. The Gini Index is the measure of income inequality distribution [28,29] of a country. From 1950 to the mid-1980s, the inequality decreased slowly from 0.37 to 0.29 for India, but since then it has tended to diverge and reached 0.40 in 2011, the internationally recognized warning line of high inequality, whereas, for China, until 2000 the trend increased to 0.4, and thereafter, it stabilized at higher levels (Figure 1, left panel). Although India has made significant economic progress in the last few decades, it still faces the challenge of overcoming social problems like poverty and malnutrition [30]. Based on the World Bank database, the poverty head count ratio at 2$/day criteria, India has made little progress from 89% in 1978 to 69% in 2010, whereas, due to rural growth [19], the poverty level for China decreased from 98% in 1981 to 27% in 2009 (Figure 2, right panel). From a food insecurity point of view, still 44% of the children (below 5 years) suffer from malnutrition, but for China, this proportion is only 3% (Figure 2, left panel). From a macro level point of view, per capita income among the females is much lower in India than China, particularly in the rural areas. Additionally, poor nutritional status, low birth weight, lack of professional health care and vaccination are the major key factors, where India scores meagerly in comparison to China [31]. Therefore, India still needs to achieve excellence to secure sufficient food supply for its entire population, which will eventually require more land for agriculture.
Figure 2. Temporal trend in malnutrition by weight of children under 5 years (%, left panel) and poverty head count ratio at 2$/day (%, right panel) for India (black) and China (blue).
Sustainability 07 05371 g002

3. Data and Methodology

In the present study, we use the data available on the Food and Agriculture Organization of the United Nations (www.fao.org) data archival website from 1963–2009 including the FAOSTAT (Classic) consumption, production, yield and area harvested data to assess the LRF in India and China, as listed in Table S1. As mentioned before, the GDP and Gini index data (until 2005) are available from World Bank (http://data.worldbank.org), India and China database. However, after 2005, for the Gini index of India, we have to rely on CIA international world factbooks and Euromonitor International report.
In our study, we adopt the methodology described by [32], and worked out the changes in historical land requirements for food in India and China from 1963–2009. Firstly, the individual processed food items (e.g., sugar, rice milled equivalent, etc.) are converted to their primary crop equivalents (e.g., sugarcane, rice-paddy, etc.) and the processing or conversion losses are then adjusted in the LRF calculation by means of the conversion factor. The LRF is separated into two parts, the vegetal origin part (LRFvegetal) and the animal origin part (LRFanimal). The LRFvegetal can be computed as follows,
L R F v e g e t a l = i c o n s u m p t i o n i     ×   c o n v e r s i o n   f a c t o r i y i e l d i   ×   c r o p p i n g   i n t e n s i t y
where i stands for the individual crop items and LRFvegetal is the sum total land requirement for the entire primary crop equivalents. In our analysis, we consider the cropping intensities, which are greater than or equal to 1 [32]. In an actual sense, land is commonly fallowed and planted regularly with possible variations and rotations of different crop items. Since the statistics on fallowed land are not readily available and cannot be linked to the single crops, we consider the cropping intensity of the whole country in one year instead. The yieldi is the crop yield for each crop item and the consumptioni is the total consumption of individual food items by the entire population of the country in one year. The conversion factori is used to connect the individual food items to their primary crop equivalents, i.e., 100 g (351 kcal) of sugar is assumed to be equivalent to 1170 g (30 kcal) of sugarcane, and then the conversion factor is 11.70. The caloric ntent of the individual food items and their primary crop equivalents are tabulated in Food Balance Sheet Handbook, FAO [33]. LRFanimal is the land required to feed the livestock products and is calculated as,
L R F a n i m a l = c o n s u m p t i o n a n i m a l ( k c a l ) ×   L R F v e g e t a l c o n s u m p t i o n v e g e t a l ( k c a l )   × f
where consumptionanimal(kcal) and consumptionvegetal(kcal) are the total consumption of the animal origin and vegetal origin food items in one year, respectively, and both are expressed in the calorie content form. The multiplication factor f arrives in Equation (2), based on the assumption that one calorie of animal origin food requires f times the amount of agricultural land required for an average calorie of vegetal origin. For India and China, the value of f ranges from 1–3 and 2–4, respectively. For our calculation, we have considered the overall mean value of 2 and 3 for India and China, respectively. This rough assumption is based on a number of studies dealing with agricultural land demand for animal origin food products [34]. Nevertheless, it is clear that an average animal calorie requires more agricultural land than a vegetal calorie and the results will not diverge much from the present one [32]. The total land requirement of a country must include consumption of food items originated from domestic source and also from international imports. Therefore, to take imports into account, we too have calculated the share of imports on LRF using Equations (1) and (2) (replacing consumption with imported quantity of respective food item) and finally added up the LRFdomestic and LRFimport to estimate the total LRF.
In this study, based on Table A1 in [32], we consider the consumption data for about 72 primary food items in 18 categories and further aggregate it into six groups: cereals (nine items), sugar and sugarcrops (five items), vegetal oils and oilcrops (22 items), fruits and vegetables (14 items), other vegetal food items (13 items) and animal products (nine items). Since our research is restricted to agricultural land, we exclude the products originated from the aquatic sources. The food consumption data in FAOSTAT include the net consumption of meat, offal, animal fats and milk, whereas the caloric content of cattle, mutton, pig and poultry products are different from each other (Table S2). Therefore, while calculating the LRFanimal, we consider the ratio of production as the ratio of consumption of the individual animal products, otherwise assigning the same caloric value for the entire meat, offal, animal fats and milk family may lead to an incorrect estimate of LRF.
The Food Balance Sheet consumption data are available both in national annual total (tonnes) and daily per capita (kcal) consumption form (Table S1). The former is used to estimate the LRF and the later to explain the average diet of the country.

4. Results and Discussions

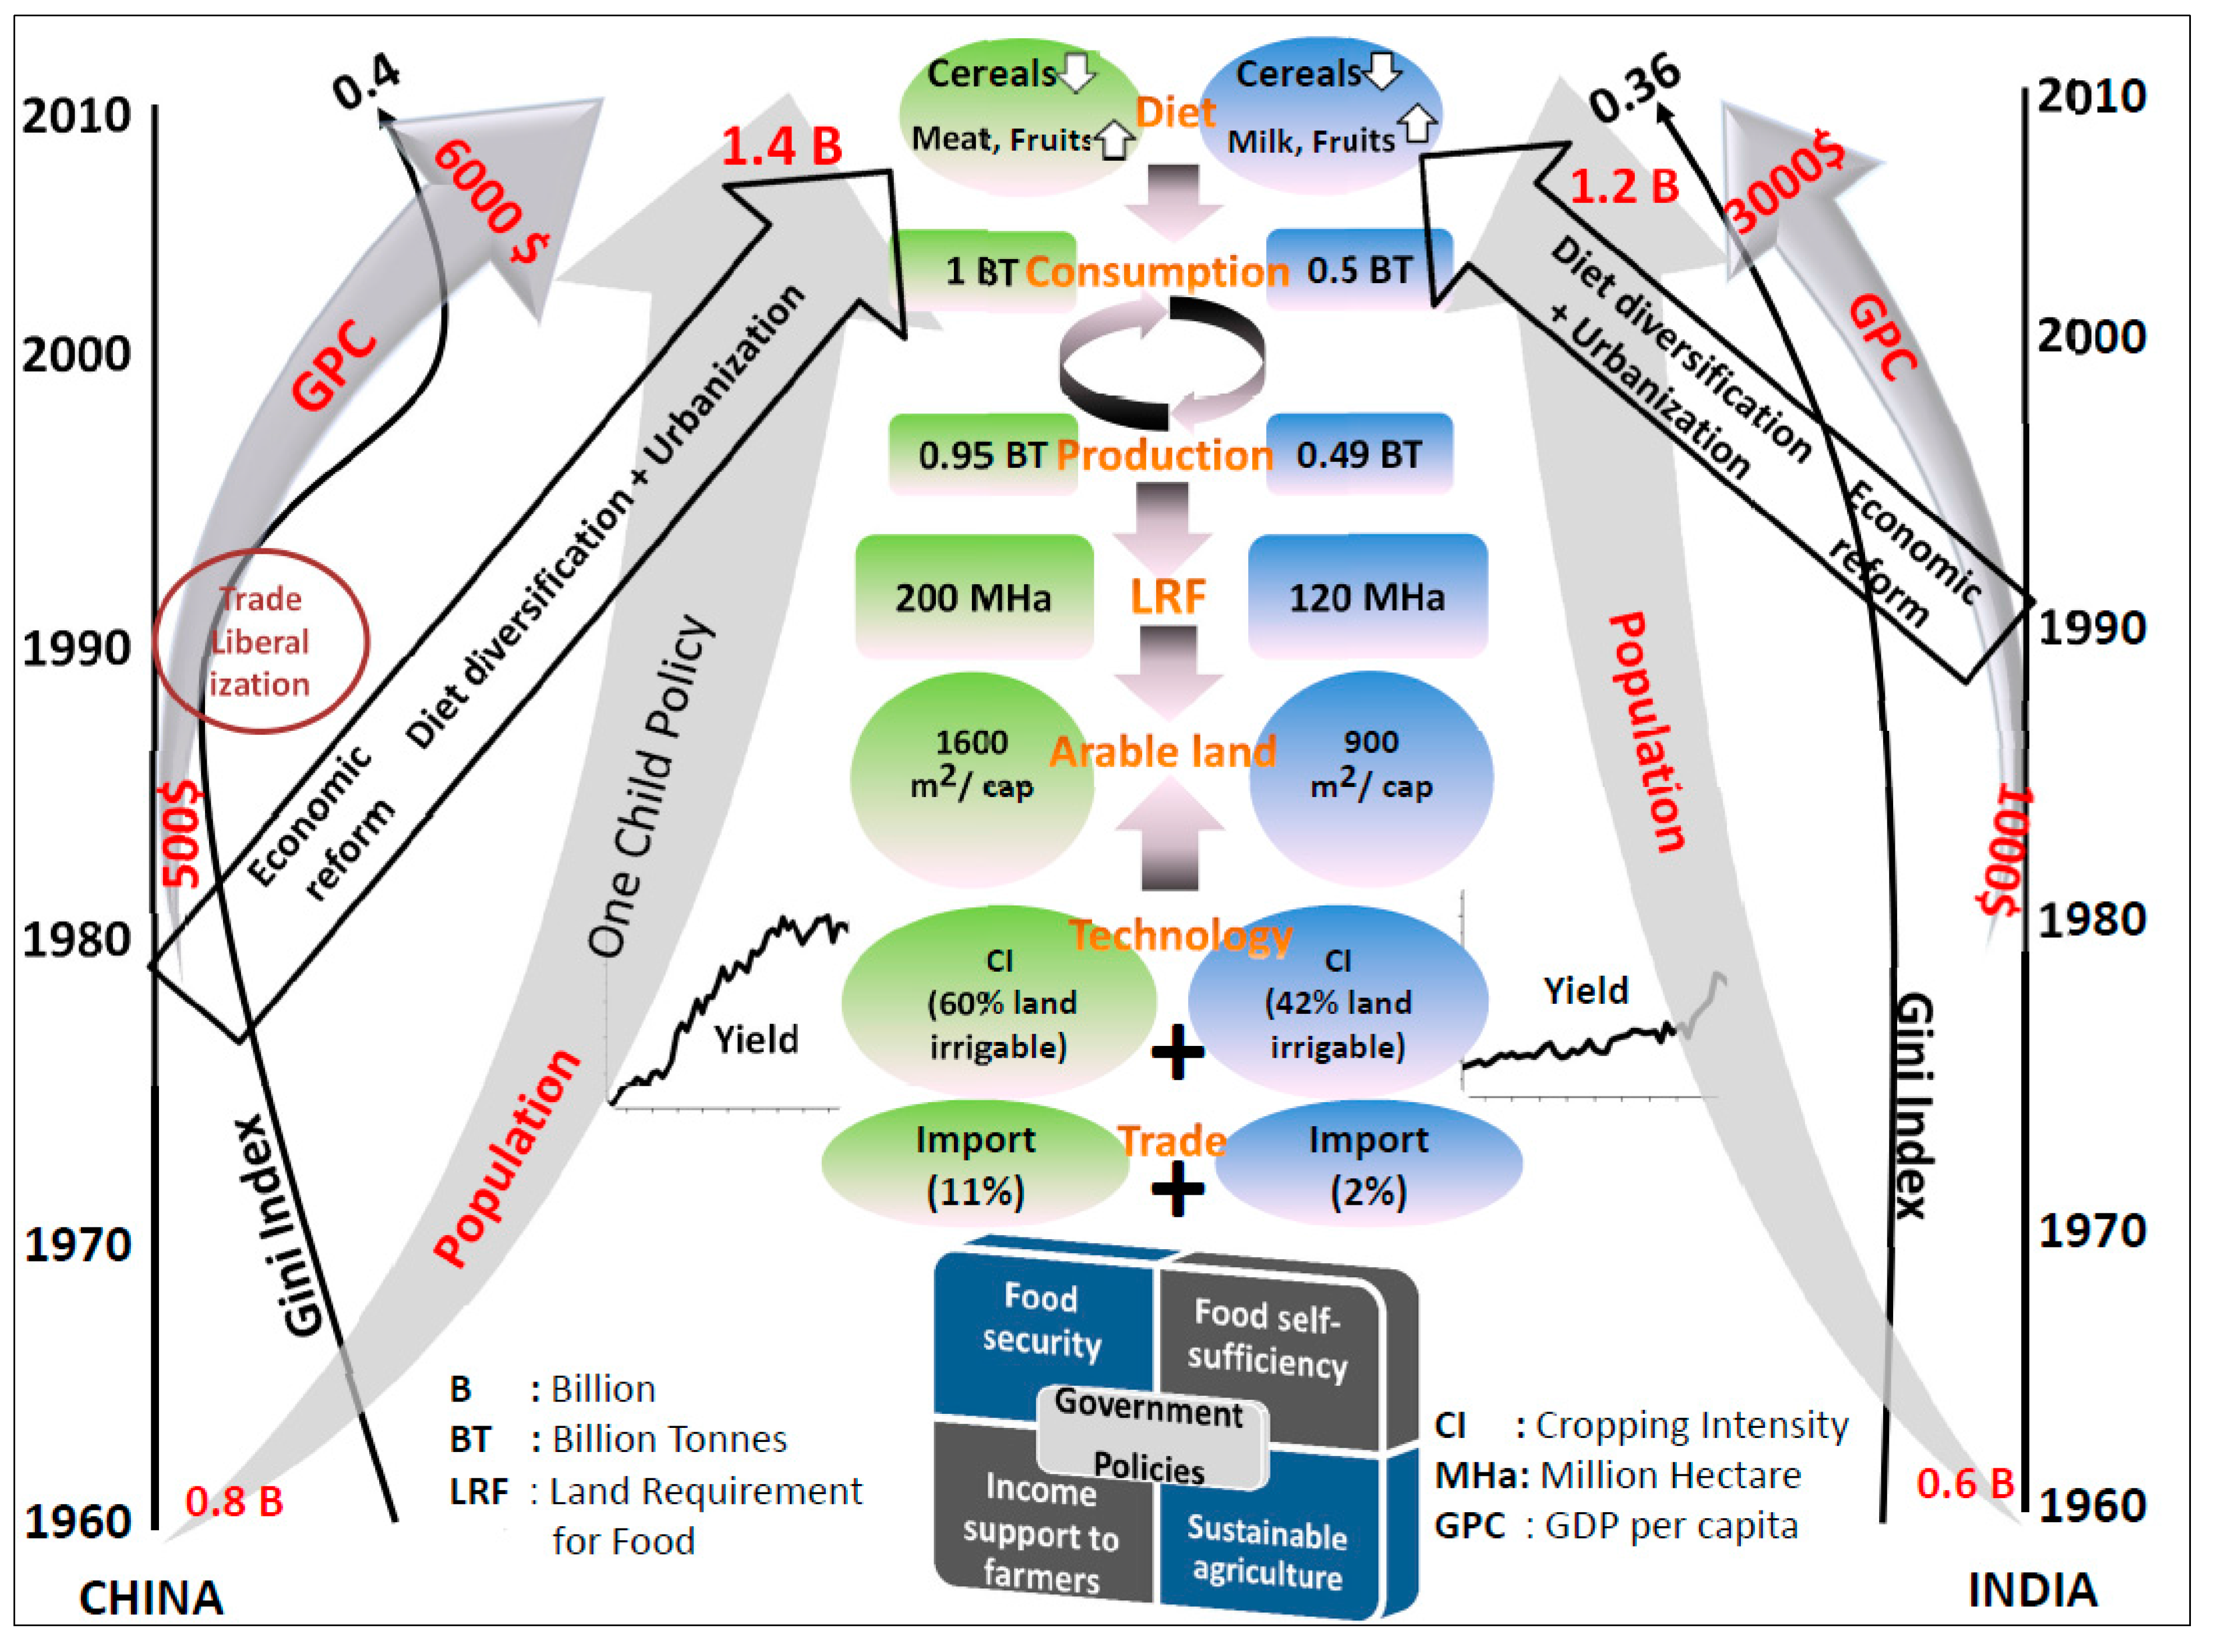
4.1. Consumption, Production, Diet Pattern and Per Capita Income Changes in Transition Economy
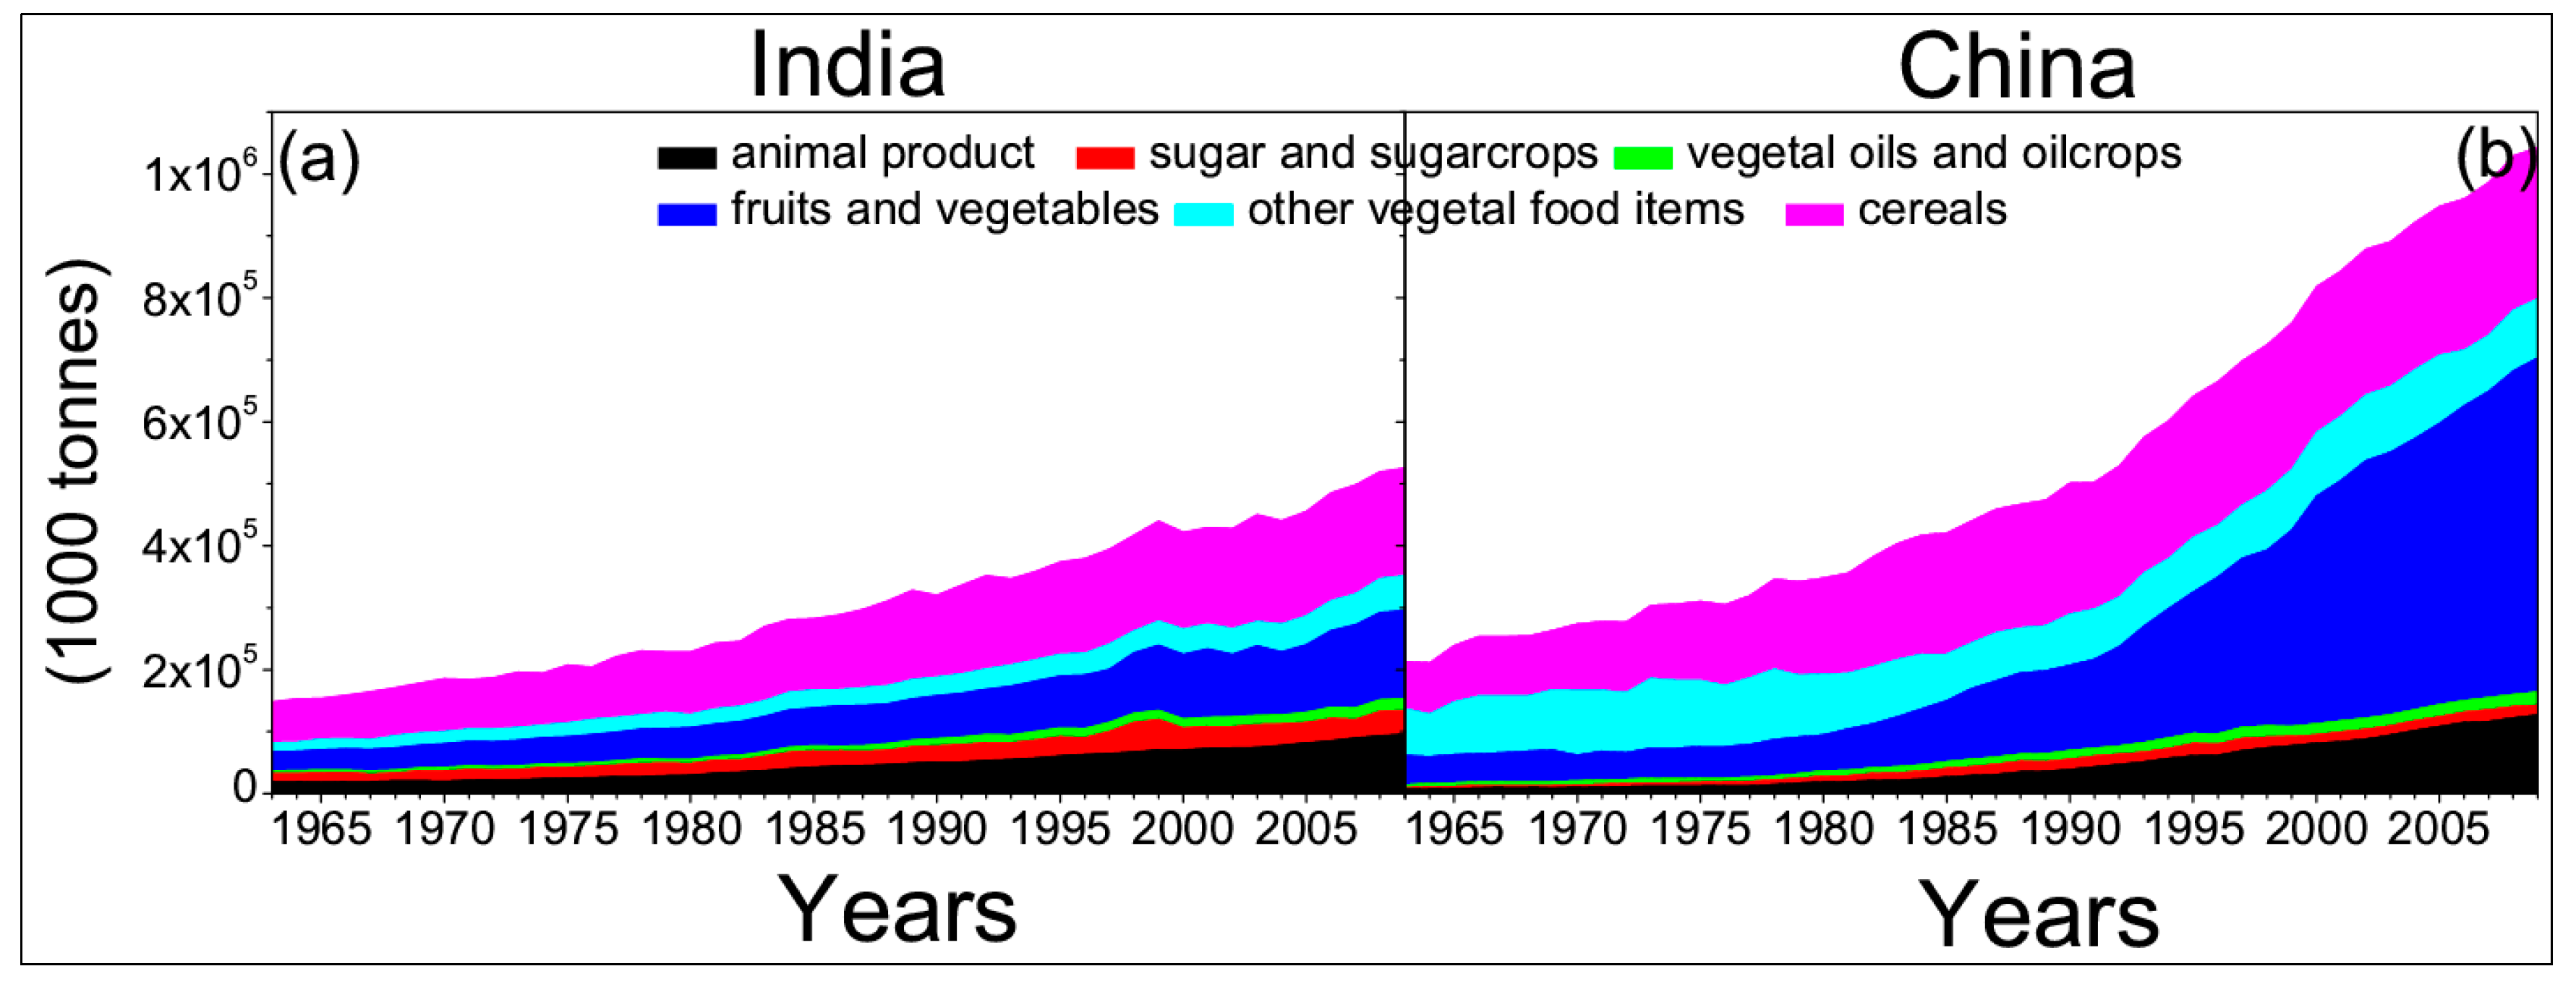
In the present analysis, the food consumption data are used to estimate the average yearly consumption of food of the entire population [35,36]. These values refer to the household supply of the food items without accounting for the household level losses. The historical changes in total consumption and daily per capita consumption are shown in Figure 3 and Figure 4, respectively.
Figure 3. Total consumption of food (1000 tonnes) for (a) India and (b) China.
Sustainability 07 05371 g003
Figure 4. Temporal changes in per capita consumption (kcal/capita/day) of (a) cereals; (b) animal products; (c) sugarcrops and vegetal oils and oilcrops; and (d) fruits and vegetables and other vegetal food items for India (black) and China (blue).
Sustainability 07 05371 g004

4.1.1. Consumption

The total food consumption of India (Figure 3a) increased from 175 million tonnes (MT) in 1963 to 500 MT in 2009 [37], whereas for China (Figure 3b) it increased from 210 MT in 1963 to 1000 MT in 2009. This increase in total consumption for both the countries can be attributed to the increase in population in the recent decades. Although total consumption is increasing, daily per capita food consumption for different groups of food items is variable. Figure 4a–d shows the daily per capita consumption of cereals, animal products, sugarcane and sugarcrops and fruits and vegetables and other vegetal food items, respectively, to explain the diet pattern changes in India and China.

4.1.2. Per Capita Consumption

Total food consumption only depicts total demand of food per annum, but daily per capita consumption reflects consumer taste and diet. Food consumption trend in China and India have several common characteristics over the last half century. Overall, the diet pattern has shifted away from cereal based food products to other affluent food groups, due to rapid urbanization and economic development [27,38,39,40,41]. Between 2000 and 2011, China experienced approximately fourfold increases in gross national income based on purchasing power parity (i.e., real income) [42]. Since then, beef, poultry, pork and total domestic meat demand increased by 13%, 19%, 19% and 7%, respectively [43]. While, in India, per capita income (based on purchasing power parity) has almost tripled in the same period and food habits have shifted towards affluent animal products and fruits and vegetables [42]. Energy or protein intake has increased among the poor, while it dropped for the rich. On the other hand, fat intake has risen for all income groups. The sources of energy and fat show some unique differences that might explain some of the disease pattern differences [44,45,46]. As is depicted in Figure 4, China consumes more animal products and vegetables in recent years, whereas Indians are dependent on dairy products, particularly milk. Since 1982, daily per capita intake of fruits and vegetables is noteworthy in China. On the other hand, the Chinese diet traditionally consumes less sugarcane as compared to India by several tens of kcal/day. In the case of cereals, both for India and China, daily per capita intake increased until the 1980s, and since then a declining trend can be noticed, which is perhaps related to the changes in diet pattern related to economic development. The decline in cereal consumption is substituted by the increased consumption of nutritional food products like fruits, vegetables and animal products [46].
The major differences in dietary patterns between China and India can best be illustrated by the individual trend of milk, pig meat, bovine meat and poultry meat consumption in Figure 5b,d,f,h, respectively. The major differences lie in the level of consumption of dairy based food products; particularly milk, which is increasing in India, with a much higher rate than in China. In contrast, the demand of nondairy animal based products available from meat is much higher in China than India.
The national level analysis may not reflect the entire complexity and heterogeneity of the system, because there is a huge interstate and rural–urban difference in diet patterns. Based on a National Sample Survey Organization (NSSO) survey report (1973–2005), in most of the states, the energy intake is higher in urban regions than their rural counterparts. The energy intake is higher in Bihar, Chhattisgarh, Haryana, Punjab, Uttar Pradesh, Rajasthan and Assam, whereas it is lower in Maharashtra, Tamil Nadu, Karnataka, Gujarat and Madhya Pradesh (NSSO survey report, 1973–2005). In general, fat consumption is higher in urban areas and states like Gujarat, Haryana and Punjab (nutrition foundation of India report) as compared to rural states like Orissa, Chhattisgarh and Assam. On the other hand, protein consumption is low in Tamil Nadu, Karnataka, Kerala, Orissa and West Bengal, where rice is the major cereal consumed and is higher in states like Punjab, Rajasthan and Haryana; this might be partly due to the fact that wheat is the staple cereal in these states and partly due to higher intake of animal products with high protein content in these states (nutrition foundation of India report).
Figure 5. Temporal trend in per capita production (left panel, Million tonnes) and per capita consumption (right panel, Million tonnes) of (a) rice; (b) milk; (c) wheat; (d) pig meat; (e) maize; (f) bovine meat; (g) sugarcane and (h) poultry meat for India (India) and China (blue).
Sustainability 07 05371 g005
In China, the changes in rural diet patterns are very prominent in the eastern and the northeastern provinces. They are more exposed to foreign food supply, which improves their consumption standards and preferences, while, for western and central regions, the trend is much lower. In the urban areas, the diet diversity index varies little in all four regions. Despite rapid development in the eastern provinces, the modest changes in the diversity index are primarily due to the busy schedule in the daily life of the urban city dwellers [38].

4.1.3. Per Capita Income

Per capita income distribution too has huge interstate difference in India, which drives the variability in consumer tastes and diet patterns. In urban states like Gujarat, Maharashtra, Himachal Pradesh, Haryana, and states in the northern plains (Punjab and Haryana), there are higher household incomes in comparison with the hilly states like Himachal Pradesh and Jammu and Kashmir. The states in the central regions like Bihar, Uttar Pradesh and Madhya Pradesh have low household incomes with the lowest in Orissa [37].
Along with the rural–urban income gap, China too has strong inter-provincial income disparity. Based on China statistical yearbook and Reuters, 2013 report, the annual per capita income in the coastal provinces (Beijing, Tianjin, Shanghai, Jiangsu, Zhejiang, Fujian, Guangdong Shandong and Liaoning) and the Western provinces (Henan, Guangxi, Shanxi, Sichuan, Ningxia, Yunnan, Qinghai, Xinjiang, Guizhou, Gansu and Tibet), is 20%–50% higher and lower than the national mean income level, respectively. It is moderate in the central (Hunan, Jiangxi, Hubei, Hebei, Anhui and Shanxi) and the north eastern region (Inner Mongolia, Jilin and Heilongjiang) with the lowest in Gansu, Tibet and Guizhou [38].

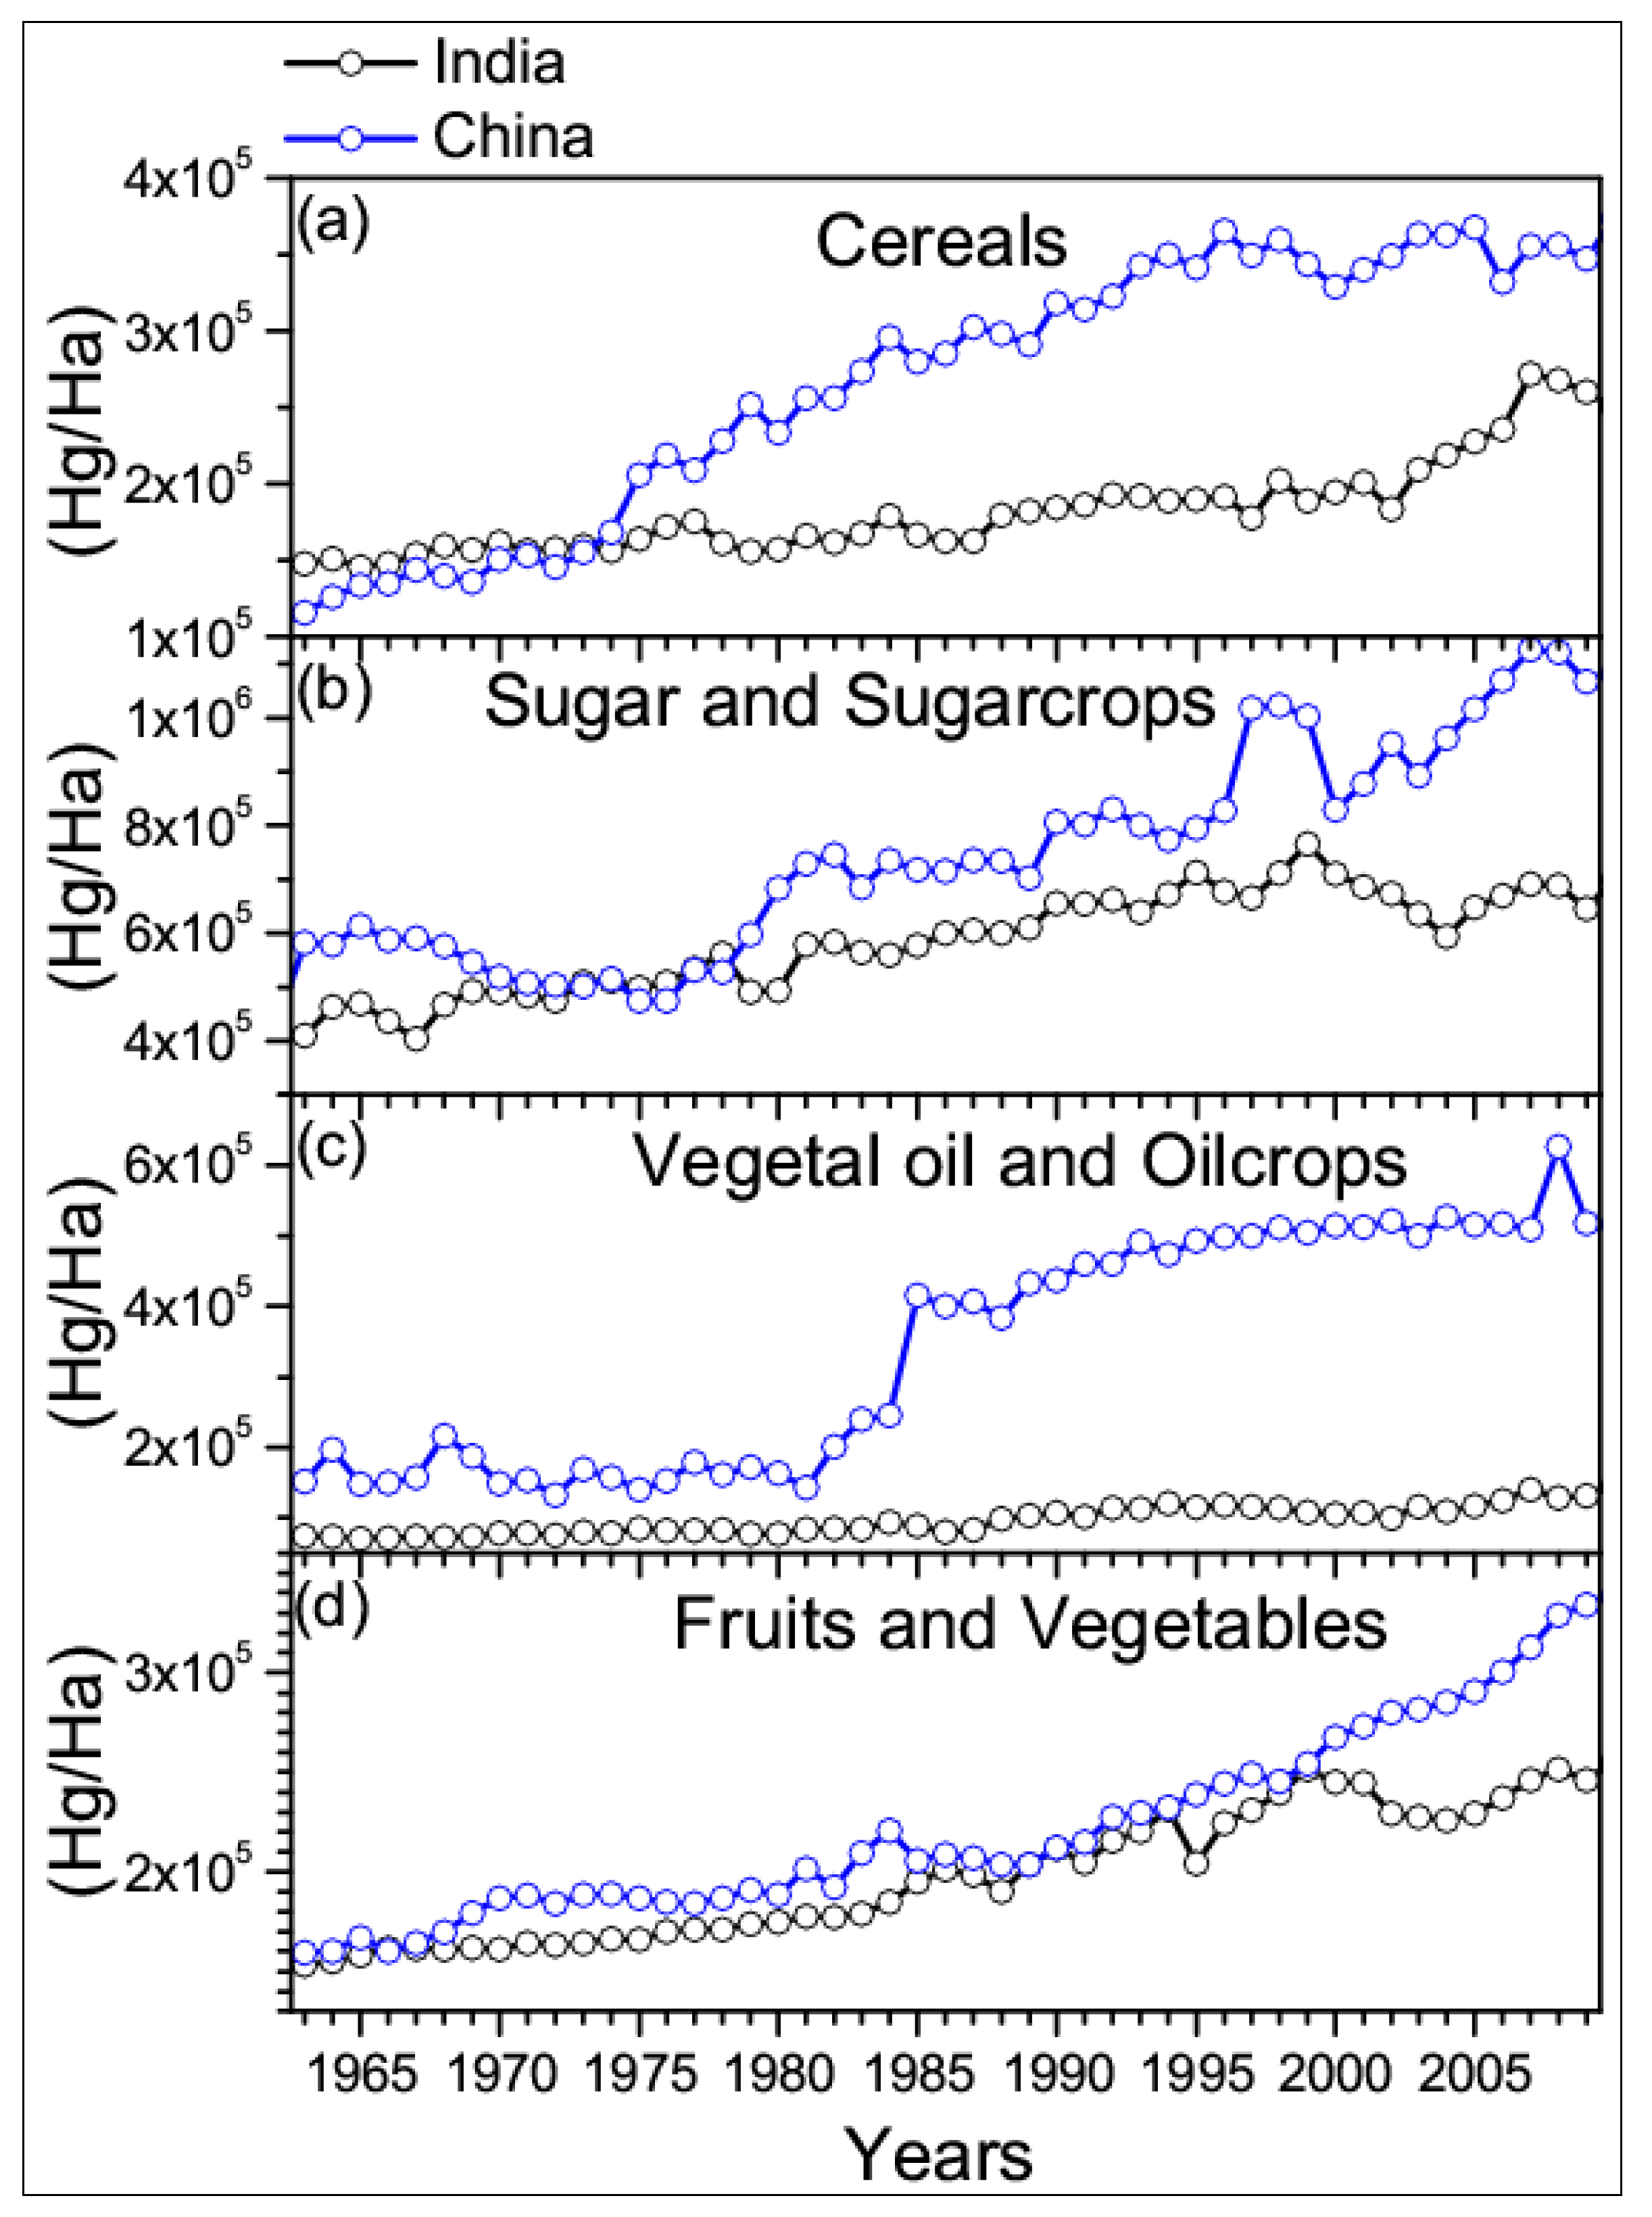
4.1.4. Per Capita Production and Consumption of Individual Food Items

While looking at the per capita production aspect (Figure 5), traditionally China is the world’s largest producer of rice and wheat and India ranks second, whereas, in maize and sugarcane production China (India) ranks second (fourth) and third (second) in the world [47]. However, both for India and China, the diets are centered on these three staple food grains. As both countries experienced widespread famine and drought due to weak monsoon in their recent histories, the goal of attaining self-sufficiency and food security in major food grains is a national political issue. Additionally, as agriculture plays a vital role to these nations’ GDP, the respective governments pay extreme attention to the growth of these sectors. Despite these similarities, both China and India have divergent histories, cultures, and resource infrastructures, which influence the production systems in the two nations [17]. Unequal distribution of agricultural land resources has significant disparity in the crop production systems of India and China. Despite the fact that India produces some livestock products, the predominance of the vegetarian diet, especially among the Hindu populations, results in animal husbandry focusing mostly on milk production rather than meat. China has ranked high in per capita pork, beef and poultry meat production and consumption (Figure 5), particularly since the early 1990s, whereas, in buffalo and cow milk production, India is far ahead (Figure 5). This subsequently increases the production of maize as feed.
Based on Department of Agriculture and Cooperation report in India, there is a huge inter-state variation in production of different crop items. West Bengal, Andhra Pradesh and Uttar Pradesh are the leading producers of rice, whereas, Uttar Pradesh, Punjab and Haryana rank high in wheat production. Rajasthan, Maharashtra and Karnataka are the leading producers of total coarse cereals and Madhya Pradesh, Maharashtra and Gujarat ranks the highest in total oil seed production. Uttar Pradesh, Maharashtra and Tamil Nadu are the largest producers of sugarcane.
China too has large regional variability in crop production. The southern and southeastern provinces receive good monsoons and the lands are more fertile and favorable for agricultural production. In contrast, the northwestern provinces (e.g., Inner Mongolia and Gansu) are hilly and mountainous and the cold, dry conditions are adverse to agricultural development (China statistical Year book report). The eastern part is the food bowl of China, whereas, the western landscape is mainly pastures. The southeastern part, which includes Guangdong, Guangxi, Fujian, Zhejiang, Hunan, Hubei, Anhui, Sichuan, Guizhou and Yunnan provinces are the major producer of rice, whereas, Shanxi, Henan, Hebei and Shandong provinces are the largest producers of wheat, corn and millet. The extreme northeastern provinces like Jilin and Heilongjiang are the largest contributors of soybeans (China Statistical Yearbook data).

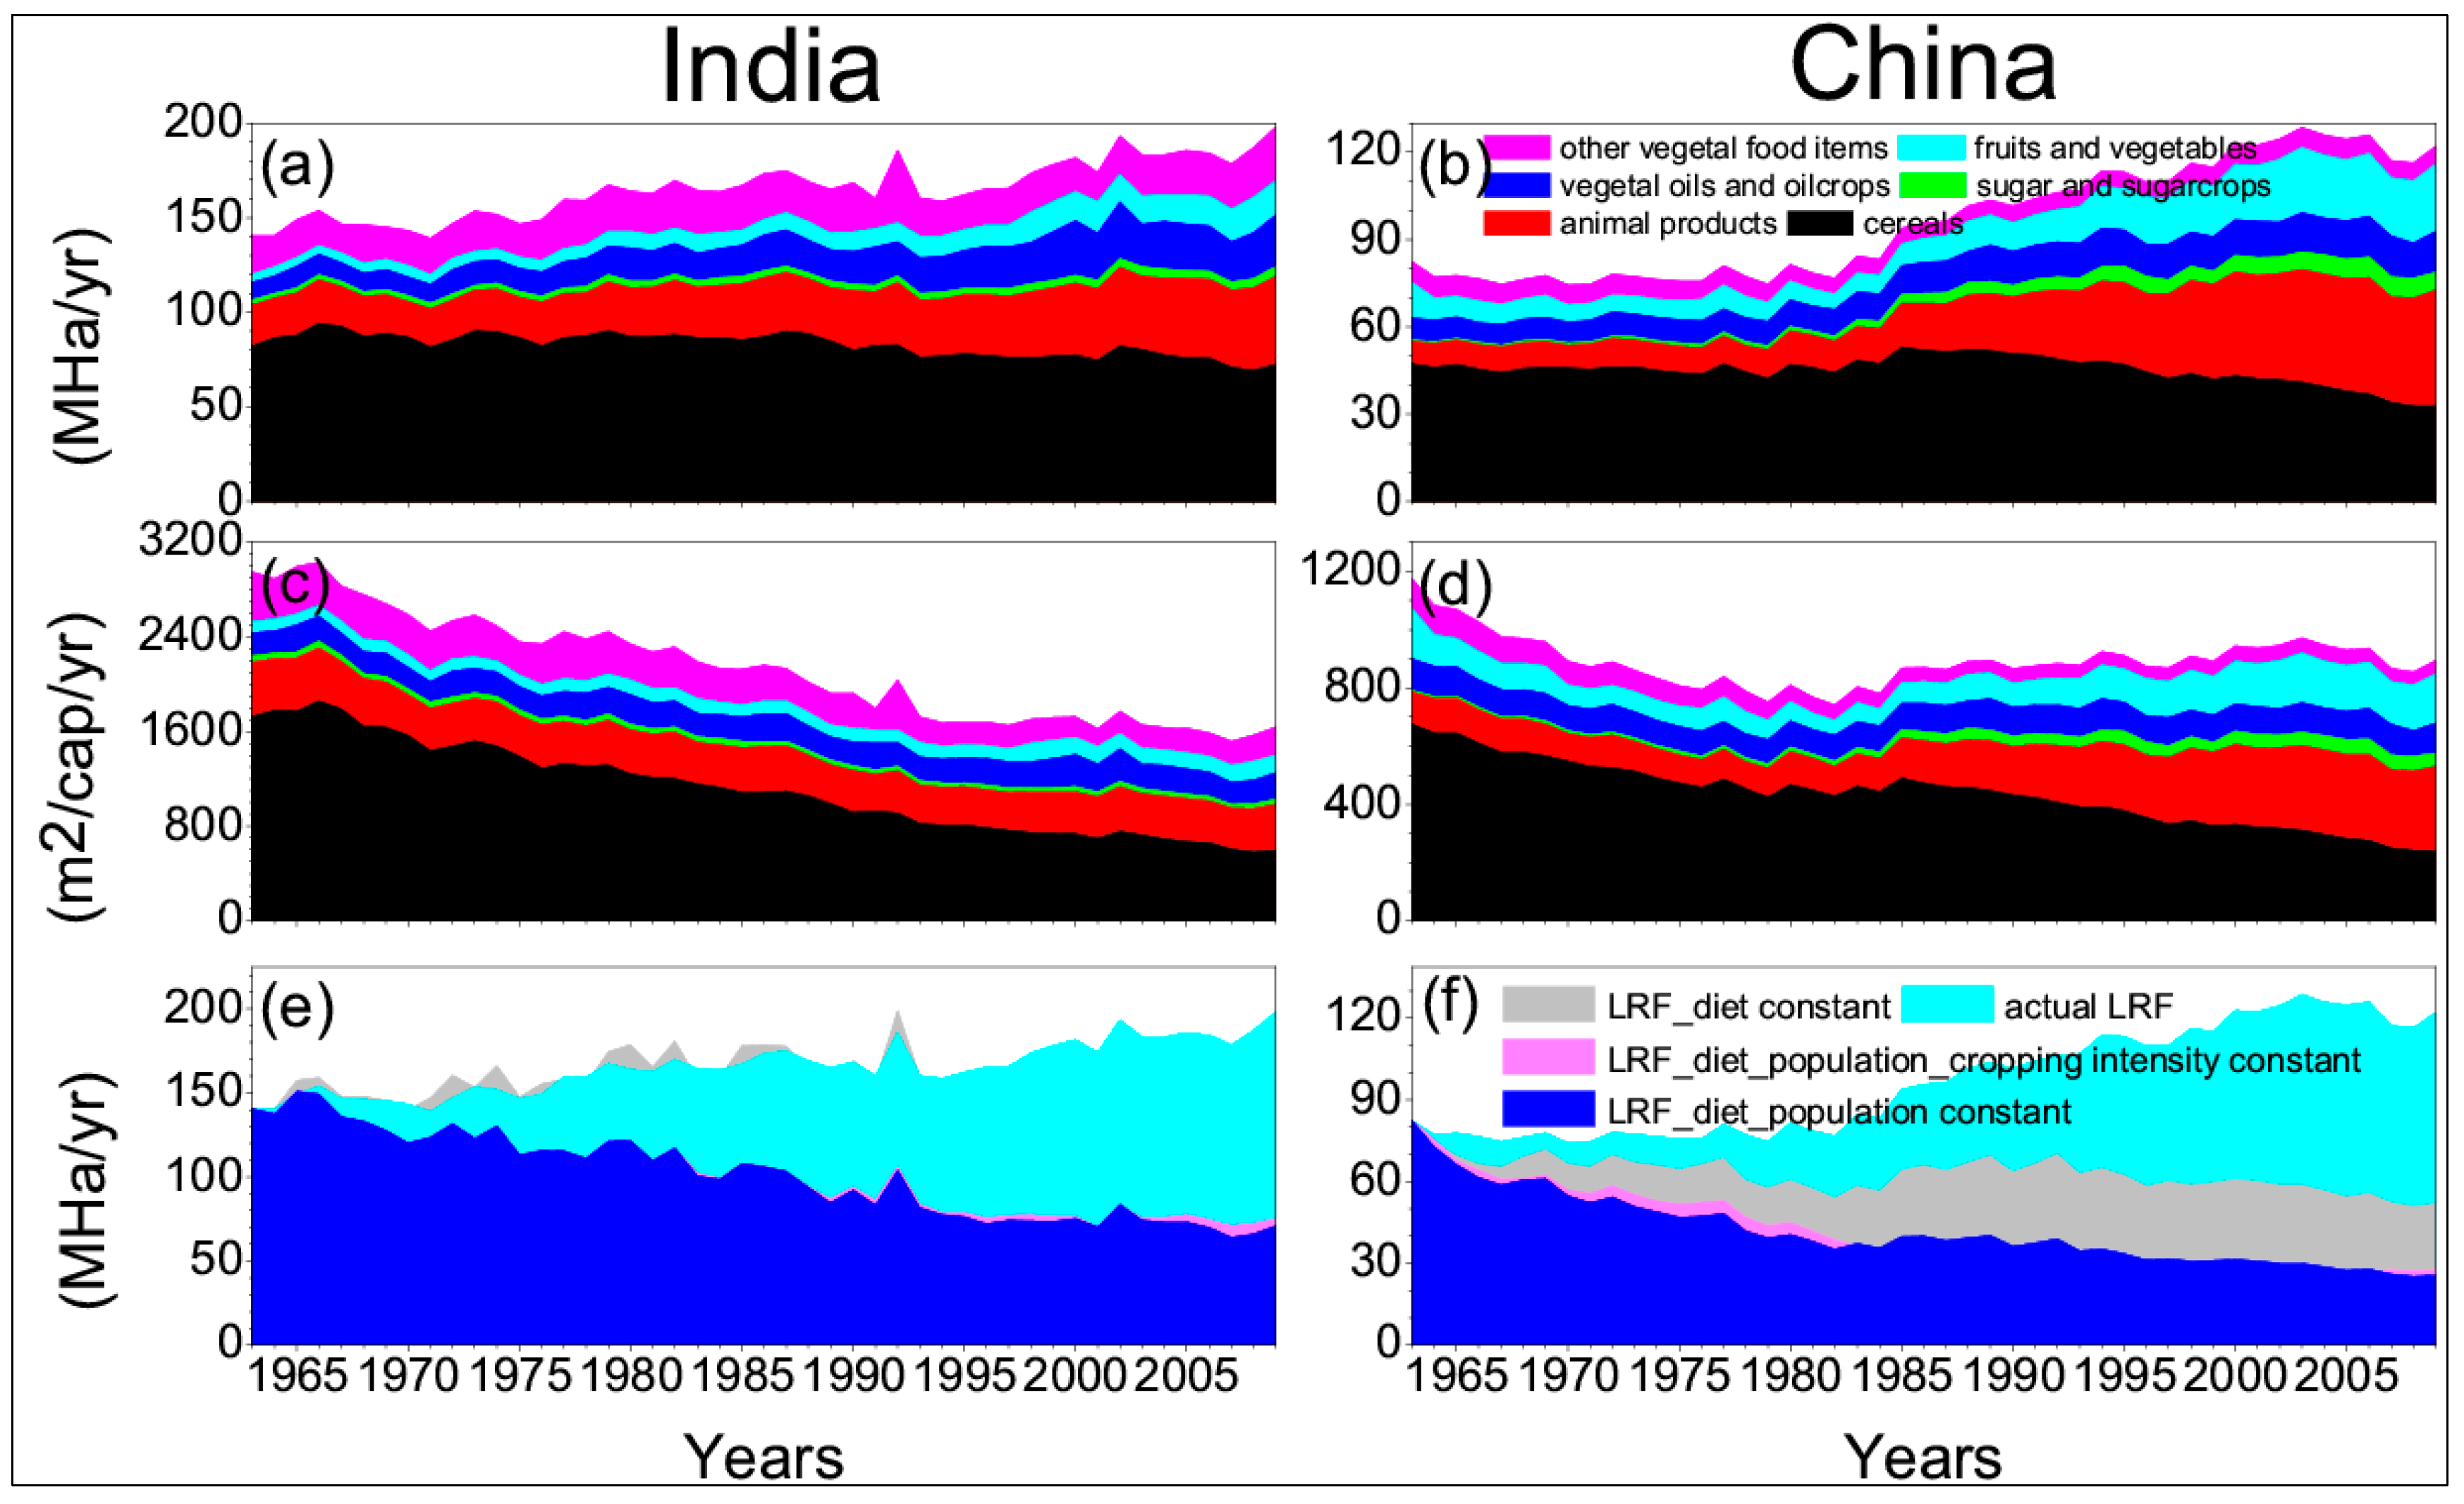
4.2. Total and Per Capita Land Requirement for Food in India and China

Unequal land resource distribution has great differences in the agricultural production of both the countries. Only 13% of China’s land area is suitable for agricultural production, in contrast with 57% [20,21]. In 2009, India’s total agricultural land is around 170 Mha, while China much lagged behind with 120 Mha only [37]. Figure 6a,b show the development of total LRF in India and China from 1963–2009, respectively. The net LRF of India increased approximately by 42% from 140 Mha in 1963 to 200 Mha in 2009 [37], but for China it increased by around 40% from 87 Mha in 1963 to 122 Mha in 2009. Looking at the contributions of different groups of food items, in particular for sugarcane, vegetal oils and oilcrops, fruits and vegetables and animal products, the average LRF increased significantly for both countries, whereas for cereals the average LRF decreased from 80 (47) Mha in 1963 to 72 (32.7) Mha in 2009, respectively, for India (China). For China, the LRF remained almost constant at 80 Mha until 1980 and thereafter it increased significantly to 122 Mha in 2009. Interestingly, per capita agricultural land requirement for food in India declined continuously from 1963–2009 (Figure 6c). About 3100 m2 of land area was needed to satisfy the average diet per person in 1963, which was substantially reduced approximately by 48% to 1600 m2 in 2009 [37]. For China, the reduction is 30%; in the beginning, the per capita LRF decreased from 1195 m2 in 1963 to 750 m2 in 1980 and thereafter it increased slightly to 900 m2 in 2009 (Figure 6d). This increase in per capita LRF can be attributed to the income-induced diet pattern change due to economic revolution around 1980 towards animal products and fruits and vegetables that require more land to grow and thereby increase the per capita LRF. Looking at the contribution of different food items, LRF per capita for cereals, animal products, sugarcane, vegetal oils and oilcrops, fruits and vegetables and other vegetal food items has decreased by approximately 66% (65%), 56% (32%), 55% (26%), 50% (23%), 45% (27%) and 47% (30%), respectively, for India (China).
Figure 6. Temporal trend in (a) and (b) total Land Requirement for Food (LRF) (MHa/ year); (c) and (d) per capita LRF (m2/cap/year) and (e) and (f) impact of the individual drivers: yield, cropping intensity, population and diet on total national LRF of India and China, respectively.
Sustainability 07 05371 g006
Figure 7. Temporal trend in cropping yield (Hg/Ha) of (a) cereals; (b) sugar and sugarcrops; (c) vegetal oil and oilcrops and (d) fruits and vegetables for India (black) and China (blue).
Sustainability 07 05371 g007
By accounting for population growth, the total LRF has increased substantially in the last few decades, whereas for the cereals the decline in LRF might be related to the implementation of improved yield due to green revolution technology and changes in food demand. Moreover, consumption of higher amounts of animal products, fruits, and vegetal oils is a crucial factor for LRF to increase and was induced by dietary changes around 1980. Although both countries have improved productivity and become self-sufficient largely due to widespread implementation of green revolution technology, China overcame the deficit through higher average crop yield. Average yields of rice and wheat in China are double and more than 50% the level in India, respectively [48]. This higher productivity is the result of several factors. First, China has almost twice as many agricultural laborers as India [20]; second, Chinese agriculture is characterized by more intensive input usage. The average fertilizer consumption exceeded 400 kg and 150 kg per ha in China and India, respectively [20,21]. Lastly, China has been able to achieve more consistent crop yields through high yielding varieties of seeds and large investments for greater access to irrigation. In 2009, nearly 60% of China’s agricultural land was irrigated, whereas only 42% for India. Indian farmers are much more likely to rely on monsoon rains, leading to more variable crop yields and a higher probability of crop failure due to erratic rainfall in any given year [21]. Although Figure 7a–d shows that the cropping yields of cereals, sugar and sugarcrops, vegetal oils and oilcrops and fruits and vegetables, respectively, for both the countries have increased significantly from 1963–2009, the above mentioned factors, however, have accelerated the cropping yield to a greater extent (~2–3 times) for China.
Another factor which effectively counters the agricultural land demand is cropping intensity, i.e., the ratio of the total harvested area to the agricultural land and permanent crops [49]. The net sown area of India has increased by nearly 20% since 1947 [50] and reached a point where it is not possible to make any appreciable increase. Cropping intensity physically refers to the raising of a number of harvests from the same area during one agriculture year. Thus, higher cropping intensity means that a higher proportion of the net area has been cropped more than once. This also implies higher productivity per unit agricultural land during one agricultural year.
Actually, in India there are two cropping seasons, the Kharif season (from June to October), tuned with southwest monsoon, and Rabi season (November-April) which usually requires irrigation. On the other hand, multiple cropping—a rotation of two or more crops per year in a unit cropland area—is also an important component of Chinese farming practices, particularly in southern China where intensive cropping (double- and/or triple-cropping) has been widely deployed [51,52]. Over the past several decades, multiple cropping has played a very important role in ensuring the food security of China [52]. Nevertheless, agricultural intensification has increased the pressure on water resources, ecosystems and biodiversity because of increased water withdrawals for irrigation, higher energy inputs for mechanization and increased use of chemical fertilizers [53].
The above measures stemming from the “Green Revolution”, and agricultural policies boosted the output by improving the yield rather than through increases in cultivated area. However, recent productivity growth has slowed down in both countries as the profits from the new technology and advanced farming practices in some sectors become outdated. Moreover, excessive use of chemical fertilizers degrades the quality of soils and shrinks groundwater supplies [54,55]. The problem is more acute in India, where the recent funding for agricultural research, irrigation, and other rural infrastructure projects depends more on public investment that would support agricultural sustainability in the long run [56]. We will make further comparisons of government policies and their impact on agriculture in Section 5.

4.3. Individual Impact of Yield, Population, Cropping Intensity and Diet on LRF

In the previous section, the cumulative impacts of population, cropping intensity, diet change and cropping yields on LRF are presented. Implementing a sensitivity analysis, based on [32], it is possible to analyze and quantify the impact of the individual drivers on total LRF, by keeping certain input factors as constant. Doing this, an assessment of increased yields, changing cropping intensity, population growth and the dietary changes on total LRF can be made and is shown in Figure 6e,f. To visualize the impacts, firstly, we introduce the time variation of cropping yield only, assuming constant population, cropping intensity and diet (daily per capita consumption) at 1963 levels. The LRF reduces by 46% (67%) from 140 (83) Mha in 1963 to 76 (27) Mha in 2009, for India (China) due to the impact of yield only. Therefore, the cropping yield has a positive impact on the net LRF of the country. Consequently, we add the contribution of cropping intensity (≥1) along with yield, keeping the other two factors constant. This further reduces the LRF to 49% (66%) from 140 (83) Mha in 1963 to 72 (28) Mha in 2009, for India (China). As mentioned before, the cropping intensity is the ratio of the total harvested area to the agricultural land and permanent crops [49]. The net sown area of India (China) increases only by 14% (6%) since 1963 (Figure 1) and reaches a point where it is not possible to make any appreciable increase. Furthermore, due to higher cropping intensity the productivity in per unit agricultural land has increased during one agricultural year. Thus, to some extent India and China needs to rely on the cropping intensity to enhance the production and decrease the LRF by increasing the effective area of cropping.
Next, we again introduce the actual population growth, still keeping constant 1963 diet, which eventually increases the LRF of India by 35% from 140 Mha in 1963 to 190 Mha in 2009 (a net increase by 84% (−49% to +35%)), whereas for China it still less than 1963 LRF by 39% (from 83 Mha to 50 Mha). Finally, the average change in diet is added to estimate the total national LRF in India and China, which accounts for an increase of 42% (40%, a net increase of 44% + 39% = 83%) from 140 (83) Mha in 1963 to 200 (120) Mha in 2009 for India (China).
From this experiment (Figure 6e,f), it becomes clear that for India, due to the implementation of high yield technology and irrigation, the net LRF is reduced substantially, by 50%, from 1963–2009, assuming constant population and diet. Taking population growth into account, it can be ensured that it drives the major increases in LRF, especially from 1993 onwards. Until 1992, only on a few occasions, the LRF with constant diet overshoots the actual LRF (net national LRF). This is due to the combined effect of rapid population growth and income induced dietary pattern changes towards more affluent food items, which eventually reduces the average intake of per capita cereal consumption per year (Figure 4a) from 65% in 1989 to 57% in 2009. However, for China, with the implementation of high yield technology and cropping intensity, the net LRF decreased by 75% keeping population and diet constant. Adding population, the LRF is still 45% less than the 1963 value. While adding the dietary change, the net LRF jumped by 40% (i.e., an increase of 44% + 39% = 83%). Therefore, we can conclude that for India population plays the major role whereas for China diet pattern change is the governing factor for the net LRF to rise.
In this context, it is worth mentioning that different natural disasters also have a significant impact on agriculture [55,57,58], especially on crop yields that eventually increase the land requirement of a country [59,60]. However, this analysis is beyond the scope of our present study.

5. India and China: Achievements, Challenges, Future Scenario and Role in Global Food Security

FAO 2010 report indicate that, out of 6.5 billion people in the world, more than 1 billion are still hungry and the situation is likely to be worsening by 2050. According to UN, by then, the global population is likely to increase by 40% (at a rate of 75 million/year) and will reach 9.2 billion, while the associated food production needs to expand by more than 70%, due to a rapidly growing middle-class demographic in developing countries, which eventually translates into larger demand for food. The largest population growth is projected to occur in Asia (particularly in China, India and Southeast Asia), which is expected to account for nearly 60% of the world’s population by 2050. The population growth is also projected to occur mostly in urban areas (around 60% by 2030), compared to the current levels of 50%. Moreover, along with population growth, the global food situation will be redefined by other driving forces like per capita income rise, limited land availability, water deficiency, high energy demand, inefficient food distribution systems and extreme weather events due to climate change. With faster economic growth, the populations will consume more affluent food items, which will increase per capita food consumption, as does the uptake in per capita global calorie consumption. Global meat consumption is expected to grow by 2%/year, particularly in developing countries which will consume more energy, cereal and water [61,62,63].

5.1. Government Policy and Food Security in India and China

While discussing the government policies toward agriculture in India and China, it is essential to compare the environment in which the policies have been implemented. Firstly, both India and China have experienced severe famines (1958–1962 in China) and droughts (1972, 1987, 2002 and 2009 in India) in recent decades; therefore, the goal of attaining self-sufficiency and security in major food grains is a national issue [17]. For the countries like India and China, in which rainfall is seasonal in nature, agriculture is often planned in accordance with the monsoon season. Therefore, any deficiency in rainfall, thus, has a direct impact on agriculture and the economy of the country. The problem is more acute for India, because Indian farmers rely mainly on monsoon rainfall, whereas, Chinese farmers are utilizing the irrigation potential much better than that of India. Secondly, abundance of poor farmers in rural areas with a large share of employment based on smallholder agriculture provides thrust to the policymakers. Thirdly, politically powerful farm sectors for India and the one party authoritarian system for China have deprived the poor farmers in rural areas economically [17]. Lastly, environmental degradation due to excessive farming may lead to land degradation and soil erosion [17,64].

5.1.1. China

Despite several similarities in policy environments, there are strong institutional and demographic differences, which have led India and China to adopt different development pathways for reforms, but the growth has been noteworthy, particularly in China. China opted for the bottom level approach i.e., primarily focusing on the agricultural sector and later moving to manufacturing and services with more private investments and rural non-farm growth and employment. In the early reform period, i.e., from 1978–1984, when the government adopted Household Responsibility System (HRS), the cereal yield increased from 2.8–5.4 tonnes/ha and agriculture developed at a phenomenal rate of 7%. This gave the individual farmers the right to control land and income from their agriculture. Labor-intensive technological change, i.e., the use of improved varieties of fertilizers and irrigation practices, is the primary force behind this development [61,64,65].
In the post-1978 period, the rural–urban income ratio dropped from 2.5 to 1.8, but since the mid-1980s, the emphasis of China’s economic reforms shifted to the urban areas and the ratio further rose to 2.9 times in 2001, 3.11 in 2002, 3.23 in 2003 and 3.33 in 2007. To counter that, in 1993, they abolished the grain rationing system which transformed the Chinese agriculture from a command and control system to a free market sector. In 1994, pressure of inflation and declining production promoted import, and several new policies needed to be implemented by the government e.g., Governor’s Grain bag responsibility system in 1997. In 2008, the government planned to adopt a second round of land reform policy for deepened rural reforms. The principal aims included land swapping among the farmers, to motivate rural excess labors to obtain other jobs in the cities with additional benefits like urban dwellers and, finally, encouraging loans and investment to further promote rural agriculture. Furthermore, China’s stimulus plan in 2008–2010 budgets, in the wake of the global financial crisis, focused heavily on the development of transport and infrastructure in the rural areas. The 11th five year plan (2006–2010) not only aimed at promoting agricultural development, food self-sufficiency, food security and raising farm income, but also included new goals like, increasing productivity in the agricultural sector, increasing farm incomes, improving services in rural areas, improving farm education, improving public and private investment in rural areas and deepening overall rural reform [66]. These reforms have further accelerated the rate of urbanization in the last several years [67,68].
Due to per capita income rise and rapid urbanization, since 1990s, China has experienced an overall structural change in its economy and social system. The GDP accounted for a drop in agriculture down to 15% in 2004 (from 35% in 1970). Based on changing food habits of the affluent and trade liberalization in the 2000s, the agricultural sectors not only have diversified production demand (with increased supply of maize and soybeans as feed), but a shift has been noticed from land intensive commodities to high value labor intensive commodities in the last one and a half decades [17,64].
Despite the fact that the government has taken credit for the success of the so-called rural reform under HRS scheme in the 1980s; several recoded government documents clearly reveal a contradictory picture. The government did not implement any new policies and even they tried very hard to retard the reform process. It was the farmers who tried various ways to link one’s effort to one’s reward. In fact, the government was forced by farmers to agree to let farmers do what they had already been doing. Xiaogang Village in Anhui Province is one example, which is considered to be the ‘cradle village’ of China’s early rural reforms. In 1978, 18 villagers risked their lives to sign a secret agreement, which divided communally owned farmland into individual pieces [65]. Secondly, despite the initial success of the rural reform, the shift in focus to the urban region is rather controversial. It not only increases the rural–urban income gap, but slows down the reform process too, and it is reflected in the Gini index trend.

5.1.2. India

In contrast, India employed a top down reform process, which started with macroeconomic policies focusing on the services sector and then the manufacturing sector. As a result, the service and manufacturing sectors are doing much better than the agricultural sectors. Despite this fact, in the last decade and half, the government implemented several policies, schemes and missions with the intent of achieving three overarching goals; stability of supplies, stability of prices and income stability of farmers’ incomes [17]. Until the 1970s, India experienced low economic growth, partially due to fluctuations in agriculture affected by seasonal monsoon along with political instability soon after independence (1947), weaker economic policy and rural poverty (>90%). Partial liberalization policy in the 1980s and full scale economic liberalization in 1991 not only elevated agricultural growth but accelerated the Indian economy and GDP to a greater extent. The first wave of green revolution in the late 1960s allowed India to attain self-sufficiency by the end of the 1970s. However, the technological innovations and high yielding seeds are confined to the wheat crop (Mexican semi-dwarf wheat varieties) and in the northwest part and deltaic region of peninsular India. The most important factor underlying the implementation of new technologies was the diffusion of private tube-wells [69]. Despite the green revolution, India imports large quantities of food, chemical fertilizers and agricultural machinery. Therefore, the first wave practically failed to raise the income across the country, in a broader sense.
In the second phase of green revolution in the 1980s, wider technological disseminations involved rice, coarse cereals, jowar and bajra, which elevated the rural income across the country and thereby fostered India’s economic development [69]. Implementation of the improved varieties of fertilizers, pesticides and irrigation facilities further facilitated the yield of the crops [68]. The rapid increase in rice production was fundamental to the economic development in the rural areas. The key factor for rapid agricultural growth was the widespread implementation of private tube-wells, particularly small-scale shallow tube-wells which are cheaper than deep tube-wells. The widespread implementation of tube-wells in rain-fed areas enabled farmers to grow high yielding wheat instead of rabi crops, such as pulses, in the dry season (rabi season) and to improve the rice yield substantially by switching from traditional to modern varieties in the monsoon season (kharif season). Thus, a highly productive double cropping system of high yielding varieties of rice and wheat was established over broad rural areas, especially in the Indo-Gangetic Basin. Furthermore, in some places with plentiful rainfall, such as West Bengal, double cropping of high yield rice became predominant [62]. However, the implementation of green revolution technologies is not uniform in India. The diffusion of new seed-fertilizer technology and shallow tube wells was delayed in eastern and northeastern states in comparison with other parts of the country. The key reasons are shortage of capital to purchase tube wells, dominance of poor farmers with fragmented land parcels, lack of rural electrification and wealthy land lordship, which imposes severe hurdles on the eastern Indian farmers (NSSO report).
Like China, in India the agricultural economy too experienced structural changes in early 2000 and the agriculture and associated sectors contributed only 22% of total GDP in 2003 (drop from 43% in 1970). Despite overexploitation of the benefits of green revolution technologies, it is questionable why India’s average crop yield is relatively low in comparison with other countries. Secondly, regional variations in productivity of crops further indicate the lack of implementation of the policies. Thirdly, wider subsidies of the resources not only hampered the expenditure on rural infrastructure, it slowed down the public investment in agricultural growth. Fourthly, the partial failures of the schemes and the projects were also attributable to the loss due to illegal money laundering and corruption practices in the social and government administration system. Finally, India lacks any well-defined institutional changes in land reform policies and it is successful only in a limited number of provinces. The percentage of landless population is much higher in India [61,64,70].

5.2. Why the Role of India and China is Important for Future Global Food Security

Among the developing countries, because of their faster rate of urbanization, economic and population growth, India and China can play a pivotal role in global food security. As we know, both the countries constitute 37% of the global population (World Bank 2011 report) and rank among the top 10 largest economies in the world since the 1990s. From the food production point of view, both are the leading producers of cereals and, in 2011, Chinese agricultural imports and exports accounted for 11% and 5%, respectively, compared to just 2% and 3% for India [71]. However, over time, higher per capita income and diet diversification have widened the range of imported products in China. In contrast, India has had relatively little involvement in global agricultural trade and ranks 14th and 16th in global agricultural export and import, respectively [71]. Therefore, both the countries have significant potential to contribute to food security globally, particularly to the Asia Pacific region, not only by reducing its own hunger index, but also by increasing international trade and technology exchanges with other developing nations.
China: China’s economic development, globalization, trade liberalization policy and the attempt to fulfill the WTO and FTA agreements provide enormous opportunities for multilateral trade, which have the potential to ensure food security for Asia and greater Pacific regions, particularly the developing nations. China is well integrated with the rest of the world in matters of international trade and is projected to be the world’s second largest importer and exporter by 2020. China mainly exports animal products and ranks second globally in the import of agricultural products [72]. Despite this, China is projected to be self-sufficient in cereal grains; in the future, it will shift its status from net exporter to net importer, which will provide opportunities for many countries to adjust their food production to satisfy the wider Chinese markets. They will also export food and feed to many other developing South and South-East Asian countries, valued at around USD $10 billion in 2020, contributing to food security in the region [17,64,73,74].
India: In stark contrast to China, despite being one of the top three global producers of rice, wheat, sorghum and sugarcane, it ranks low in the global agricultural trade. India mainly imports the products for which the domestic product is unable to meet the domestic demand. India mainly exports vegetable oils, which are more like staple food products in India. Like China, India is also projected to be self-sufficient in staple food grains and will likely continue its role as a major net exporter of rice followed by wheat and sugar. India mainly exports to the African nations, and other developing Asian countries. Mutual food trade between India and China will also facilitate supporting the future food demand. The China report suggests a projected increase in exports to India by 1179%, while Indian exports are predicted to increase only by 79% in 2020. The potential relaxation and openness in government trade policies will encourage India to play a more pivotal role in combatting regional food scarcity in the Asia Pacific region.

5.3. Future Prospects of Growth and Challenges in Domestic Land Reform Policies

From 2006–2010, the average annual growth in China’s GDP was 8%, which has gradually slowed down in the present decade to 6%–7%. The growth is mainly due to strong macroeconomic stability, strong inflow of FDI and trade liberalization policy. While for India, the GDP has been rising gradually from 6%–7% to 7%–8% in the recent decade. This can be explained in two ways; firstly, in India the incremental capital output ratio (ICOR) is less than four and is expected to decline further, whereas, in China it has risen steadily from 4 in the 1980s to 5.4 in recent times. This indicates better utilization of capital by the Indian industrial sector in comparison with its Chinese counterpart. Secondly, the demographic factor also favors India’s development. Percentage of the ageing population and sharp decline in young population growth due to one child policy will slow down economic growth.
In the agricultural sector, both for India and China, the arable land due to crop production is shrinking rapidly, due to urbanization and environmental degradation. In matters of technological growth, China already has attained high yields in staple crops, and the partial failures in policy implementation limits India’s growth in the later part of the green revolution. Therefore, both for India and China, the growth in cropping yields has plateaued with little scope for development in the future.
Apart from the future challenges to alleviate poverty, hunger reduction and disparity in income, the shrinking of arable land is a matter of deep concern, both for India and China. This is one of the hurdles that must be overcome in order to achieve the far-reaching goal of food security as well as food self-sufficiency with appropriate land reform policies [63,64,67,74].

5.3.1. Shortage of Arable Land and Reform Policies

In our analysis, we have shown a gradual increasing trend in LRF, both for India and China. If we extrapolate the trend, it obviously projects more arable land requirements for future food production. Therefore, these statistics may provide a background to estimate future agricultural land demand (based on temporal trend of different drivers) for implementing future land reform policies. It is expected that the percentage of total arable land will shrink in the next two decades due to urbanization and land degradation. However, for the future reform process, it is also essential and challenging to frame new land reform policies, without negotiating the issues of food security.
In China, in the next three decades, urbanization is projected to rise from 47%–75%, which requires additional land for residential infrastructure and industrialization. To maintain self-sufficiency, farmers are facing increasing challenges from shrinking land areas and ground water depletion for farming. Between 1996 and 2008, the cultivable land and grassland decreased by 6.4% and 0.59%, respectively, which is mainly due to urbanization and industrialization. In 2008, the government planned to adopt a second round of land reform policy for further rural reforms. However, this new policy constitutes a profound redistribution of wealth and power which inevitably has severe implications. The negative consequences which have arisen are (a) fast disappearance of arable land in the country; (b) monopoly of land resources in the hands of a small number of landlords, which widens disparity; and (c) rapid rise of urban unemployment.
The present government in India attempts to simplify the ability of the government and private companies to obtain land for building modern cities and industrial corridors across India. According to amendments to the land act, it claims to be beneficial for farmers, but the exemption of getting consent of 80% of landowners for some projects leads to the possibility of exploitation and monopoly. Therefore, the land acquisition act is strongly opposed by a section of farmers and opposition parties. However, it is also essential to adopt an institutional change in the land act for future economic reform processes, which is indeed a challenging task for the government [70,75,76,77].

5.3.2. Environmental Degradation and Extreme Weather Events

Despite the fact that Indian agriculture is boosted by green revolution, excessive technology dissemination has an adverse impact on environmental externalities, leading to agricultural pollution, land degradation, depletion of ground water levels, etc. Based on a National Remote Sensing Centre report, nearly 15% of India’s total geographic areas are degraded cultivable wasteland and this has had a significant negative relationship with foodgrain productivity in the 1980s and 1990s [78]. Ground water depletion is one of the primary constraints for Indian agriculture in recent decades. It is the major source for irrigation and is being rapidly depleted.
Similarly, China also faces these challenges but the problem is more acute in India, where lack of public funding and infrastructure projects are the major constraints to support agricultural sustainability [17]. In China, besides declining in quantity, the quality of the survived land is also under huge threat. Urbanization enhances the degree of soil pollution, due to improper deposition of domestic and industrial waste, acid deposition and urban air pollution. About 2.5% of arable land is already becoming too polluted for agriculture. Contamination of cropland with Cadmium and lead from industrial wastes is a matter of great concern for public health.
Apart from ground water depletion, widespread occurrences of drought and disappearances of the lakes due to urbanization are also potential threats. In the last 40 years, China has lost 13% of its wetlands. Water quality of Sanggou Bay, which is one of the most important mariculture regions in China, is facing severe deterioration due to overfishing and water pollution. In the last decade and a half, India has experienced several severe and moderate droughts and flood events, which hamper food security programs to a great extent [64,74].

5.4. Approach Towards Sustainable Agriculture

Despite fulfilling the objective of increasing food production consistently, additional policies need to be implemented to foster sustainable agriculture, ensuring sustainable use of land and water resources. This includes utilizing irrigation potential, stimulating groundwater regeneration, paying more attention to the eastern states and monitoring soil degradation [79]. Firstly, the investment made by central and state governments in the irrigation projects created a gap between irrigation potential created and utilized, due to wastage of water. In the 12th five-year plan, the government allocated additional funds for water management and construction of canal systems and field channels [80]. Secondly, the central government had undertaken a massive program for groundwater regeneration through watershed development programs, construction of dams for stabilizing ground water level and rainwater storage. Thirdly, the farmers in the eastern Indian states rely predominantly on diesel pumps rather than on electric pump. The diesel pump not only increases the cost pressure, it is not eco-friendly. The first step needed is to improve the rural electrification in the eastern states and motivate the farmers to adopt sustainable agricultural techniques. In the longer term, the shift in the centre of gravity of agriculture from the western states to the northeastern Gangetic plains may lead to increased and more sustainable production. Lastly, in the 12th five-year plan, a program needs to be initiated to restrict excessive use of toxic nitrogenous and phosphatic fertilizers and pesticides and promote the use of bio-fertilizers, organic manure, and bio-compost and soil organic carbon [80].
Over the past three decades, the area of land under irrigation in China has increased fivefold, mostly between the 1980s and 1990s [79] and externalities of pesticides used in rice systems cost USD $1.4 billion per year through human health impacts and adverse effects on both on and off farm biodiversity [81]. In March 1994, the Chinese government set out its plan for the implementation of Agenda 21, and put forward ecological farming or agro ecological engineering, as the approach to achieve sustainability in agriculture. Pilot projects were established in 2000 in townships and villages spread across 150 counties. Policy for these “eco-counties” is organized through a cross-ministry partnership, which uses a variety of incentives to encourage adoption of diverse production systems to replace monocultures. These include subsidies and loans, technical assistance, tax exemptions and deductions, security of land tenure, marketing services and linkages to research organizations. These eco-counties contain some 12 million hectares of land, about half of which is cropland, and though only covering a relatively small part of China’s total agricultural land, illustrating what is possible when policy is appropriately coordinated [82]. Therefore, to address the problems, both in India and China, future policies have laid emphasis on promoting sustainable agriculture and organic farming. A schematic diagram is shown in Figure 8, to compare the socioeconomic factors and drivers affecting the agricultural land demand in India and China.
Figure 8. Schematic diagram to compare the socioeconomic factors and drivers affecting the agricultural land demand in India and China.
Sustainability 07 05371 g008

6. Conclusions and Discussions

Rapid population growth, economic development, and urbanization have significant impacts on Chinese and Indian societies, thereby increasing food consumption and imposing excessive pressure on agricultural land demand. The daily per capita consumption of affluent food items increased particularly from 1980 in China, which perhaps is related to income induced dietary pattern changes, globalization and transformation of food consumption patterns of Indian and Chinese households, especially in the urban areas. Land constraints, low labor productivity, natural catastrophe, and slowing crop yield pose significant barriers for both countries to overcome, even with significant investments in the agricultural sector. It is highly challenging for both the countries to tackle the problems even with effective land reform policies, without negotiating the issues of food security. We applied Land Requirement for Food (LRF) method to estimate the historical changes in agricultural land demand for food in both countries from 1963–2009. Using a sensitivity analysis we also quantified the relative role of population growth, technology and diet pattern changes in the net LRF of India and China.
The statistical analysis shows that the total LRF increased by 42% and 40%, for India and China, respectively, which is much higher than the 14% and 6% increase in net agricultural land since 1963, and the gap between food demand and domestic production has increased. Given the limitation of land resources, this gap can only be filled either by increasing the productivity or by import. Despite over exploitation of green revolution technology in India, it is rather questionable why it has still performed much lower than several other developing countries like China and Brazil. India lacks institutional changes in the agricultural sector such as reducing subsidies and fruitful investment in research and development. However, these changes may need to be implemented at a slower pace, without negotiating the far-reaching goal of food security and poverty alleviation. Therefore, in the present scenario, it is not an optimistic approach to participate in the World Trade Facilitation Agreement, compromising its existing food security programs. On the other hand, the new land reform policy in China too has the negative consequences of rapid disappearance of arable land, urbanization and urban unemployment.
However, unprecedented usage of high yield technology, fertilizers, etc. needs to be controlled to avoid environmental degradation. Recently, degradation in productivity, results from overuse of chemical inputs, deteriorating soil quality and shrink ground water level is an alarming threat [17]. Therefore, both countries need to negotiate the usage of modern technology, without affecting natural resources to a greater extent. The governments have implemented several policies, not only to achieve the goal of food security, food self-sufficiency and income support to farmers, but also to promote sustainable agriculture and organic farming. On the other hand, if these two countries cannot maintain their current self-sufficiency levels, there could be great global market repercussions.
Analyzing the role of individual drivers, we have found that population growth is responsible for most of the increase in total LRF for India, whereas the income induced diet pattern changes drive the major increase in the LRF for China. Therefore, we can conclude our discussions with possible projections for the future LRF in India and China. As projected by FAO, India’s population will equal China’s in 2025 (about 1.4 billion) and will exceed China’s thereafter, and it will continue to increase until at least 2050. It is essential for the government to implement some population control policies in India, like China, to curtail food demand in the future. On the other hand, China’s population will peak at about 1.5 billion in 2032, declining thereafter. The forecasted average annual GDP growth rates, both for India and China in 2020–2025 are approximately the same (China: 5.7%, India: 5.6%). Therefore, in the present scenario, with expected population and economic growth, it remains to be proven how the governments of both countries will adopt workable policies and how they will face the challenges of food security in the coming times.

Acknowledgments

This work was supported by National Science Foundation of China (grant No. 41271542); the Fundamental Research Funds for the Central Universities and the Scientific Research Foundation for the Returned Overseas Chinese Scholars, State Education Ministry. The present work is also supported by the financial support from CAS-TWAS president’s fellowship, 2013.

Author Contributions

Reshmita Nath analyzed, interpreted, and wrote the manuscript. Yibo Luan and Wangming Yang helped with analysis and providing suggestions. Yang Chen provided suggestions. Wen Chen and Li Qian provided valuable suggestions and support. Xuefeng Cui provided suggestions and feedback on the conceptualization of sustainability, on the interpretation of the data, and on the required context-setting.

Supplementary Materials

Supplementary materials can be accessed at: https://www.mdpi.com/2071-1050/7/5/5371/s1.

Conflicts of Interest

The authors declare no conflict of interest.

References

  1. Population Reference Bureau. World Population Data Sheet; PRB: Washington, DC, USA, 2012. [Google Scholar]
  2. Ministry of Home Affairs. Census of India. In Rural Urban Distribution of Population Report; Ministry of Home Affairs: New Delhi, India, 2011. [Google Scholar]
  3. National Bureau of Statistics (NBS). Statistical Communique of the People’s Republic of China on the 2013 National Economic and Social Development; NBS: Beijing, China, 2014. [Google Scholar]
  4. Chaoui, L.M.; Leman, E.; Rufei, Z. Urban Trends and Policy in China. In OECD Regional Development Working Report; OECD: Paris, France, 2009. [Google Scholar]
  5. Guo, X.; Mroz, T.A.; Popkin, B.M.; Zhai, F. Structural change in the impact of income on food consumption in China, 1989–1993. Econ. Dev. Cult. Change 2000, 48, 737–760. [Google Scholar] [CrossRef]
  6. Popkin, B.M.; Paeratakul, S.; Zhai, F.; Ge, K. Dietary and environmental correlates of obesity in a population study in China. Obes. Res. 1995, 3, 135s–143s. [Google Scholar] [CrossRef] [PubMed]
  7. Van Ginkel, H. Urban Future. Nature 2008, 456, 32–33. [Google Scholar] [CrossRef] [PubMed]
  8. Delgado, C. Rising consumption of meat and milk in developing countries has created a new food revolution. J. Nutr. 2003, 133, 3907S–3910S. [Google Scholar] [PubMed]
  9. Jones, E.; Akbay, C.; Roe, B.; Chern, W.S. Analyses of consumers’ dietary behavior: An application of the AIDS model to supermarket scanner data. Agribusiness 2003, 19, 203–221. [Google Scholar] [CrossRef]
  10. Ishida, A.; Law, S.; Aita, Y. Changes in food consumption expenditure in Malaysia. Agribusiness 2003, 19, 61–76. [Google Scholar] [CrossRef]
  11. Liu, H.; Parton, K.; Zhou, Z.; Cox, R. At-home meat consumption in China: An empirical study. Austr. J. Agricult. Resour. Econ. 2009, 53, 485–501. [Google Scholar] [CrossRef]
  12. Gandhi, V.; Zhou, Z. Rising demand for livestock products in India: Nature, patterns and implications. Austr. Agribus. Rev. 2010, 18, 103–135. [Google Scholar]
  13. Ghosh, J. Poverty Reduction in China and India: Policy Implication of Recent Trends. Available online: http://www.un.org/esa/desa/papers/2010/wp92_2010.pdf (accessed on 28 April 2015).
  14. Rozelle, S.; Park, A.; Huang, J.K.; Jin, H. Liberalization and rural market integration in China. Am. J. Agric. Econ. 1997, 79, 635–642. [Google Scholar] [CrossRef]
  15. Zhou, Z.; Tian, W.M.; Liu, X.A.; Wan, G.H. Studying China’s Feed Grain Demand and Supply: Research Methodological Issues; Grains Research and Development Corporation: Canberra Australia, 2003. [Google Scholar]
  16. Huang, J.; Rozelle, S. China’s Agriculture: Drivers of Changes and Implications to China and the Rest of World. In Proceedings of the 27th International Association of Agricultural Economics Conference, Beijing, China, 16–22 August 2009.
  17. Baldwin, K.; Bonarriva, J. Feeding the Dragon and the Elephant How agricultural policies and trading regimes influence consumption in China and India. J. Int. Commer. Econ. 2013, 5, 1–16. [Google Scholar]
  18. Lin, J.Y. Rural reforms and agricultural growth in China. Am. Econ. Rev. 1992, 82, 34–51. [Google Scholar]
  19. Fan, S.; Kang, C.C. Road Development, Economic Growth and Poverty Reduction in China; Research Report 138; International Food Policy Research Institute: Washington DC, USA, 2005. [Google Scholar]
  20. FAOSTAT Database. India Country Profile. Available online: http://faostat.fao.org (accessed on 1 August 2012).
  21. FAOSTAT Database. China Country Profile. Available online: http://faostat.fao.org (accessed on 1 August 2012).
  22. FAOSTAT. Value of Agricultural Production; FAO: Rome, Italy, 2012. [Google Scholar]
  23. Quan, H. Income Inequality in China and India: Structural Comparisons; Asian Scholarship Foundation: Bangkok, Thailand, 2006. [Google Scholar]
  24. Zhang, X.; Mount, T.; Boisvert, R. Industrialization, Urbanization, and Land Use in China; International Food Policy Research Institute: Washington, DC, USA, 2000. [Google Scholar]
  25. Zhen, L.; Cao, S.; Cheng, S.; Xie, G.; Wei, Y.; Liu, X.; Li, F. Arable land requirements based on food consumption patterns: Case study in rural Guyuan District, Western China. Ecol. Econ. 2010, 69, 1443–1453. [Google Scholar] [CrossRef]
  26. Cai, Y.L.; Fu, Z.Q.; Dai, E.F. The minimum area for per capita of arable land and its implication for the optimization of land resource allocation. Acta Geogr. Sin. 2002, 57, 127–134. (In Chinese) [Google Scholar]
  27. Yang, W.; Yibo, L.; Chen, Y.; Xuefeng, C. Changes in the Land Requirements for Food from 1961 to 2007 in China. Resour. Sci. 2013, 35, 2. [Google Scholar]
  28. Yitzhaki, S. Relative Deprivation and the Gini Coefficient. Q. J. Econ. 1979, 93, 321–324. [Google Scholar] [CrossRef]
  29. Sadras, V.; Bongiovanni, R. Use of Lorenz curves and Gini coefficients to assess yield inequality within paddocks. Field Crops Res. 2004, 90, 303–310. [Google Scholar] [CrossRef]
  30. Mahal, A.; Karan, A.K. Adequacy of dietary intakes and poverty in India: Trends in the 1990s. Econ. Hum. Biol. 2008, 6, 57–74. [Google Scholar] [CrossRef] [PubMed]
  31. Svedberg, P. Child Malnutrition in India and China. 2020 Focus Brief on the World’s Poor and Hungry People; IFPRI: Washington, DC, USA, 2007. [Google Scholar]
  32. Kastner, T.; Nonhebel, S. Changes in land requirements for food in the Philippines: A historical analysis. Land Use Policy 2010, 27, 853–863. [Google Scholar] [CrossRef]
  33. FAO Food Balance Sheet-A HandBook. Available online: ftp://ftp.fao.org/docrep/fao/011/x9892e/x9892e00.pdf (accessed on 28 April 2015).
  34. Pradhan, P.; Ludeke, M.K.B.; Reusser, D.E.; Kropp, J.P. Embodied crop calories in animal products. Environ. Res. Lett. 2013. [Google Scholar] [CrossRef]
  35. Caballero, B.; Popkin, B.M. (Eds.) The Nutrition Transition Diet and Disease in the Developing World; Academic Press: London, UK, 2002.
  36. Albala, C.; Vio, F.; Kain, J.; Uauy, R. Nutrition transition in Chile determinants and consequences. Public Health Nutr. 2002, 5, 123–128. [Google Scholar] [CrossRef] [PubMed]
  37. Nath, R.; Cui, X.; Luan, Y.; Yang, W.; Li, Q.; Chen, W. Historical changes in land requirements for food in India. Indian J. Appl. Res. 2014, 4, 11–12. [Google Scholar]
  38. Barone, B.; Bin, P.; Brasili, C. Regional Disparity of Vulnerability to Food Insecurity in China. In Proceedings of the 3rd AIEAA Conference―Feeding the Planet and Greening Agriculture: Challenges and Opportunities for the Bio-Economy, Alghero, Italy, 25–27 June 2014.
  39. Mittal, S. What affect changes in cereal consumption? Econ. Polit. Wkly. 2007, 42, 444–447. [Google Scholar]
  40. Hubacek, K.; Guan, D.; Basu, A. Changing lifestyles and consumption patterns in developing countries: A scenario analysis for China and India. Futures 2007, 39, 1084–1096. [Google Scholar] [CrossRef]
  41. Zhou, Z.; Tian, W.; Wang, J.; Liu, H.; Cao, L. Food consumption Trends in China. Available online: http://www.agriculture.gov.au/SiteCollectionDocuments/agriculture-food/food/publications/food-consumption-trends-in-china/food-consumption-trends-in-china-v2.pdf (accessed on 28 April 2015).
  42. World Bank. “World Development Indicators” Database. Available online: http://data.worldbank.org/data-catalog/world-development-indicators (accessed on 28 April 2015).
  43. Faostat Food and Agriculture Organization of the United Nations. FAO Statistical Yearbook 2012; FAO: Rome, Italy, 2012. [Google Scholar]
  44. Liu, J.; Savenije, H.H.G. Food consumption patterns and their effect on water requirement in China. Hydrol. Earth Syst. Sci. 2008, 12, 887–898. [Google Scholar] [CrossRef]
  45. Fu, W.; Gandhi, V.P.; Cao, L.; Liu, H.; Zhou, Z. Rising consumption of animal products in china and india. National and global implications. China World Econ. 2012, 20, 88–106. [Google Scholar] [CrossRef]
  46. Mittal, S. Structural Shift in Demand for Food: India’s Prospects in 2020; Working Paper 184; Indian Council for Research on International Economic Relations (ICRIER): New Delhi, India, 2006; pp. 1–35. [Google Scholar]
  47. FAOSTAT Database. Food Balance Sheets; FAO: Rome, Italy, 2012. [Google Scholar]
  48. USDA FAS. PSD Database. Available online: https://apps.fas.usda.gov/psdonline/ (accessed on 29 April 2015).
  49. Siebert, S.; Portmann, F. T.; Doll, P. Global Patterns of Cropland Use Intensity. Remote Sens. 2010, 2, 1625–1643. [Google Scholar] [CrossRef]
  50. Department of Agriculture and Cooperation. India Report; Ministry of Agriculture: New Delhi, India, 2015. [Google Scholar]
  51. Frolking, S.; Qiu, J.; Boles, S.; Xiao, X.; Liu, J.; Zhuang, Y.; Li, C.; Qin, X. Combining remote sensing and ground census data to develop new maps of the distribution of rice agriculture in China. Glob. Biogeochem. Cycles 2002. [Google Scholar] [CrossRef]
  52. Qiu, J.J.; Tang, H.J.; Frolking, S.; Boles, S.; Li, C.; Xiao, X.; Liu, J.Y.; Zhuang, Y.H.; Qin, X.G. Mapping Single–Double- and triple-crop agriculture in China 0.5° × 0.5° by combining country scale census data with a remote sensing derived land cover map. Geocarto Int. 2003, 18, 3–13. [Google Scholar]
  53. Huimin, Y.; Xiangming, X.; Heqing, H.; Jiyuan, L.; Chen, J.; Xuedong, B. Multiple cropping intensity in China derived from agro meteorological observations and MODIS data. Chin. Geogr. Sci. 2014, 24, 1–14. [Google Scholar] [CrossRef]
  54. United States International Trade Commission. China’s Agricultural Trade. http://www.usitc.gov/publications/332/pub4219.pdf (accessed on 29 April 2015).
  55. Gbetibouo, G.A.; Hassan, R.M. Measuring the economic impact of climate change on major South African field crops: A Ricardian approach. Glob. Planet. Change 2005, 47, 143–152. [Google Scholar] [CrossRef]
  56. United States International Trade Commission. India: Effects of Tariffs and Nontariff Measures on U.S. Agricultural Exports. Available online: http://www.usitc.gov/publications/industry_econ_analysis_332/2009/india_effects_tariffs_and_nontariff_measures_us.htm (accessed on 29 April 2015).
  57. Benhin, J.K.A. South African crop farming and climate change: An economic assessment of impacts. Glob. Environ. Change-Hum. Policy Dimens. 2008, 18, 666–678. [Google Scholar] [CrossRef]
  58. Mooley, D.A.; Parthasarathy, B. Large scale drought over India and their impact on agricultural production. Mausam 1984, 35. Article 265. [Google Scholar]
  59. Walker, N.J.; Schulze, R.E. Climate change impacts on agro-ecosystem sustainability across three climate regions in the maize belt of South Africa. Agric. Ecosyst. Environ. 2008, 124, 114–124. [Google Scholar] [CrossRef]
  60. Blignaut, J.; Ueckermann, L.; Aronson, J. Agriculture production's sensitivity to changes in climate in South Africa. S. Afr. J. Sci. 2009, 105, 61–68. [Google Scholar] [CrossRef]
  61. Fan, S.; Brzeska, J. The role of emerging countries in global food security. IFPRI Policy Brief 2010, 15, 1–4. [Google Scholar]
  62. Food Scarcity-Trends, Challenges, Solutions. In Sustainability Team Discussion Paper; Candriam: New York, NY, USA, 2010.
  63. FAO. World Agriculture towards 2015/2030. In Summary Report; FAO: Rome, Italy, 2002. [Google Scholar]
  64. Rapid growth of selected Asian economies. In Synthesis Report, Policy Assistance Series 1/1; FAO Regional office for Asia and Pacific: Bangkok, Thailand, 2006.
  65. Li, C. Hu Jintao’s land Reform: Ambition, Ambiguity, and Anxiety. China Leadership Monitor 2008, 27, 1–22. [Google Scholar]
  66. Hansen, J.; Tuan, F.; Somwaru, A.; Seelay, R. Impact of China’s Agricultural Policies on Domestic and World Commodity Markets. In Proceedings of the International Association of Agricultural Economics Conference, Beijing, China, 16–22 August 2009.
  67. Global Water Partnership. Water and food security-Experiences in India and China. Available online: http://www.gwp.org/Global/ToolBox/Publications/Technical%20Focus%20Papers/03%20Water%20and%20Food%20Security%20-%20Experiences%20in%20India%20and%20China%20%282013%29.pdf (accessed on 29 April 2015).
  68. Kumar, P.; Mittal, S. Agricultural Productivity Trends in India: Sustainability Issues. Agric. Econ. Res. Rev. 2006, 19, 71–88. [Google Scholar]
  69. Fujita, K. The green revolution and its significance for economic development. In JICA-RI. Working Paper; JICA Research Institute: Tokyo, Japan, 2010. [Google Scholar]
  70. Upadhyay, R.P.; Palanivel, C. Challenges in achieving food security in India. Iran. J. Public Health 2011, 40, 31–36. [Google Scholar] [PubMed]
  71. Global Trade Information Services (GTIS). Global Trade Atlas Database. Available online: http://www.gtis.com/english/GTIS_GTA.html (accessed on 29 April 2015).
  72. Narayanan, B.; Walmsley, T. Global Trade, Assistance, and Production: The GTAP 7 Data Base; Center for Global Trade Analysis & Purdue University: West Lafayette, IN, USA, 2008. [Google Scholar]
  73. Food Security: Challenges and Solutions. In The Proceedings of the Global Food Security Forum, Shanghai, China, 6 November 2012; Available online: http://www.nottingham.ac.uk/globalfoodsecurity/documents/gfsforumreport2012.pdf (accessed on 29 April 2015).
  74. Ghose, B. Food security and Food Self-sufficiency in China: From past to 2050. Food Energy Secur. 2014, 3, 86–95. [Google Scholar] [CrossRef]
  75. Jie, C. Rapid urbanization in China: A real challenge to soil protection and food security. CATENA 2007, 69, 1–15. [Google Scholar] [CrossRef]
  76. Ghose, B.; Sajeeb, S.; Kpoghomou, M.A.; Gao, H.; Jun, L.; Yin, D.; Ghosh, S. Self-sufficiency in rice and food security: A South Asian perspective. Agric. Food Secur. 2013, 3, 2–10. [Google Scholar]
  77. Zhiyuan, L.; Zongwei, M.; Kujip, T.J.V.D.; Yuan, Z.; Huang, L. A review of soil heavy metal pollution from mines in China: Pollution and health risk assessment. Sci. Total Environ. 2014, 468–469, 843–853. [Google Scholar]
  78. Chadha, G.K.; Sen, S.; Sharma, H.R. State of the Indian Farmer: A Millennium Study; Ministry of Agriculture, Government of India: New Delhi, India, 2004.
  79. Pretty, J. Social capital and the collective management of resources. Science 2003, 302, 1912–1915. [Google Scholar] [CrossRef] [PubMed]
  80. Hoda, A.; Gulati, A. India’s Agricultural Trade Policy and Sustainable Development Goals. Available online: http://www.ictsd.org/downloads/2013/09/indias-agricultural-trade-policy-and-sustainable-development-goals.pdf (accessed on 29 April 2015).
  81. DFID. The Impact of Climate Change on Pro-Poor Growth; DFID: London, UK, 2004. [Google Scholar]
  82. Li, W. Agro-Ecological Farming Systems in China. In Man and the Biosphere Series; UNESCO: Paris, France, 2001; Volume 26. [Google Scholar]

