
The Role of Vegetation in Mitigating Urban Land Surface Temperatures: A Case Study of Munich, Germany during the Warm Season

 , and
, and 
Abstract
:
1. Introduction
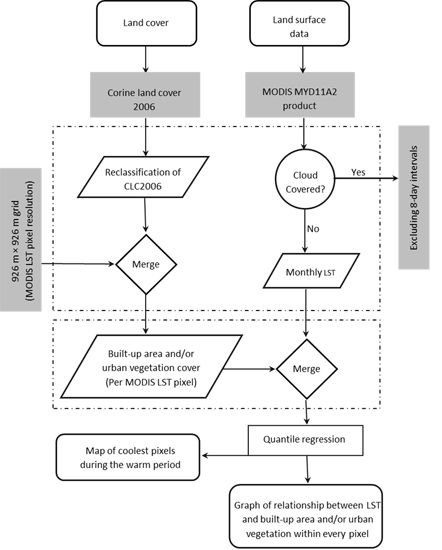
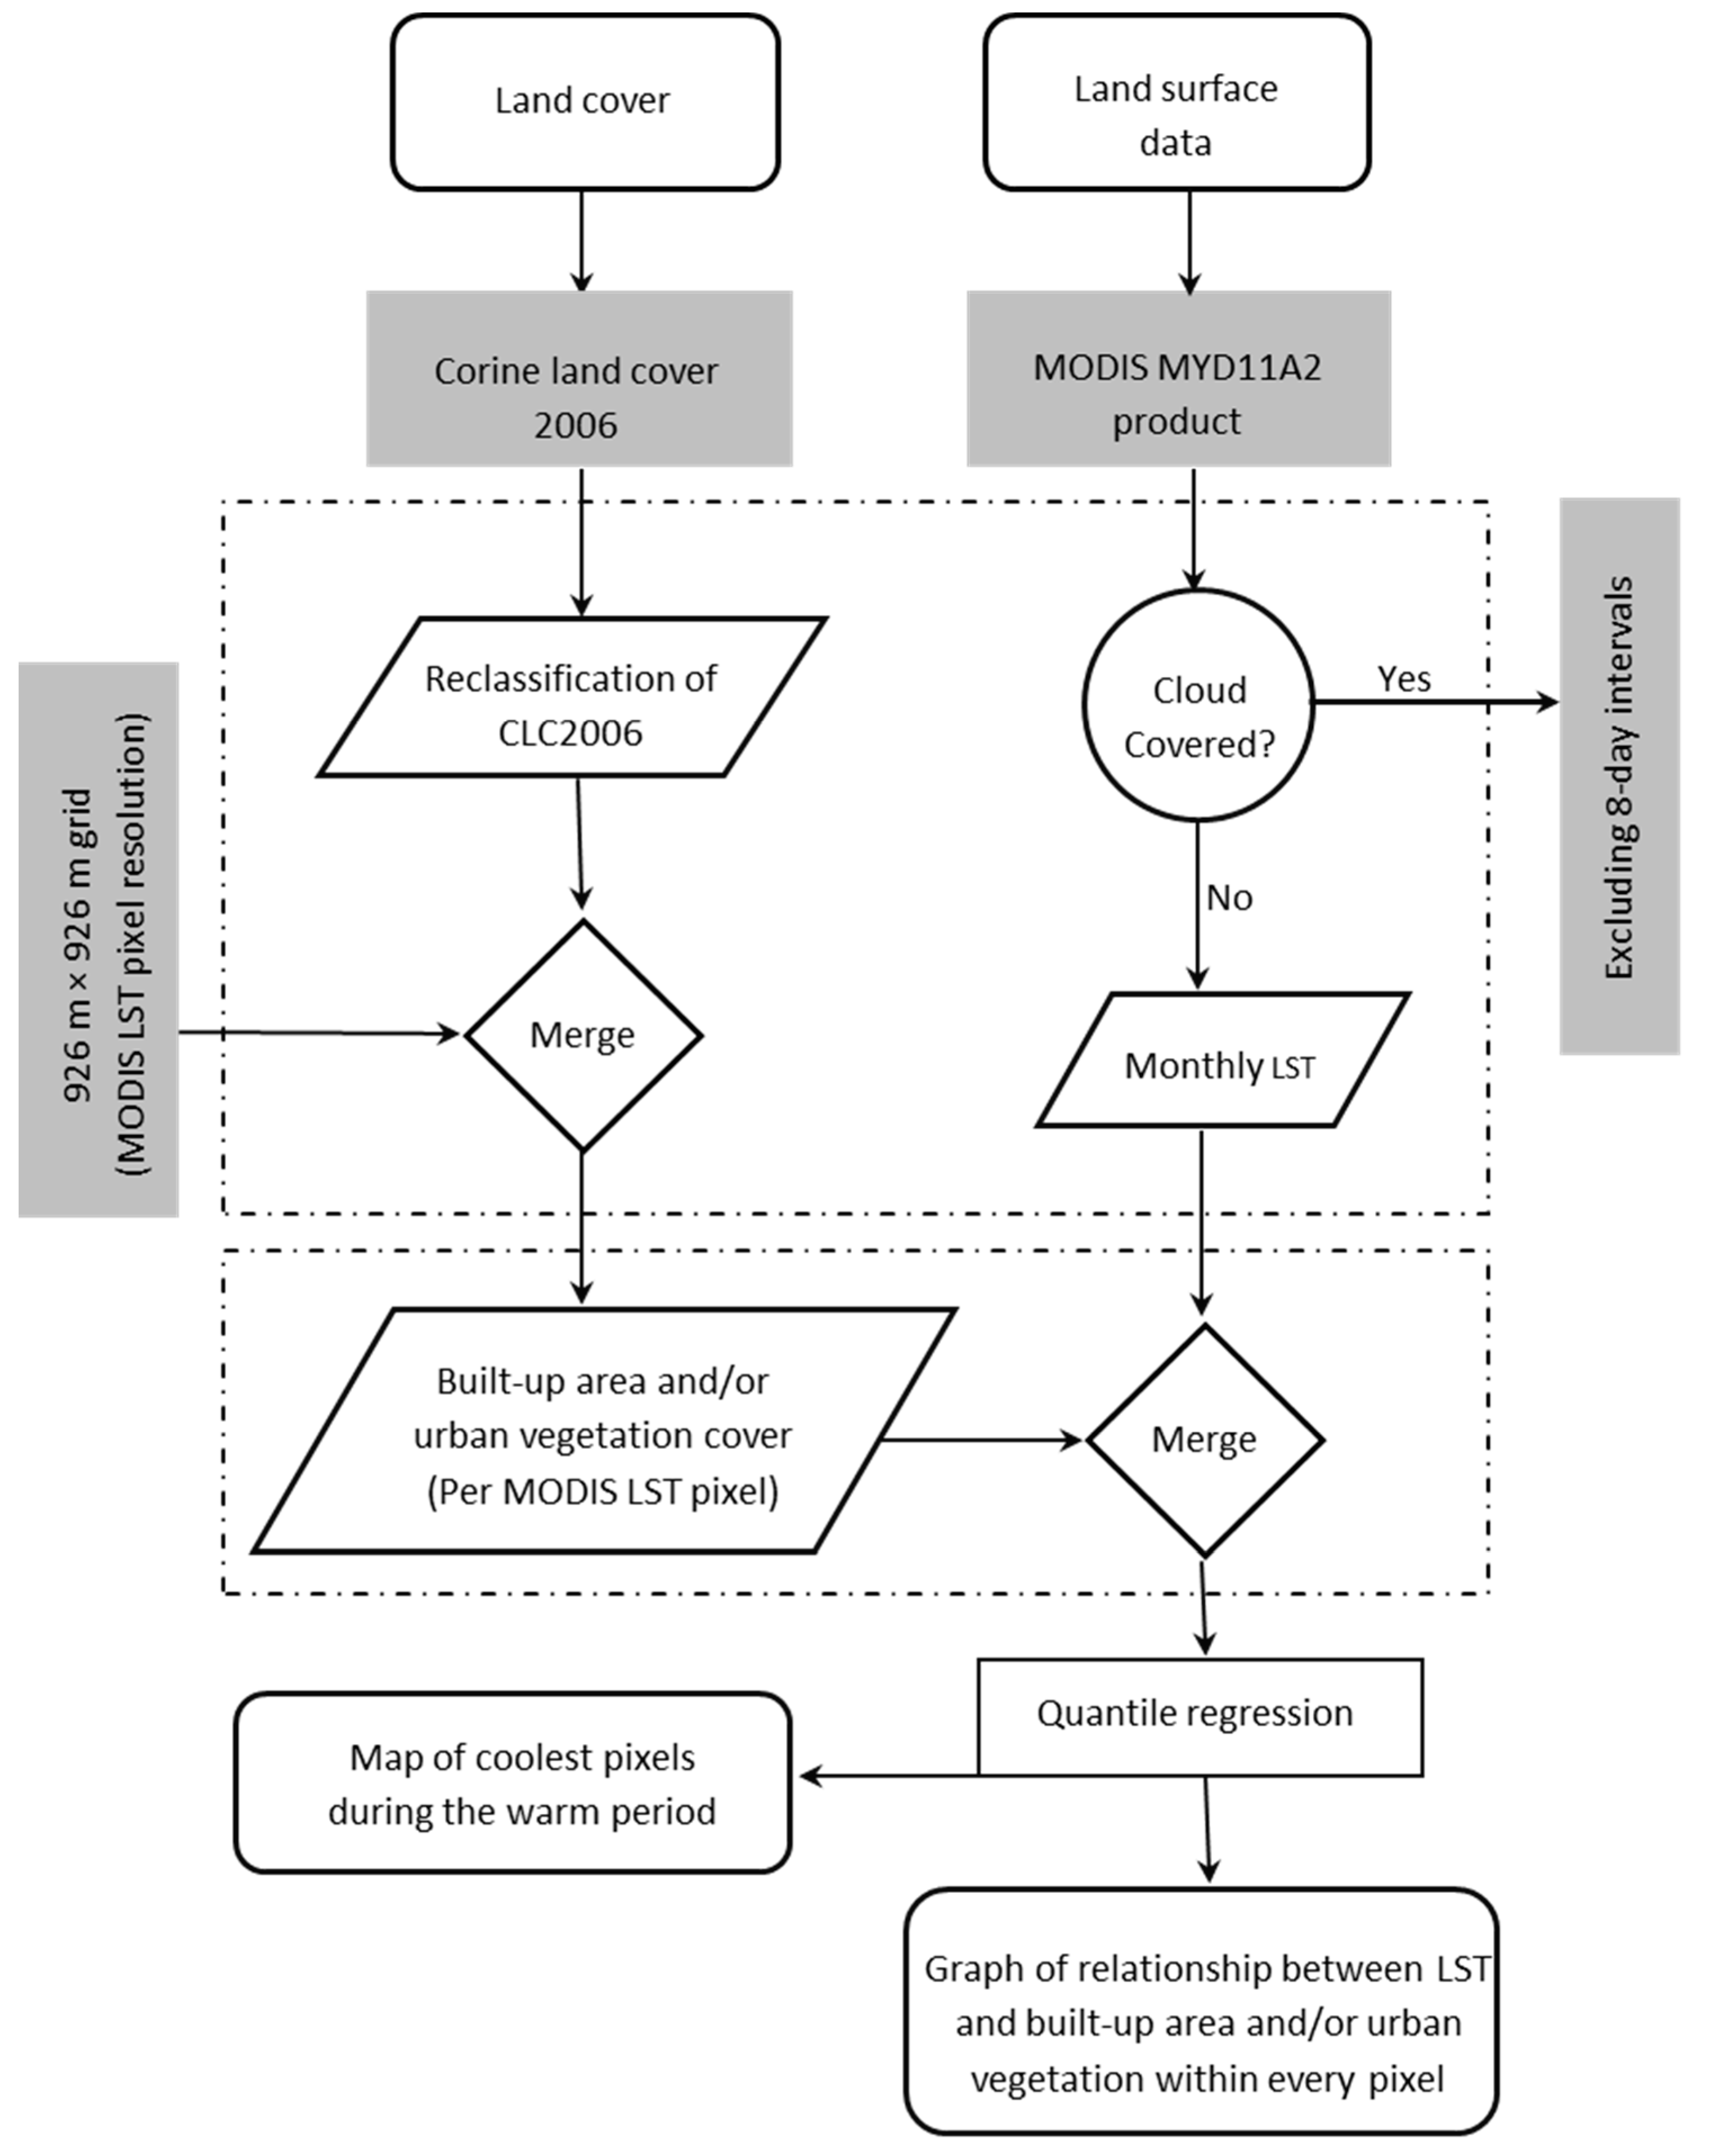
2. Methodology

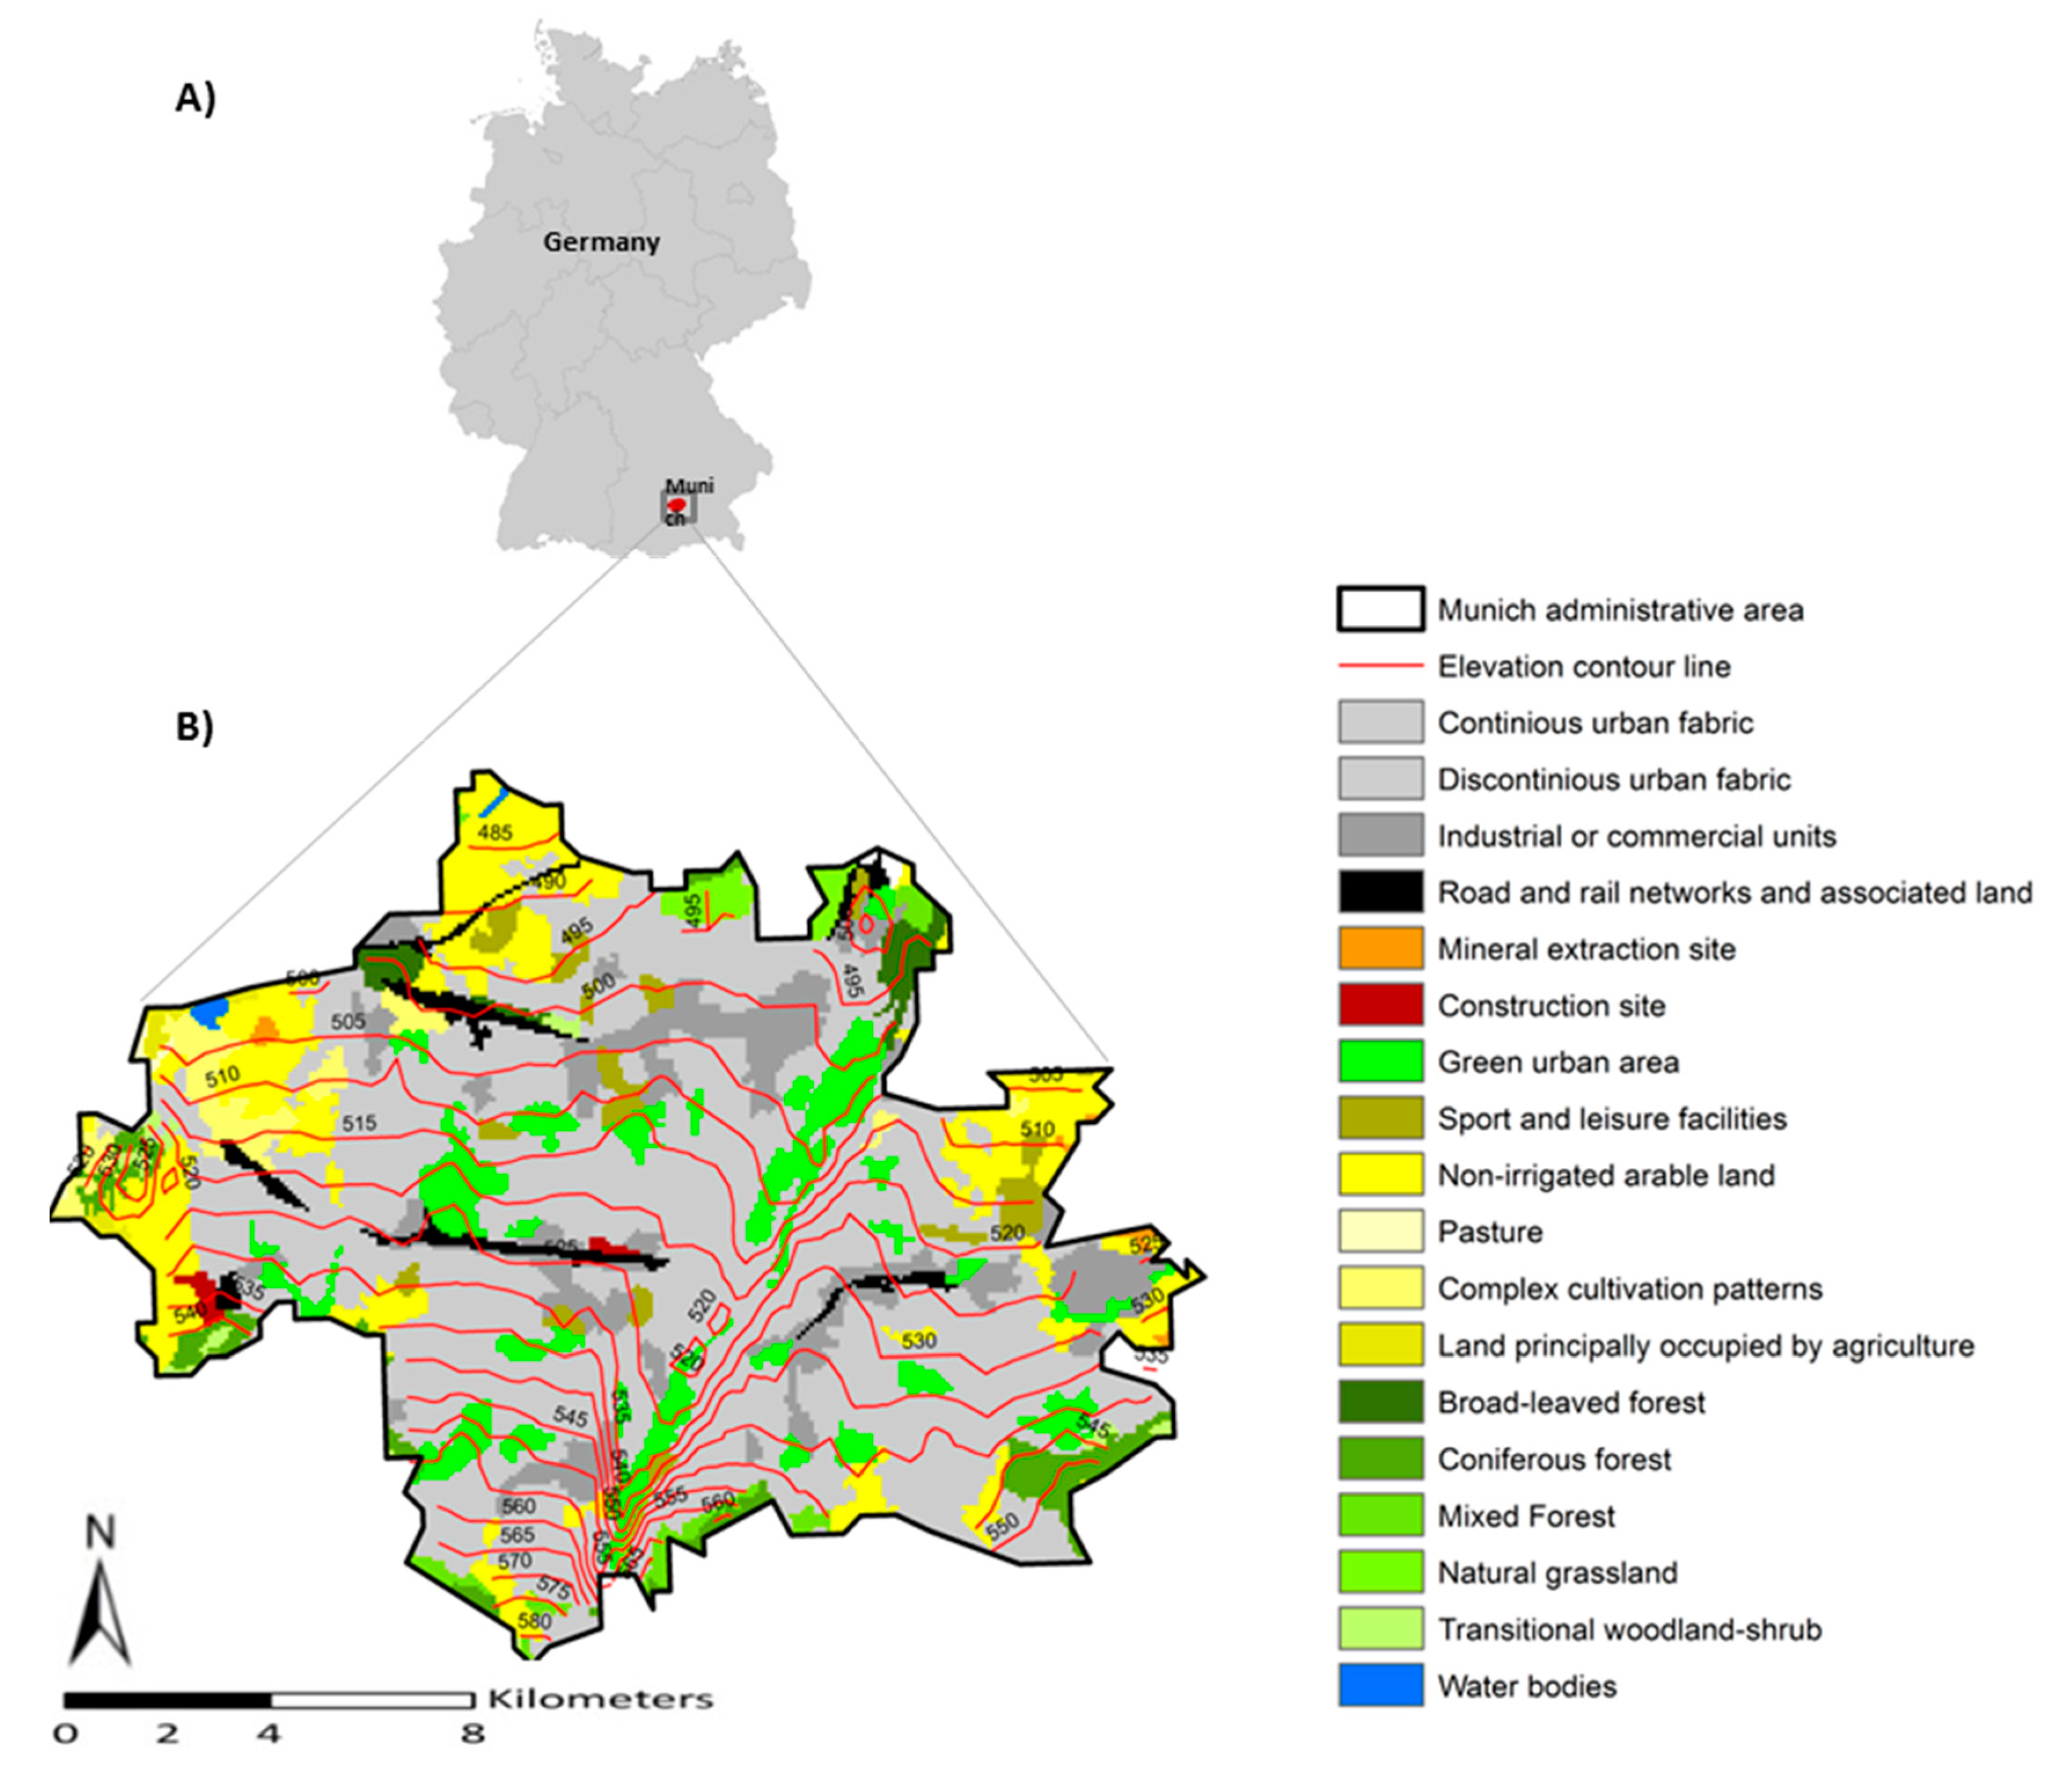
2.1. Study Area

2.2. Land Cover Data

| CLC Classes | Homogenous Class | ||
|---|---|---|---|
| Level 1 | Level 2 | Level 3 | Built-up area |
| 1. Artificial surface | 11. Urban fabric | 111. Continuous urban fabric 112. Discontinuous urban fabric | |
| 12. Industrial, commercial and transport units | 121. Industrial or commercial units 122. Road and rail networks and associated land 124. Airport | ||
| 13. Mine, dump and construction sites | 132. Dump sites 133. Construction sites | ||
| 14. Artificial, non-agricultural vegetated areas | 141. Green urban areas 142. Sport and leisure facilities | Urban vegetation | |
| 3. Forest and semi natural areas | 31. Forest | 311. Broad-leaved forest 312. Coniferous forest 313. Mixed forest | |
| 32. Scrub and/or herbaceous vegetation associations | 321. Natural grasslands | ||
2.3. Land Surface Temperature Data
2.4. Statistical Methods
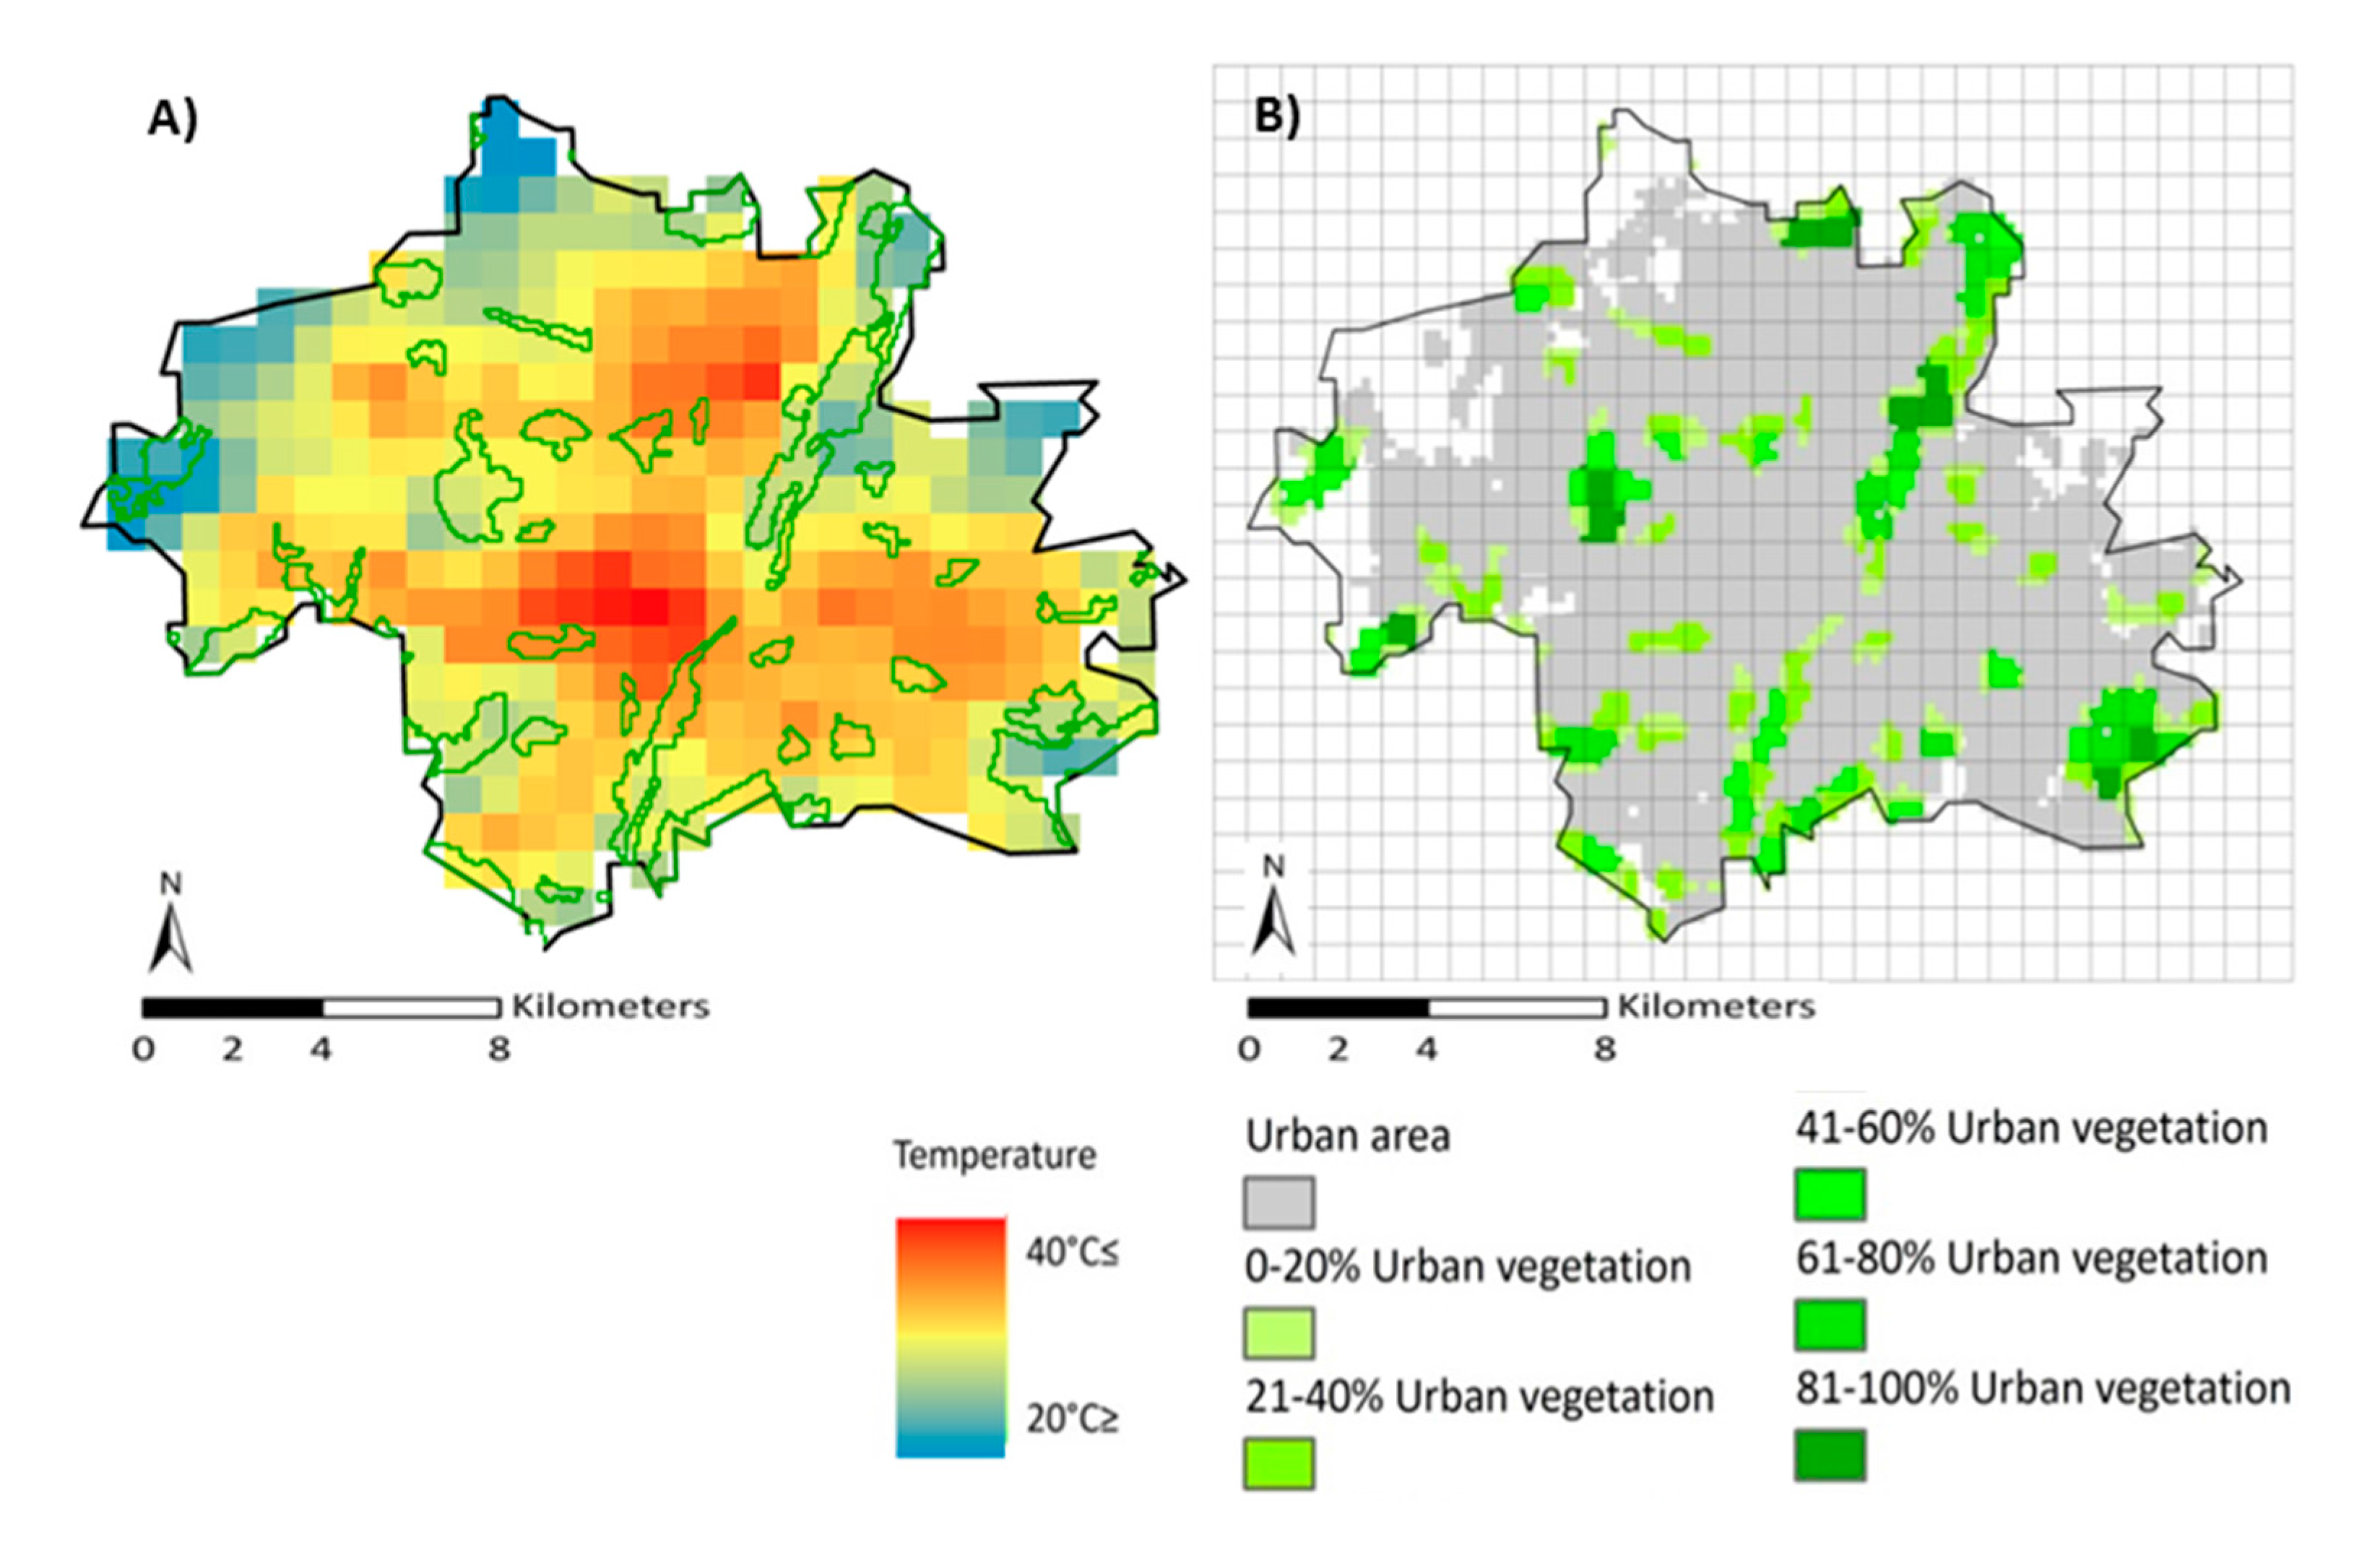
3. Results
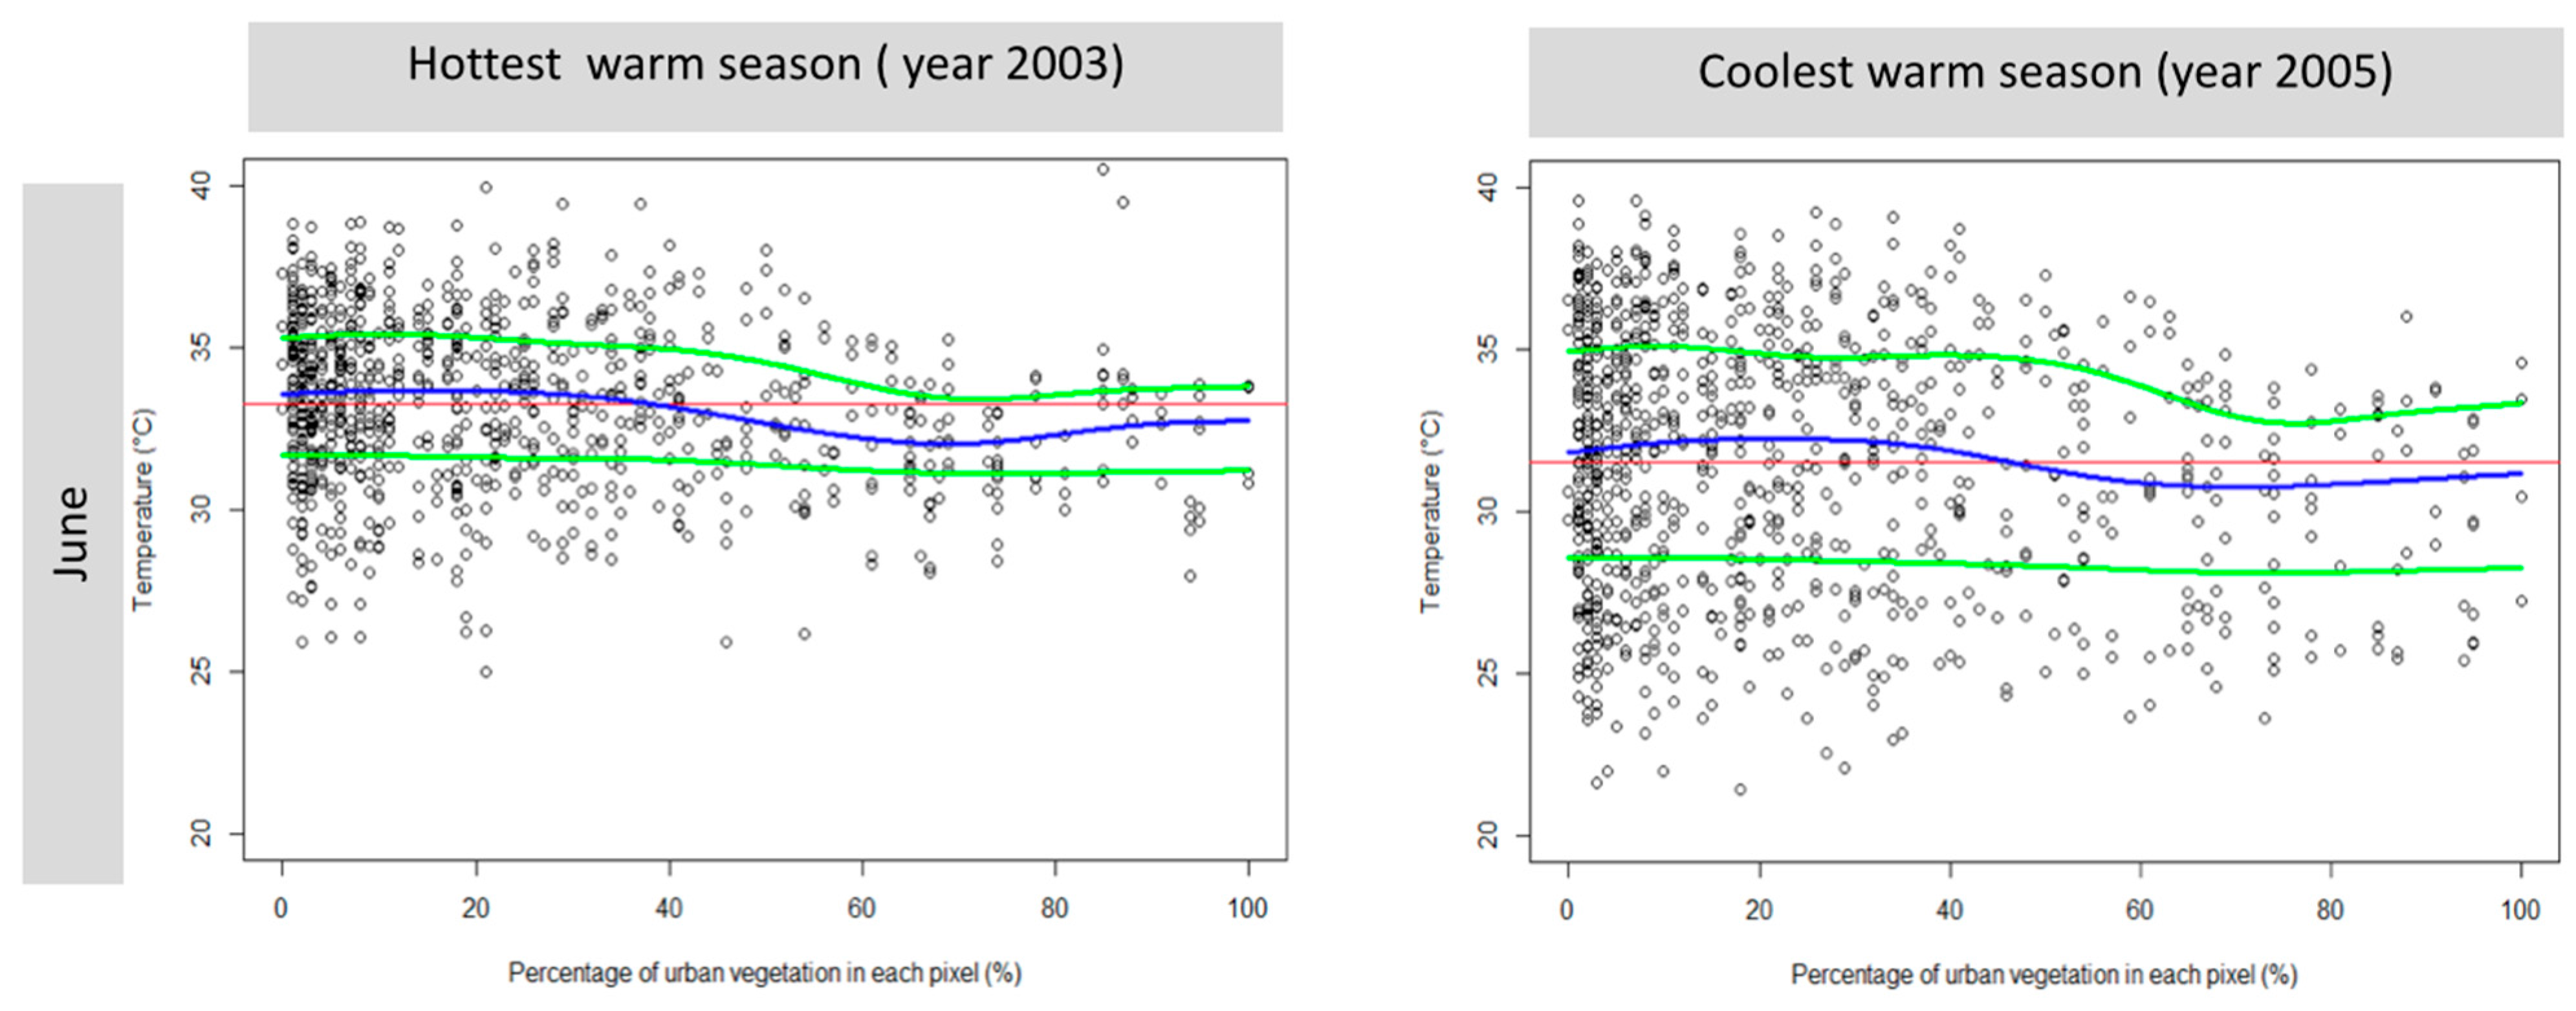
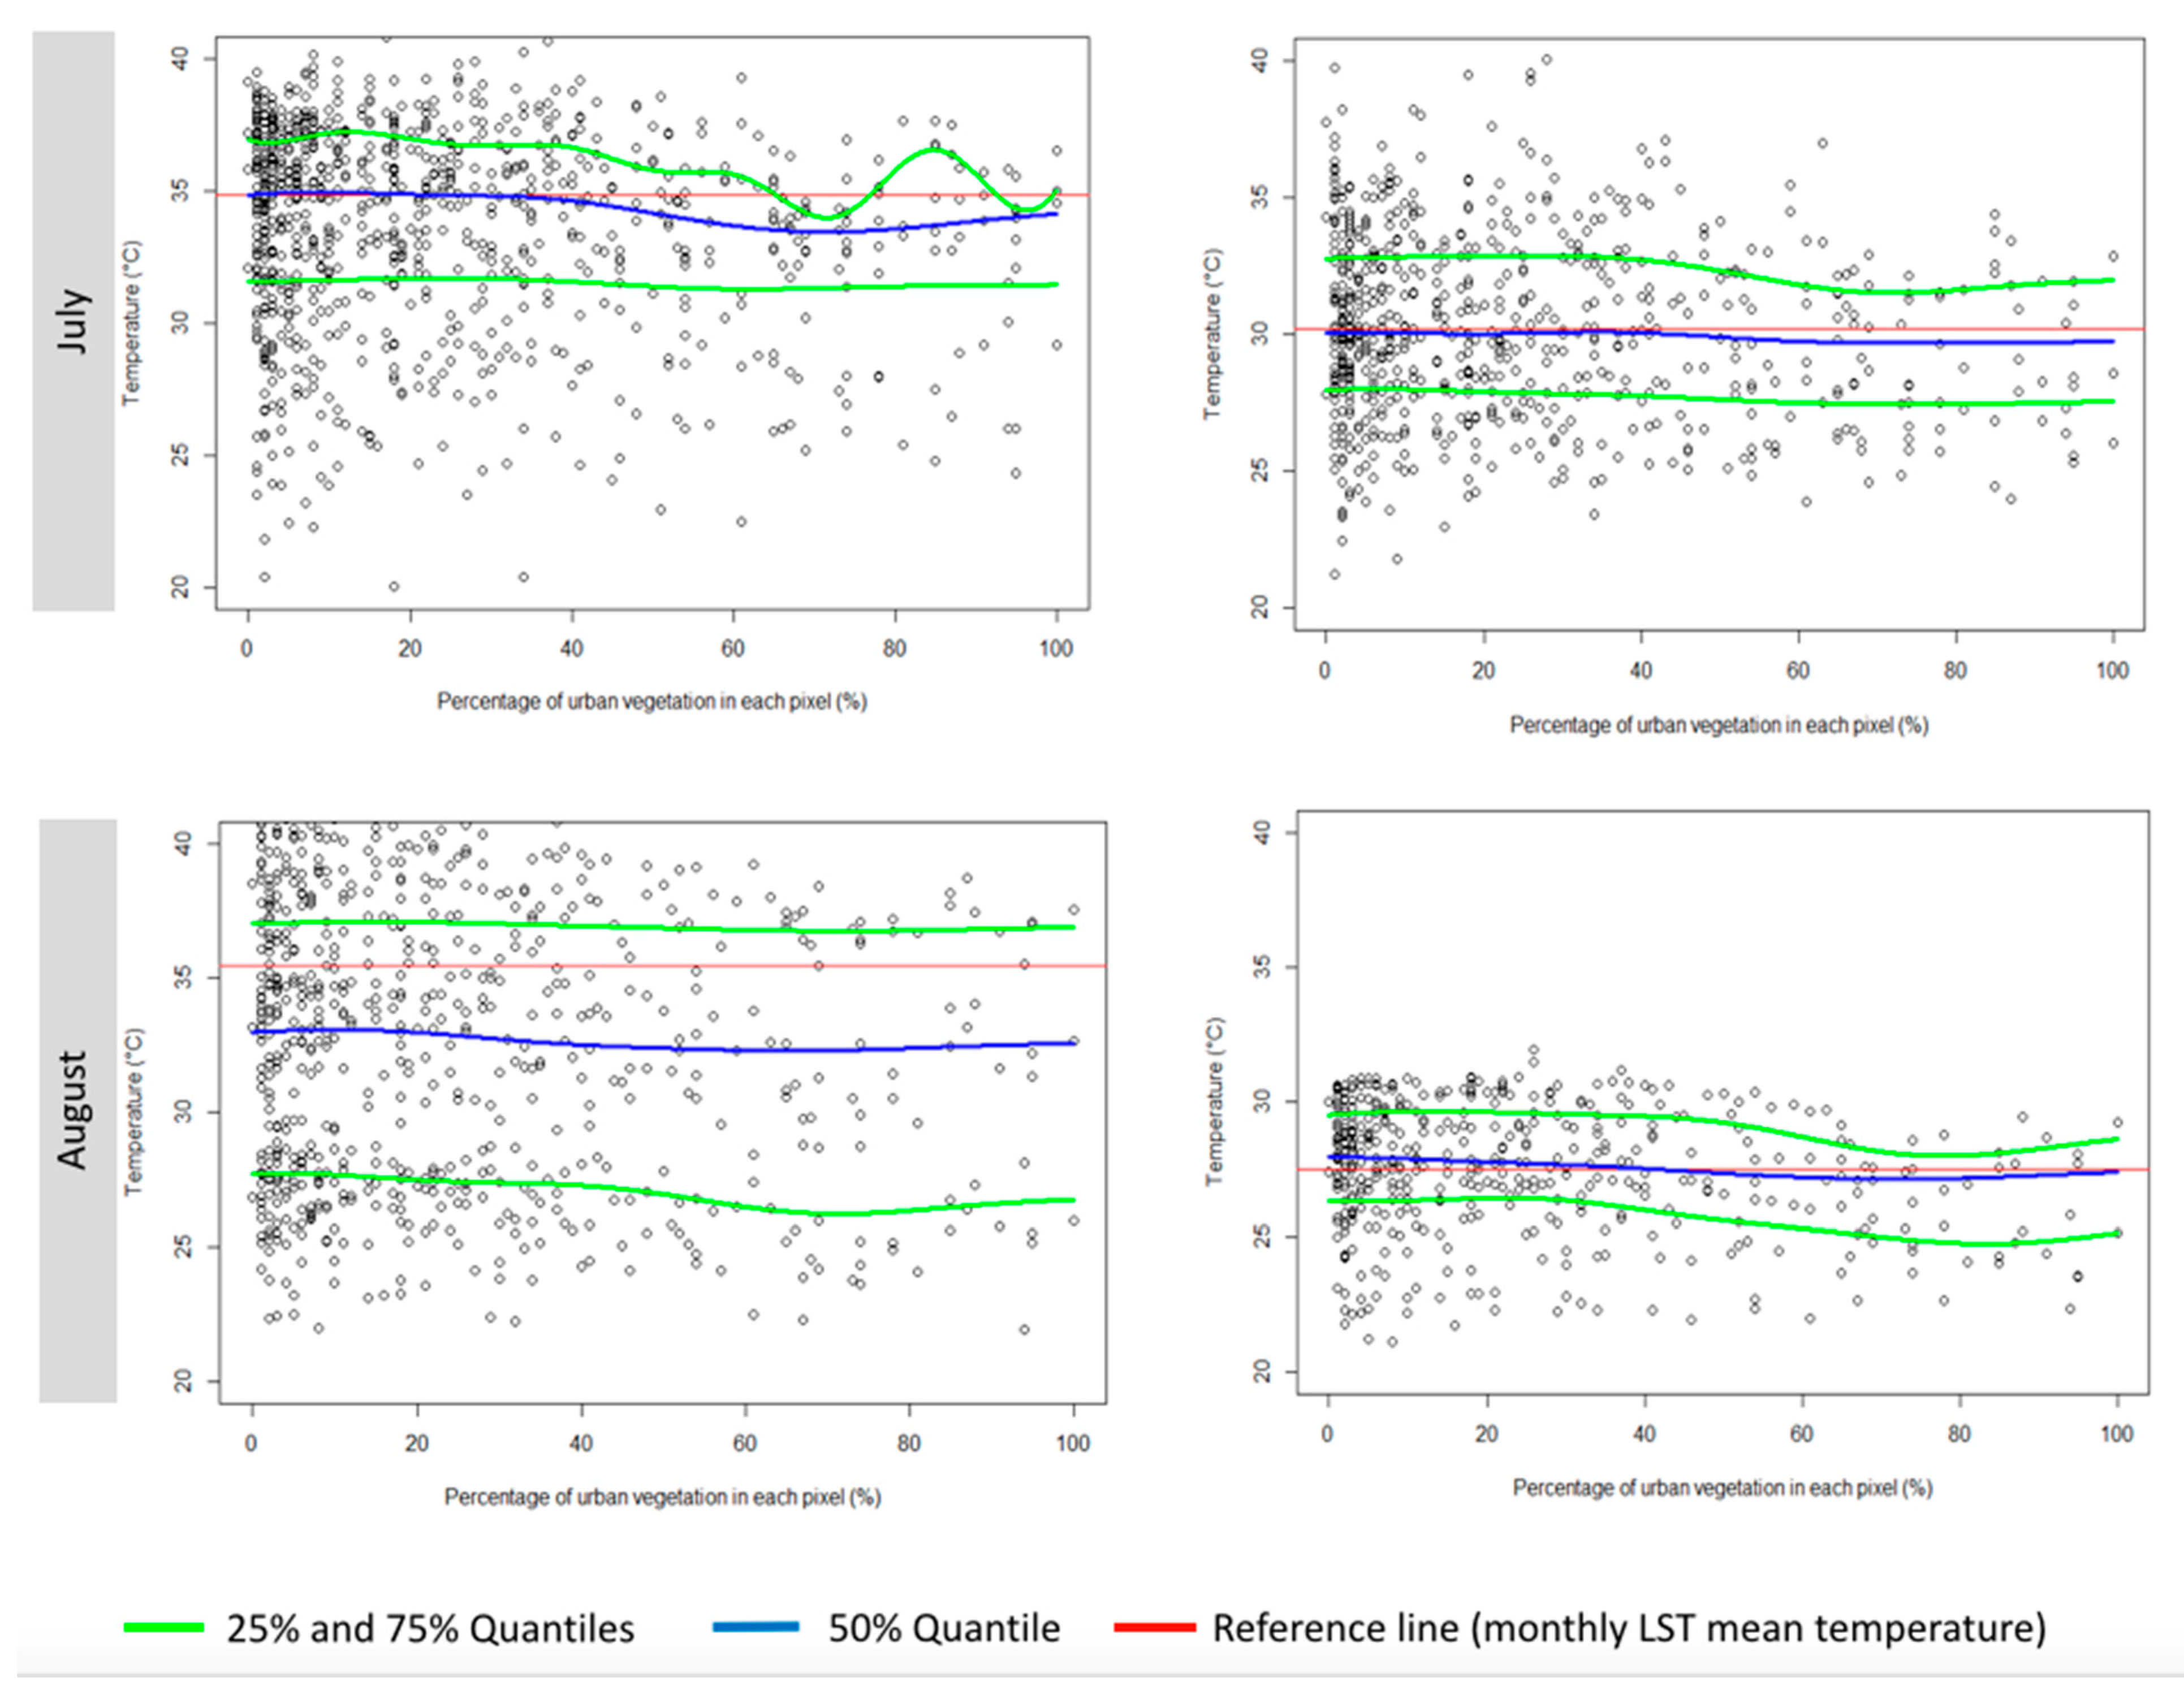
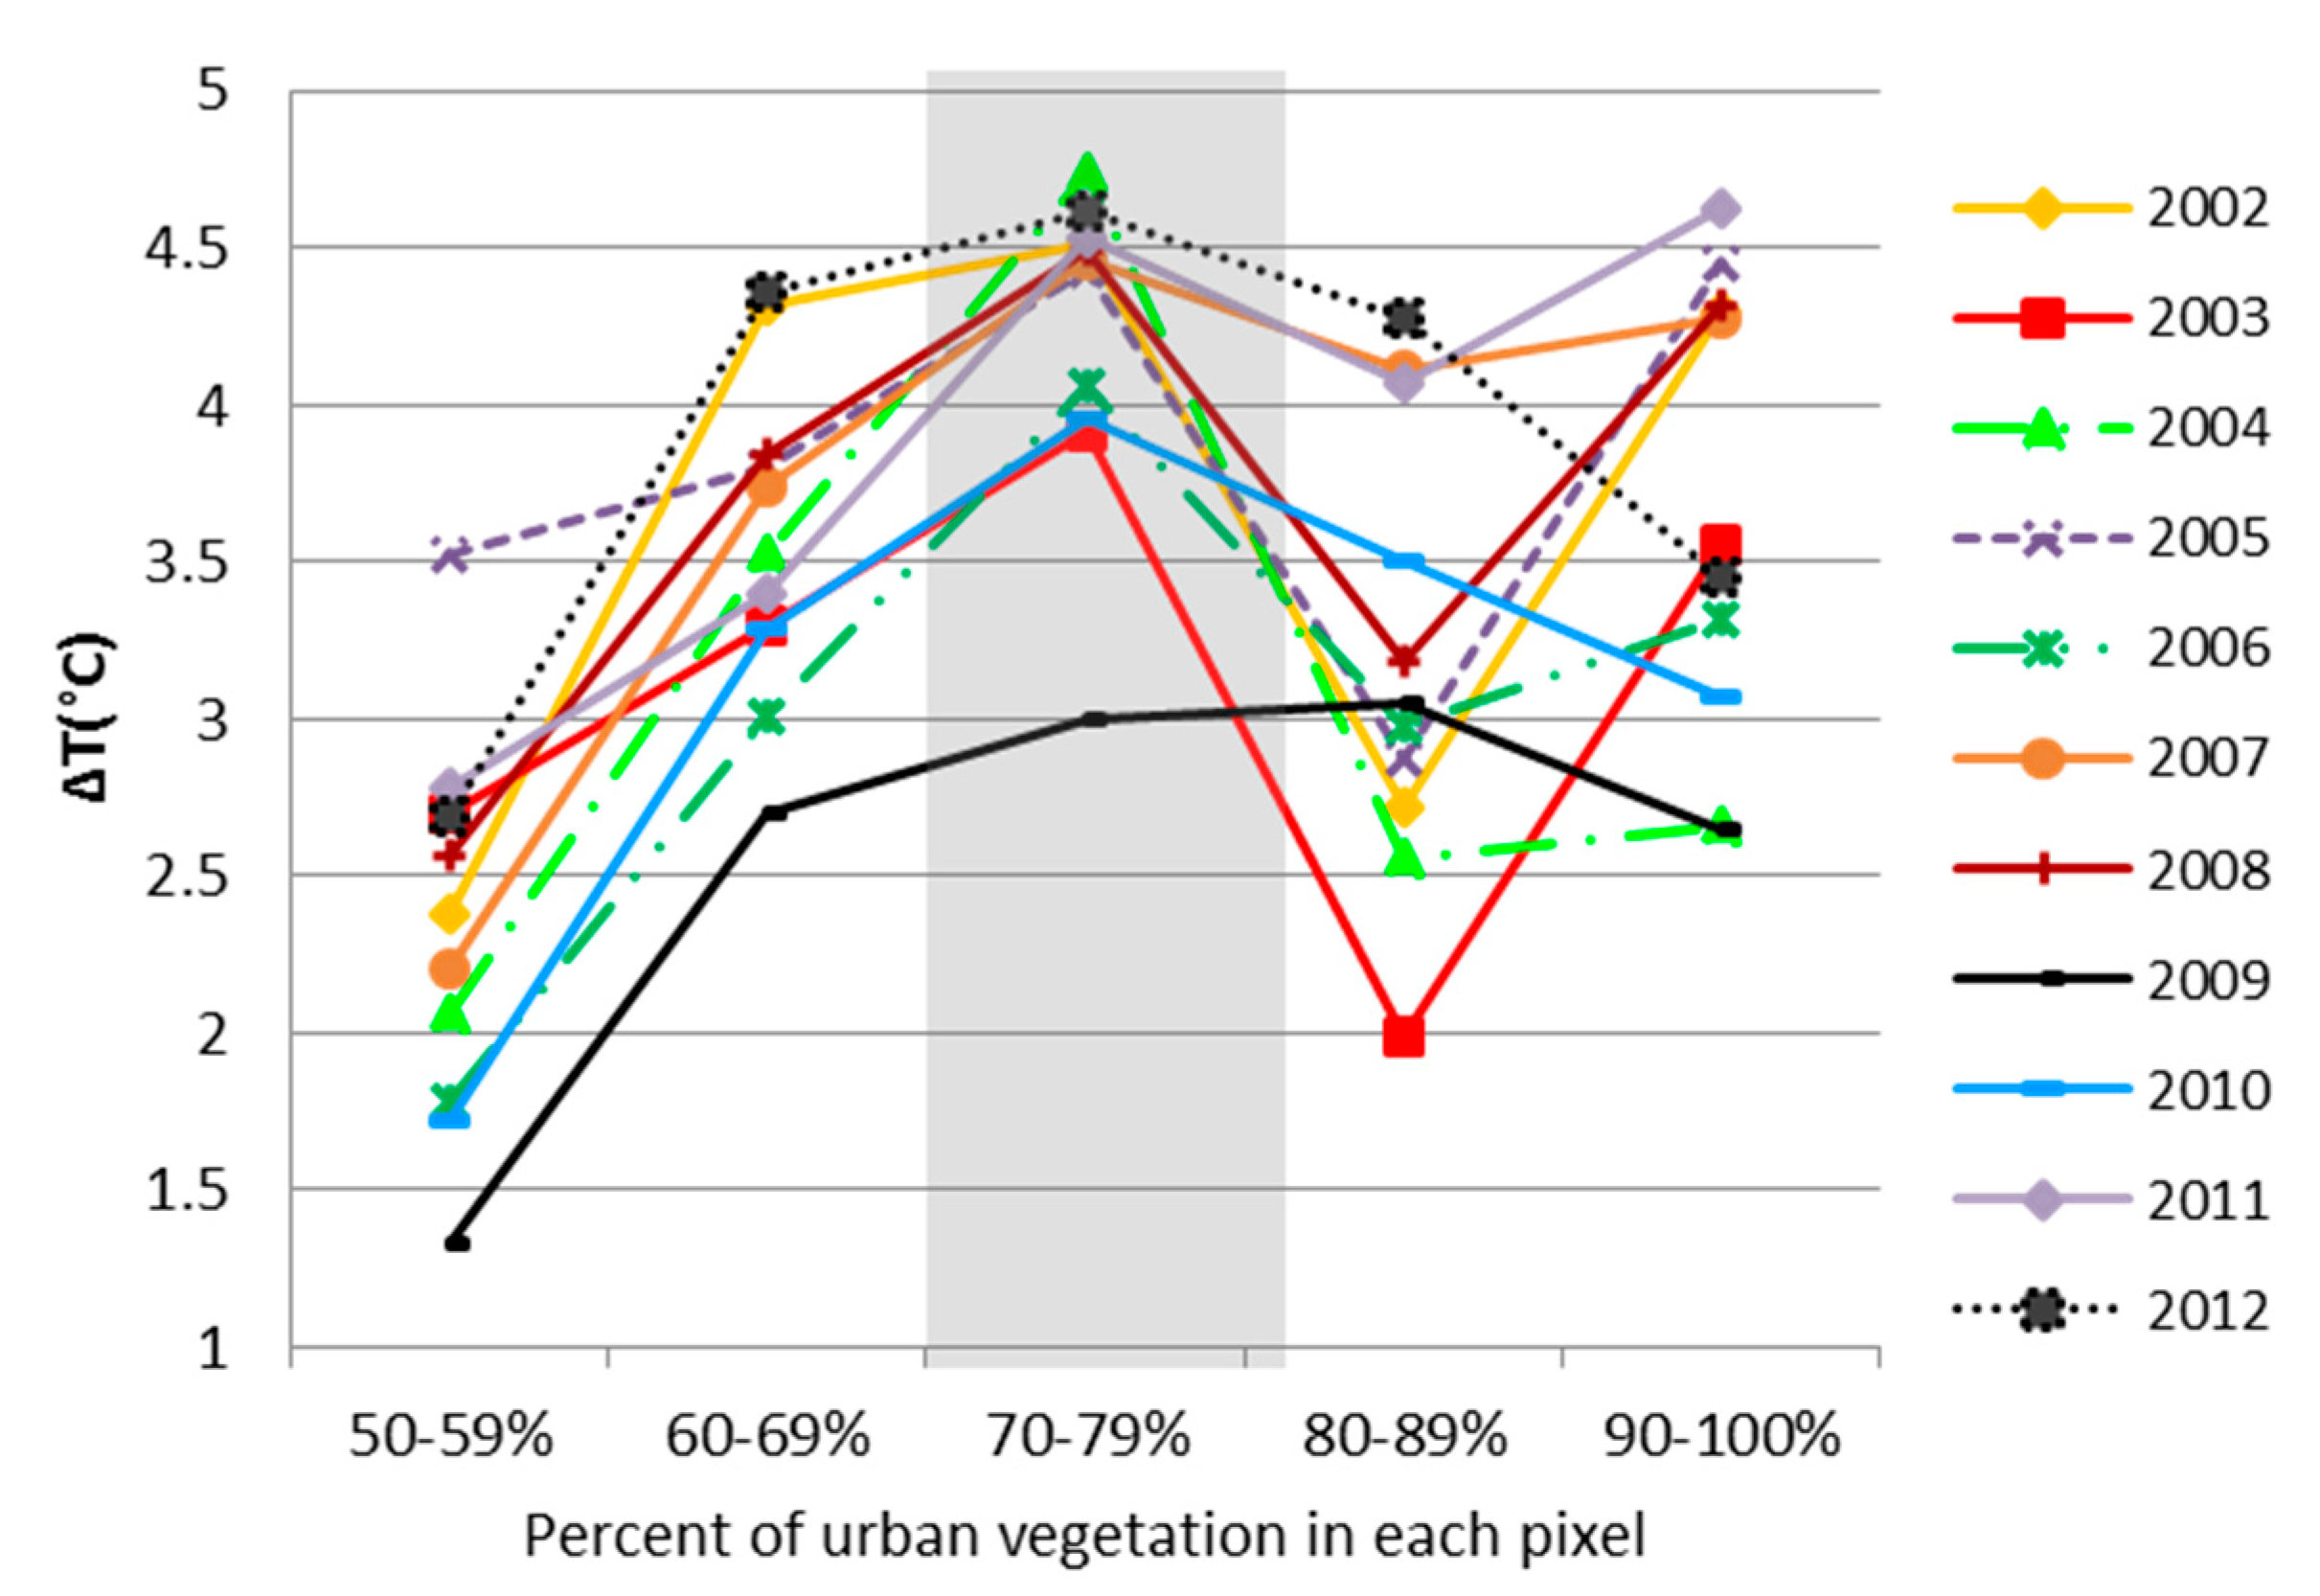
3.1 Relationship between LST and the Ratio of Urban and/or Urban Vegetation

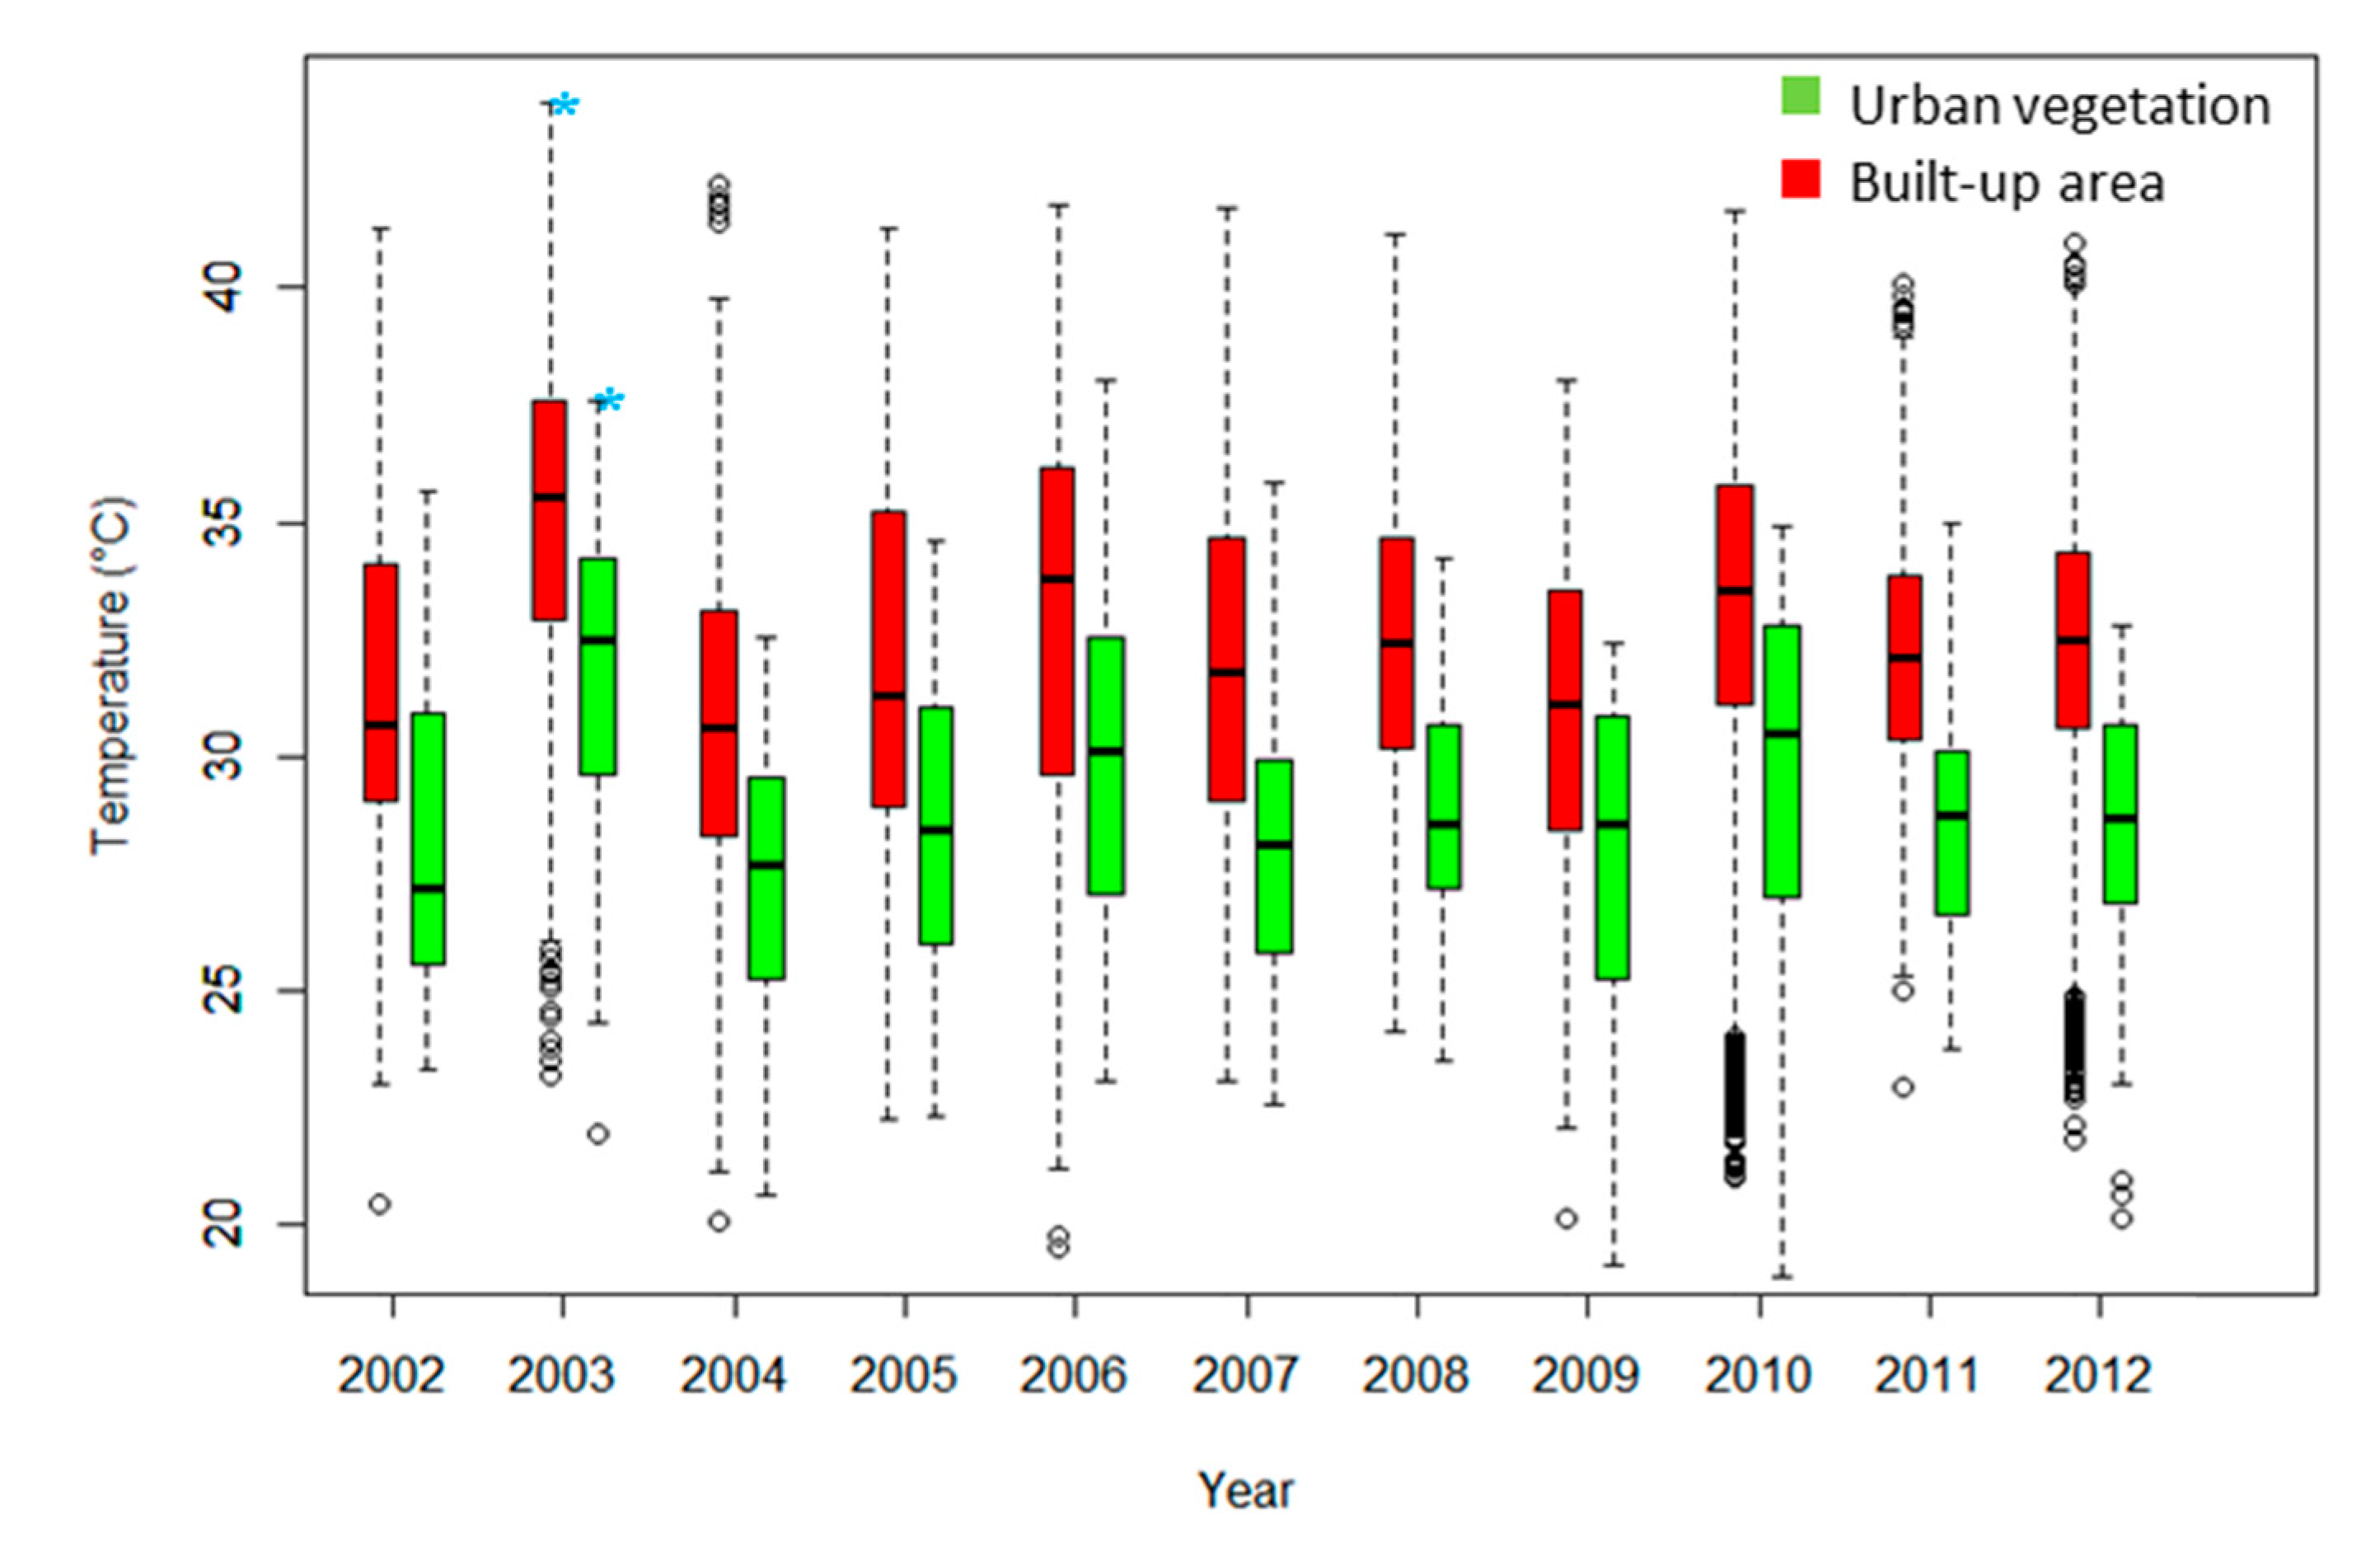
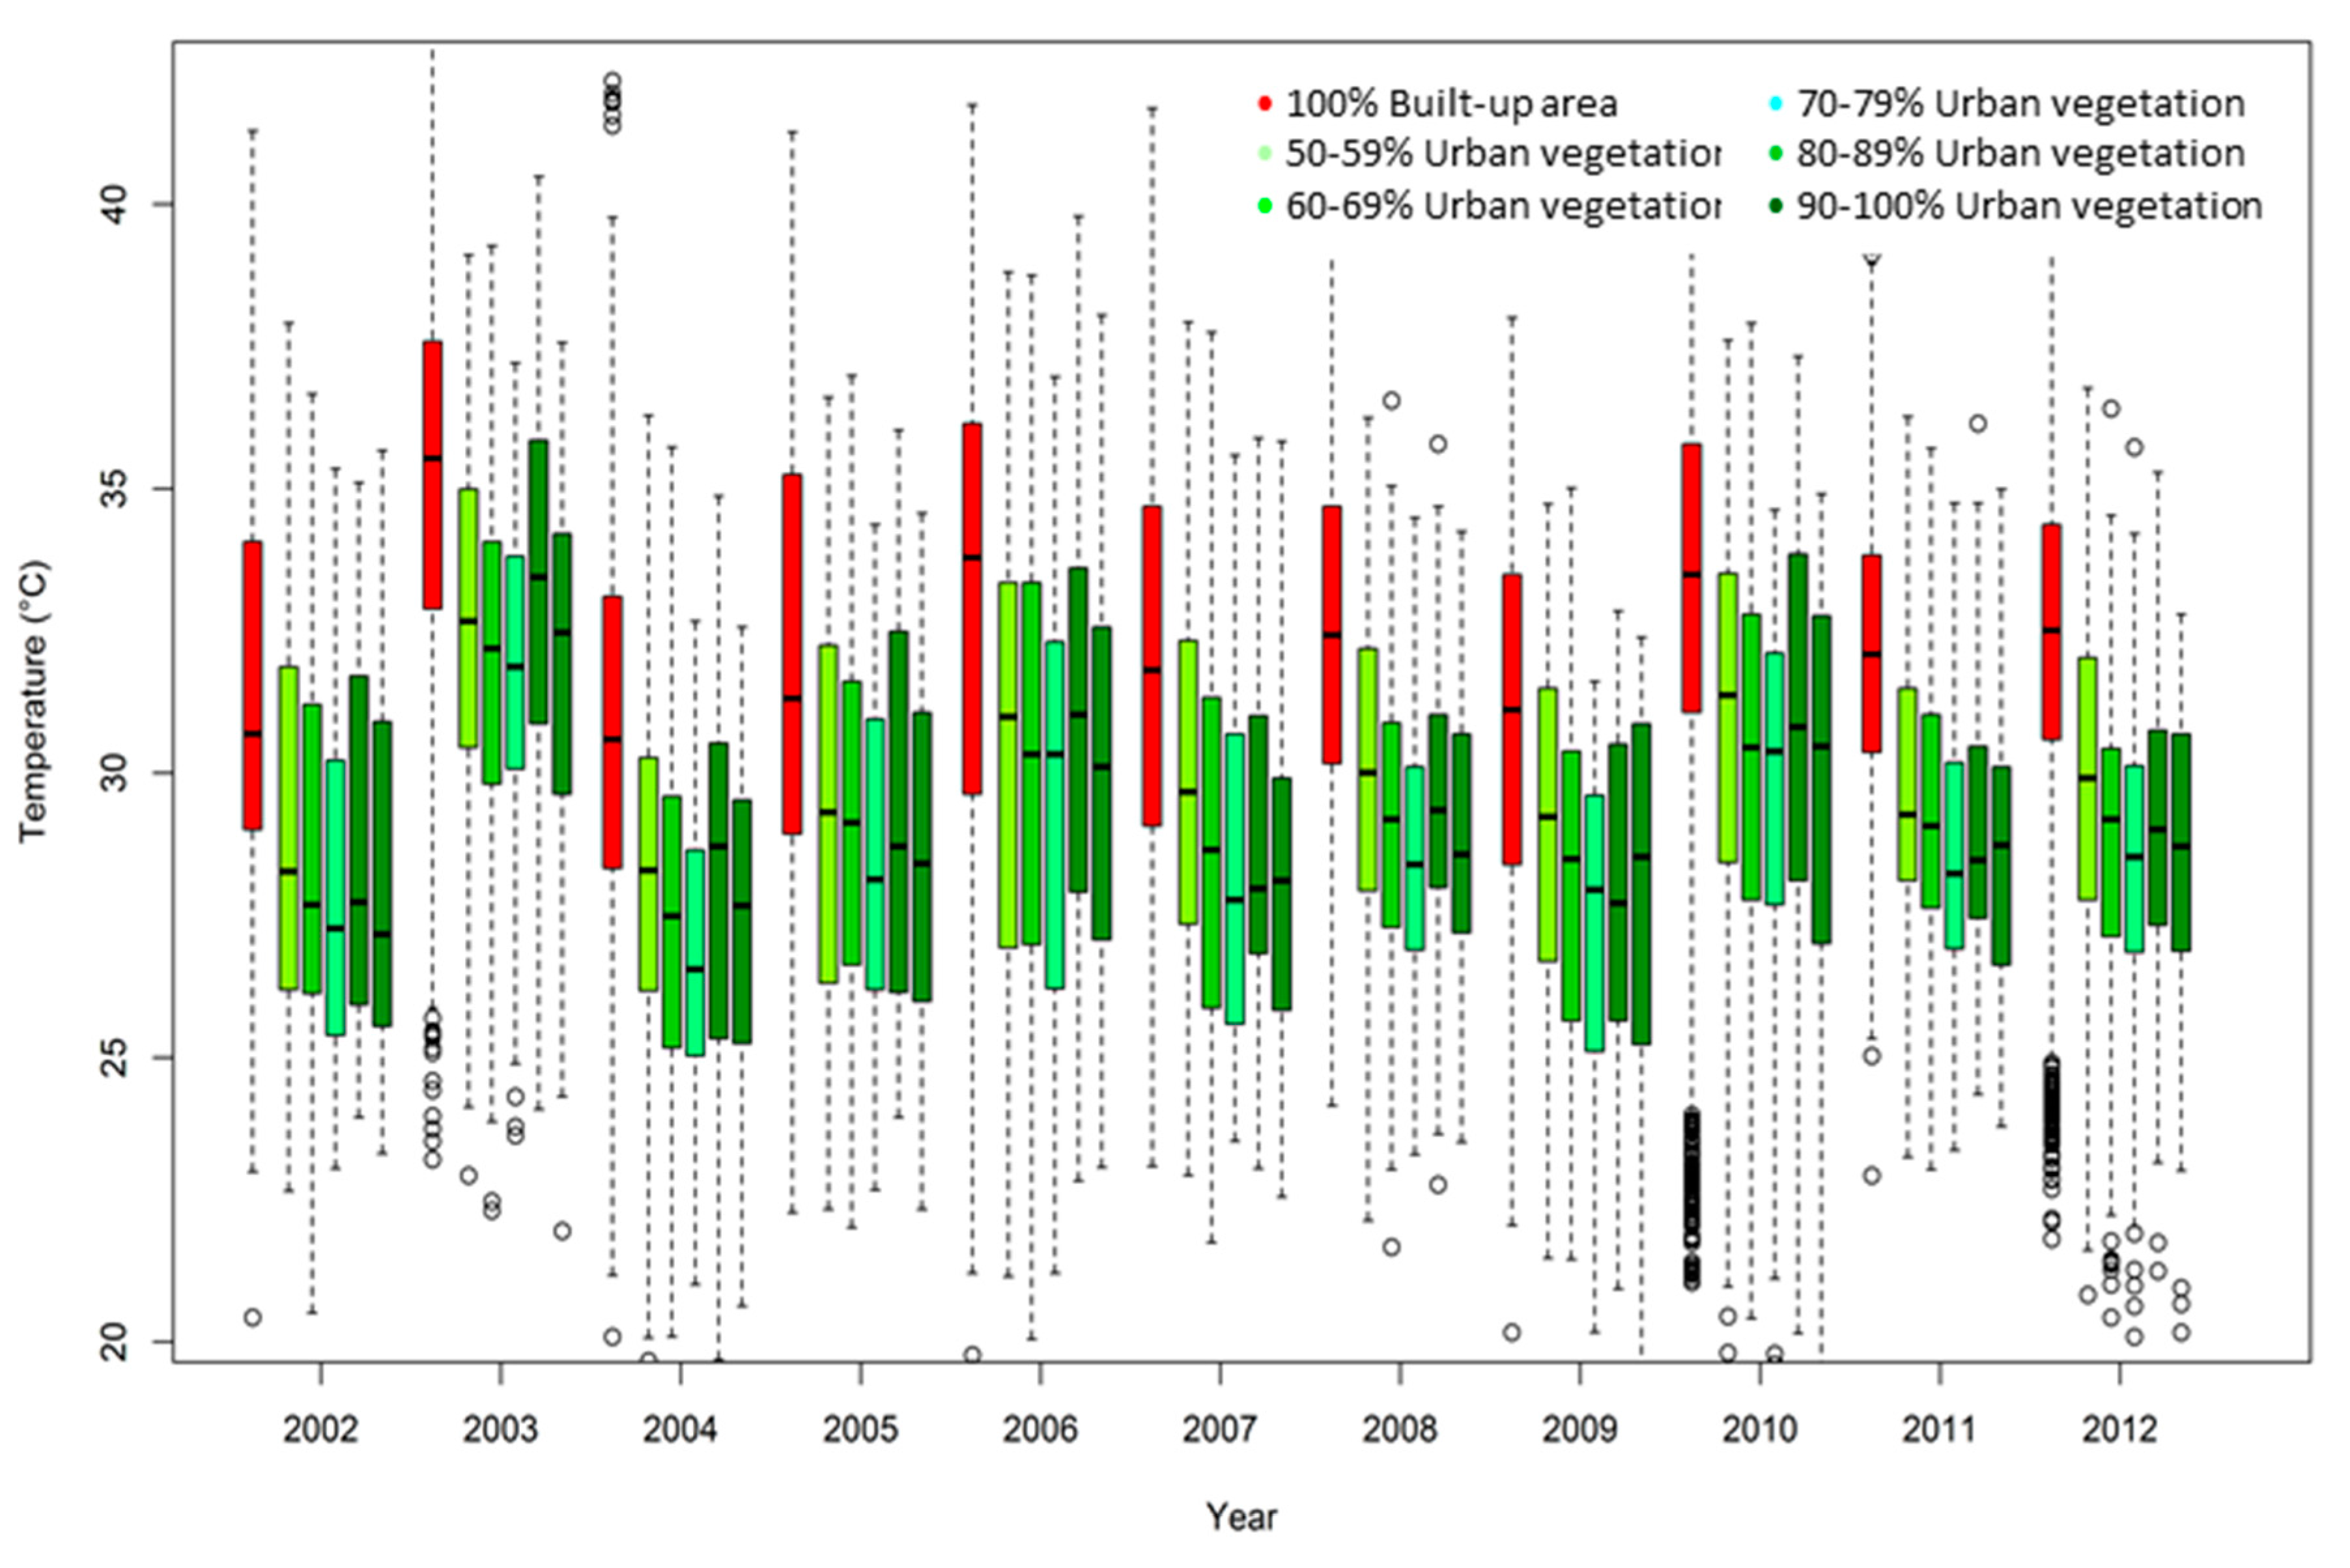
3.2 Built-Up Area and Urban Vegetation LST Patterns


4. Discussion
5. Conclusions
Supplementary Materials
Acknowledgments
Author Contributions
Conflicts of Interest
References
- Lambin, E.F.; Helmut, G. Land-Use and Land-Cover Change: Local Processes and Global Impacts; Springer: Berlin, Germary, 2006. [Google Scholar]
- Oke, T.R. The energetic basis of the urban heat island. Q. J. R. Meteorol. Soc. 1982, 108, 1–24. [Google Scholar]
- Gartland, L. Heat Islands, Understanding and Mitigating Heat in Urban Areas; Earthscan: London, UK, 2008. [Google Scholar]
- Schwarz, N.; Schlink, U.; Franck, U.; Grossmann, K. Relationship of land surface and sir temperatures and its implications for quantifying urban heat island indicators—An application for the city of Leipzig (Germany). Ecol. Indic. 2012, 18, 693–704. [Google Scholar] [CrossRef]
- Wienert, U.; Kuttler, W. The dependence of the urban heat island intensity on latitude—A statistical approach. Meteorologische Zeitschrift 2007, 14, 677–686. [Google Scholar] [CrossRef]
- Tomlinson, C.J.; Chapman, L.; Thornes, J.E.; Baker, C.J. Derivation of Birmingham’s summer surface urban heat island from MODIS satellite images. Int. J. Climatol. 2010, 32, 214–224. [Google Scholar] [CrossRef]
- Harlan, S.L.; Brazel, A.J.; Prashad, L.; Stefanov, W.L.; Larsen, L. Neighborhood microclimates and vulnerability to heat stress. Soc. Sci. Med. 2006, 63, 2847–2863. [Google Scholar] [CrossRef] [PubMed]
- Lafortezza, R.; Carrus, G.; Sanesi, G.; Davies, C. Benefits and wellbeing perceived by people visiting green spaces in periods of heat stress. Urban For. Urban Green. 2009, 8, 97–108. [Google Scholar] [CrossRef]
- Stafoggia, M.; Schwartz, J.; Forastiere, F.; Perucci, C.A. Does temperature modify the association between air pollution and mortality? A multicity case-cross over analysis in Italy. Am. J. Epidemiol. 2008, 167, 1476–1485. [Google Scholar]
- Basara, J.B.; Basara, H.G.; Illston, B.G.; Crawford, K.C. The impact of the urban heat islands during an intense heat wave in Oklahoma city. Adv. Meterol. 2010. [Google Scholar] [CrossRef]
- D’Ippoliti, D.; Michelozzi, P.; Marino, C.; de’Donato, C.; Menne, B.; Katsouyanni, K.; Kirchmayer, U.; Analitis, A.; Medina-Ramón, M.; Paldy, A.; et al. The impact of heatwaves on mortality in 9 European cities: Results from the EuroHEAT project. J. Environ. Health 2010, 9. [Google Scholar] [CrossRef]
- Robine, J.M.; Cheung, S.L.K. Death toll exceeded 70,000 in Europe during the summer of 2003. C. R. Biol. 2008, 331, 171–178. [Google Scholar] [CrossRef] [PubMed]
- Doick, K.J.; Hutchings, T.R. Air Temperature Regulation by Trees and Wider Green Infrastructure in Urban Areas: The Current State of Knowledge; Research note 12 (FCRN012); Forestry Commission: Edinburgh, UK, 2013. [Google Scholar]
- Kikegawa, Y.; Genchi, Y.; Yoshikado, H.; Kondo, H. Development of a numerical simulation system toward comprehensive assessments of urban warming counter measures including their impacts upon the urban buildings energy-demands. Appl. Energy 2003, 76, 449–466. [Google Scholar] [CrossRef]
- Cristóbal, J.; Ninyerola, M.; Pons, X. Modeling air temperature through a combination of remote sensing and GIS data. J. Geogr. Res. 2008, 113, 1–13. [Google Scholar]
- Cao, X.; Onishi, A.; Chen, J.; Imura, H. Quantifying the cool island intensity of urban parks using ASTER and IKONOS data. Landsc. Urban Plan. 2010, 9, 224–231. [Google Scholar] [CrossRef]
- Weng, Q. Thermal infrared remote sensing for urban climate and environmental studies: Methods, applications, and trends. ISPRS J. Photogramm. Remote Sens. 2009, 64, 335–344. [Google Scholar] [CrossRef]
- Honjo, T.; Takakura, T. Analysis of temperature distribution of urban green spaces using remote sensing data. J. Jpn. Instit. Landsc. Arch. 1986, 49, 299–304. [Google Scholar] [CrossRef]
- Gallo, K.P.; McNab, A.L.; Karl, T.R.; Brown, J.F.; Hood, J.J.; Tarpley, J.D. The use of NOAA AVHRR data for assessment of the urban heat island effect. J. Appl. Meteorol. 1993, 32, 899–908. [Google Scholar] [CrossRef]
- Richter, M.; Wiland, U. Applied Urban Ecology Applied Urban Ecology: A Global Frame Work; Wiley-Blackwell Publication: West Sussex, UK, 2012; ISBN ISBN 978-1-4443-3339-8. [Google Scholar]
- Peng, S.; Piao, S.; Ciais, P.; Friedlingstein, P.; Ottle, C.; Bréon, F.; Nan, H.; Zhou, L.; Myneni, R. Surface Urban Heat Island Across 419 Global Big Cities. Environ. Sci. Technol. 2012, 46, 696–703. [Google Scholar] [CrossRef] [PubMed]
- Schwarz, N.; Lautenbach, S.; Seppelt, R. Exploring indicators for quantifying surface urban heat islands of European cities with MODIS land surface temperatures. Remote Sens. Environ. 2011, 115, 3175–3186. [Google Scholar] [CrossRef]
- Huang, J.; Akbari, H.; Taha, H. The Wind-Shielding and Shading Effects of Trees on Residential Heating and Cooling Requirements. In Proceedings of the ASHRAE Winter Meeting, American Society of Heating, Refrigerating and Air-Conditioning Engineers, Atlanta, GA, USA, 11–14 February 1990.
- Taubenböck, H.; Wurm, M.; Esch, Th.; Dech, S. (Eds.) Globale Urbanisierung: Perspektive aus dem All; Springer: Heidelberg, Germany, 2015.
- Thierstein, A.; Reiss-Schmidt, S. Urban Development Management in Munich, Germany. In Proceedings of the 44th ISOCARP Congress, Dalian, China, 19–23 September 2008.
- Lu, D.; Weng, Q. Use of impervious surface in urban land-use classification. Remote Sens. Environ. 2006, 102, 146–160. [Google Scholar]
- Wan, Z. New refinements and validation of the MODIS Land-Surface Temperature/Emissivity products. Remote Sens. Environ. 2008, 112, 59–74. [Google Scholar] [CrossRef]
- Koenker, R.; Bassett, G. Regression quantiles. Econometrica 1978, 46, 33–50. [Google Scholar] [CrossRef]
- Takeuchi, I.; Le, Q.; Sears, T.; Smola, A. Nonparametric Quantile Estimation. J. Mach. Learn. Res. 2006, 7, 1231–1264. [Google Scholar]
- Miller, R.G. Simultaneous Statistical Inference; Springer: New York, NY, USA, 1981. [Google Scholar]
- CLIMAT (Global Climate Data) Report, 2014. Deutscher Wetter Dienst. Available online: http://www.dwd.de/bvbw/appmanager/bvbw/dwdwwwDesktop?_nfpb=true&_pageLabel=_dwdwww_klima_umwelt_klimadaten_deutschland&T82002gsbDocumentPath=Navigation%2FOeffentlichkeit%2FKlima__Umwelt%2FKlimadaten%2Fkldaten__kostenfrei%2Fkldat__welt__monat__node.html%3F__nnn%3Dtrue/ (accessed on 29 July 2014).
- Smith, R.; Choudhury, B.J. Analysis of normalized difference and surface temperature observations over southeastern Australia. Int. J. Remote Sens. 1991, 12, 2021–2044. [Google Scholar] [CrossRef]
- Weng, Q.; Lu, D.; Schubring, J. Estimation of land surface temperature–vegetation abundance relationship for urban heat island studies. Remote Sens. Environ. 2004, 89, 467–483. [Google Scholar] [CrossRef]
- Oke, T.R. Boundary Layer Climates, 2nd ed.; Co-Published by Routledge: London, UK; John Wiley & Sons: New York, NY, USA, 1987. [Google Scholar]
- Hung, T.; Uchihama, D.; Ochi, S.; Yasuoka, Y. Assessment with satellite data of the urban heat island effects in Asian mega cities. Int. J. Appl. Earth Observ. Geoinform. 2006, 8, 34–48. [Google Scholar] [CrossRef]
- McCarthy, M.P.; Best, M.J.; Betts, R.A. Climate change in cities due to global warming and urban effects. Geophys. Res. Lett. 2010, 37. [Google Scholar] [CrossRef]
- Smith, C.; Levermore, G. Designing urban spaces and buildings to improve sustainability and quality of life in a warmer world. Energy Policy 2008, 36, 4558–4562. [Google Scholar] [CrossRef]
- Taha, H.G.; Akbari, H.; Rosenfield, A. Vegetation Canopy Micro-Climate: A Field Project in Davis, California; Lawrence Berkeley Laboratory Report No. 24593; Lawrence Berkeley: Davis, CA, USA, 1988. [Google Scholar]
© 2015 by the authors; licensee MDPI, Basel, Switzerland. This article is an open access article distributed under the terms and conditions of the Creative Commons Attribution license (http://creativecommons.org/licenses/by/4.0/).
Share and Cite
Alavipanah, S.; Wegmann, M.; Qureshi, S.; Weng, Q.; Koellner, T. The Role of Vegetation in Mitigating Urban Land Surface Temperatures: A Case Study of Munich, Germany during the Warm Season. Sustainability 2015, 7, 4689-4706. https://doi.org/10.3390/su7044689
Alavipanah S, Wegmann M, Qureshi S, Weng Q, Koellner T. The Role of Vegetation in Mitigating Urban Land Surface Temperatures: A Case Study of Munich, Germany during the Warm Season. Sustainability. 2015; 7(4):4689-4706. https://doi.org/10.3390/su7044689
Chicago/Turabian StyleAlavipanah, Sadroddin, Martin Wegmann, Salman Qureshi, Qihao Weng, and Thomas Koellner. 2015. "The Role of Vegetation in Mitigating Urban Land Surface Temperatures: A Case Study of Munich, Germany during the Warm Season" Sustainability 7, no. 4: 4689-4706. https://doi.org/10.3390/su7044689