1. Introduction
Over the last decades, society’s concern for the environment has increased and changes in legislation of this matter have occurred. Examples of these changes are the European Directive 2012/19/EU, which deals with the waste of electrical and electronic equipment [
1], the Ecodesign Directive [
2] that establishes design requirements for energy-related and energy-using products, or the REACH regulation, the aim of which is to ensure human health and environmental protection by controlling the use of chemicals [
3]. Also specific environmental tools and methodologies have been developed in the last two decades, like the Life Cycle Assessment (LCA), that allows researchers to determine the environmental impact of different products [
4,
5] or processes [
6,
7]. In order to apply this tool, a Life Cycle Inventory (LCI) has to be carried out. In this inventory, all the aspects that must be considered in a LCA calculation will be collected [
8,
9]. To make this task easier, Life Cycle Inventory and environmental impact databases have been created. These databases characterize datasets and their environmental burden. Among the different existent databases, EcoInvent is the most recognized worldwide, with more than 4000 users and including more than 10,000 materials and processes [
10]. Also it is integrated in the software SimaPro, which is the world's leading LCA software [
11].
The main goal of applying the LCA to a product or a process is to identify the elements that create the most relevant environmental impacts in order to know which elements could be optimized to reduce these impacts [
12].
A profound and detailed analysis is needed to calculate the environmental impact of a product or a process. Raw materials consumption, manufacturing processes, distribution, use phase and end-of-life have to be taken into account. LCI databases are used by researchers to perform this task. The collection of real material or energy consumption at machine or process level can be difficult in many cases. Sometimes only data at factory level are available. Research studies like the one developed in the CO2PE!-Initiative [
13,
14,
15,
16,
17] try to analyze and solve these problems.
Injection molding is one of the plastic manufacturing processes characterized by EcoInvent. This manufacturing process is one of the most commonly used for thermoplastic polymers; therefore, it has economic relevance as global plastics production was 288 million tons in 2012 [
18].
Injection molding cycle starts with melting a polymer resin in the injection unit of the injection machine. This is achieved thanks to the heaters and also by means of a rotating screw. The volume of polymer that is going to be injected is called the shot, and when it is ready, it is injected into a cavity which has the negative form of the part that is going to be produced. An injection machine has to provide enough clamping force in order to avoid the plastic from flowing out of the mold, which would cause imperfections in the injected component. The part is ejected once it has solidified and has reached an appropriate temperature thanks to the cooling equipment.
In this paper the injection molding process is studied, analyzing how it is characterized by the most relevant commercial LCI database, EcoInvent. An environmental impact sensitivity analysis has been performed, modifying EcoInvent dataset’s values, that use measurements from PVC, PP and PET injection processes. Environmental impact results are calculated with the ReCiPe Endpoint (H/A) methodology [
19,
20], an endpoint approach that assigns a single value to the harm caused to the environment. This endpoint approach is especially useful to allow engineers and designers to compare different alternatives. This indicator has been the one selected for this study because, although there has been no consensus in the literature about the convenience to use an endpoint approach, as pointed out by Hong Dong and Thomas, when a final result is needed, a methodology like ReCiPe is strongly recommended [
21]. SimaPro 8.0.2 [
11] and EcoInvent v3 database have been used to perform the calculations shown in this paper.
2. Methods
In order to analyze the injection molding process, first of all, Ecoinvent’s characterization has been studied, analyzing its documentation and comparing it with the final dataset in order to establish a connection between it and the original report that was used by EcoInvent [
22] to create the dataset (Injection molding {RER}| processing|Alloc Def, U). This analysis is critical to further performing a sensitivity analysis, as it allow us to know how the original data has been adapted by Ecoinvent.
The following summarized table (
Table 1), shows the main inventory elements used by Ecoinvent to analyze the environmental impact of the processing of 1 kg of injected plastic. These are based on two original reports of the processing of three different types of plastic: PVC, PP and PET [
23,
24] and how EcoInvent has adapted these values to create its own average dataset. The final values used in Ecoinvent’s dataset are the arithmetic mean of those three different measurements.
Table 1.
One-kilogram injection molding process’s inventory (Summarized, [
22]).
Table 1.
One-kilogram injection molding process’s inventory (Summarized, [22]).
| Per kg Output | | APME Report | BUWAL Report | EcoInvent Dataset | |
|---|
| | Unit | PVC | PP | PET | Arithmetic mean | EcoInvent v3.0.1. dataset selection |
| INPUT |
| Materials |
| Lubricants | kg | 0.0068 | | | 0.0023 | Lubricating oil {GLO}| market for|Alloc Def, U |
| Lubricating oil | MJ | 0.0948 | | | 0.0316 |
| Grease | MJ | | 0.0007 | | 0.0002 |
| Solvents | kg | 0.1349 | | | 0.0450 | Solvent, organic {GLO}| market for|Alloc Def, U |
| Filler | kg | 0.0227 | | | 0.0076 | Kaolin {GLO}| market for|Alloc Def, U |
| Malusil {GLO}| market for|Alloc Def, U |
| Lime {GLO}| market for|Alloc Def, U |
| Packaging materials |
| Wooden Pallets | kg | 0.0461 | 0.05 | | 0.0320 | EUR-flat pallet {GLO}| market for|Alloc Def, U |
| Pallets | kg | 0.0005 | | | 0.0002 |
| Energy |
| Electricity | kWh | 1.3746 | 2.096 | 1 | 1.4902 | Electricity, medium voltage market for|Alloc Def, U |
| Natural gas | MJ | | 12.6982 | | 4.2327 | Heat, district or industrial, natural gas|market for heat, district or industrial, natural gas|Alloc Def, |
| OUTPUT |
| Waste |
| Regulated Waste | kg | 1.00 × 10⁻⁴ | | | 3.3333 × 10⁻⁵ | Hazardous waste, for underground deposit {GLO}| market for|Alloc Def, U |
Some of the key inventory assumptions made by Ecoinvent are explained in the following paragraphs.
Energy inputs such as natural gas for the plant heating or the consumption of electricity for the machine, are considered in the inventory. Fuels like butane, propane and gasoline, related to internal transports in the plant, are omitted. Elements such solvents, stabilizers, pigments (44% Kaolin, 6% of Malusil (talc) and 50% Lime [
25]), fillers or hazardous waste, that are only related to PVC processing are included in the final (average) Ecoinvent dataset, thus influencing all the environmental impact calculations of polymers that do not need these inventory elements for their processing.
The LCI also includes the cooling water used during the process and the wooden pallets used to transport the injected product. Ecoinvent also adds to the dataset an estimation of the infrastructure of the factory.
Considering all the explanations above, several LCIs will be developed, modifying the dataset values, in order to create new scenarios that allow us to perform a sensitivity analysis, and compare them with the generic EcoInvent dataset. These scenarios are based on APME and BUWAL reports for PVC, PP and PET processing [
23,
24], an updated APME report [
26], which analyses PP injection and provides new electricity consumption data for this polymer, and finally a scenario named EcoI3M, which is based on Ecoinvent’s dataset, but does not consider in the inventory all the specific aspects of PVC processing. These cases will be addressed in this paper as:
Next table (
Table 2) shows the main inventory values considered for each scenario.
Table 2.
Inventory values used for calculation.
Table 2.
Inventory values used for calculation.
| Units | EcoInvent v3 | PVC | PP | PET | PP '10 | EcoI3M |
|---|
| Electricity | kWh | 1.480 | 1.375 | 2.096 | 1 | 0.799 | 1.480 |
| Heating | MJ | 4.439 | 0.347 | 13.043 | - | 13.043 | 4.439 |
| Lubricant oil | kg | 3.03 × 10⁻³ | 9.06 × 10⁻³ | 1.67 × 10⁻⁵ | - | 1.67 × 10⁻⁵ | 5.56 × 10⁻⁶ |
| PVC’s Additives | kg | 0.059 | 0.174 | - | - | - | - |
| Packaging materials | kg | 0.037 | 0.056 | 0.056 | - | 0.056 | 0.037 |
| Waste | kg | −0.007 | −0.010 | −0.005 | −0.005 | −0.005 | −0.006 |
3. Results and Discussion
In this section, after defining the LCI of EcoIvent’s dataset, and our new scenarios, some results will be shown in order to understand how these inventory differences modify the environmental impact of the process.
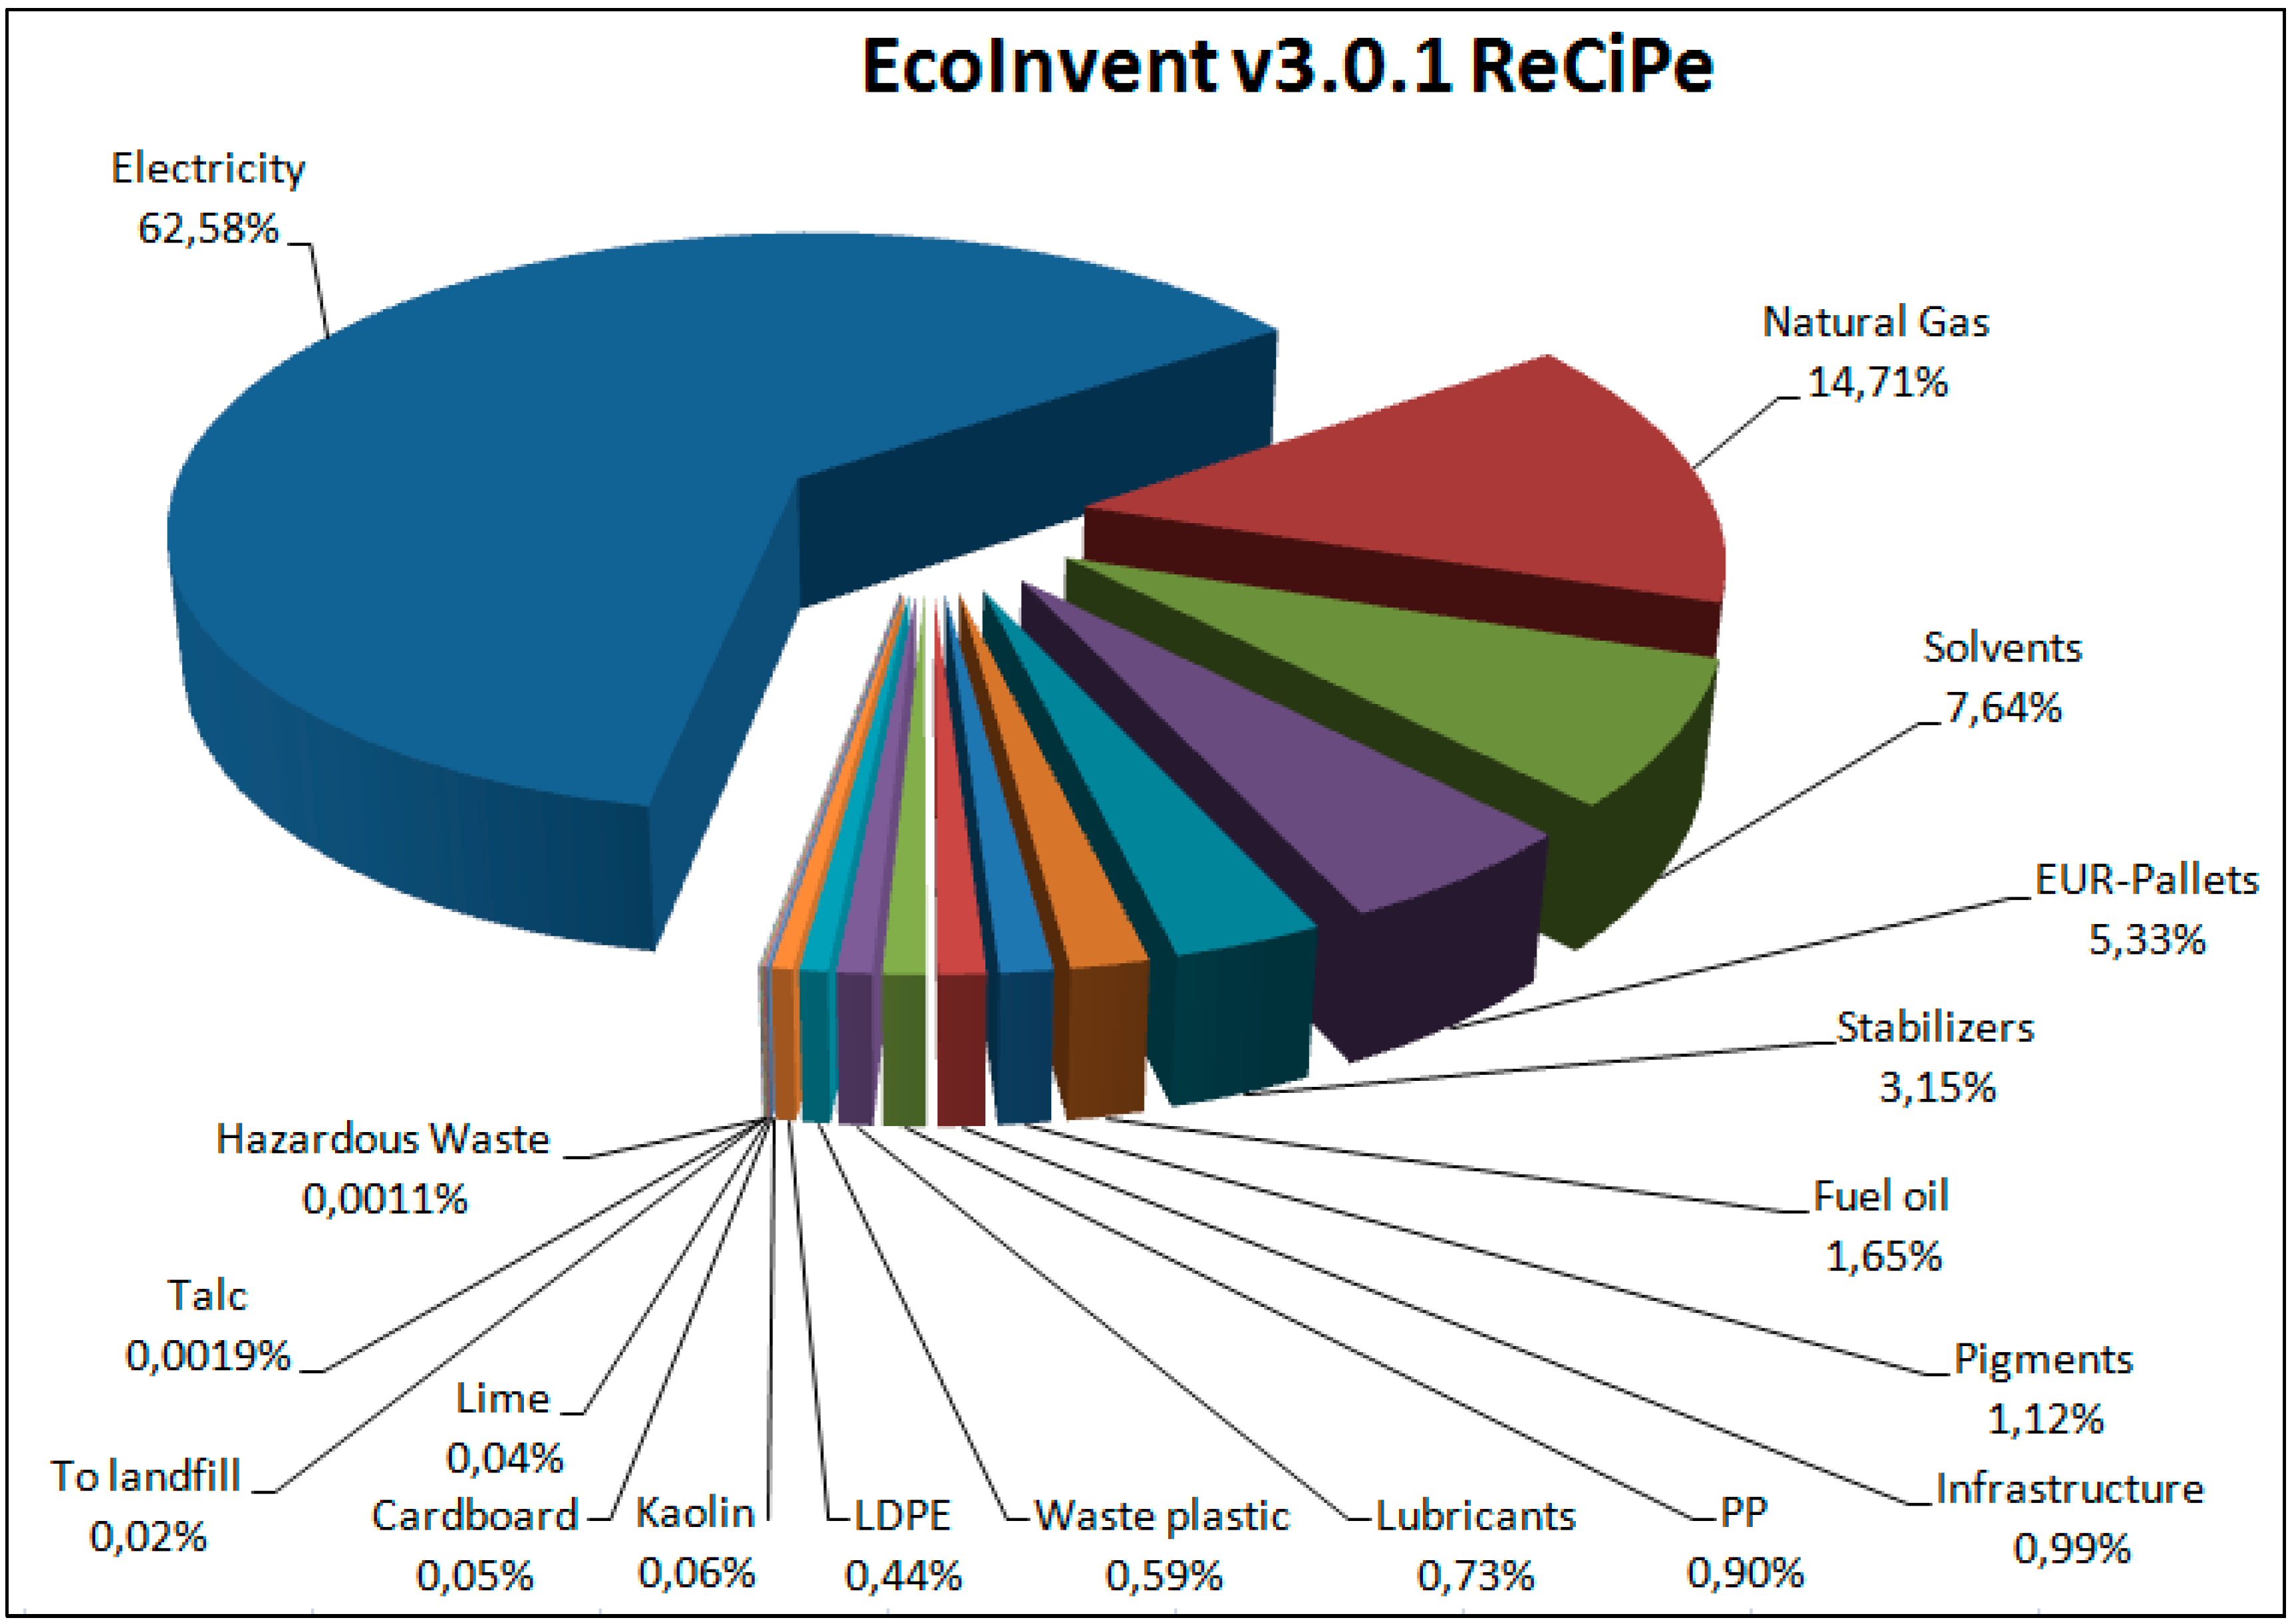
Figure 1 shows how the environmental impact under ReCiPe methodology is created for Ecoinvent’s “Injection moulding {RER}| processing|Alloc Def, U” dataset. Electricity consumption creates most of the environmental impact (62.6%). Natural gas and other fuels used for heating of the plant create around 16% of the overall impact, whilst all the used packaging materials generate 7% of the impact. The consumption of different types of additives (lubricants, solvents, stabilizers, pigments and fillers such as kaolin, lime and malusil) represents almost 13% of the result.
Figure 1.
EcoInvent v3 results, ReCiPe methodology.
Figure 1.
EcoInvent v3 results, ReCiPe methodology.
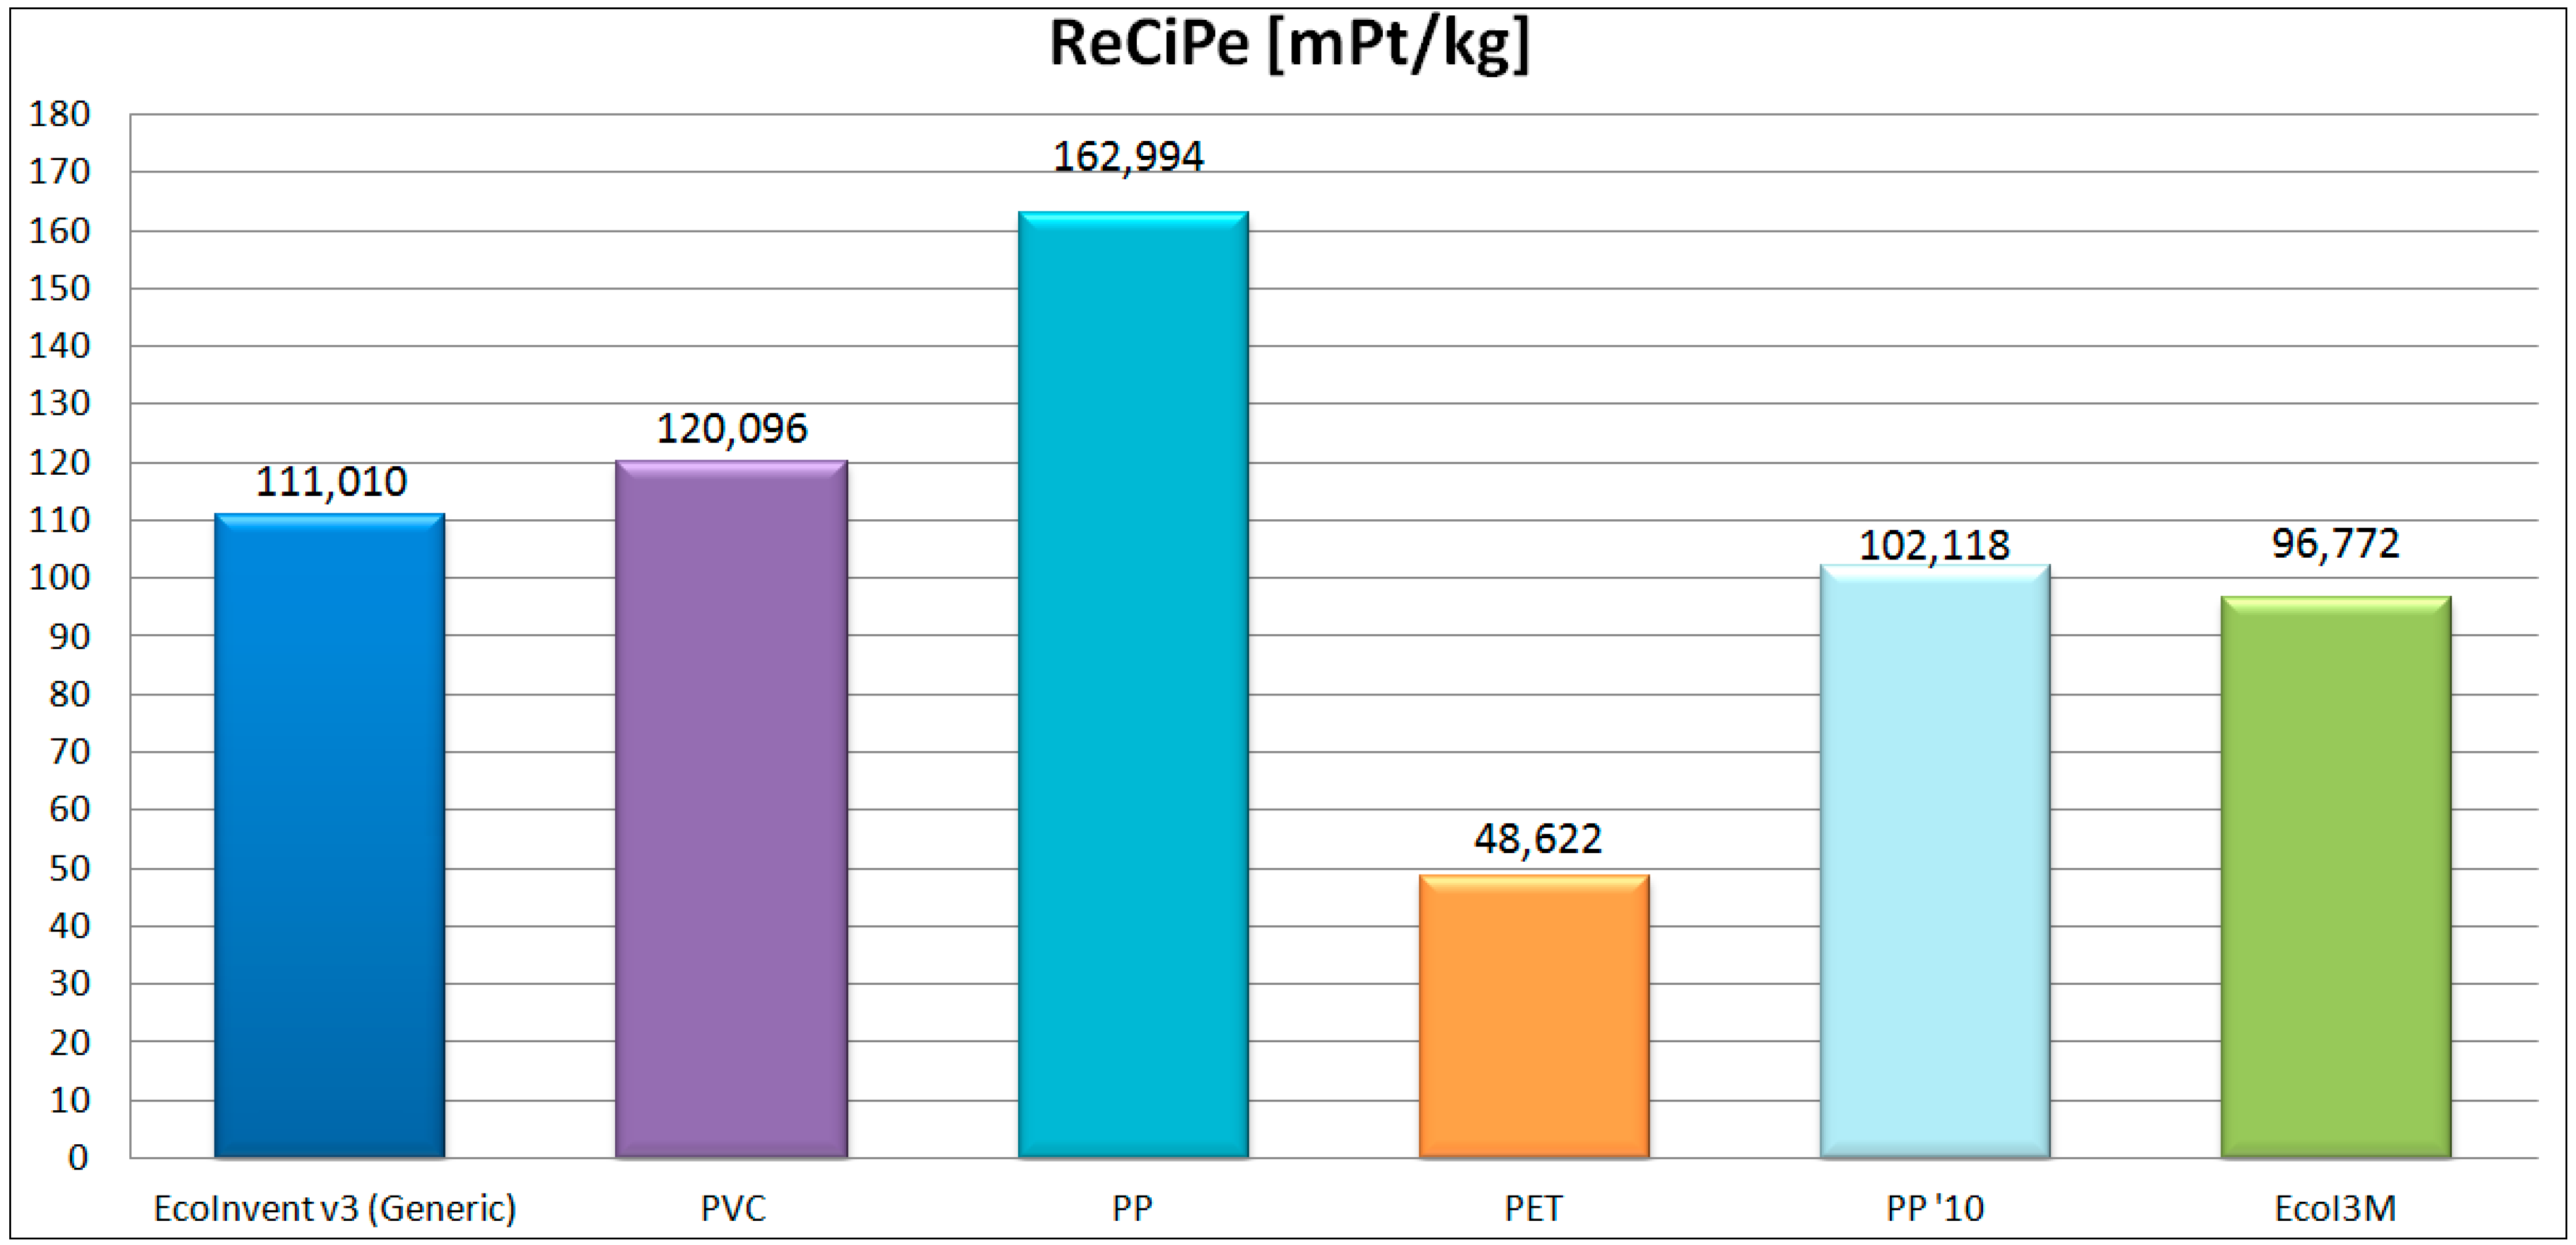
Figure 2 shows a comparison of the environmental impact for Ecoinvent's dataset and all the previously proposed scenarios. The environmental impact of the PVC processing scenario is about 8% higher than the results of the EcoInvent average dataset. The PP case is the one that has the greater environmental impact (162.99 mPt/kg) due to a higher value of energy consumption, with an impact 46.83% bigger than EcoInvent. When modifying the value of the electricity consumption for a more recent measurement (PP '10 scenario), such as the one registered in [
26], 0.7922 kWh/kg, the environmental impact of the process is reduced to 102 mPt/kg, 8% lower than the EcoInvent v3 case. The most relevant variation when comparing with Ecoinvent (−56.2%), is the one achieved by the PET processing, whose LCI inventory is not as complete as the one considered in other polymers. Finally, the scenario EcoI3M shows an impact 14.24 mPt/kg lower than Ecoinvent’s due to the removal from the inventory of the specific additives of the PVC processing.
Table 3 shows how the environmental impact of each scenario is created, dividing it in the main groups of the LCI. Electricity consumption is the main factor, creating between 36.7% and 96.6% of the environmental impact. In PET processing it achieves a 96.55% due to a simplified LCI data.
The heating contribution represents a relevant percentage in the generic case of EcoInvent v3 (16.36%). However, this is caused by PP’s data, as neither the PVC nor the PET have natural gas heating in their LCI data.
Figure 2.
Environmental impact results for the injection molding process, ReCiPe EndPoint (H/A).
Figure 2.
Environmental impact results for the injection molding process, ReCiPe EndPoint (H/A).
Table 3.
Percentage distribution of environmental impact in the injection process.
Table 3.
Percentage distribution of environmental impact in the injection process.
| EcoInvent v3 | PVC | PP | PET | PP ’10 | EcoI3M |
|---|
| Electricity | 62.58% | 53.73% | 60.37% | 96.55% | 36.74% | 71.79% |
| Heating | 16.36% | 2.31% | 31.90% | - | 50.92% | 18.76% |
| Lubricant oil | 0.73% | 2.02% | 0.003% | - | 0.004% | 0.002% |
| PVC’s additives | 12.01% | 30.79% | - | - | - | - |
| Packaging materials | 6.71% | 9.48% | 6.70% | - | 10.69% | 7.63% |
| Waste | 0.62% | 0.75% | 0.36% | 1.20% | 0.57% | 0.68% |
| Infrastructure | 0.99% | 0.91% | 0.67% | 2.26% | 1.07% | 1.13% |
PVC’s additives create around 12% of the environmental impact in Ecoinvent’s dataset (31% in PVC scenario), but are not present in the other scenarios. Packaging materials create between 6.7% and 10.7% of the environmental impact.
Finally, the contributions of waste and infrastructure are low (<2.5%) for every studied scenario.
4. Conclusions
This study has shown how the environmental impact results for the injection molding process vary when modifying some of the main Life Cycle Inventory values, obtaining a great difference between different reports. Electricity’s contribution to the environmental impact of the process varies between 37.5–87.6 mPt/kg in all the studied scenarios.
These results have revealed how the specific PVC's additives contribute to increase the final results of EcoInvent’s dataset in +14.24 mPt/kg. Analyzing the three plastics studied in the report, the PP scenario has the higher impact due to its higher energy consumption (2.096 kWh/kg), as electricity consumption is the most relevant factor in the final results.
All these considerations imply that a deeper study is needed to assess correctly the environmental performance of a specific injection process in order to propose actions that will achieve a more sustainable development in the industry. The study of how the LCI databases characterizes this type of manufacturing processes can prevent double counting in LCA analysis, since, for example, the facility heating could be considered twice without noticing it.
In summary, the results presented in this paper indicate the necessity of measuring real processes because of the high variability in the LCI data, as its influence has been demonstrated in the results of environmental impact of a widely used manufacturing process.
Acknowledgments
The authors would like to thank the Editor and Reviewers for their valuable comments and suggestions.
Author Contributions
Ana Elduque is a Ph.D. student who reviewed the state of the art, processed the data and made the calculations with the environmental impact assessment software SimaPro also in collaboration with Daniel Elduque, a researcher in the field of environmental impact. Carlos Javierre which is the director of the doctoral thesis, carried out the first draft version of the manuscript. Ángel Fernández helped with the analysis of the results and its conclusions. All of the authors have contributed to the writing and correction of this article and they all agree to its final version.
Conflicts of Interest
The authors declare no conflict of interest.
References
- European Parliament. Directive 2012/19/EU of the European Parliament and of the Council of 4 July 2012 on Waste Electrical and Electronic Equipment (WEEE); Official Journal of the European Union, EU Publications Office: Luxembourg, 2012. [Google Scholar]
- European Parliament and the Council. Directive 2009/125/EC of the European Parliament and of the Council of 21 October 2009 Establishing a Framework for the Setting of Ecodesign Requirements for Energy-Related Products (Recast); Official Journal of the European Union, EU Publications Office: Brussels, Belgium, 2009. [Google Scholar]
- European Parliament and the Council. Regulation (EC) N° 1907/2006 of the European Parliament and of the Council of 18 December 2006 Concerning the Registration, Evaluation, Authorisation and Restriction of Chemicals (REACH); Official Journal of the European Union: Brussels, Belgium, 2006. [Google Scholar]
- Elduque, D.; Javierre, C.; Pina, C.; Martínez, E.; Jiménez, E. Life cycle assesment of a domestic induction hob: Electronic boards. J. Clean. Prod. 2014, 76, 74–84. [Google Scholar] [CrossRef]
- Martínez, E.; Blanco, J.; Jiménez, E.; Saenz-Díez, J.; Sanz, F. Comparative evaluation of life cycle impact assessment software tools through a wind turbine case study. Renew. Energy 2015, 74, 237–246. [Google Scholar] [CrossRef]
- Tangsubkul, N.; Beavis, P.; Moore, S.; Lundie, S.; Waite, T. Life Cycle Assessment of Water Recycling Technology. Water Resour. Manag. 2005, 19, 521–537. [Google Scholar] [CrossRef]
- Modahl, I.S.; Askham, C.; Lyng, K.-A.; Brekke, A. Weighting of environmental trade-offs in CCS—an LCA case study of electricity from a fossil gas power plant with post-combustion CO2 capture, transport and storage. Int. J. Life Cycle Assess. 2012, 17, 932–943. [Google Scholar] [CrossRef]
- International Standard Organization. ISO 14040:2006 Environmental Management-Life Cycle Assesment-Principles and Framework; International Standard Organization: Geneva, Switzerland, 2006. [Google Scholar]
- International Standard Organization. ISO 14044:2006 Environmental Management-Life Cycle Assessment-Requirements and Guidelines; International Standard Organization: Geneva, Switzerland, 2006. [Google Scholar]
- Making a difference, Ecoinvent’s global influence. Available online: http://www.ecoinvent.ch/ (accessed on 23 September 2014).
- Goedkoop, M.; Oele, M.; Leijting, J.; Ponsioen, T.; Meijer, E. SimaPro 8. Introduction to LCA with SimaPro; PRé: Amersfoort, The Netherlands, 2013. [Google Scholar]
- Guinée, J. Handbook on Life Cycle Assessment: Operational Guide to the ISO Standards; Kluwer Academic Publishers: Leiden, Netherlands, 2002. [Google Scholar]
- Kellens, K.; Dewulf, W.; Overcash, M.; Hauschild, M.Z.; Duflou, J.R. Methodology for systematic analysis and improvement of manufacturing unit process life-cycle inventory (UPLCI)—CO2PE! initiative (cooperative effort on process emissions in manufacturing). Part 1: Methodology description. Int. J. Life Cycle Assess 2012, 17, 69–78. [Google Scholar]
- Kellens, K.; Dewulf, W.; Overcash, M.; Hauschild, M.Z.; Duflou, J.R. Methodology for systematic analysis and improvement of manufacturing unit process life cycle inventory (UPLCI) CO2PE! initiative (cooperative effort on process emissions in manufacturing). Part 2: case studies. Int. J. Life Cycle Assess. 2012, 17, 242–251. [Google Scholar]
- Kellens, K.; Dewulf, W.; Lauwers, B.; Kruth, J.; Duflou, J. Environmental Impact Reduction in Discrete Manufacturing: Examples for Non-Conventional Processes. Procedia CIRP 2013, 6, 27–34. [Google Scholar] [CrossRef]
- Duflou, J.R.; Kellens, K.; Renaldi, R.; Guo, Y.; Dewulf, W. Critical comparison of methods to determine the energy input for discrete manufacturing processes. CIRP Ann.-Manuf. Technol. 2012, 61, 63–66. [Google Scholar] [CrossRef]
- Duflou, J.R.; Sutherland, J.W.; Dornfeld, D.; Herrmann, C.; Jeswiet, J.; Kara, S.; Hauschild, M.; Kellens, K. Towards energy and resource efficient manufacturing: A processes and systems approach. CIRP Ann.-Manuf. Technol. 2012, 61, 587–609. [Google Scholar] [CrossRef]
- PlasticsEurope. Plastics- the facts 2013, An analysis of European latest plastics production, demand and waste data. 2013. Available online: http://www.plasticseurope.org/documents/document/20131014095824-final_plastics_the_facts_2013_published_october2013.pdf (accessed on 20 March 2015).
- Goedkoop, M.; Oele, M.; de Schryver, A.; Vieira, M. SimaPro 7 Database Manual. Methods Library; PRé: Amersfoort, The Netherlands, 2010. [Google Scholar]
- Goedkoop, M.; Heijungs, R.; Huijbregts, M.; Strujis, J.; van Zelm, R. ReCiPe 2008 A life cycle impact assessment method which comprises harmonised category indicators at the midpoint and the endpoint level, Report I: Characterisation. 2009. Available online: http://www.leidenuniv.nl/cml/ssp/publications/recipe_characterisation.pdf (accessed on 20 March 2015).
- Dong, Y.H.; Thomas, S. Comparing the midpoint and endpoint approaches based. Int. J. Life Cycle Assess. 2014, 19, 1409–1423. [Google Scholar] [CrossRef]
- Hischier, R. Part II Plastics. Life Cycle Inventories of packaging and Graphical Papers. Ecoinvent-Report No.11; Swiss Centre for Life Cycle Inventories: Dübendorf, Switzerland, 2007. [Google Scholar]
- Boustead, I. Eco-Profiles of the European Plastics Industry. Polymer Conversion. Report 10; PlasticsEurope: Brussels, Belgium, 1997. [Google Scholar]
- Habersatter, K.; Fecker, I.; Dall’Acqua, S.; Fawer, M.; Fallscheer, F.; Förster, R.; Maillefer, C.; Ménard, M.; Reusser, L.; Som, C.; et al. Ökoinventare für Verpackungen; BUWAL Schriftenreihe Umwelt Nr 250; Bern Bundesamt für Umwelt, Wald und Landschaft (BUWAL): Bern, Switzerland, 1998. [Google Scholar]
- Hischier, R. Part III Plastics. Life Cycle Inventories of packaging and Graphical Papers. Ecoinvent-Report No.11; Swiss Centre for Life Cycle Inventories: Dübendorf, Switzerland, 2007. [Google Scholar]
- Plastics Europe. Eco-profiles of the European Plastics Industry. Injection Moulding of PVC, HDPE and PP; Plastics Europe: Brussels, Belgium, 2010. [Google Scholar]
© 2015 by the authors; licensee MDPI, Basel, Switzerland. This article is an open access article distributed under the terms and conditions of the Creative Commons Attribution license (http://creativecommons.org/licenses/by/4.0/).


