Article

Modeling Thermal Comfort and Optimizing Local Renewal Strategies—A Case Study of Dazhimen Neighborhood in Wuhan City

1
School of Architecture and Urban Planning, Huazhong University of Science and Technology, Wuhan 430074, China
2
School of Energy and Power Engineering, Huazhong University of Science and Technology, Wuhan 430074, China
3
School of Science and the Environment, Manchester Metropolitan University, Chester Street, Manchester M1 5GD, UK
4
Center for ITS & UAV Applications Research, School of Naval Architecture, Ocean & Civil Engineering, Shanghai Jiao Tong University, Shanghai 200240, China
5
Department of Urban and Regional Planning, University of Florida, Gainesville, FL 32607, USA
*
Authors to whom correspondence should be addressed.
Sustainability 2015, 7(3), 3109-3128; https://doi.org/10.3390/su7033109
Submission received: 18 December 2014 / Revised: 20 February 2015 / Accepted: 28 February 2015 / Published: 13 March 2015

Abstract

:
Modeling thermal comfort provides quantitative evidence and parameters for effective and efficient urban planning, design, and building construction particularly in a dense and narrow inner city, which has become one of many concerns for sustainable urban development. This paper aims to develop geometric and mathematical models of wind and thermal comfort and use them to examine the impacts of six small-scale renewal strategies on the wind and thermal environment at pedestrian level in Dazhimen neighborhood, Wuhan, which is a typical case study of urban renewal project in a mega-city. The key parameters such as the solar radiation, natural convection, relative humidity, ambient crosswind have been incorporated into the mathematical models by using user-defined-function (UDF) method. Detailed temperature and velocity distributions under different strategies have been compared for the optimization of local renewal strategies. It is concluded that five rules generated from the simulation results can provide guidance for building demolition and reconstruction in a neighborhood and there is no need of large-scale demolition. Particularly, combining the local demolition and city virescence can both improve the air ventilation and decrease the temperature level in the study area.

1. Introduction

Urban renewal is defined as the process of slum or neighborhood clearance and physical redevelopment at a relatively large scale, considering other socio-economic and cultural elements [1]. A neighborhood is a physical and social environment where people interact with each other and share a collective identity [2], sometimes called community. Increasing the quality of housing and open spaces and reducing human health risks to community has become main concerns of sustainable urban renewal [3,4].
Regarding urban renewal in Chinese cities, which was stimulated by a series of institutional changes after early 1990s [5], a majority of case studies were focused on the social, economic, and political issues, policies, performance criteria at macro scale as well as the processes and effects of urban reconstructions [4,5]. In parallel, the studies of urban microclimate including wind and thermal environments, which contributes to human health risks when being exposed to, have received increasing attention in a number of countries, which can be referred to several overviews given by Mishra and Ramgopal [6], Taleghani et al. [7] and Chen and Ng [8].
Thermal comfort, the condition of mind expressing satisfaction with the thermal environment, depends on environmental and personal factors [7]. The studies of thermal comfort have been examined in a variety of environments, such as an indoor environment [6,9,10], housing blocks [11], outdoor apartment blocks [12], a street canyon [13,14,15], and university campus [16,17,18,19] and Xi et al. [20], city center [21]. Personal factors are more concerned with people’s perception of thermal comfort in outdoor environment collected through surveys [22,23]. All these growing body of case studies indicate the importance of studying wind and thermal comfort environment related to urban microclimate in the areas of urban planning and design and building construction.
Methodologically, there have been two general approaches for determining the thermal comfort: (a) field studies or observational approach [7,24]; and (b) simulation approaches [11,12,25,26]. The main advantage of simulation studies dominated by CFD numerical simulation [9,10,13,14,20,27,28,29,30,31] in thermal comfort is the possibility to perform comparative analyses based on different scenarios [26].
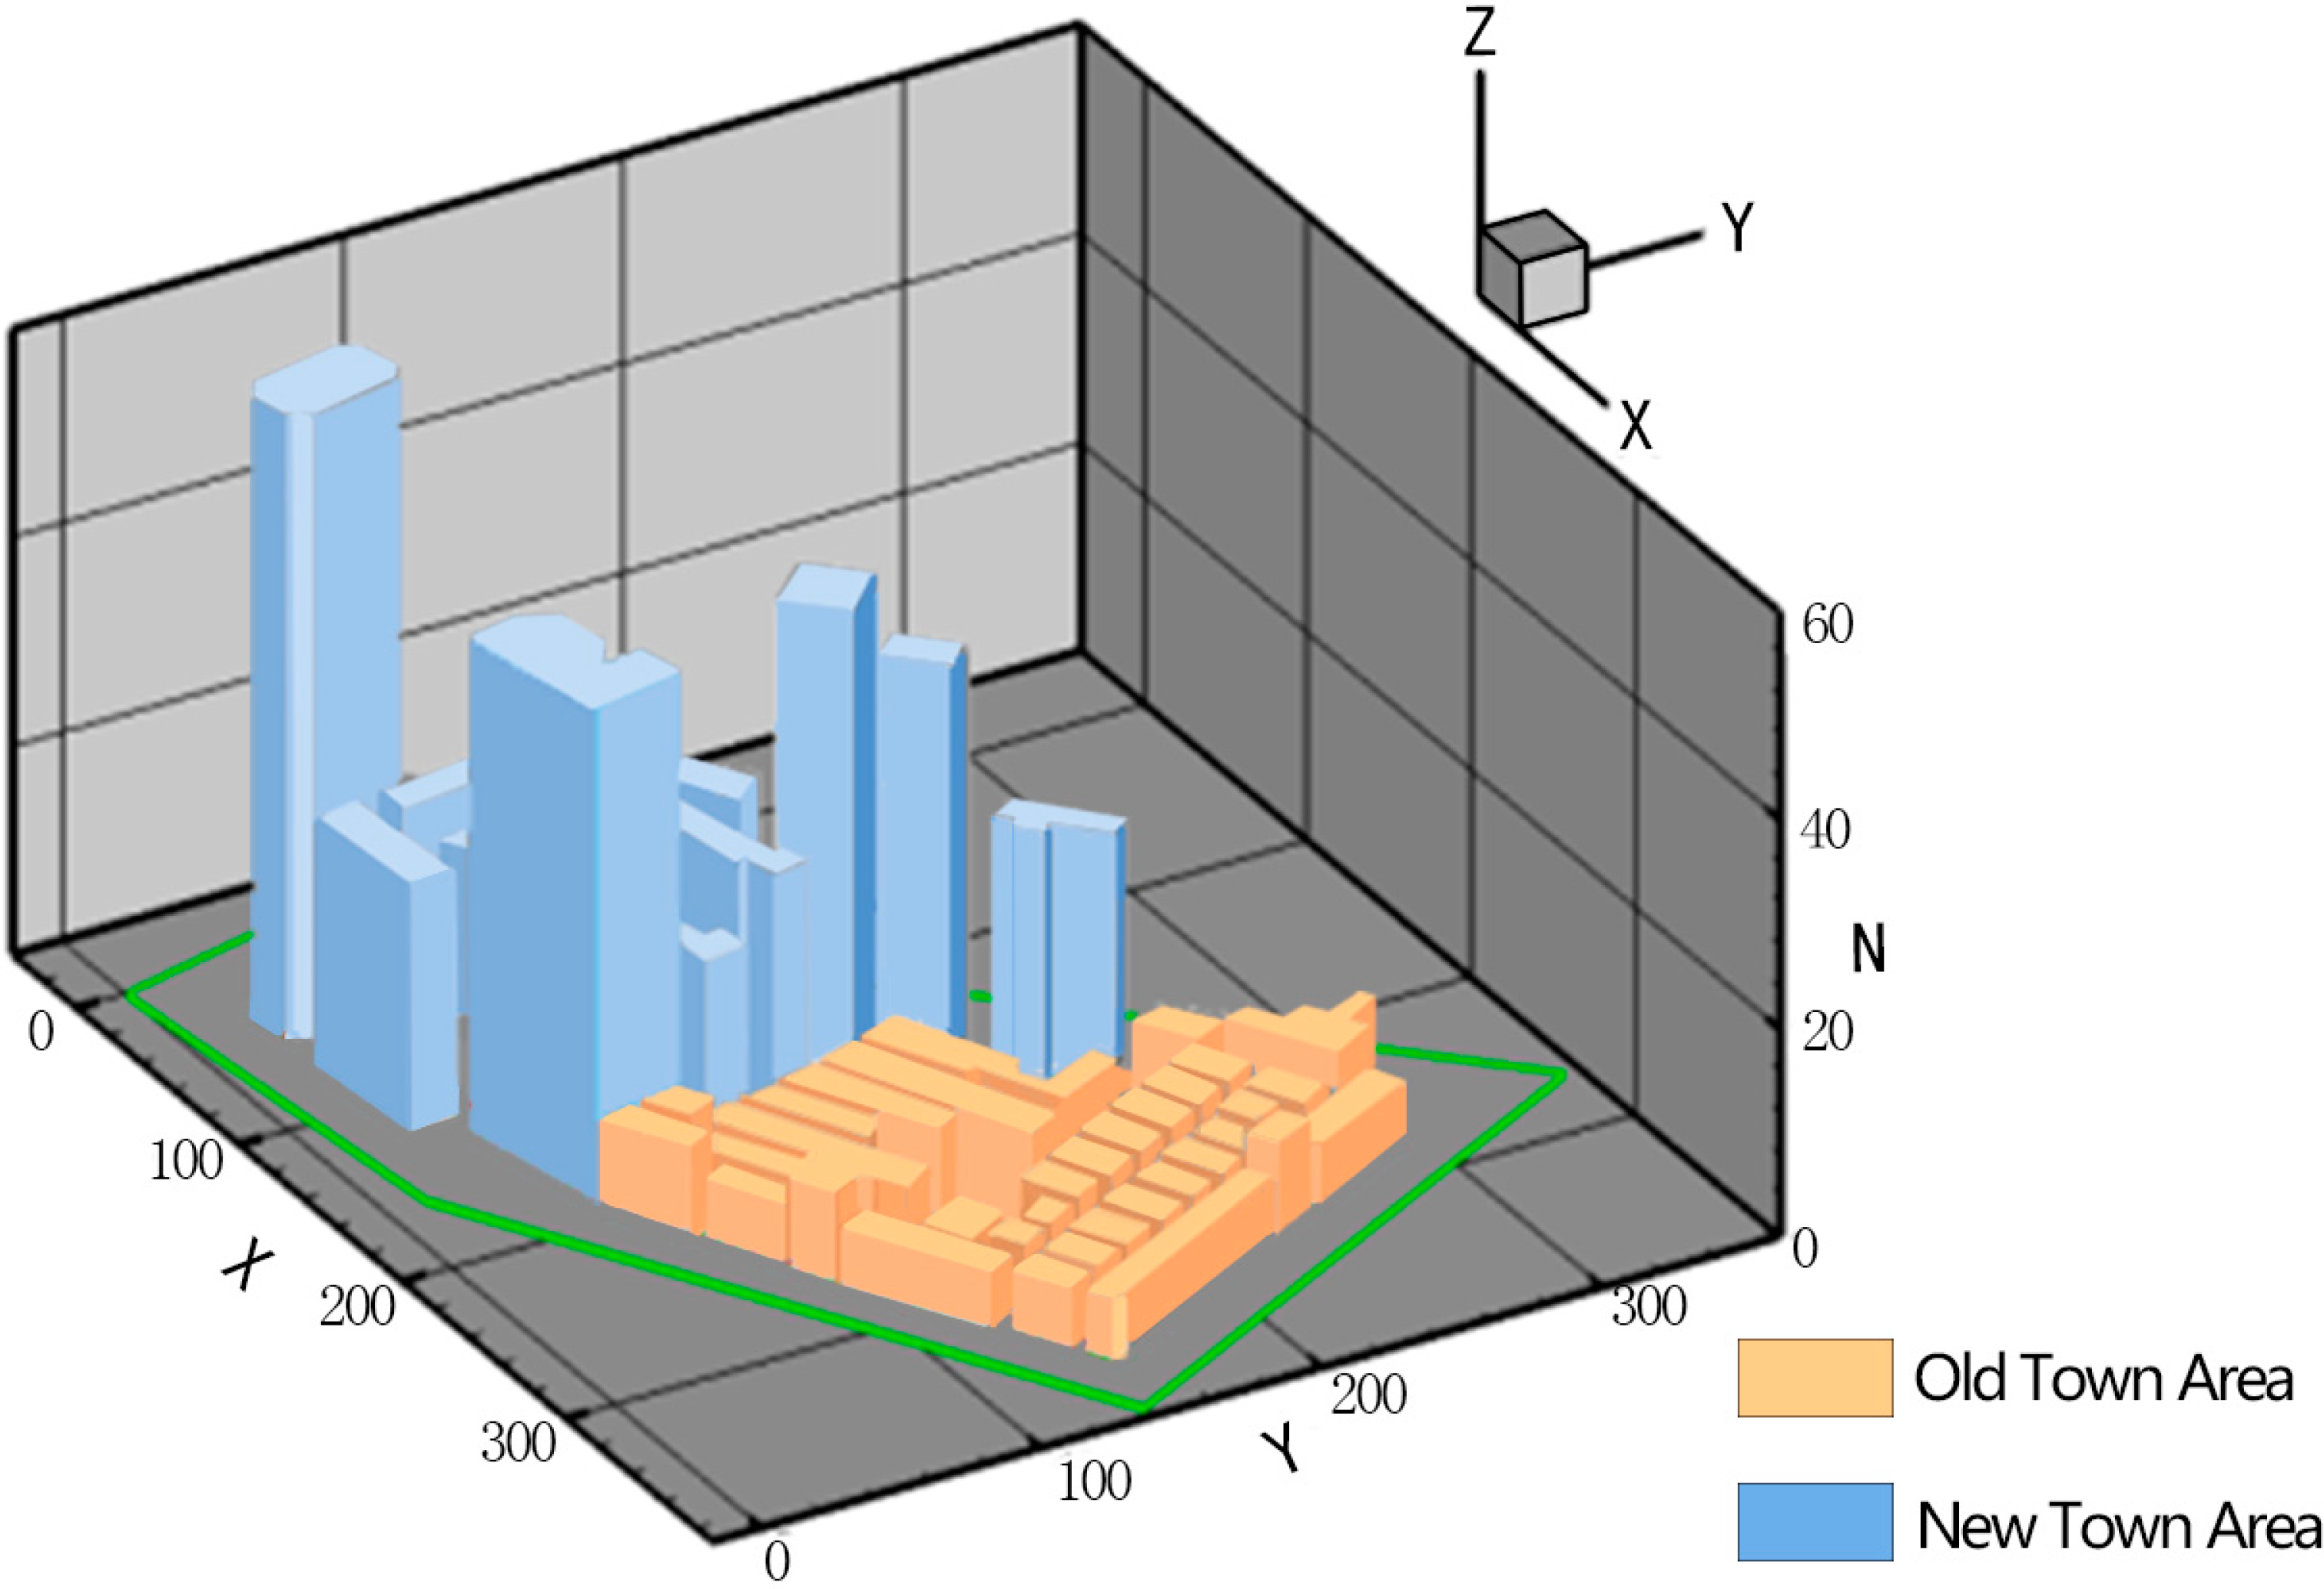
In a neighborhood of Chinese inner city characterized by high-density old buildings, narrow streets and disorderly irregular arrangements, its outdoor environment affecting pedestrian thermal comfort, in particular in hot summer and cold winter, is determined by many physical factors: Solar radiation, shading effect of buildings, ambient crosswind velocity, air humidity, and buoyancy due to air density difference under gravity field. However, a more extensive model considering all these factors has not yet been developed in the literature, particularly the effects of urban renewal strategies on the pedestrian thermal comfort has not been analyzed and examined yet, which has become the focus of this paper.
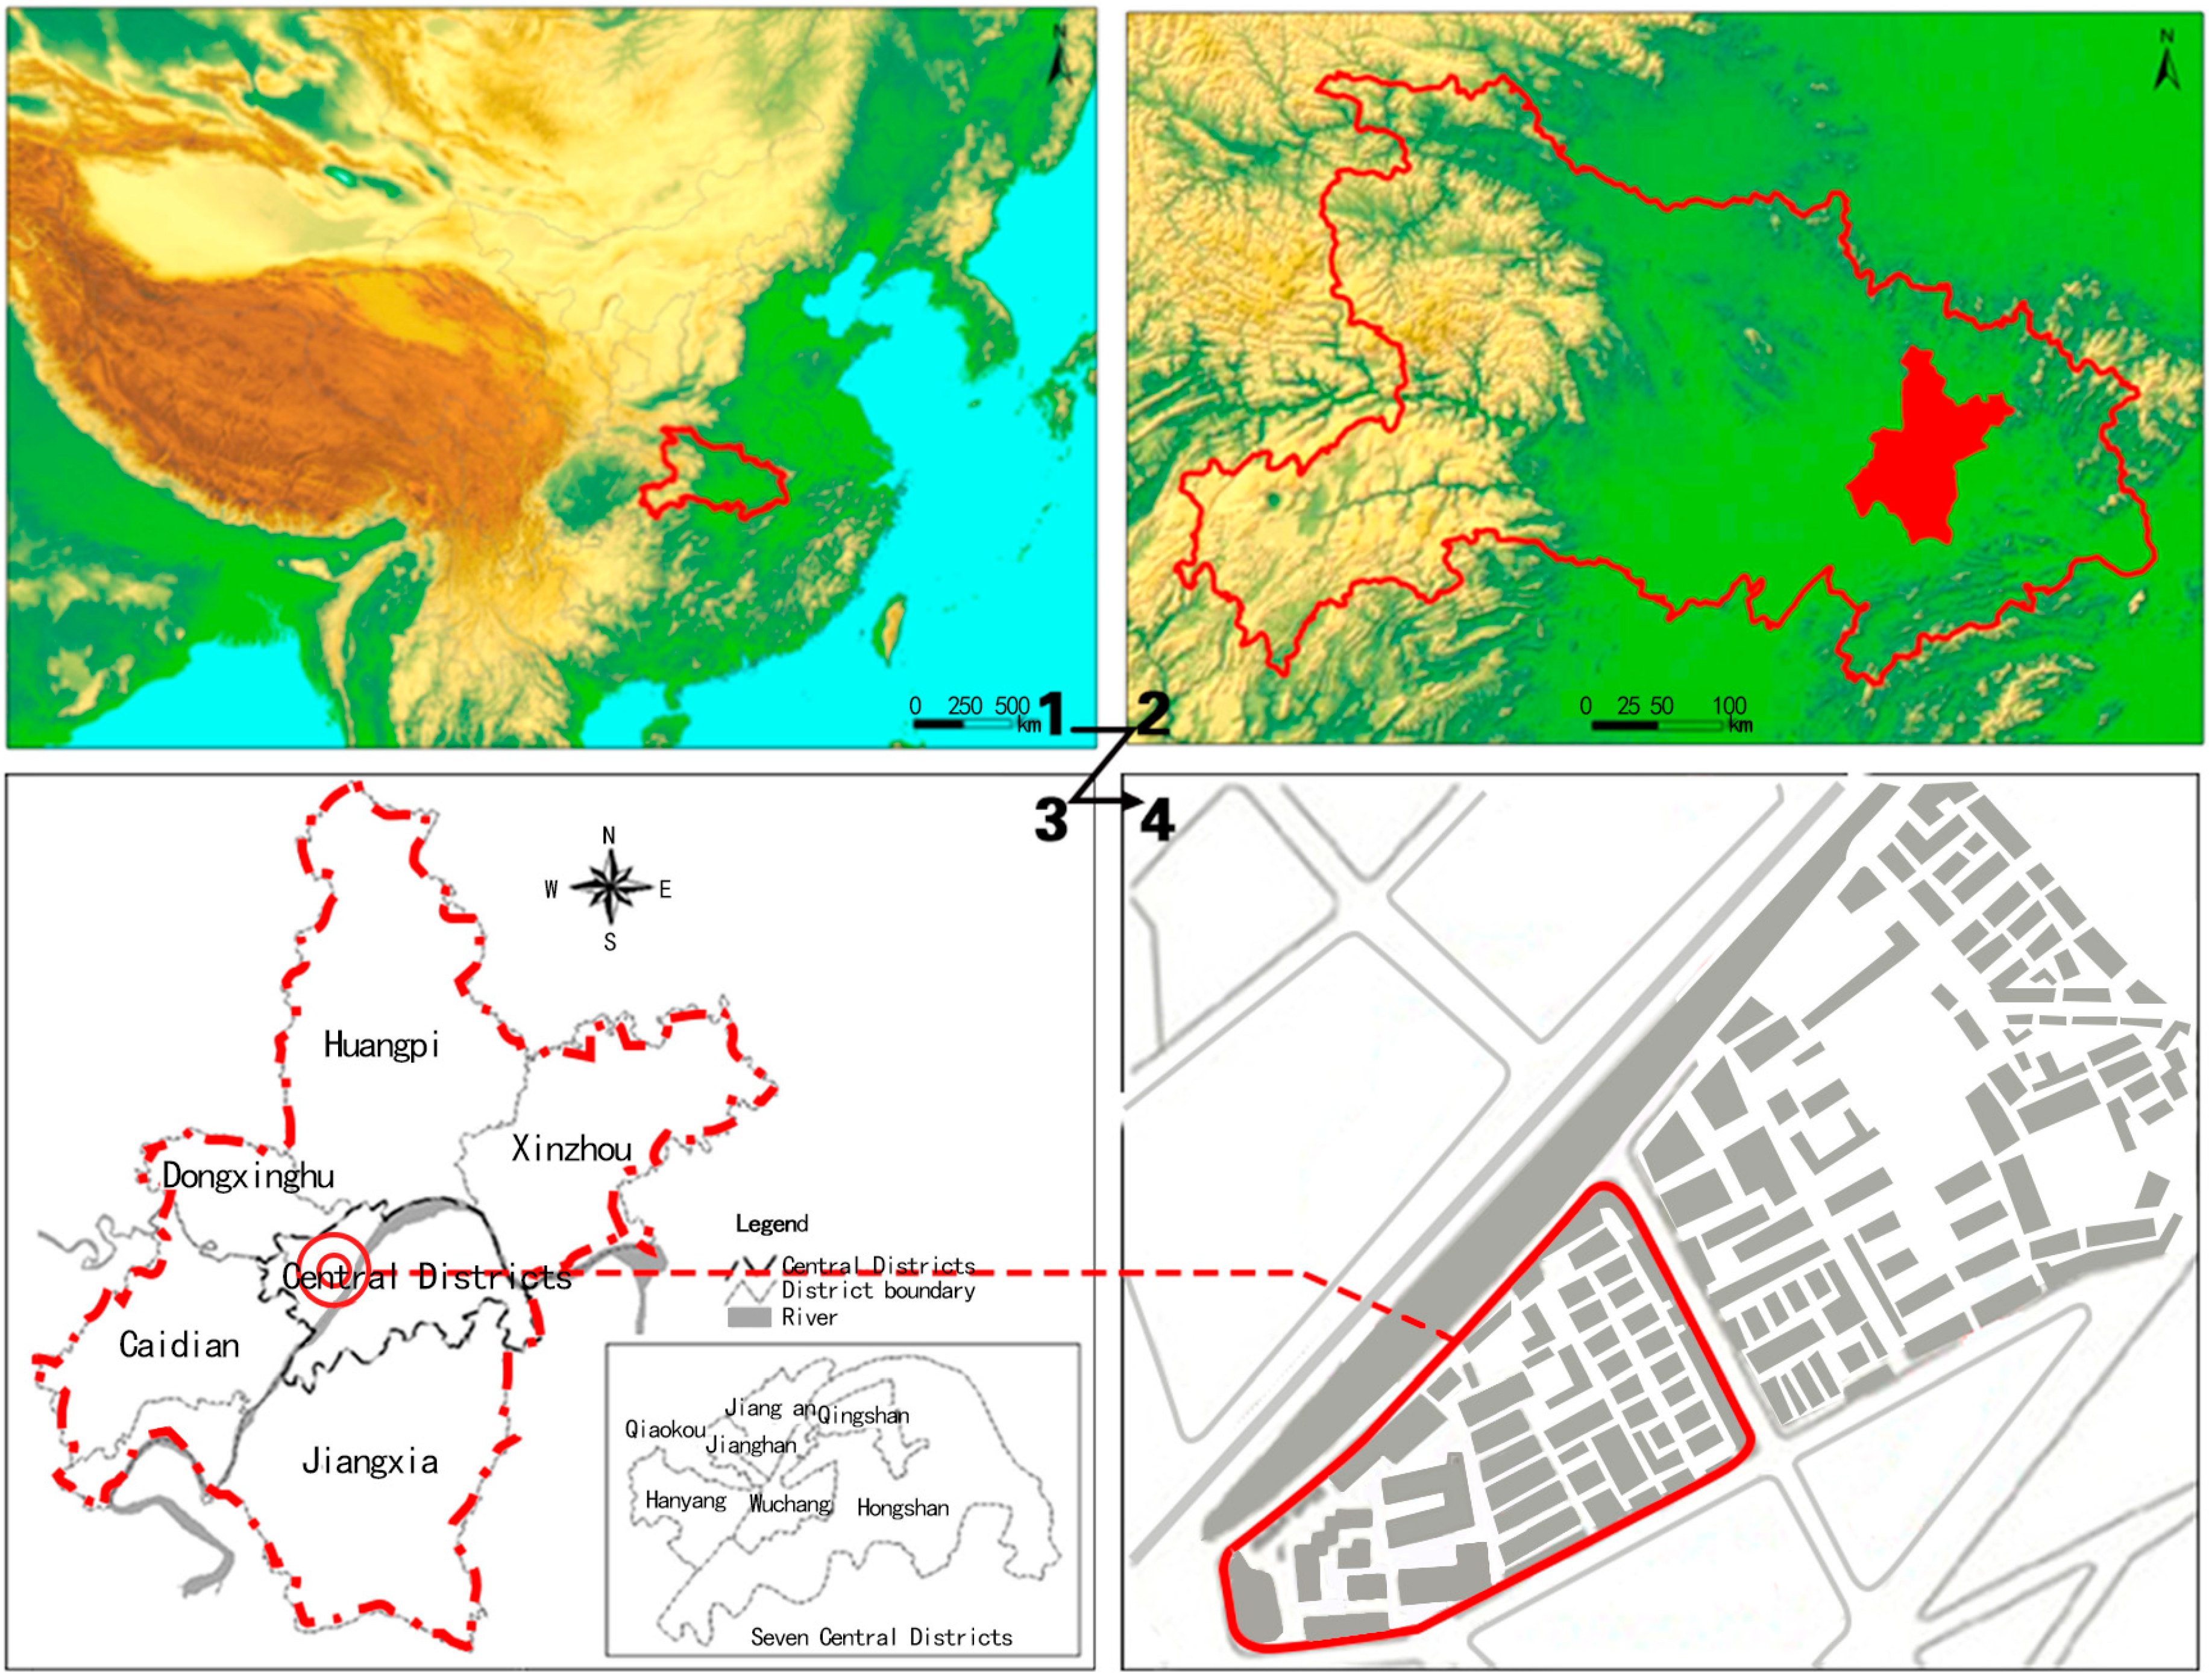
The goal of this paper is to analyze the impacts of different renewal strategies on the wind and thermal environments at the level of local community, taking Dazhimen neighborhood in Wuhan inner city as a case study. CFD numerical simulation methods have been extensively utilized to implement relevant mathematical models of quantifying wind and thermal comfort environment. The numerical simulations are expected to provide quantitative evidence and parameters for effective and efficient urban planning, design and construction. Furthermore, several new rules are proposed to be considered in the process of demolition and reconstruction of inner city urban renewal in order to achieve sustainable urban development.

2. Geometrical and Mathematical Models

2.1. Study Area

Wuhan, the capital of Hubei Province situated in Central China (Figure 1), has a total population of over 10 million and a total area of 8494 km2 in 2013 [32]. Its topography is dominated by relatively flat land between 22 and 27 m above sea level except the hilly areas sporadically distributed in suburban districts. This region is characterized by typical subtropical monsoon climate and well-marked seasons with cold and dry winter, abundant rainfall (e.g., annual average precipitation is 1140–1265 mm), and sunshine in summer. Wuhan has a nickname “Water City” (Jiangcheng in Chinese) as water body, including the largest urban lake—Donghu Lake, occupies a high percentage (>20%) of its territory and because it is located at the middle reaches of Yangtze River, which is the third longest river in the world. Wuhan is physically divided by Yangtze and Hanjiang Rivers into three parts: Wuchang, Hankou, and Hanyang, which are called: Three towns: Historically. Hanjiang River merges into Yangtze River at the center of Wuhan. As a historical city, the buildings in the inner city of Wuhan that occupies approximately 30% area of Hankou and Hanyang are very old and dilapidated, sitting side by side and with very short distances between neighboring buildings as narrow as 2 m. Some of these buildings are even older than 100 years. The building environment characterized by deteriorating living conditions, worsening human thermal comfort, and poor air ventilation conditions has significantly influenced the health and life quality of the residents and pedestrians living and passing by there. Thereby, it becomes imperative to examine the effects of various urban renewal strategies on improving the wind and thermal comfort environment in the inner city.
As shown in Figure 1, the study area—Dazhimen neighborhood, is situated on the east of Jinghan Street and the west of Zhongshan Avenue and Youyi Avenue, connecting to Dazhi Road in its south and Yiyuan Road in its north. The buildings in the neighborhood, with a total floor area of 55,000 m2, have been housed for over one hundred years since the late Qing Dynasty, which are very dense with very narrow streets, wriggling in different directions. Occasionally, the street tunnels are blocked by some buildings, which cause non-circulated airflow. This old city area was selected to analyze the influences of solar radiation and air ventilation on the pedestrian thermal comfort in the outdoor environment of inner city. The basic dimensions of the original layout to be considered in this paper are shown in Figure 2.
Figure 1. Locations of the study area: (1) Hubei Province in China; (2) Wuhan in Hubei Province; (3) The study area in Wuhan; (4) The layout of study area.
Sustainability 07 03109 g001
Figure 2. Computational model of the original layout (Y axis is toward North).
Sustainability 07 03109 g002

2.2. Mathematical Model

The inner city is characterized by complex fluid flow and heat transfer. If the ambient crosswind velocity (ACV) is equal to 0, then the fluid flow will be considered for purely natural convection induced by solar radiation which heats the ground surface and building walls, and results in the increase of air temperature. Rayleigh number is used to measure the intensity of buoyancy-induced flow. The ACV plays a significant role in our investigation as all the buildings are exposed to the ambience, which causes the system to be a combination of natural and forced convection. The natural flow should be vertically upward due to the high-temperature effect of horizontal ground surface; however, the ACV flowing horizontally enhances this heat transfer, and leaves the ground surface at a lower temperature level. The flow regimes can be classified according to the ratio of Gr to Re2, where Gr and Re are Grashof and Reynolds numbers respectively. The preliminary result indicates that Gr is higher than 1010, an upper limit transition value of natural convection from laminar to turbulent flow. Thus, a turbulent mathematical model is utilized to describe fluid flow within the system. Further, the density variation in the entire computational model is frequently neglected in Mass and Energy equations due to a small value, making it necessary to use Boussinesq approximation to avoid large errors. As a result, Mass equation, Navier-Stokes equation, Energy equation, and Realizable k-ε equations can be represented by the following Equations (1)–(5) [33,34].
Mass equation:
ρ t + ( ρ u i ) x i = 0
Navier-Stokes equation:
( ρ u i ) t + ( ρ u i u j ) x j = ρ g i p x i + τ i j x j
Energy equation:
( ρ c p T ) t + ( ρ c p u j T ) x j = x j ( λ T x j ) + τ i j u i x j + β T ( p t + u j p x j )
Equation for the turbulent kinetic energy k:
t ( ρ k ) + x i ( ρ k u i ) = x j [ ( μ + μ t σ k ) k x j ] + G k + G b ρ ε
Equation for the turbulent kinetic energy dissipation rate ε:
t ( ρ ε ) + x j ( ρ ε u j ) = x i [ ( μ + μ t σ ε ) ε x j ] + ρ C 1 S ε ρ C 2 ε 2 k + ν ε + C 1 ε ε k C 3 ε G b + S ε
In the equations above, the variables such as the velocities and temperatures are all time-averaged values, and τij is the stress tensor, Gk denotes the generation of turbulence kinetic energy because of the mean velocity gradient, and G b the generation of turbulence kinetic energy due to buoyancy. μ t is eddy viscosity. C1 is a constant, σT, σk, and σε mean the turbulent Prandtl numbers for T, k, and ε, respectively (σT = 0.9, σk = 1.0, σε = 1.3), and c2 is a constant for turbulent model (c2 = 1.92). All the definitions for these parameters are referred in the literature [33,34]

2.3. The Thermal Properties of Moist Air

As mentioned above, Wuhan is a “water city” with the Yangzi River and Hanjiang River cutting through its center and many large-sized lakes within it. As such, the air is moist with water vapor and its relative humidity is usually very high up to 90% [32]. The moist air makes the city very muggy. Consequently, the influence of water vapor in the air should be considered in a numerical simulation model. To simplify it, the air in the ambient is treated as a mixture of dry air and water vapor, where and its each element behave as ideal gases at the state under the present consideration. The humidity ratio, which is defined as the mass of water vapor to the mass of dry air [35], is represented by Equation (6) as follows:
ω = m v m a = 0.622 ς p s p ς p s
where mv and ma are the masses of the water vapor and the dry air per unit volume of ambient moist air, respectively. ς is the relative humidity; p is the pressure of the ambient moist air; ps is the partial pressure of water vapor under saturated moist air at the same mixture temperature and pressure.
The thermal properties of the moist air, i.e., density, thermal conductivity, viscosity, specific heat capacity, can be all figured out based on the average magnitude of the mixed mass. As a result, the properties shown in the equations throughout this paper are all for the ambient moist air. For example, the specific enthalpy h of moist air can be measured by the following Equation (7):
h = h a + ω h v
where ha and hv are the specific enthalpies of dry air and water vapor respectively. Considering the processes of moist air temperature increase and decrease with the same solar radiation, a lower temperature difference will be obtained as compared to dry air.

2.4. Calculation of Solar Radiation

Solar radiation on the ground surface and all the building surfaces varies with time of a day. Solar radiation (Ic) on an arbitrary tilted surface with a tilt angle of β from the horizontal and an azimuth angle of αw is the sum of beam (Ib,c), sky-diffused (Id,c), and ground-reflected solar radiation (Ir,c). The calculation method has been developed previously by Peng et al. [36].

2.5. Boundary Conditions

When considering the microclimate and pedestrian thermal comfort, determined by ACV, water vapor and solar radiation in the inner city area, the boundary conditions for the system in study should be clearly defined with the following detailed descriptions.

2.5.1. Inlet Boundary

The prevailing winds (Figure 3) of the ambience (ACV) in the study area are generally winds Northeast and Southeast in summer. As such, two cases of different ACV directions are considered in this paper (Inlet 1 and Inlet 2). In summer, the ACV varies significantly with the time slots of a day, causing remarkable changes of air temperature and relative humidity ratio. Under extreme weather conditions, the ACV can reach up to 25 m/s. As a result, the ACV is a crucial factor determining thermal comfort in this study.
The case study is based on the assumption that the ACV is fully flexible and the air temperature is a constant before flowing into the internal space of this model.
According to the logarithmic law of wind speed profile in an atmospheric boundary layer proposed by Prandtl in 1932, the ACV inlet velocity can be calculated by the following Equations (8) and (9) [37]:
v = w = 0
u = 1 / κ ( τ s / ρ ) 1 / 2 ln ( z / z 0 )
where τs stands for ground surface shear stress and z0 for ground aerodynamic roughness length. The specific value of z0 for different terrain is available in charts such as one value used by Cermak [38]. In this case study, κ and z0 are set as 0.4 and 0.01 m respectively. Then τs can be calculated from a given value of wind speed u at a known height, which is the top surface of the highest building across the sudy area in this case.
Figure 3. Prevailing winds in summer across the study area.
Sustainability 07 03109 g003

2.5.2. Outlet Boundary

Apart from the ACV and natural convection, the two vertical surfaces regarded as outlet boundaries should be taken into account in the model as shown in Figure 5. Further, the top surface of the model should be regarded as outlet boundary for wind exit due to the natural convection occurring from the temperature differences between the ground, building surface and the air in the ambience. Pressure outlet boundary condition is applied to each of these and the simplification reversing flow is normal to the boundary surface.

2.5.3. Wall Boundary

As both the ground surface and all the building surfaces receive solar radiation, the radiation heat transfer occurs between any two surfaces. In addition, these surfaces exchange radiation heat with air, which can be calculated by Equations (10)–(13) and affected by the shadow angles and view factors. Solar radiation imposed on the ground and all the building surfaces varies with time, shape angle, view factor, and solar radiation intensity.
After considering the thermal boundary condition of the walls, the flow characteristics should be described. According to the nonslip boundary condition of solid surfaces due to the viscosity of fluid flow, functions for the boundary layer are employed here in order to simulate the near-surface flow:
u = v = w = 0
τ s = ρ [ κ / ln ( z / z 0 ) ] 2 ( u 2 + v 2 )
k = τ s / ( ρ C μ 1 / 2 )
ε = ( τ s / ρ ) 3 / 2 / κ y
where the subscript “s” means “surface value”, the other parameters are evaluated at nodes near the ground surface. Equations (12) and (13) indicate that both k and ε values are a constant across the study area, different from the strong turbulent areas shown in Equations (4) and (5).
The ground surface is assumed to generate heat fluxes varying with solar radiation intensities. In addition, some simplifications in treating the walls facilitates the development of the following the assumptions: (a) the vibration of ACV effect is neglected and thus the time term is considered to be steady; (b) the ground layer is homogeneous and isotropic; and (c) local heat equilibrium has been achieved between the ground and the air bypassing it. All these assumptions are aimed to avoid the simultaneous analysis of more than one factor without too much deviation from the real conditions.

2.6. Meshing Skills and Computational Procedure

2.6.1. Meshing Skills

In general, for the same meshing zone, the hexahedral (HEX) meshing method is more economical and can reduce false diffusion more efficiently than the tetrahedral method. As a result, HEX grids were applied for the model and the mesh generation procedure of the whole geometric model was executed using the commercial software package Gambit 2.4 [39]. The grid distribution of the geometric model shown in Figure 2 follows this rule: Since the anticipated relatively steep gradients in velocity, pressure, and temperature near the walls and the ground stimulate serious consideration into the boundary layer effect of these areas, the fine grids are more concentrated at locations near the building walls and ground surfaces than those remote locations.

2.6.2. Computational Procedure

The computations have been conducted by using the general-purpose CFD program Fluent 6.3.26 [40]. All the model parameters including relative humidity, solar radiation, shadow angle, and ACV are all figured out using the user-defined-function (UDF) method. The Fluent software is not able to automatically and directly calculate complex problems if the fluid is a mixture, e.g., wet air in this case, because the mixture’s physical parameters vary with relative humidity. Nor can it directly solve the problem with non-uniform inlet velocity, solar radiation, etc. However, the Fluent software can be accessed through its interface using several C++ codes describing the specific parameters, such as the inlet velocity (shown in Equation (9), the profile is a logarithmic curve), fluid density, fluid enthalpy, and fluid viscosity (all the fluid physical parameters can be calculated according to the examples showed in Equations (6) and (7)). These C++ codes, inserted into the software Fluent, represent UDFs to meet various users’ requirements. For example, we used the Equations (16)–(23) in [36] to calculate the solar radiation of the various cases shown in this work. Here, the surfaces of the buildings are vertical to the ground; as Wuhan lies in 113°41′E–115°05′E, 29°58′N–31°22′N, the solar altitude angle at noon time in 1 May in a clear sky can thus be calculated. The overall energy received including the direct solar radiation, the sky diffused radiation, and the ground-reflected radiation intensity varies from morning till evening, with the maximum value being 800 W at noon time. Therefore, this value will be input to the UDF code at this time. The QUICK scheme was used to discretize the convective terms and a second order accurate processing used for the diffusion terms. The discretized algebraic equations were solved in a coupled way. The iterations were continuously run until the relative error in the mass equation was less than 1 × 10⁻⁵ and that in the energy equation was less than 1 × 10⁻⁸.
It is necessary to test the grid-independent performance of the system selected for the numerical simulation. Three test cases with 3215478, 5724932, and 7383947 grid numbers respectively are designed for the whole model under the same conditions (0 m/s for ACV and 800 W/m2 for solar radiation). The simulations were implemented through parallel computation using four PCs with 4-core 4.1 GHz and 16 GB RAM. The numerical simulation results indicate that the temperatures in the three grid systems for a given point in the ambience are 303.45 K, 305.76 K, 306.05 K, and the corresponding velocities of this point 0.351 m/s, 0.374 m/s, and 0.383 m/s, respectively. It also has exhibited that further increase of grid number would not cause significant changes of temperature and velocity. Consequently, the solutions in this study have been proven grid-independent. The grid system with 5,724,932 and its grid spacing were, thus, selected as the basic mesh system for the geometrical model of this study.

3. Results and Discussion

3.1. Model Results

Generally speaking, researchers usually use the cross-sections with the height of 1 m or 1.5 m above the ground surface as the representative cross-section to investigate the outdoor thermal comfort behavior. However, in this study, a 0.5 m height cross-section is selected as the representative one, which is contributed at least from the following two reasons. (1) Due to the viscosity of the fluid and the wall’s non-slip effect, the boundary layer near to the ground surface is very thin; also the velocity increase significantly from zero to ambient crosswind within the boundary layer. Above the thin boundary layer, the velocity varies very slightly. Usually, the thickness of the boundary is less than 0.5 m. A similar phenomenon can be found in the temperature variation from the ground surface to the ambience above; (2) Children’s thermal comfort behavior can be easily analyzed if the height decreases from 1 or 1.5 m down to 0.5 m. The fluid flow and temperature characteristics of the cross-sections above 0.5 m are much more favorable than those near to the ground.
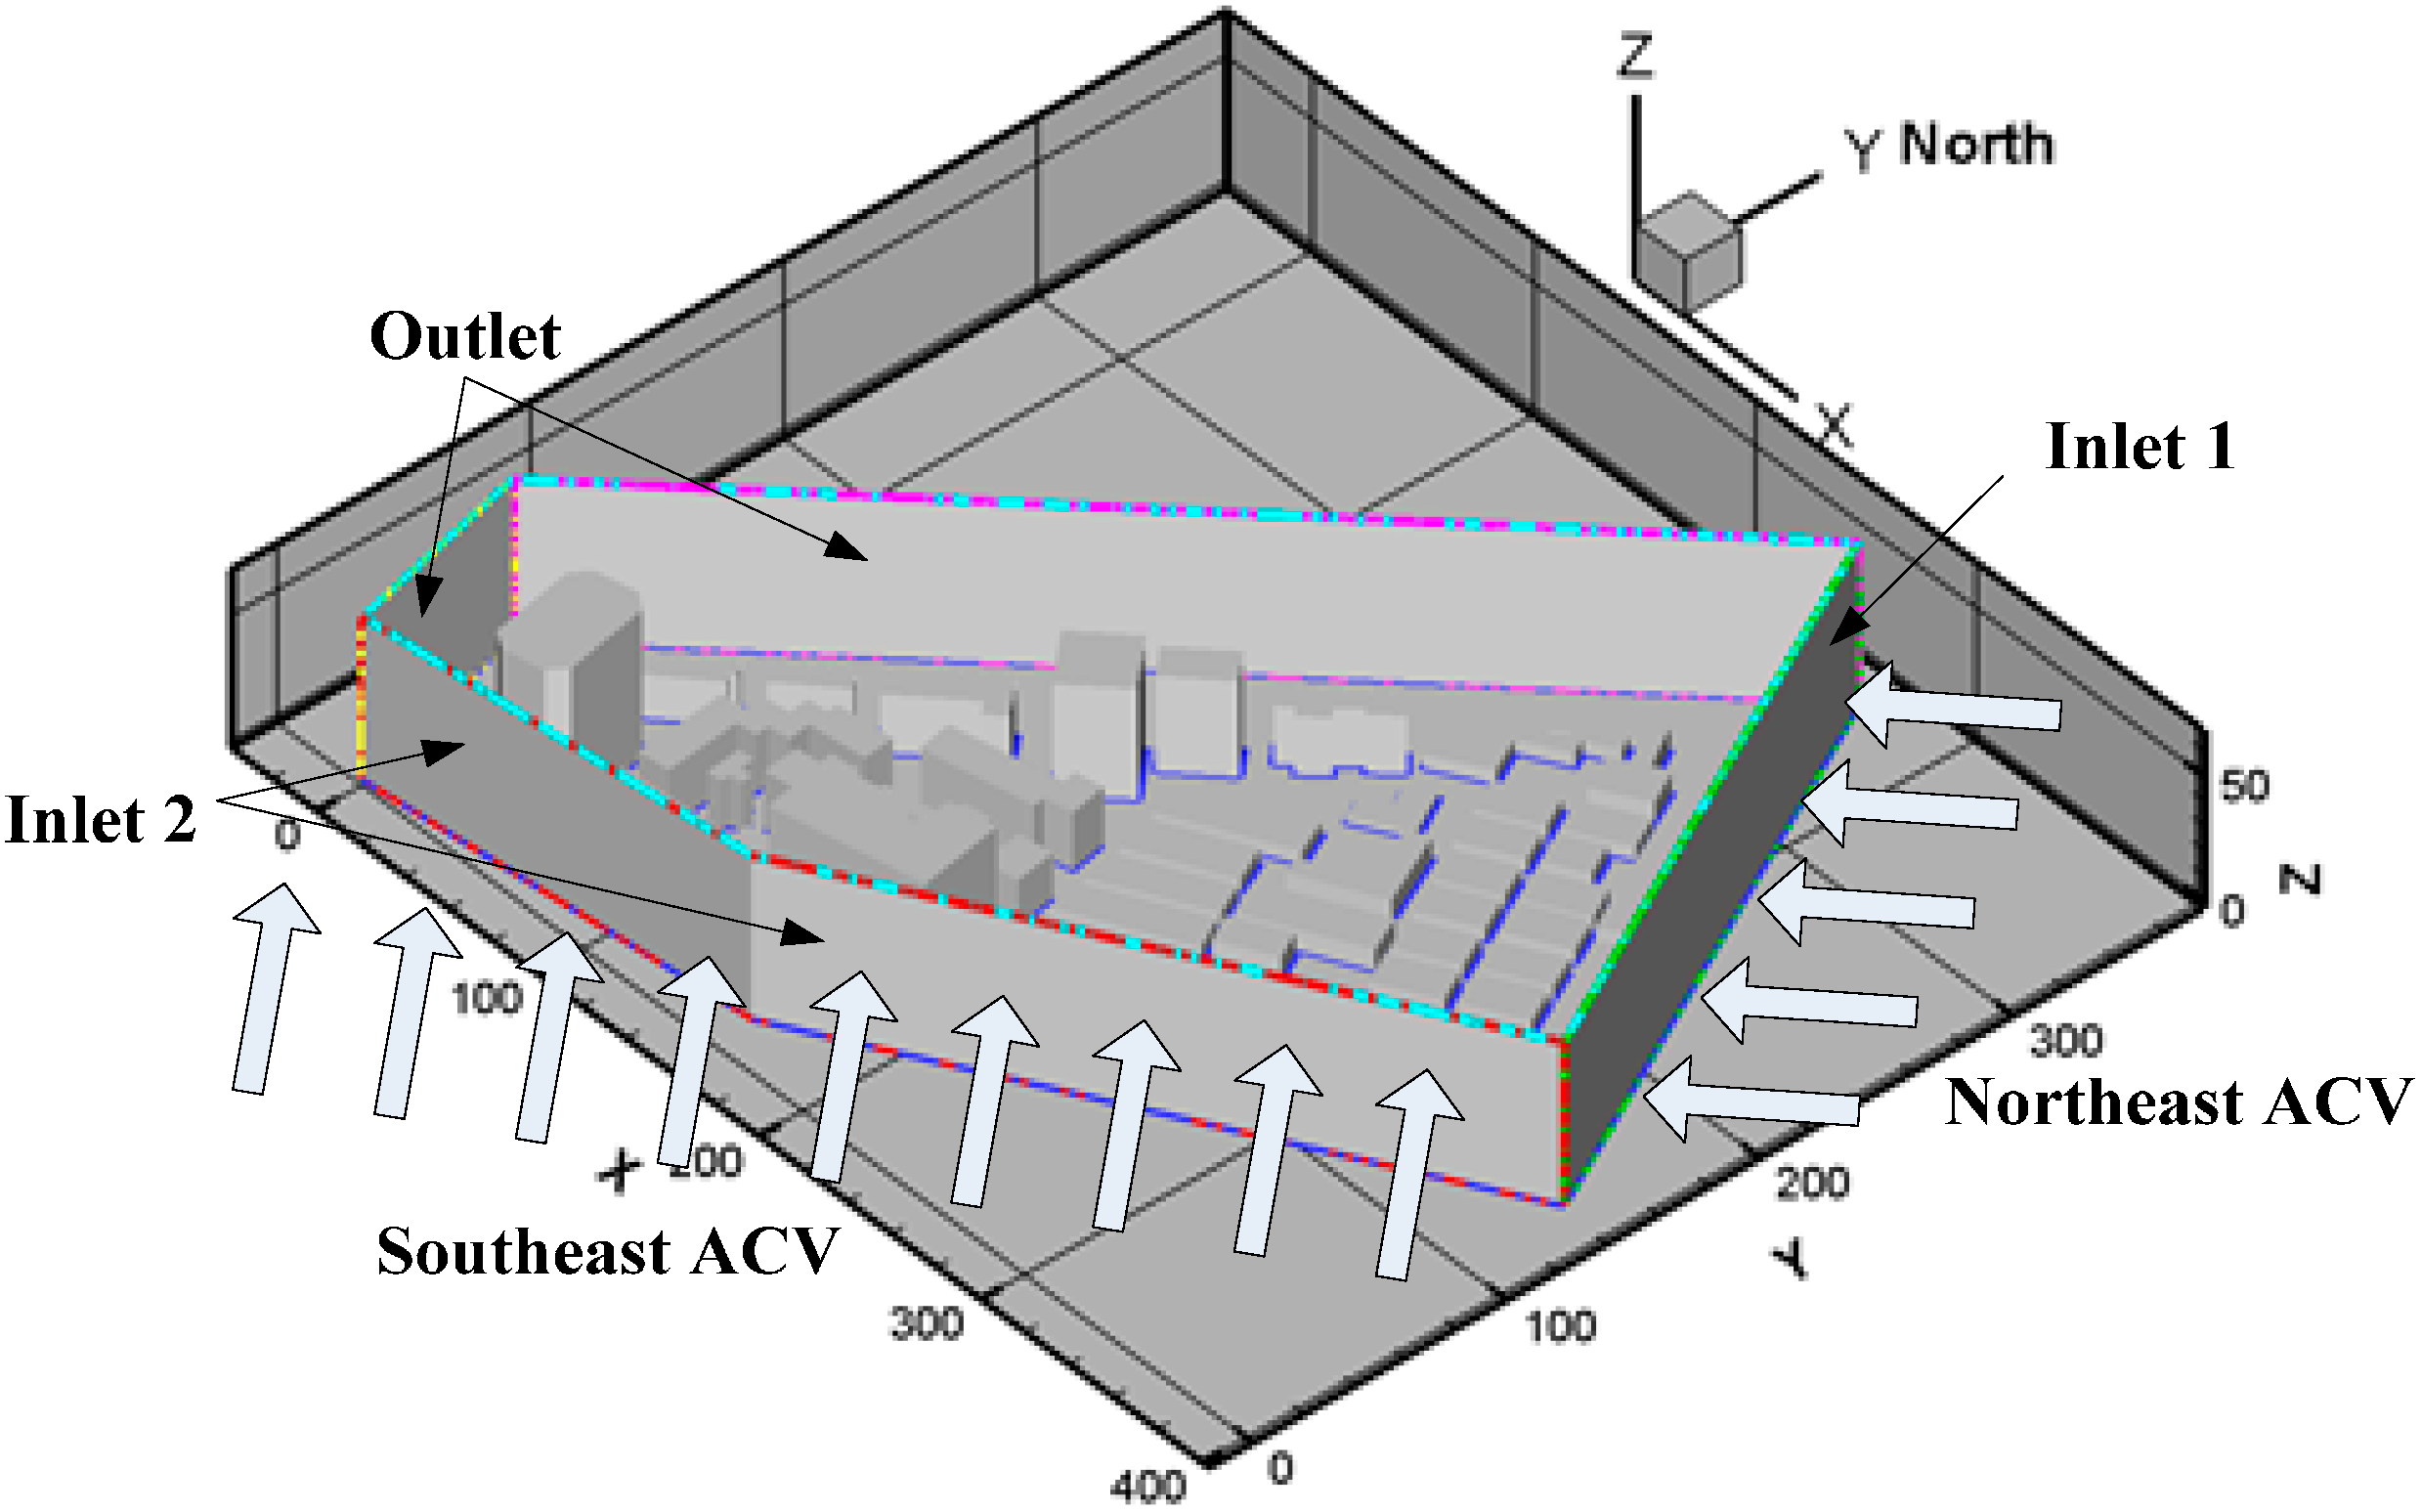
Before performing the numerical simulation, all the boundary conditions are preset for all the inlet, outlet, and walls, according to the process described in Section 2.5; and the effects of water vapor within the air fluid are also considered, which can be treated as a mixture and its physical properties can be described by the UDF method shown in Equations (6) and (7). The ground surfaces and the building walls receive a varied degree of solar radiation at different time as the solar elevation angle changes with time. A steady state working condition at noontime is selected to simplify both the simulation procedure and the radiation heat transfer among all the surfaces and ambience. In addition, the steady state simulation results at noontime also reflect the worst situation in the study area, which is useful for further analysis of the system. The numerical simulation results from the mathematical models are presented into Figure 4 and Figure 5. 
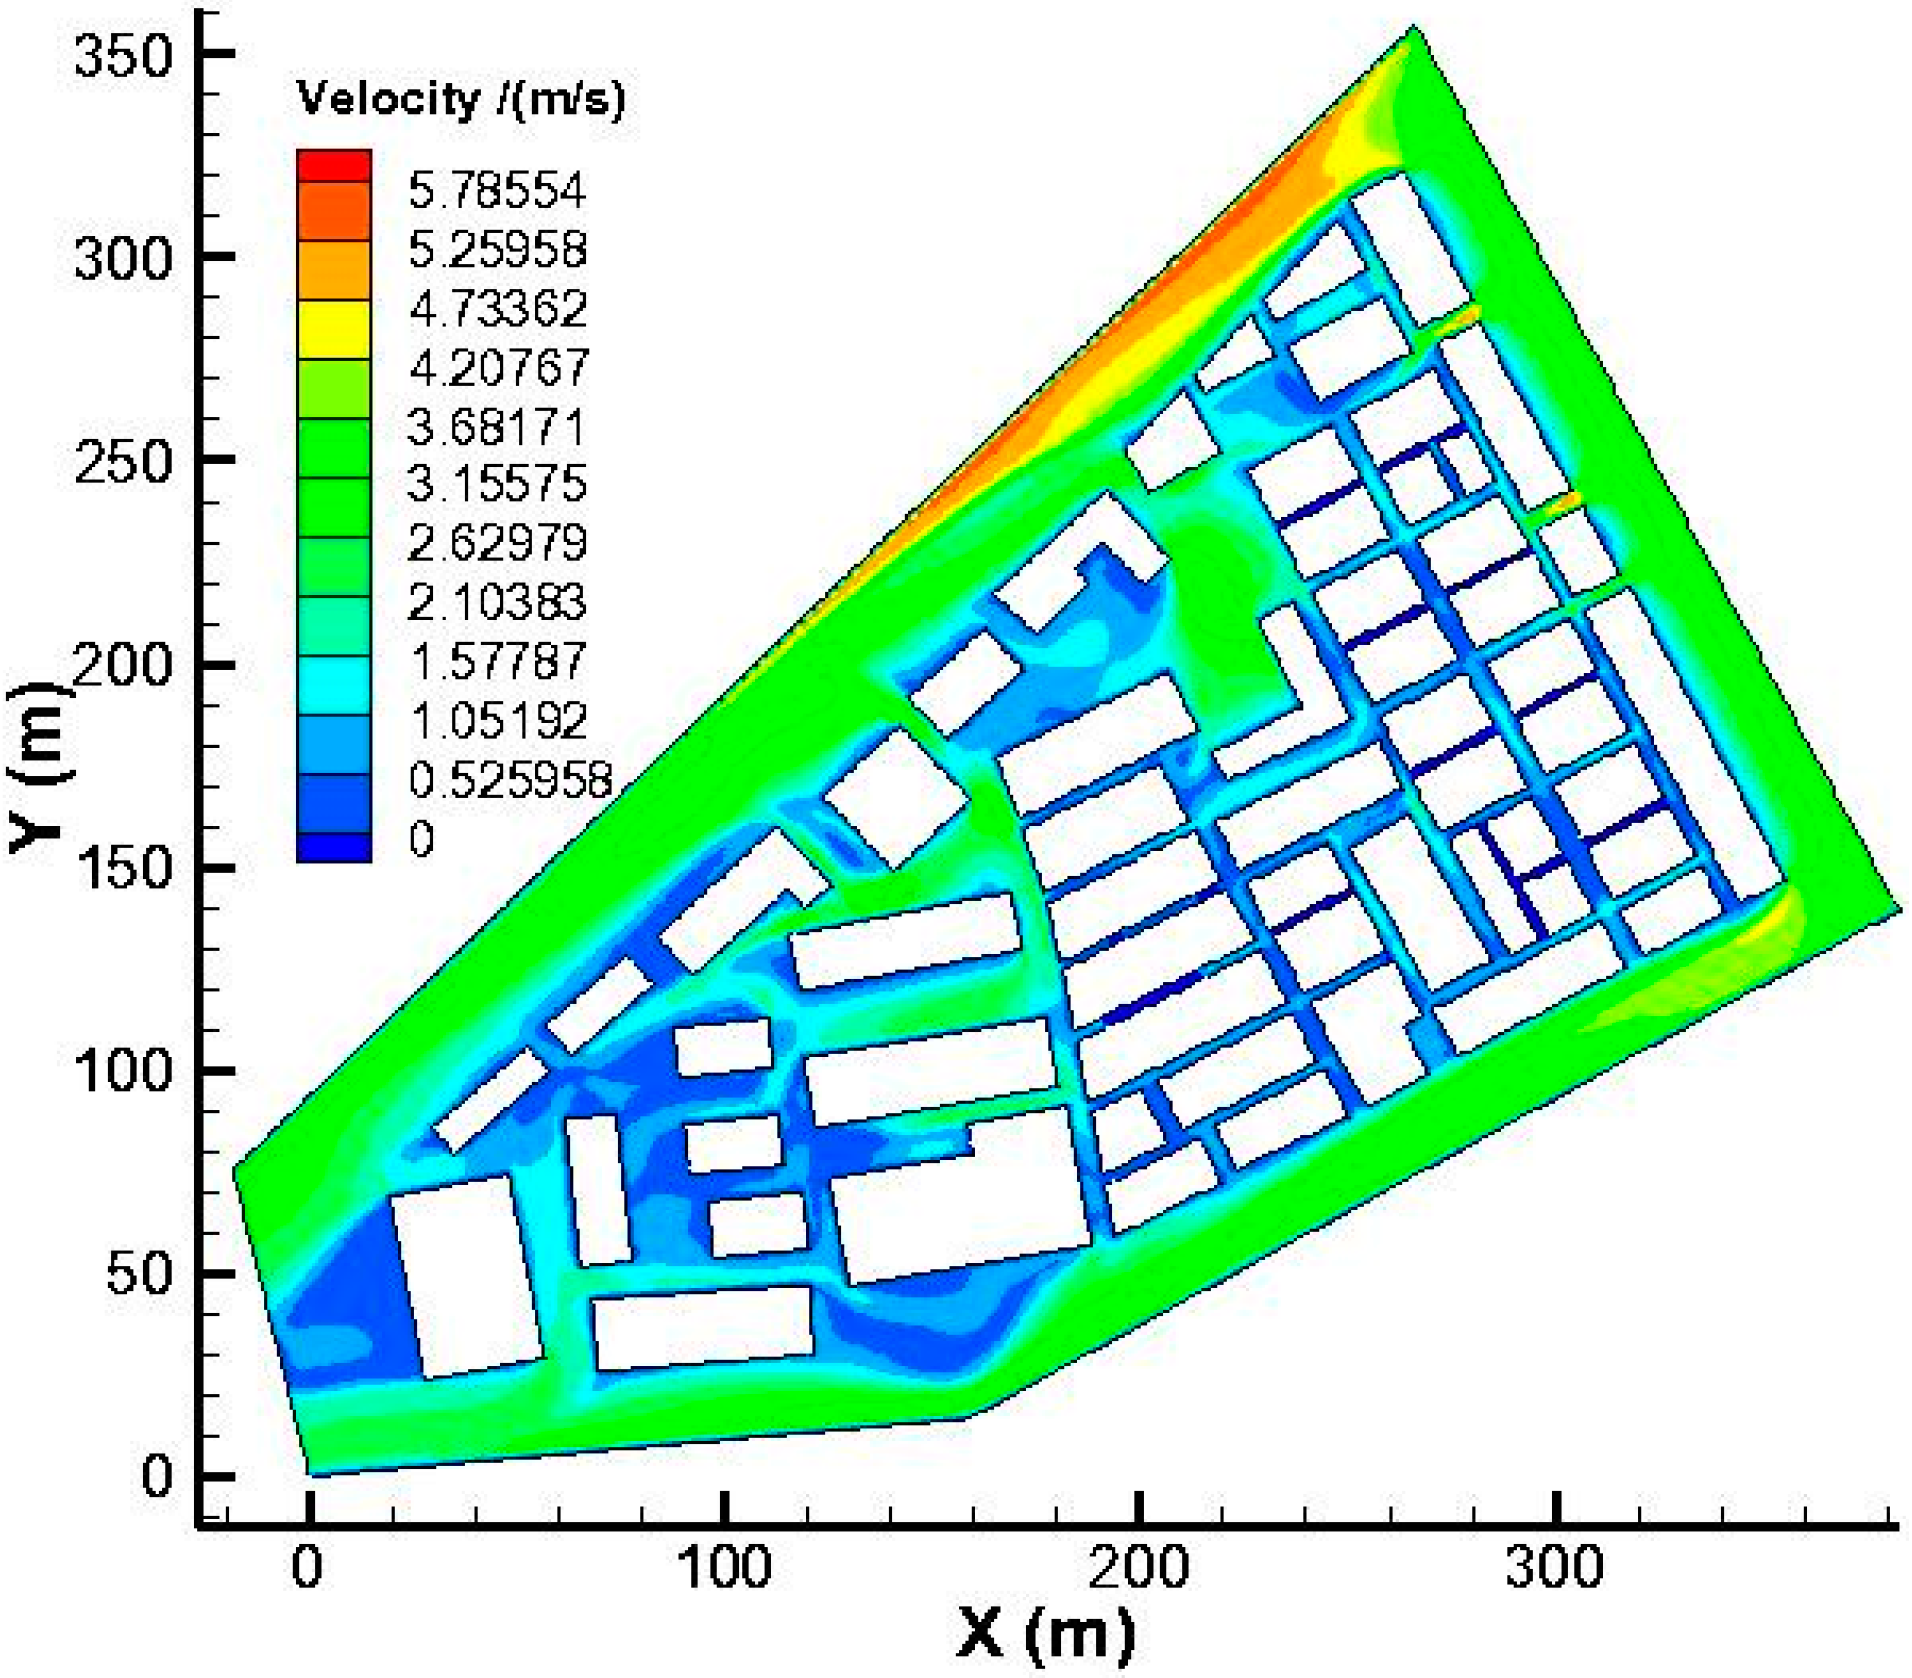
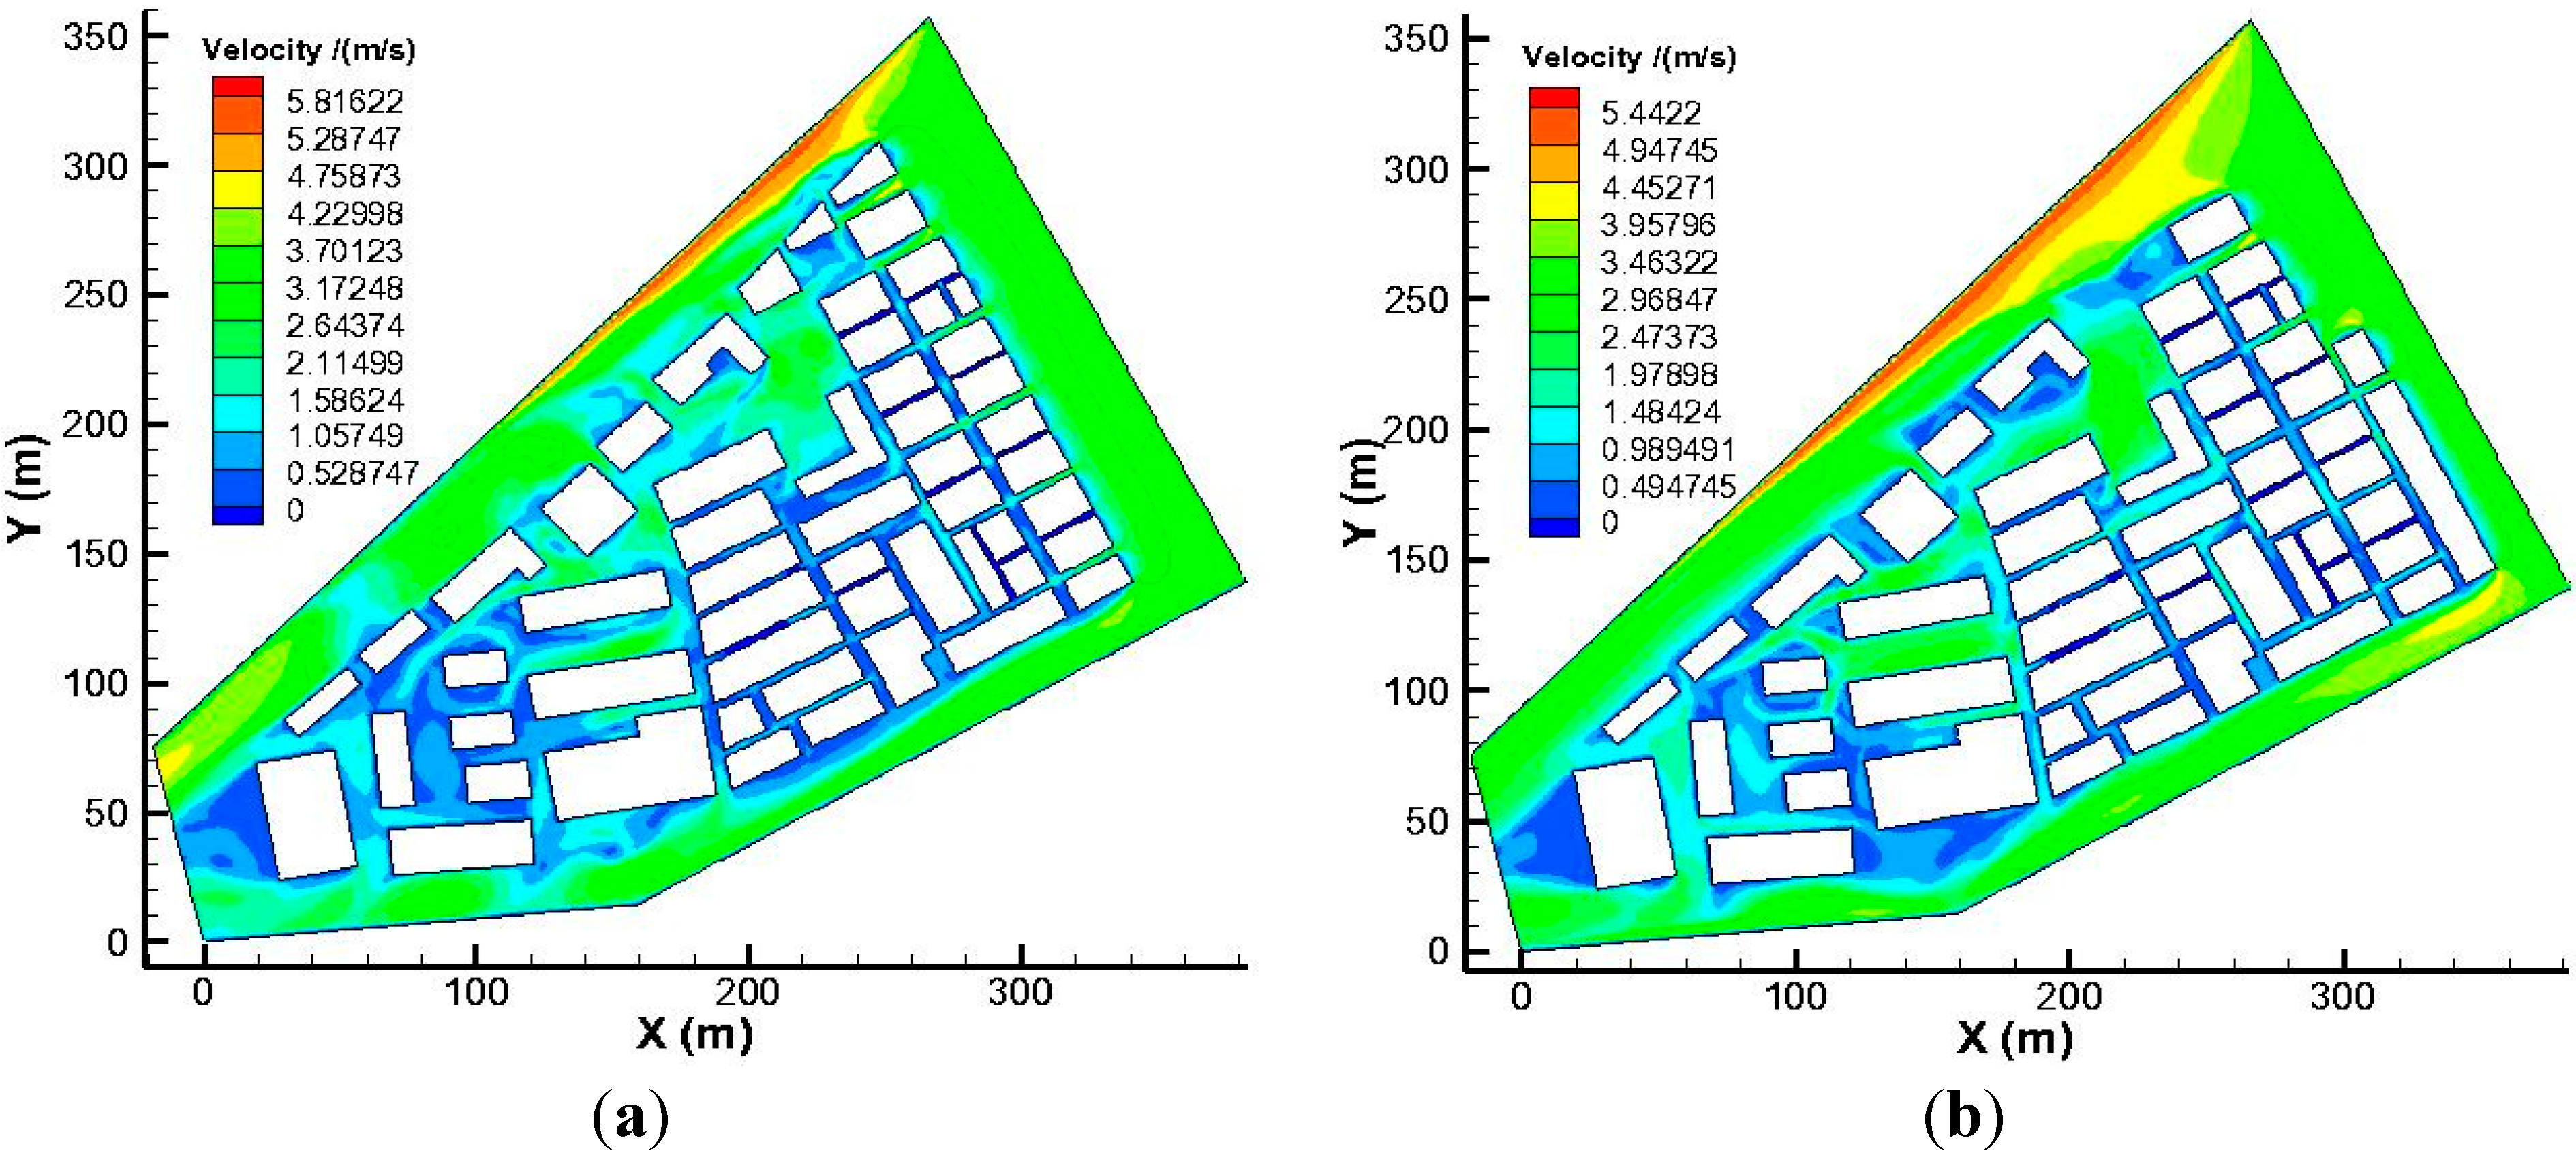
Figure 4 indicates the velocity distribution of the cross-section with a height of 0.5 m. It is clear to see that the fluid flows fluently across the surrounding area; the velocities within the buildings are comparatively much smaller; and the velocity is nearly zero at some positions. There are several reasons contributing to this pattern.
Figure 4. Velocity distribution of the cross-section with a height of 0.5 m.
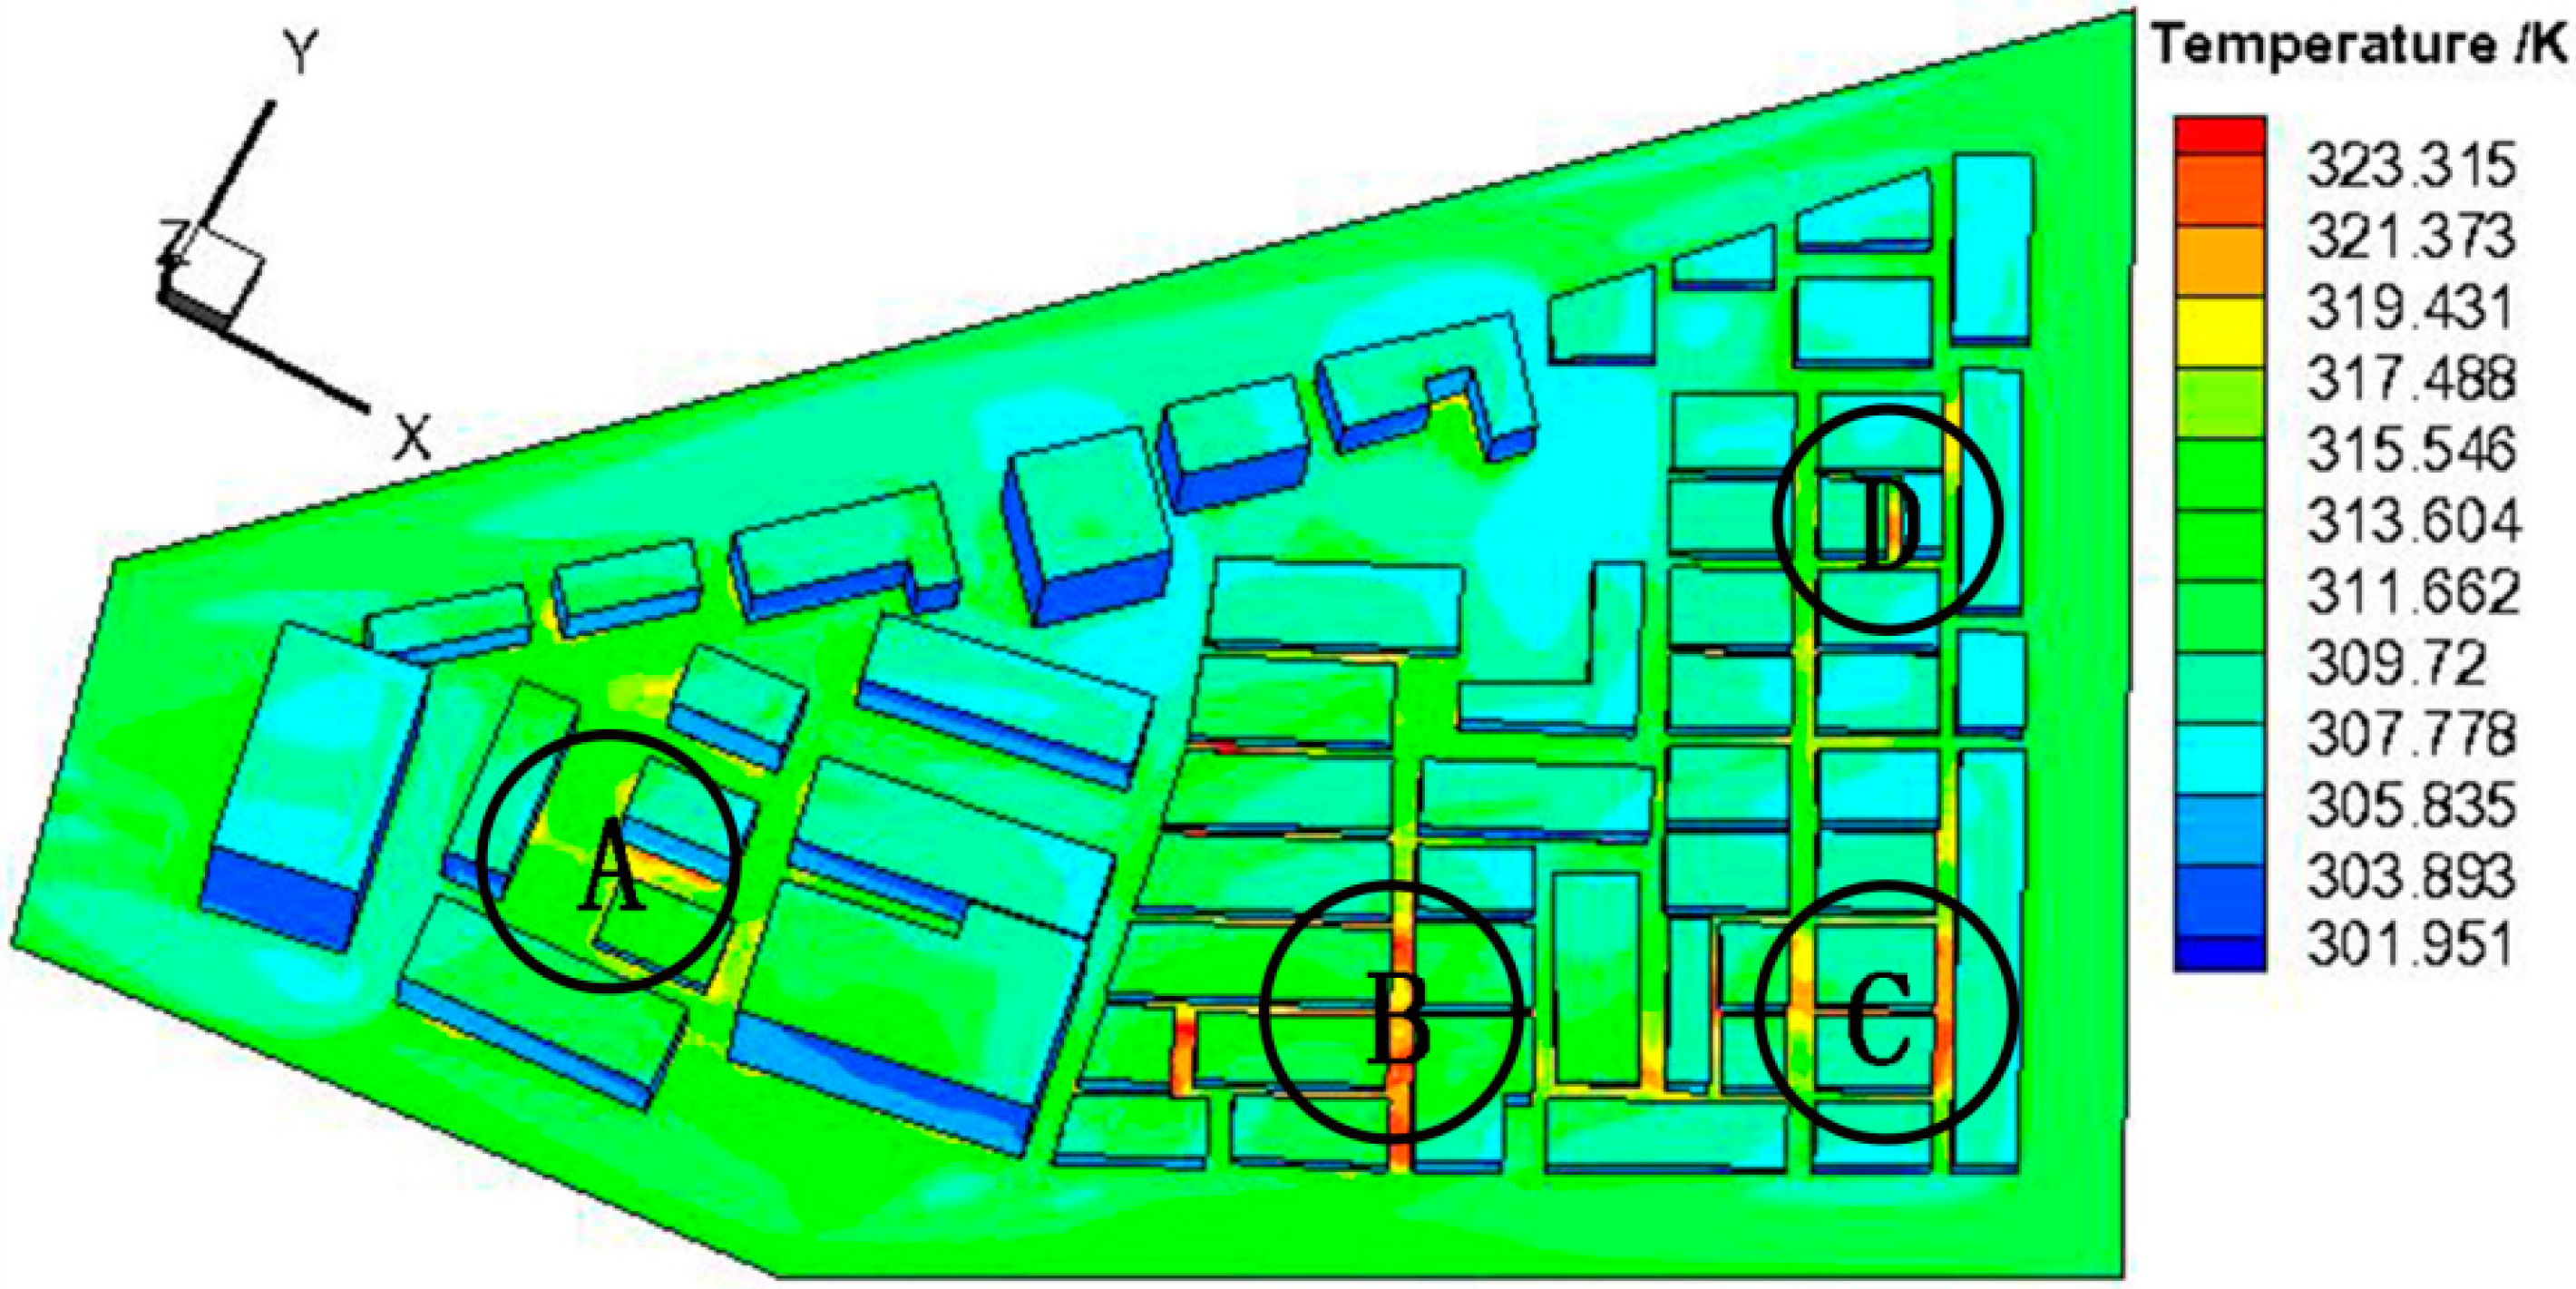
Sustainability 07 03109 g004
Figure 5. Temperature distribution of the ground surface and the building walls.
Sustainability 07 03109 g005
First, three of four buildings are very long, situated in the upwind part of the northeast side, and with only three very narrow channels between the buildings available for ambient crosswind to enter the system. This effectively prevents the Northeast ACW from entering the target area. Second, the space between these old buildings is very narrow, around 2 m. Thereby, the crisscross flow passages are well connected but only a small blank space is available in this area without undertaking urban renewal. The poor buildings layout results in a bad fluid flow. Finally, although retrofit buildings in the southwest have large and wide flow passages, the ventilation in this area has not been significantly improved based on its velocity distribution. The dense old buildings locating in the upwind area and no ACW entering the renewed area have contributed to this situation.
Generally, the fluid flow characteristic of the system has significant influences on its thermal performance. The temperature of the ground surface is much lower, when the air flows across the surface at a larger velocity, and vice versa. The temperature distribution on the ground and building surfaces shown in Figure 5 has clearly verified this rule. Many inner city areas with such old buildings share the same situation. Further, it is clear to see in Figure 5 the temperatures at four points: A, B, C, and D, are a little higher than their surroundings. A is situated in the center of the renewed buildings, B in the most densely old buildings, C and D in the back of the two very long buildings blocking the ACW from entering the system. As a result, it is imperative to develop effective and optimal urban renewal strategies through numerical simulation for improving the thermal environment of the system.

3.2. Optimal Designs

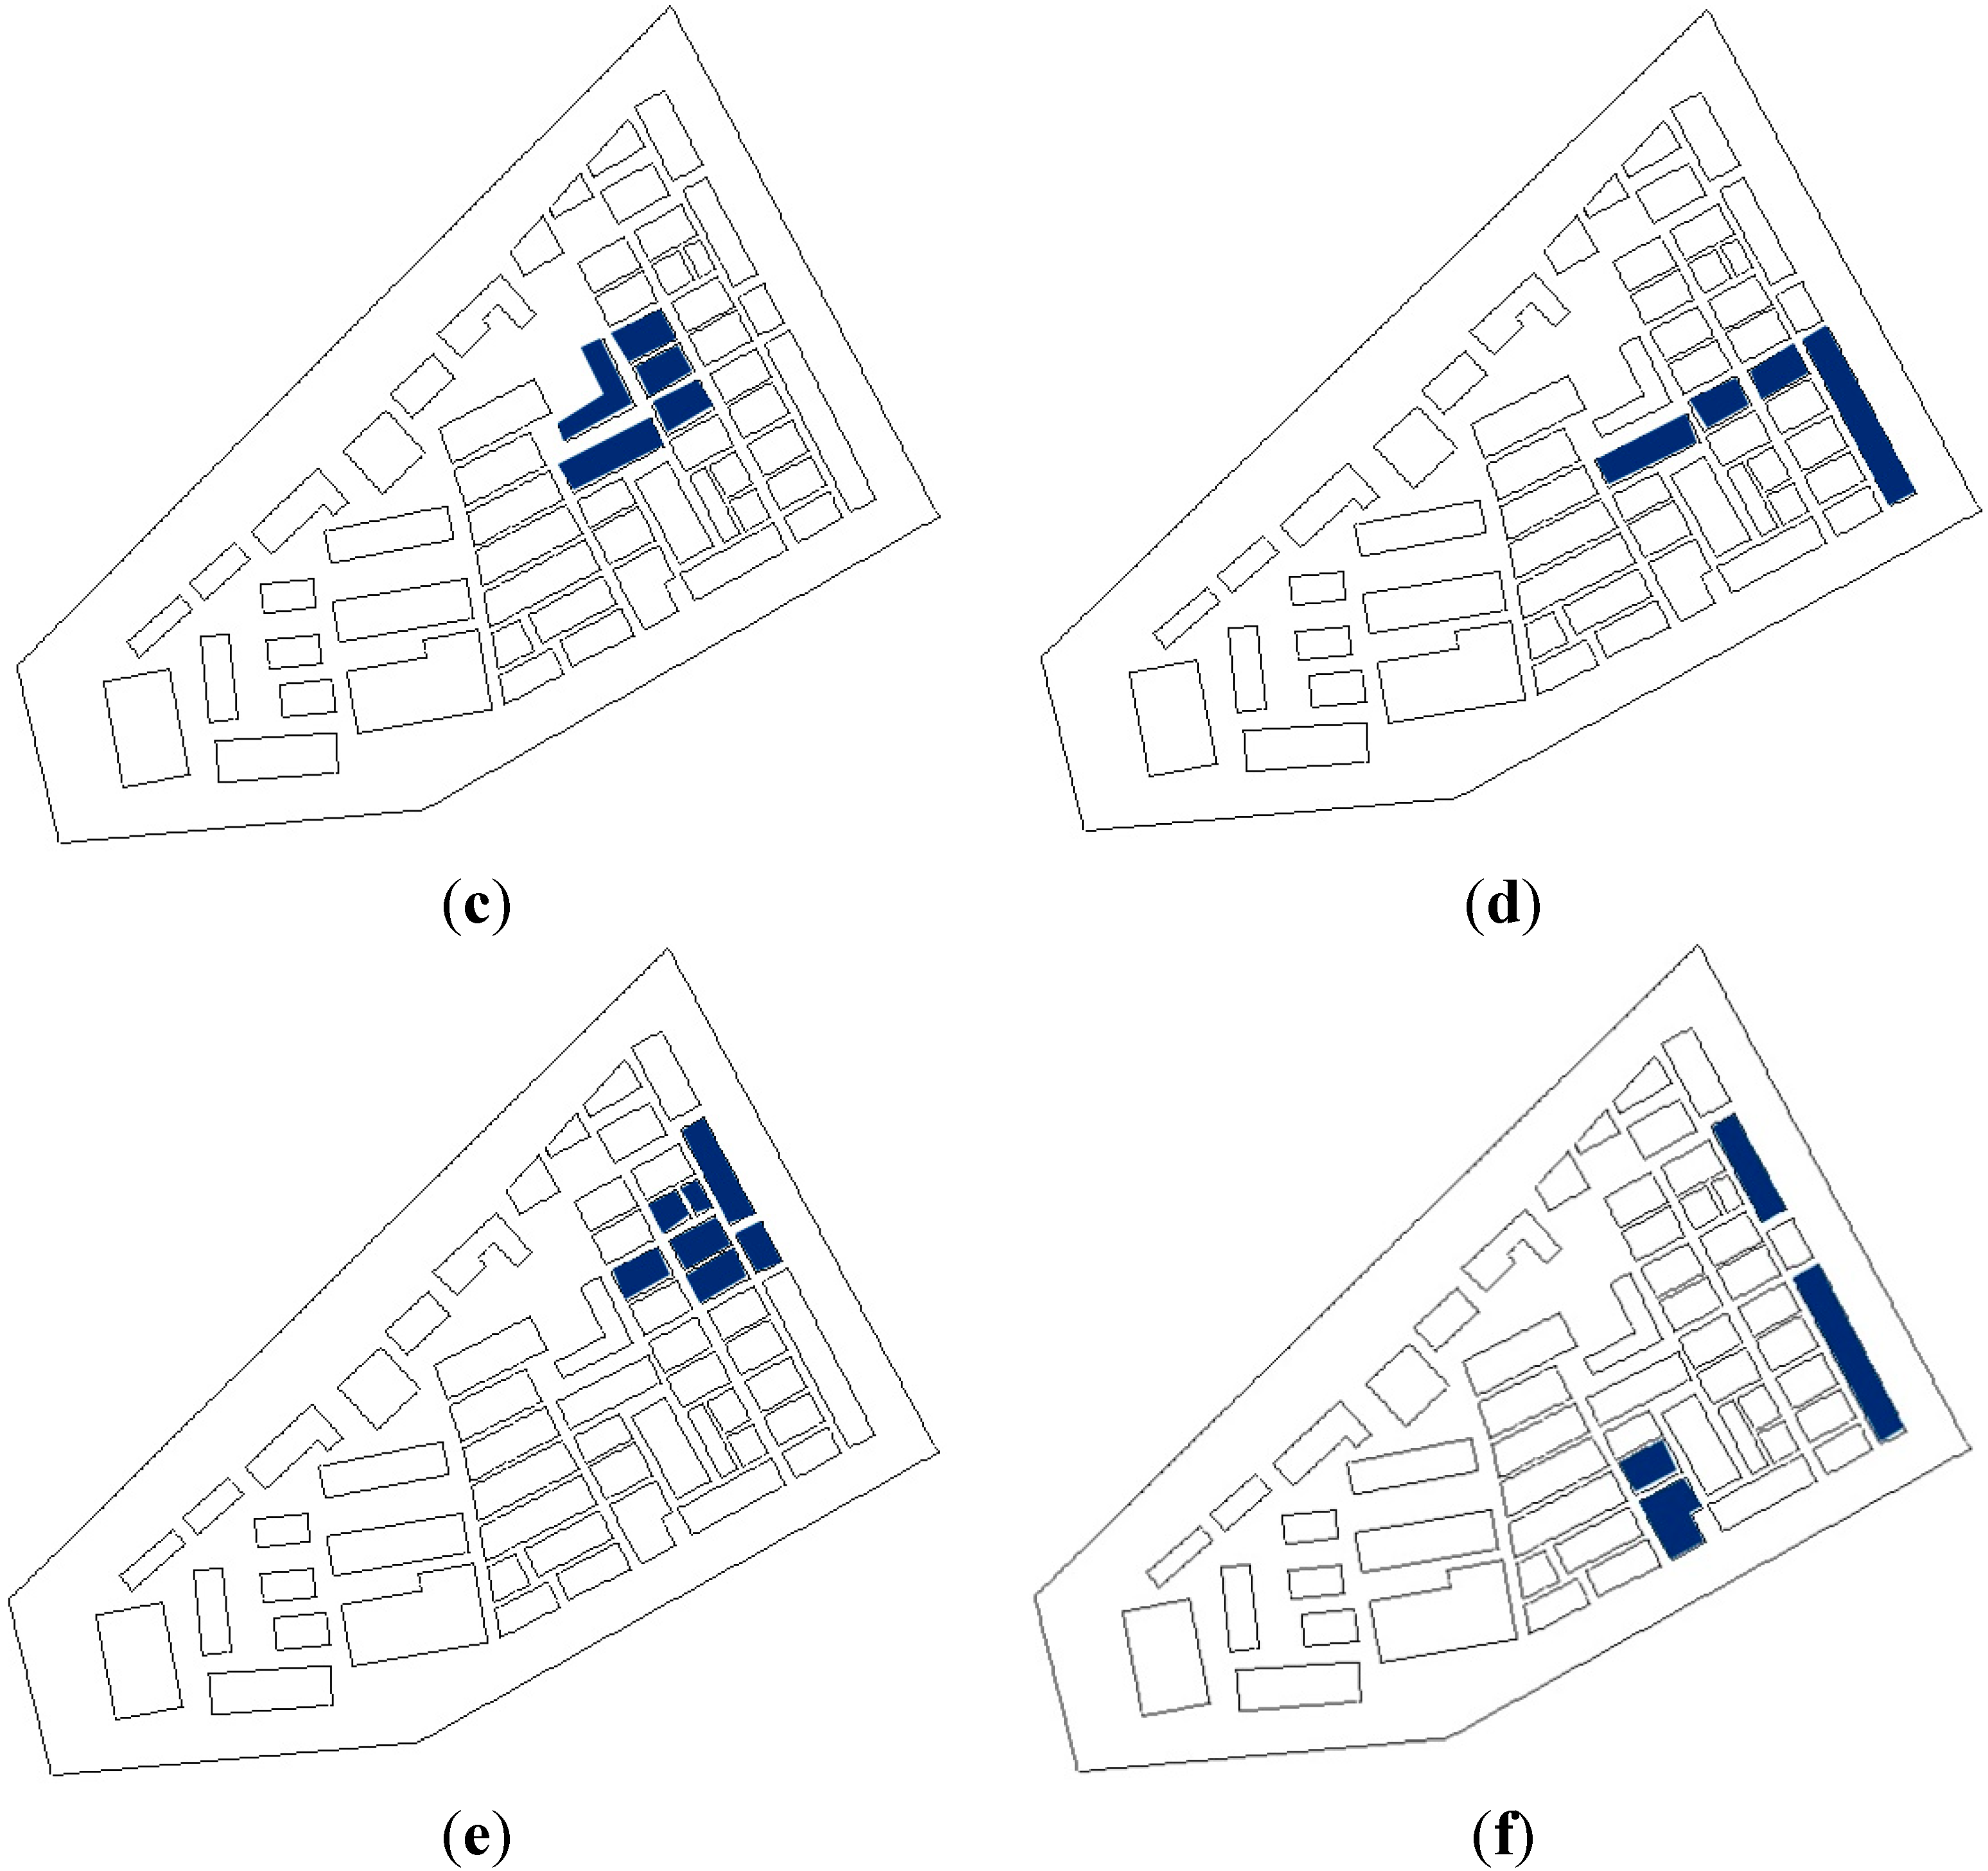
There are two common methods dealing with old downtown areas in Chinese cities: Either large-scale demolition and reconstruction or small-scale renewal. The former may damage the historical elements at some sites and change the demographic structure in the area. Moreover, large-scale demolition and reconstruction cannot be completed within a short time. Comparatively, the latter (small-scale renewal) is much more flexible, cheap and rapid in improving the environment of the old city. This section aims to explore the influence of different strategies with approximate area value on the wind and thermal environment in the old city. According to the building layouts in this area, the following six strategies are classified and their influences will be examined: The Border Demolition, Angle Demolition, Wedge-shaped Demolition, Central Demolition, Interconnected Demolition, and Scattered Demolition.
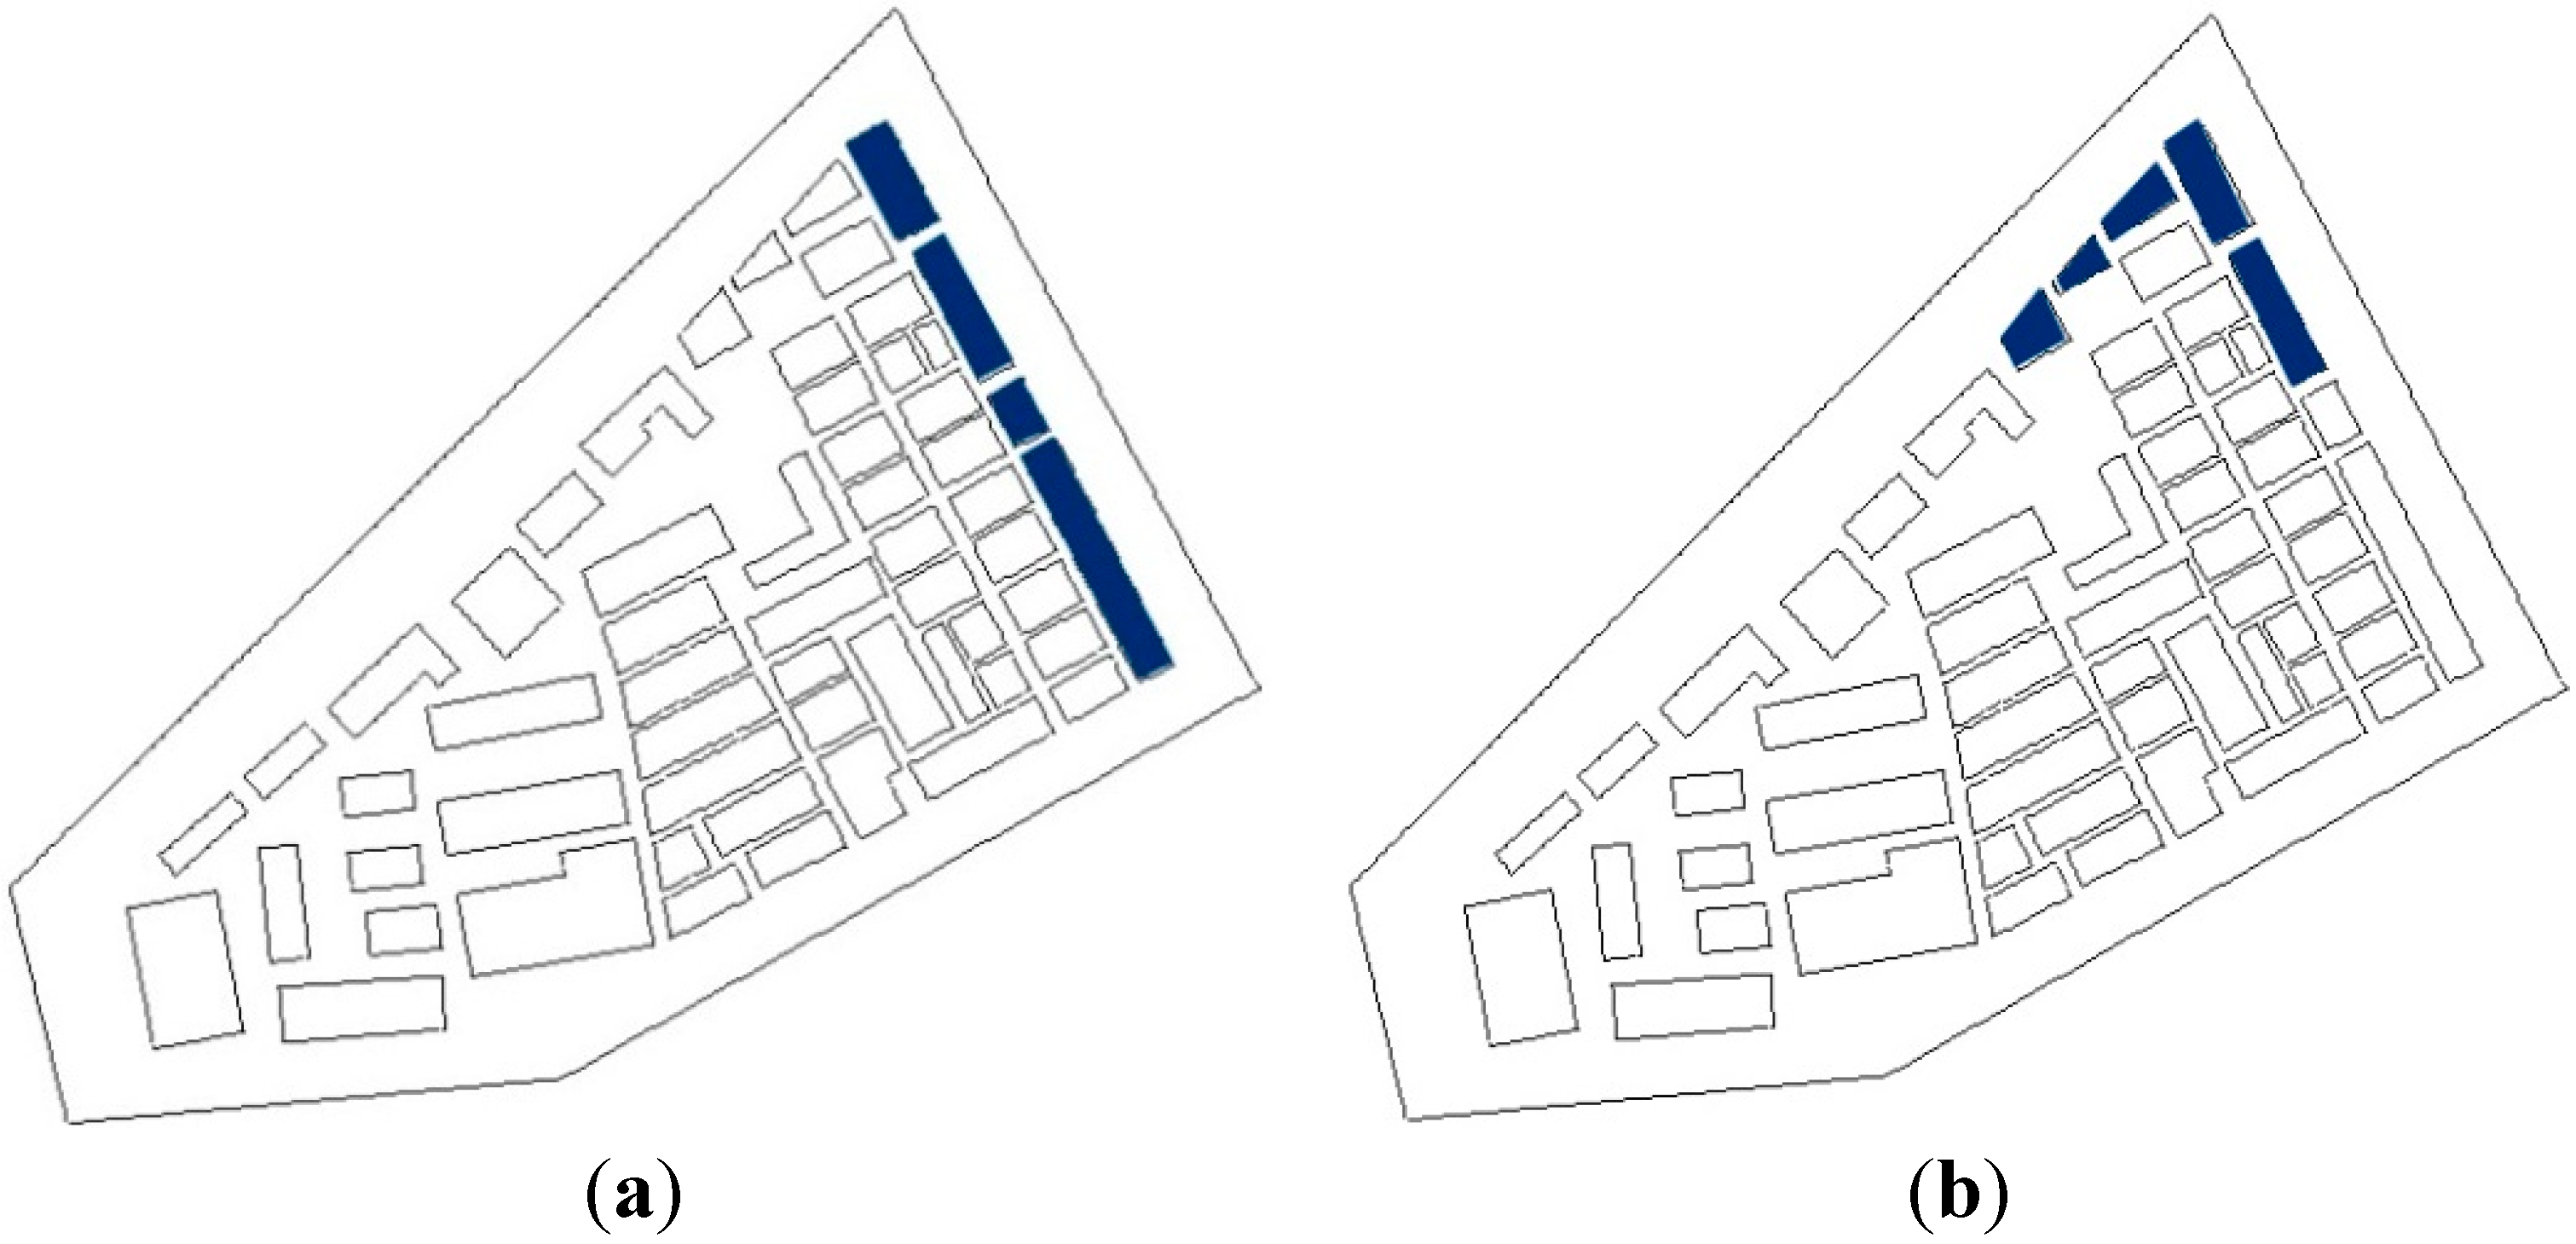
Strategy one tends to demolish a row of four buildings (Figure 6a). The three longer buildings considerably prevent the northeast wind from blowing into the area. There are only three narrow wind channels in its original layout. After the improvement, more channels in the windward are able to allow much air to blow through the study area.
Figure 6. Six renewal strategies for the test area: (a) Strategy One: Border Demolition; (b) Strategy Two: Angle Demolition; (c) Strategy Three: Central Demolition; (d) Strategy Four: Interconnected Demolition; (e) Strategy Five: Wedge-shaped Demolition; (f) Strategy Six: Scattered Demolition.
Sustainability 07 03109 g006aSustainability 07 03109 g006b
Strategy two shown in Figure 6b is aimed to connect the surrounding environment to the existing hollow area in the old city through demolishing several buildings at the northeast corner. The passage enables the air to flow through the renewal area. Strategy three in Figure 6c is planned towards enlarging the hollow area and examines its influence on the thermal environment. The fourth strategy in Figure 6d demonstrates the results from addition of a new channel connecting the border and the central areas. The wedge-shaped area created from strategy five presented in Figure 6e functions as both a buffer for the wind and a channel between the hollow area and outside of the study area. The Scattered Demolition strategy shown in Figure 6f aims to demolish some buildings in areas with crowded and low-rise buildings, as well as others in the northeast. The impacts of these strategies on the wind and thermal environment of this study area will be evaluated in the following sections.

3.3. The Comparisons between Different Renewal Strategies

3.3.1. The Analysis of Air Flow Performances

Figure 7 demonstrates the calculated results from the six strategies shown in Figure 6. Boundary conditions are completely shared with the original models in Figure 4 and Figure 5. Comparing Figure 7a with Figure 4, it is easy to see that the demolition of the four buildings in the northeast increased both the number of channels and the air velocities in these channels across the study area significantly. However, the insignificant slight change of the air velocities in other parts indicates that the strategy one is only effective for the first row in terms of improving the wind and thermal conditions but not for the entire area due to the narrow and crowd streets.
In strategy two (Figure 7b), those streets connected to the hollow area are much wider and opener, forming a flow channel, which makes a large amount of fresh air effectively blow from the northeast into the study area. There has been little change of flow when comparing Figure 7c with Figure 4, it can be concluded that expanding the hollow area has little impact on the wind and thermal environment.
Strategy four shown in Figure 7d leads to an improvement of the wind environment around the buildings in the area as an air current can be introduced into the study area from outside. In Figure 7e, a mouth is open to the northeast wind, and the wedge-shaped design allows a large amount of fresh air to flow in, which greatly improves the wind environment in the D area. Meanwhile, the wedge-shaped structure similar to the strategy two connects these channels, so significantly improve the wind environment of the buildings in the leeward side. Strategy six shown in Figure 7f takes an account of B, C, and D areas simultaneously. This strategy enhances the flow velocities in the B, C, and D areas to some extent because the buildings in the northeast and the B area were demolished. However, there are still some areas not reached by wind due to high building density in this area. Another weakness of this strategy lies in the fact that A area was not taken into account, which leads to poor improvement on the local wind environment.
It is also clear to see in Figure 7 that the wind environment is improved at different levels. The improvement very much depends on how the inner city area is connected to the outer environment in northeast. All six strategies are not able to simultaneously enhance the wind environment of the town as a whole due to very high building density in the old city area.
Figure 7. Velocity distribution of the cross-sections from different strategies (height = 0.5 m): (a) Strategy One: Border Demolition; (b) Strategy Two: Angle Demolition; (c) Strategy Three: Central Demolition; (d) Strategy Four: Interconnected Demolition; (e) Strategy Five: Wedge-shaped Demolition; (f) Strategy Six: Scattered Demolition.
Sustainability 07 03109 g007aSustainability 07 03109 g007b

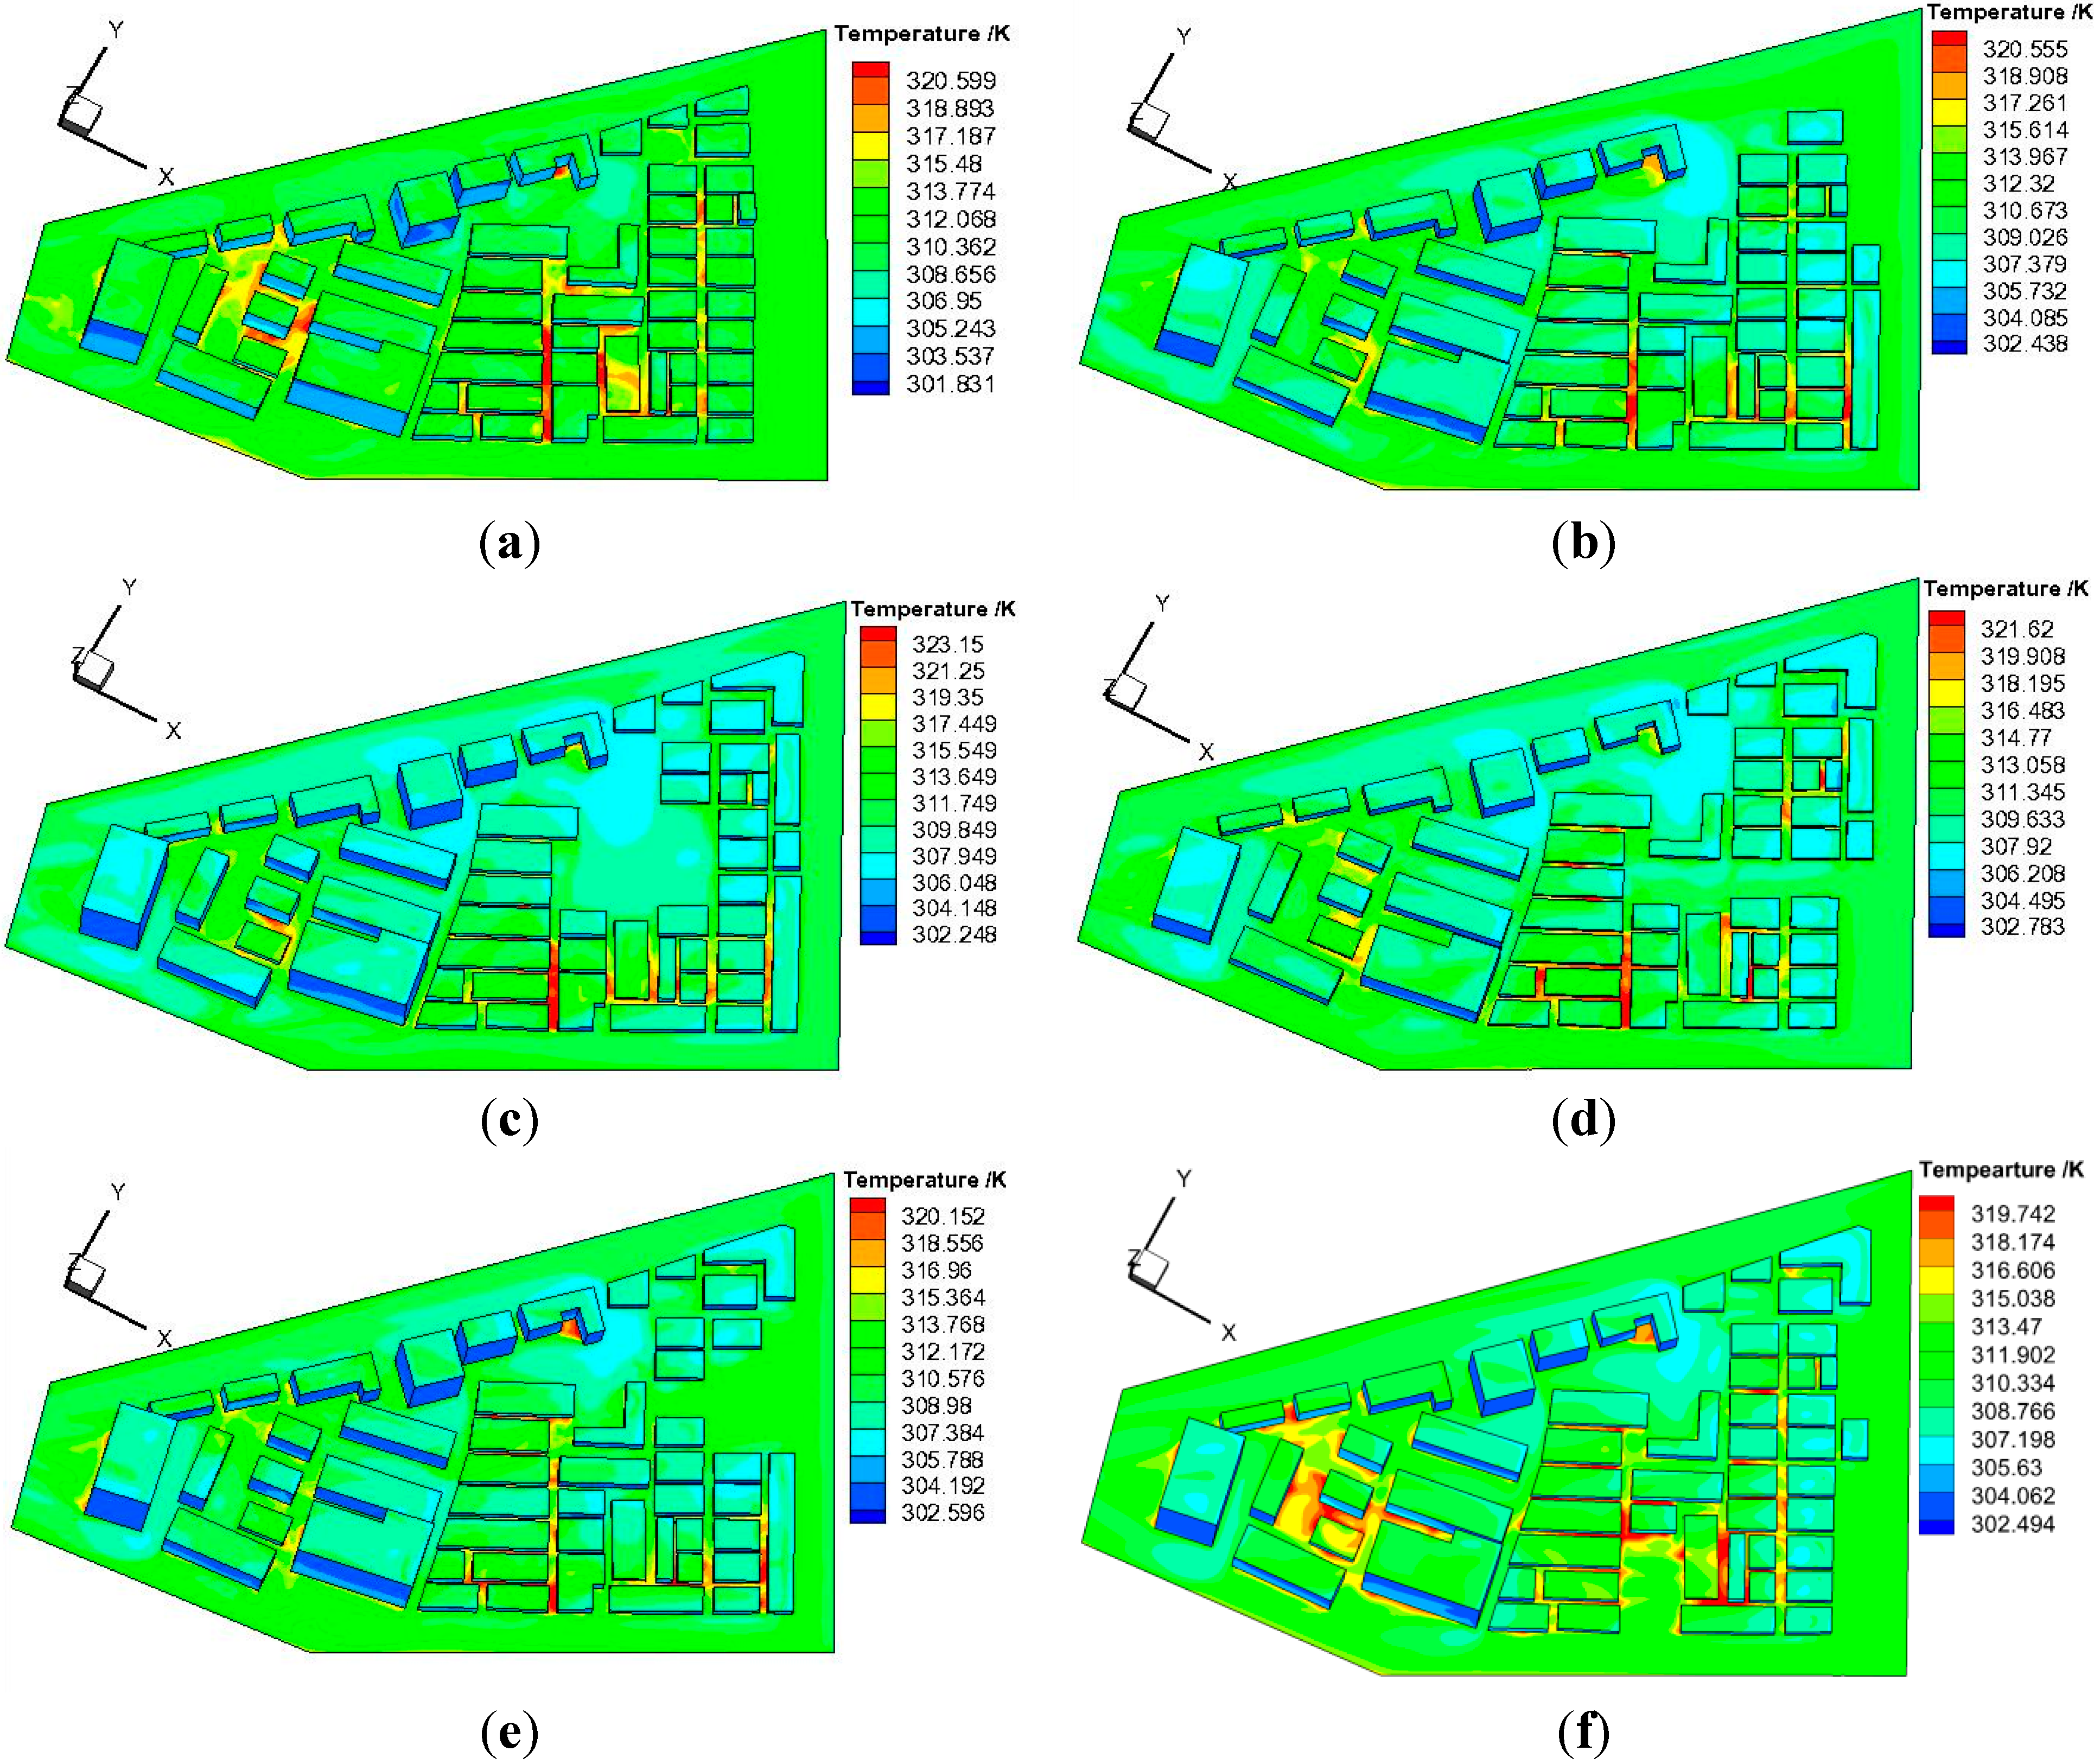
3.3.2. The Analysis of the Thermal Environments

Figure 8 shows the temperature distributions of grounds and building walls in response to the six strategies in Figure 7. This section, similar to the analysis above, aims to compare the improvements in thermal performance between the four high temperature areas in Figure 8. It is clear to see in Figure 8 that strategy five is the best one and strategy four the worst one. First, in strategy five, the wedge-shaped open mouth in the D area not only directly improves the local wind and thermal environments, but also creates a wide wind passage connecting the inner city area and outside the environment, which enhances the thermal environment of the entire old city. Second, in strategy two, the wind channels are also created in the area but its lack of the wedge-shaped mouth in strategy five leads to its slightly poorer improvement of the thermal environment than strategy five. Third, strategy one creates numerous narrow channels but these small wind channels have limited capacity of ventilation, so the crosswind can hardly reach the inner parts of the old city, such as the A and B areas. The effect of strategy one should be less significant than that of strategy two.
Figure 8. Temperature distributions of grounds and building walls from the six strategies: (a) Strategy One: Border Demolition; (b) Strategy Two: Angle Demolition; (c) Strategy Three: Central Demolition; (d) Strategy Four: Interconnected Demolition; (e) Strategy Five: Wedge-shaped Demolition; (f) Strategy Six: Scattered Demolition.
Sustainability 07 03109 g008
Fourth, strategy three expands the inner hollow area, but the connection between the area and outside the environment is weak, so it does not change the thermal environment significantly. Fifth, strategy six performs very well, which facilitates the improvement of the thermal environment in the B, C, and D areas but not in other areas due to the demolition of buildings in the B, C and D areas. Sixth, in strategy four, though some buildings were demolished, a l-shaped building blocks the air exchange between the inner city area and outside the environment. The strategy’s effects on thermal environment are largely discounted due to the obstructed channels. Thus, it can be concluded that keeping the clear and open wind channels is of importance for improving the thermal environment in the old city.
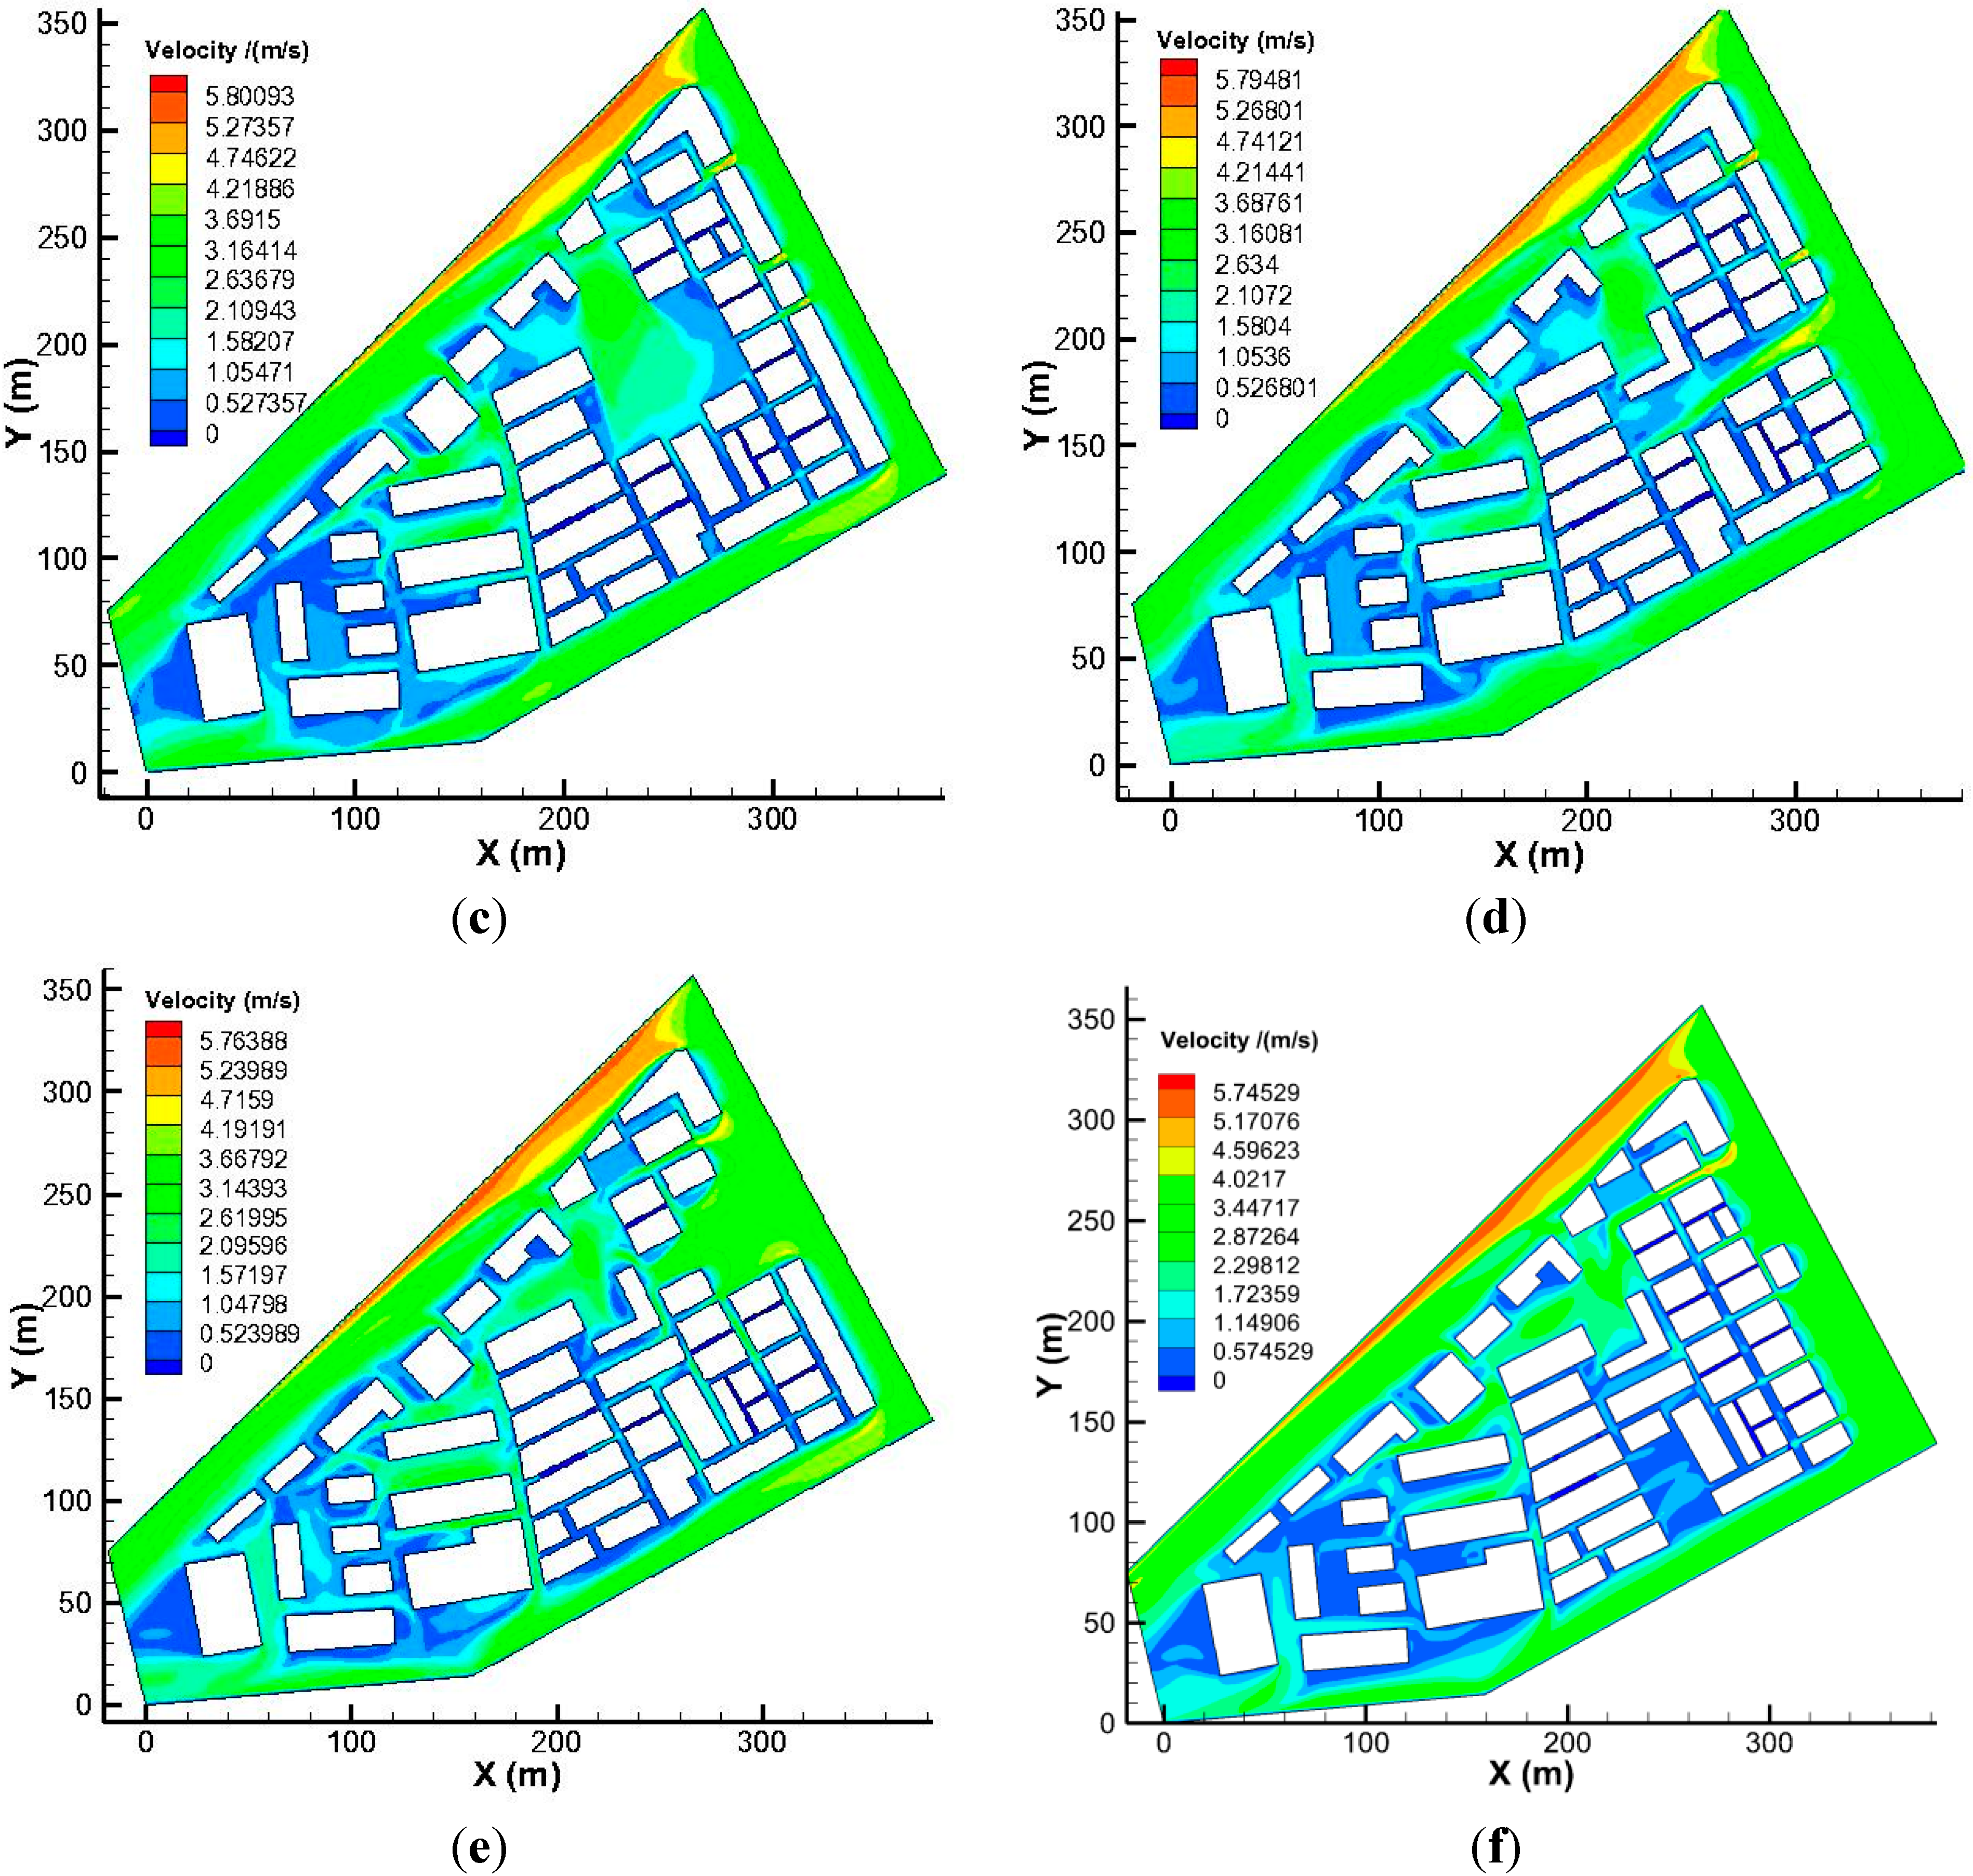
Comparing Figure 7 and Figure 8 with Figure 4 and Figure 5, it is found that strategy one improves the wind and thermal environments in the C and D areas by allowing the exposure of the C and D areas to the northeast wind, because the buildings obstructing the wind channels are demolished. However, it does not facilitate the wind to slip into the inner city area. Strategy two (angle demolition) improves the wind environment in the A and D areas, because a new wind passage is constructed to connect the inner city areas. The strategy three (Central Demolition) has little effect on the three high-temperature areas since expanding the inner wind-free area does not help open the wind channels. Strategy four (Interconnected Demolition) has better effects on C area but only slight effects on B area due to narrow wind channels. Strategy five (Wedge-shaped Demolition) improves the thermal environment in A and D areas more significantly than in B and C areas by creating new air channels. The wedge-shaped open area is near B and C areas and allows the wind to flow into A area easier.
Strategy six (Scattered Demolition) has significant effects on B, C, and D areas, but not the A area because scattered demolition can only improve the wind and thermal environments near the demolished areas without addition of any new and unobstructed wind channels.
It is reasonable to conclude that the six strategies as a whole are not able to improve the thermal environment of the four high-temperature areas (A, B, C, and D) simultaneously. The contributing factors are twofold: (1) the study area is in the leeward side and the A area is obstructed by the low-density old buildings in the windward, making the improvement of the wind and thermal environments difficult; and (2) the demolition only covers a small part of the study area, so it is hard to form a wind channel system making the air pass through the whole study area freely.
It has been proven that the air channels play crucial roles in enhancing the wind and thermal environments in the inner city area.

4. Conclusions

In this paper, the geometric and mathematical models of thermal comfort at the pedestrian level have been developed for a case study of Dazhimen neighborhood in an inner city of Wuhan. Using the CFD numerical simulation methods, the impacts of various urban renewal strategies on wind and thermal environment have been effectively examined, and all the analyses above suggest that appropriate selection of renewal strategies enables the improvement of the wind and thermal environments in the old inner city even without large-scale demolition and reconstruction.

4.1. Expanding the Demolished Area

The six renewal strategies are not able to cover the entire study area in terms of improving the wind and thermal environments due to high-density buildings and limited demolition. Consequently, expanding the demolished area is, undoubtedly, an easiest and most effective method to more significantly improve the wind and thermal environments of the entire area as a larger area of demolition helps form an open and well-connected wind passage.

4.2. Adding and Widening Potential Wind Channels

Though the demolition area for all the strategies are quite close, in strategies two and five, a wind passage is created to introduce the northeast wind into the leeward wind part of the old inner city, which has a significant impact on the environment of whole area. Alike, adding and widening potential wind channels are critical for the renewal of the inner city. For example, the existing hollow area can be connected to outside the environment to create a wind passage only through a small-scale demolition.

4.3. Prevailing Wind Direction

The analysis of prevailing wind direction is important for constructing wind passages. It is commonplace that the streets parallel to the prevailing wind direction has higher wind speeds but the streets perpendicular to the wind direction have a much lower wind velocity. It can be concluded that the demolition on the street in the wind direction have better and stronger effects on the wind and thermal environments than that in the perpendicular wind direction during the process of inner city renewal.

4.4. Connecting the Wind Passages as a Network

All the six renewal strategies mentioned above are beneficial to the air ventilation and thermal environment of the demolished area, but they are unable to improve the overall wind and thermal environment of the whole study area. One main reason is that the demolition of buildings in these proposals is not at a large scale and the related environmental effect cannot cover the whole area. A cross shape demolition plan can be created as two perpendicular wind passages cut through the whole residential zone, allowing air to effectively flow into the whole area with high-density buildings; this will greatly transfer the heat to the outside ambience and thus improve the local micro-climate. Consequently, a network of wind passages in old areas is crucial for the urban renewal in the larger area of inner city.

4.5. Combining Local Demolition and City Virescence

The six demolition strategies can more or less enhance the air ventilation and lower the temperature of the local environment. Demolition strategies introduce strong ambient crosswind into the study area, which will be beneficial to the ventilation effect on the pedestrians and residents comfort, but it is unable to significantly reduce the local temperature. However, if trees and grasses are planted along streets and roads, and in open space areas to increase the virescence coverage of the study area, a significant temperature decrease will occur because the ground surface will not be hit by the projected solar radiation, instead the planted vegetation will absorb the solar radiation and the photosynthesis effect will be enhanced accordingly. Further experimental, numerical, and theoretical studies on combining demolition and city virescence strategies will be conducted in the future.

Acknowledgments

The authors would like to thank the supports from the National Natural Science Foundation of China (51106060, 51108199) and the Natural Science Foundation of Hubei Province (2012FFB02214) in China.

Author Contributions

Tingzhen Ming conceived and designed the study; Chong Peng and Tingzhen Ming established the mathematical model; Yongjia Wu and Chong Peng performed the numerical simulation, improved the figures, and interpreted the data; Chong Peng, Tingzhen Ming and Jianquan Cheng wrote the manuscript, Jianquan Cheng and Zhong-Ren Peng revised the paper, Zhong-Ren Peng provided good advices throughout the paper.

Conflicts of Interest

The authors declare no conflict of interest.

References

  1. Couch, C.; Sykes, O.; Borstinghaus, W. Thirty years of urban regeneration in Britain, Germany and France: The importance of context and path dependency. Prog. Plan. 2011, 75, 1–52. [Google Scholar] [CrossRef]
  2. Chau, K.W.; Wong, S.K. Externalities of Urban Renewal: A Real Option Perspective. J. Real Estate Financ. Econ. 2014, 48, 546–560. [Google Scholar] [CrossRef] [Green Version]
  3. Arch, A.F. Sustainable urban renewal: The tel aviv dilemma. Sustainability 2014, 6, 2527–2537. [Google Scholar] [CrossRef]
  4. Zheng, H.W.; Shen, G.Q.; Wang, H. A review of recent studies on sustainable urban renewal. Habitat Int. 2014, 41, 272–279. [Google Scholar] [CrossRef]
  5. Cheng, Z. The changing and different patterns of urban redevelopment in China: A study of three inner-city neighborhoods. Community Dev. 2012, 43, 430–450. [Google Scholar] [CrossRef]
  6. Mishra, A.K.; Ramgopal, M. Field studies on human thermal comfort—An overview. Build. Environ. 2013, 64, 94–106. [Google Scholar] [CrossRef]
  7. Taleghani, M.; Tenpierik, M.; Kurvers, S.; van den Dobbelsteen, A. A review into thermal comfort in buildings. Renew. Sustain. Energy Rev. 2013, 26, 201–215. [Google Scholar] [CrossRef]
  8. Chen, L.; Ng, E. Outdoor thermal comfort and outdoor activities: A review of research in the past decade. Cities 2012, 29, 118–125. [Google Scholar] [CrossRef]
  9. Al-ajmi, F.F.; Loveday, D.L. Indoor thermal conditions and thermal comfort in air-conditioned domestic buildings in the dry-desert climate of Kuwait. Build. Environ. 2010, 45, 704–710. [Google Scholar] [CrossRef]
  10. Catalina, T.; Virgone, J.; Kuznik, F. Evaluation of thermal comfort using combined CFD and experimentation study in a test room equipped with a cooling ceiling. Build. Environ. 2009, 44, 1740–1750. [Google Scholar] [CrossRef]
  11. Hong, B.; Lin, B.R. Numerical studies of the outdoor wind environment and thermal comfort at pedestrian level in housing blocks with different building layout patterns and trees arrangement. Renew. Energy 2015, 73, 18–27. [Google Scholar] [CrossRef]
  12. Chen, H.; Ooka, R.; Harayama, K.; Kato, S.; Li, X.F. Study on outdoor thermal environment of apartment block in Shenzhen, China with coupled simulation of convection, radiation and conduction. Energy Build. 2004, 36, 1247–1258. [Google Scholar] [CrossRef]
  13. Mirzaei, P.A.; Haghighat, F. A procedure to quantify the impact of mitigation techniques on the urban ventilation. Build. Environ. 2012, 47, 410–420. [Google Scholar] [CrossRef]
  14. Maggiotto, G.; Buccolieri, R.; Santo, M.A.; Leo, L.S.; Di Sabatino, S. Validation of temperature-perturbation and CFD-based modelling for the prediction of the thermal urban environment: The Lecce (IT) case study. Environ. Model. Softw. 2014, 60, 69–83. [Google Scholar] [CrossRef]
  15. De Lieto Vollaro, A.; de Simone, G.; Romagnoli, R.; Vallati, A.; Botillo, S. Numerical study of urban canyon microclimate related to geometrical parameters. Sustainability 2014, 6, 7894–7905. [Google Scholar]
  16. Blocken, B.; Defraeye, T.; Derome, D.; Carmeliet, J. High-resolution CFD simulations for forced convective heat transfer coefficients at the facade of a low-rise building. Build. Environ. 2009, 44, 2396–2412. [Google Scholar] [CrossRef]
  17. Blocken, B.; Janssen, W.D.; van Hooff, T. CFD simulation for pedestrian wind comfort and wind safety in urban areas: General decision framework and case study for the Eindhoven University campus. Environ. Model. Softw. 2012, 30, 15–34. [Google Scholar] [CrossRef]
  18. Blocken, B.; Moonen, P.; Stathopoulos, T.; Carmeliet, J. Numerical study on the existence of the venturi effect in passages between perpendicular buildings. J. Eng. Mech. 2008, 134, 1021–1028. [Google Scholar] [CrossRef]
  19. Blocken, B.; Persoon, J. Pedestrian wind comfort around a large football stadium in an urban environment: CFD simulation, validation and application of the new Dutch wind nuisance standard. J. Wind Eng. Ind. Aerodyn. 2009, 97, 255–270. [Google Scholar] [CrossRef]
  20. Xi, T.Y.; Li, Q.; Mochida, A.; Meng, Q.L. Study on the outdoor thermal environment and thermal comfort around campus clusters in subtropical urban areas. Build. Environ. 2012, 52, 162–170. [Google Scholar] [CrossRef]
  21. Rajagopalan, P.; Lim, K.C.; Jamei, E. Urban heat island and wind flow characteristics of a tropical city. Sol. Energy 2014, 107, 159–170. [Google Scholar] [CrossRef]
  22. Yang, W.; Wong, N.H.; Jusuf, S.K. Thermal comfort in outdoor urban spaces in Singapore. Build. Environ. 2013, 59, 426–435. [Google Scholar] [CrossRef]
  23. Lai, D.Y.; Guo, D.H.; Hou, Y.F.; Lin, C.Y.; Chen, Q.Y. Studies of outdoor thermal comfort in northern China. Build. Environ. 2014, 77, 110–118. [Google Scholar] [CrossRef]
  24. Andreou, E. Thermal comfort in outdoor spaces and urban canyon microclimate. Renew. Energy 2013, 55, 182–188. [Google Scholar] [CrossRef]
  25. Abd Razak, A.; Hagishima, A.; Ikegaya, N.; Tanimoto, J. Analysis of airflow over building arrays for assessment of urban wind environment. Build. Environ. 2013, 59, 56–65. [Google Scholar]
  26. Toparlar, Y.; Blocken, B.; Vos, P.; van Heijst, G.J.F.; Janssen, W.D.; van Hooff, T.; Montazeri, H.; Timmermans, H.J.P. CFD simulation and validation of urban microclimate: A case study for Bergpolder Zuid, Rotterdam. Build. Environ. 2015, 83, 79–90. [Google Scholar] [CrossRef]
  27. Kumar, S.; Mahdavi, A. Integrating thermal comfort field data analysis in a case-based building simulation environment. Build. Environ. 2001, 36, 711–720. [Google Scholar] [CrossRef]
  28. Karjalainen, S. Gender differences in thermal comfort and use of thermostats in everyday thermal environments. Build. Environ. 2007, 42, 1594–1603. [Google Scholar] [CrossRef]
  29. Wang, S.M.; Shen, Z.G. Effects of roof pitch on air flow and heating load of sealed and vented attics for gable-roof residential buildings. Sustainability 2012, 4, 1999–2021. [Google Scholar] [CrossRef]
  30. Yuan, C.; Ng, E. Practical application of CFD on environmentally sensitive architectural design at high density cities: A case study in Hong Kong. Urban Clim. 2013, 8, 57–77. [Google Scholar] [CrossRef]
  31. Su, W.Z.; Zhang, Y.; Yang, Y.B.; Ye, G.B. Examining the impact of greenspace patterns on land surface temperature by coupling LiDAR data with a CFD model. Sustainability 2014, 6, 6799–6814. [Google Scholar] [CrossRef]
  32. Wuhan. Available online: http://en.wikipedia.org/wiki/Wuhan (accessed on 1 November 2014).
  33. Shen, W.Q.; Ming, T.Z.; Ding, Y.; Wu, Y.J.; de Richter, R.K. Numerical analysis on an industrial-scaled solar updraft power plant system with ambient crosswind. Renew. Energy 2014, 68, 662–676. [Google Scholar] [CrossRef]
  34. Minkowycz, W.; Sparrow, E. Advances in Numerical Heat Transfer; Taylor & Francis: New York, NY, USA, 2000. [Google Scholar]
  35. Moran, M.; Shapiro, H.; Boettner, D.; Bailey, M. Fundamentals of Engineering Thermodynamics, 7th ed.; John Wiley & Sons, Inc.: Hoboken, NJ, USA, 2011. [Google Scholar]
  36. Peng, C.; Ming, T.; Gui, J.; Tao, Y.; Peng, Z. Numerical analysis on the thermal environment of an old city district during urban renewal. Energy Build. 2015, 89, 18–31. [Google Scholar] [CrossRef]
  37. Ming, T.Z.; Wang, X.J.; de Richter, R.K.; Liu, W.; Wu, T.H.; Pan, Y. Numerical analysis on the influence of ambient crosswind on the performance of solar updraft power plant system. Renew. Sustain. Energy Rev. 2012, 16, 5567–5583. [Google Scholar] [CrossRef]
  38. Cermak, J.E. Applications of fluid mechanics to wind engineering-freeman scholar lecture. ASME J. Fluids Eng. 1975, 97, 9–38. [Google Scholar] [CrossRef]
  39. Fluent. Inc. GAMBIT Modeling Guide. Available online: http://aerojet.engr.ucdavis.edu/gambithelp/html/modeling_guide/mgtoc.htm (accessed on 15 August 2007).
  40. FLUENT 6.3 Documentation. Available online: http://aerojet.engr.ucdavis.edu/fluenthelp/ (accessed on 20 September 2006).

