
Life Cycle Based Evaluation of Environmental and Economic Impacts of Agricultural Productions in the Mediterranean Area

 ,
,  , and
, and
Abstract
:
1. Introduction
2. Experimental Section
2.1. Study Area
2.2. Goal and Scope of LCA and LCC
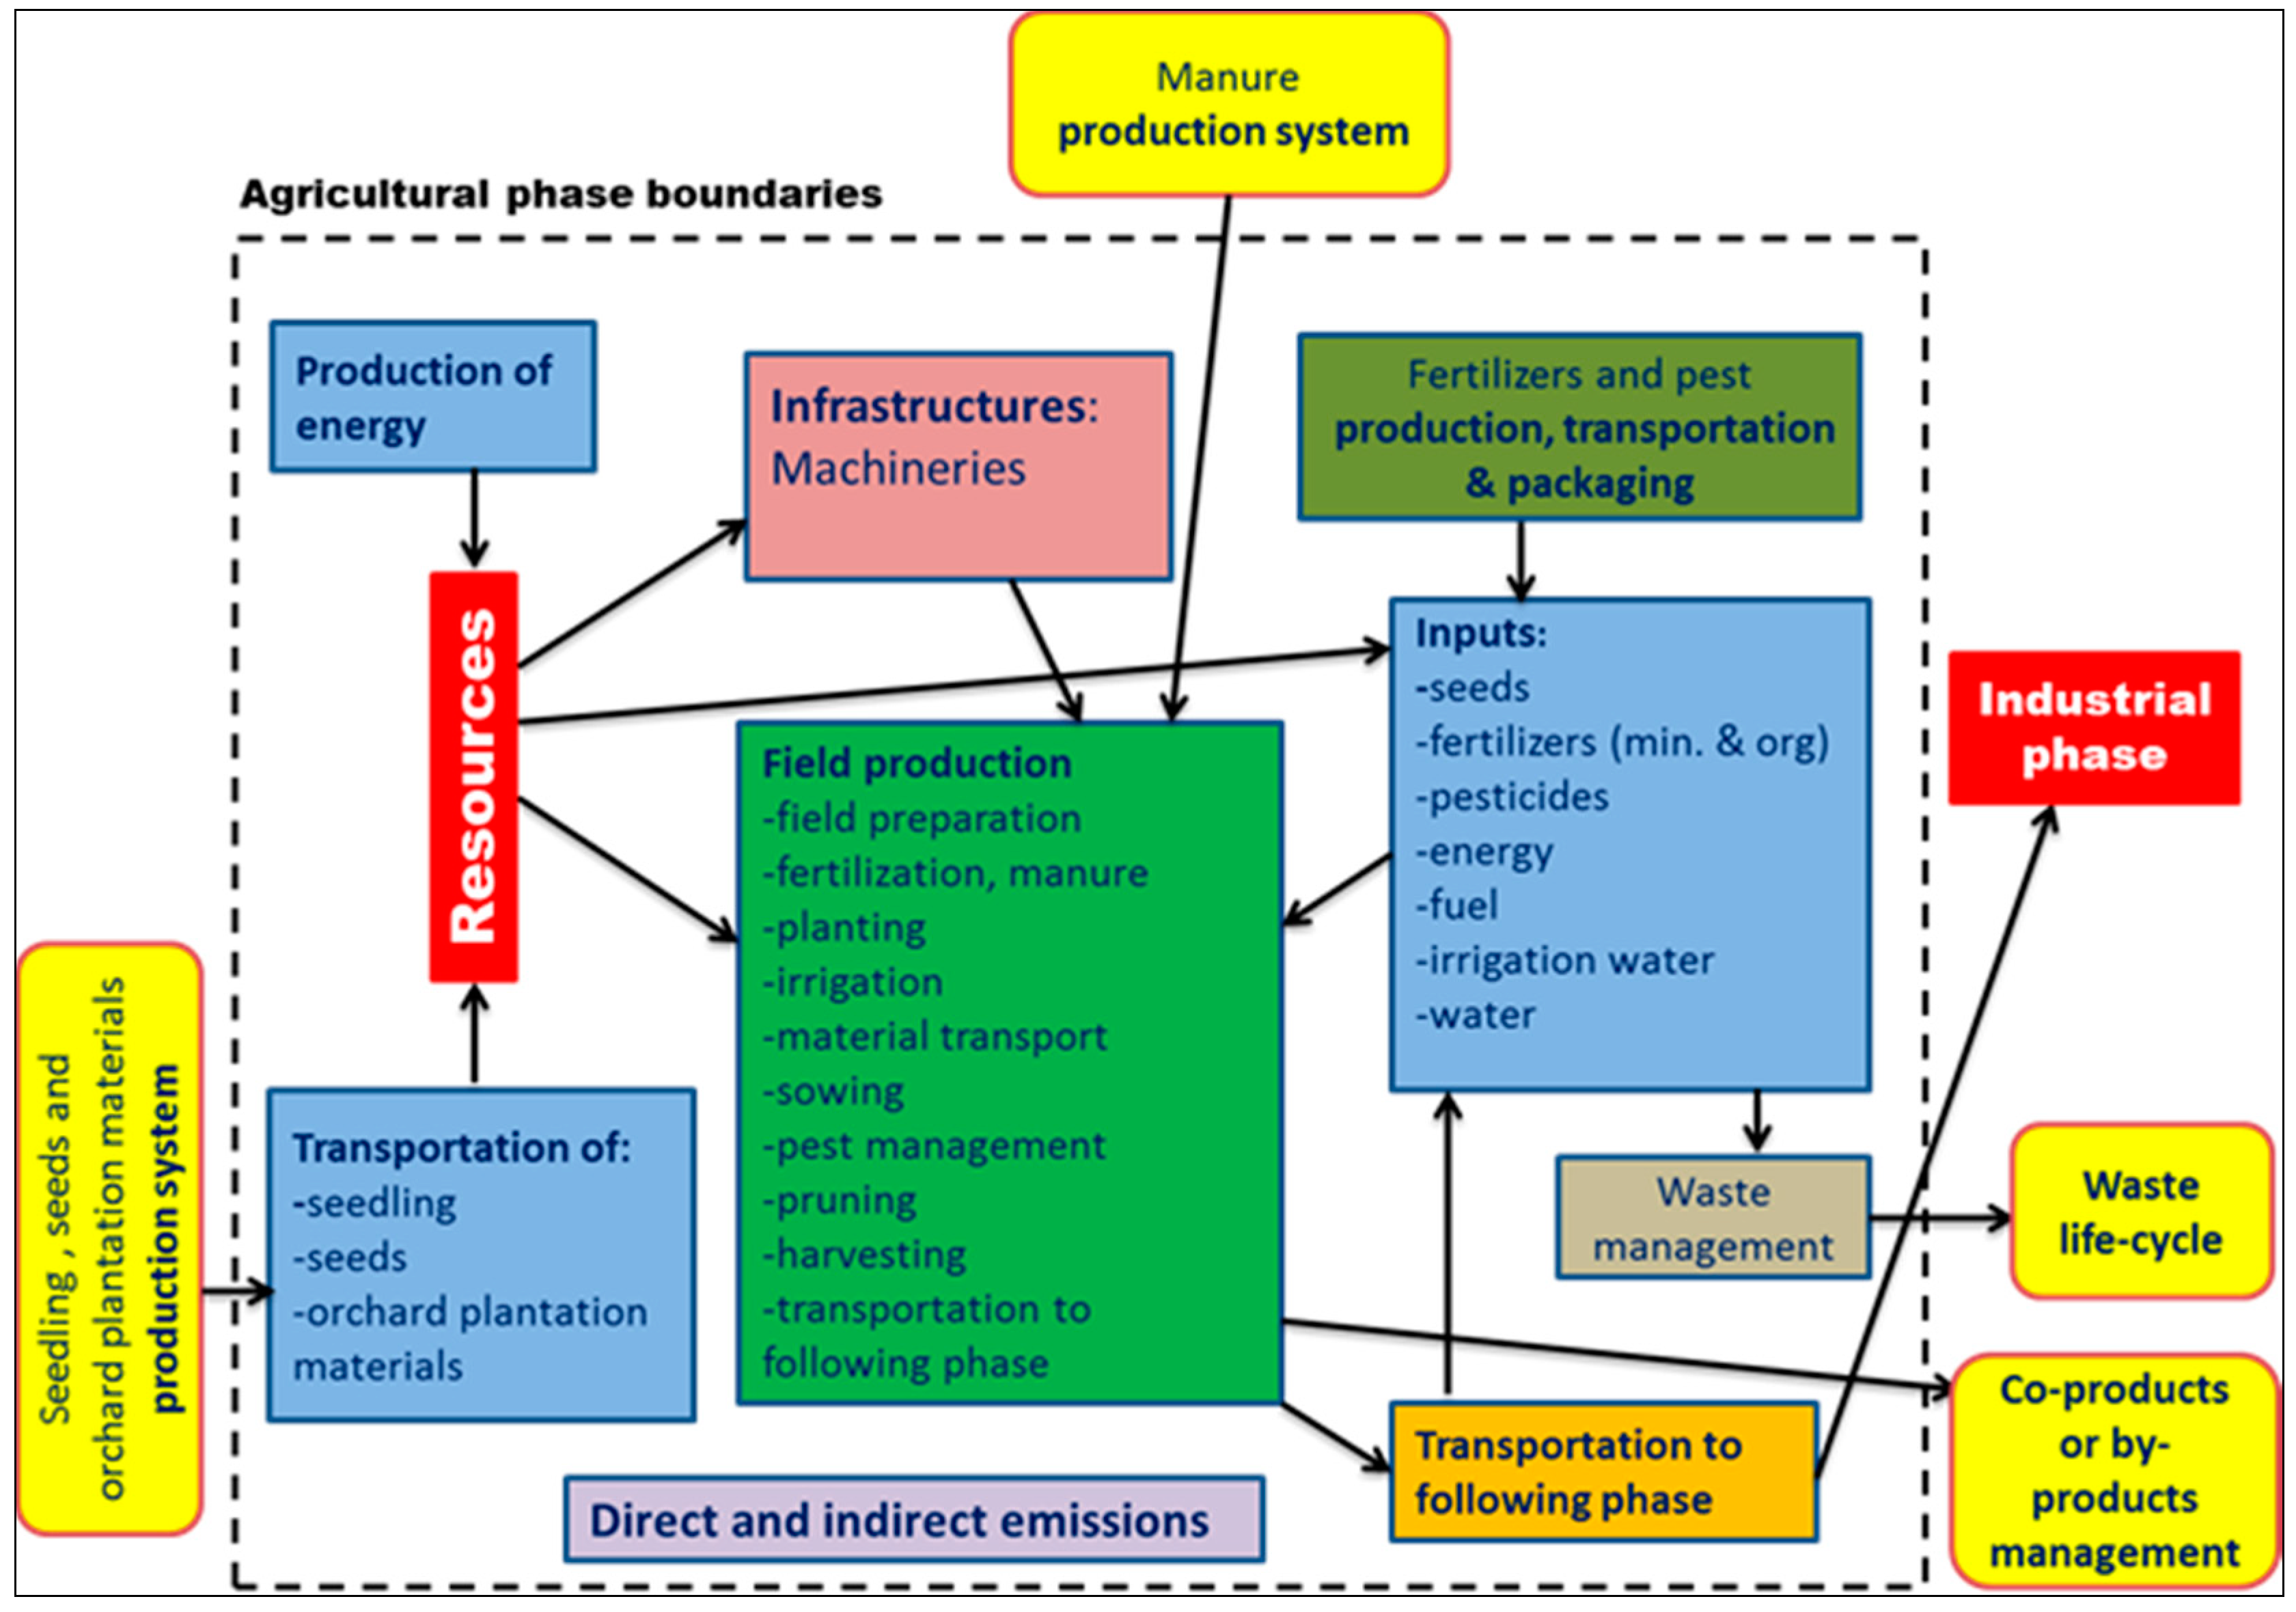
2.3. Functional Unit, System Boundaries and Assumptions
2.4. Land Use and Crop Yields
2.5. Data Collection and Life Cycle Inventory (LCI)

| Process stages | Process sub-stages | Tomato | Apple | Pear | Wheat | Chicory |
|---|---|---|---|---|---|---|
| 1. Land occupation | Land occupation and cultivation method | ■ | ■ | ■ | ■ | ■ |
| 2. Field operations | Orchard plantation | ■ | ■ | |||
| Seedlings transplanting | ■ | ■ | ||||
| Ploughing | ■ | ■ | ■ | |||
| Harrowing | ■ | ■ | ■ | |||
| Hoeing | ■ | ■ | ||||
| Pre-cultivation fertilization | ■ | ■ | ■ | |||
| Sowing | ■ | |||||
| Irrigating | ■ | ■ | ■ | ■ | ||
| Fertilizing | ■ | ■ | ■ | ■ | ■ | |
| Application of plant protection products | ■ | ■ | ■ | ■ | ■ | |
| Pruning | ■ | ■ | ||||
| Wood chopping | ■ | |||||
| Grass cutting | ■ | ■ | ||||
| Harvesting | ■ | ■ | ■ | ■ | ■ | |
| 3. Fertilizers production and packaging | Production of fertilizers and packaging materials | ■ | ■ | ■ | ■ | ■ |
| 4. Pesticides production and packaging | Production of pesticides and packaging materials | ■ | ■ | ■ | ■ | ■ |
| 5. Transportation | of fertilizers from supplier to the farm gate | ■ | ■ | ■ | ■ | ■ |
| of pesticides from supplier to the farm gate | ■ | ■ | ■ | ■ | ■ | |
| of seeds, seedlings or orchard plant. materials to the farm gate | ■ | ■ | ■ | ■ | ■ | |
| to the subsequent phase | ■ | ■ | ■ | ■ | ■ | |
| personnel transportations within the farms | ■ | ■ | ■ | ■ | ■ | |
| 6. Other resources | Electricity from grid | ■ | ■ | ■ | ■ | ■ |
| Electricity from renewable | ■ | |||||
| Fuel (diesel oil and/or gasoline) | ■ | ■ | ■ | ■ | ■ | |
| Tap water | ■ | ■ | ■ | ■ | ■ | |
| Water from river | ■ | ■ |
| Process | Input | Unit | Tomato | Apple | Pear | Wheat | Chicory |
|---|---|---|---|---|---|---|---|
| Land occupation | Soil surface | ha | 450 | 170 | 150 | 590 | 140 |
| Yield | kg/ha | 88,000 | 53,800 | 30,000 | 7200 | 20,000 | |
| Field operations | Diesel | kg/ha | 572 | 803 | 4000 | 60 | 200 |
| Gasoline | kg | - | - | - | - | - | |
| Electricity | MJ | - | - | 38 | - | - | |
| Water | m3/ha | 6000 | 12,700 | 2500 | - | 1250 | |
| Machine time | h/ha | 170 | 188 | 270 | 8 | 40 | |
| Wood pole | kg/ha | - | 120 | - | - | - | |
| Cement pole | kg/ha | - | - | 250 | - | -- | |
| Metallic devices | kg/ha | - | 230 | 54 | - | - | |
| Irrigating tube (PE) | kg/ha | - | - | 35 | - | - | |
| Seeds production and packaging | Seeds | kg/ha | - | - | - | 200 | - |
| Packaging (Bag, PE) | kg/ha | - | - | - | 2 | - | |
| Fertilizers production and packaging | Chemical N | kg/ha | - | 270 | - | 500 | 800 |
| Chemical P | kg/ha | - | 40 | - | - | ||
| Organic N | kg/ha | 1020 | - | 800 | - | 5000 | |
| Packaging (Bottle, PE) | kg/ha | 1 | - | 3 | - | ||
| Packaging (Bag, PE) | kg/ha | 3 | 1 | 2 | 2 | 3 | |
| Pesticides production and packaging | Pesticides | kg/ha | - | 80 | - | 6 | 10 |
| Pesticides of natural origin | kg/ha | 24 | - | 65 | - | - | |
| Packaging (Bottle, PE) | kg/ha | 1 | 5 | 5 | 1 | 2 | |
| Packaging (Paper bag) | kg/ha | 1 | - | 2 | - | 1 | |
| Transportation | Diesel | kg | 100 | 200 | 430 | 120 | 800 |
| Other resources | Electricity | MJ/year | 2520 | 4320 | 7500 | 12,000 | 2000 |
| Fuel | kg/year | 2000 | 3000 | 2300 | 7000 | 1650 | |
| Water | m3/year | 600 | 800 | 300 | 6000 | 750 |
2.6. Allocation
2.7. LCA Impact Categories
3. Results and Discussion
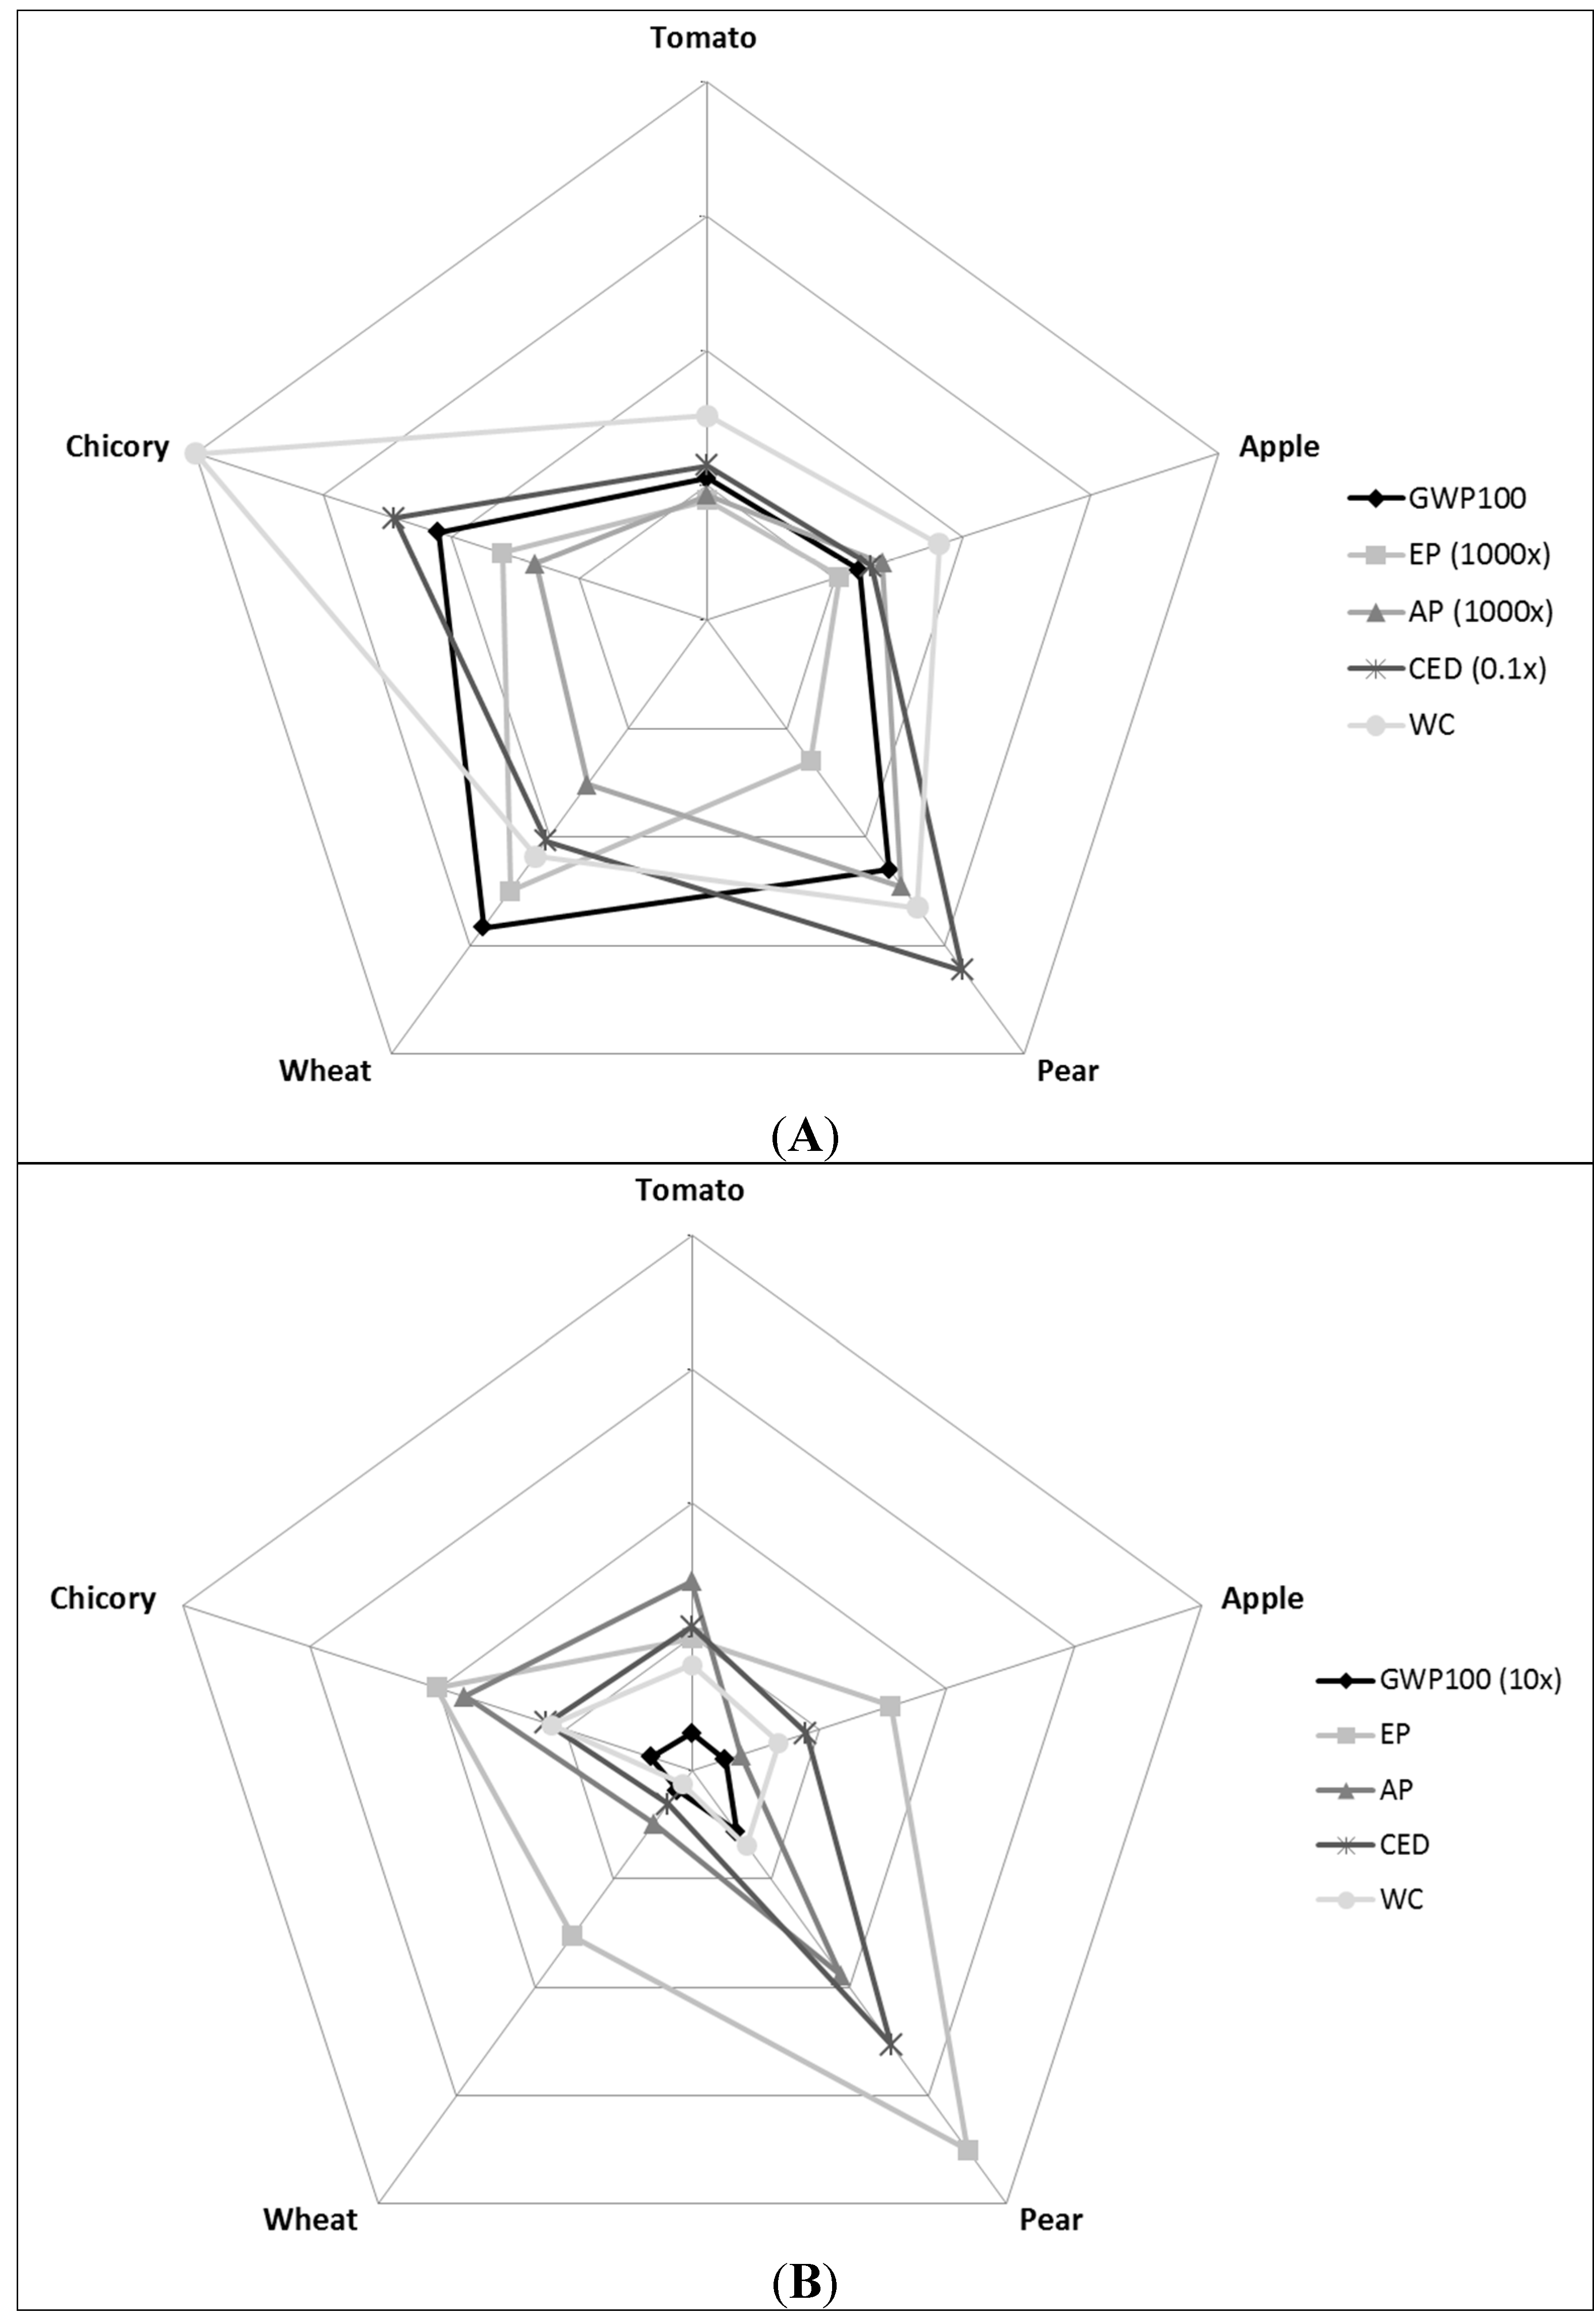
3.1. LCA
| Tomato | Apple | Pear | Wheat | Chicory | |
|---|---|---|---|---|---|
| Land occupation (%) | 58.4 | 100 | 100 | 60.0 | 42.0 |
| GWP100 (kg CO2 eq.) | 6.30 × 10⁻² | 9.70 × 10⁻² | 3.76 × 10⁻¹ | 5.09 × 10⁻¹ | 3.27 × 10⁻¹ |
| EP (kg PO43− eq.) | 2.25 × 10⁻⁴ | 5.80 × 10⁻⁴ | 1.26 × 10⁻³ | 4.24 × 10⁻³ | 2.01 × 10⁻³ |
| AP (kg SO2 eq.) | 3.22 × 10⁻⁴ | 1.42 × 10⁻³ | 4.13 × 10⁻³ | 1.79 × 10⁻³ | 1.36 × 10⁻³ |
| CED (MJ) | 8.69 × 10⁻¹ | 12.00 × 10⁻¹ | 60.72 × 10⁻¹ | 30.98 × 10⁻¹ | 41.20 × 10⁻¹ |
| WC (m3) | 1.80 × 10⁻¹ (0.33 × 10⁻¹) | 2.53 × 10⁻¹ (0.07 × 10⁻¹) | 4.63 × 10⁻¹ (0.08 × 10⁻¹) | 3.45 × 10⁻¹ (0) | 11.09 × 10⁻¹ (0.80 × 10⁻¹) |
| HTP (kg 1–4, DB eq.) | 6.80 × 10⁻² | 1.47 × 10⁻¹ | 1.69 × 10⁻² | 1.33 × 10⁻¹ | 2.48 × 10⁻¹ |
| ETP (kg 1–4, DB eq.) | 33.61 | 87.70 | 58.14 | 68.49 | 123.36 |
| marine aquatic | 33.56 | 87.53 | 58.05 | 68.46 | 123.29 |
| freshwater aquatic | 4.25 × 10⁻² | 1.66 × 10⁻¹ | 8.70 × 10⁻² | 2.90 × 10⁻² | 7.10 × 10⁻² |
| terrestrial aquatic | 8.57 × 10⁻⁴ | 3.37 × 10⁻³ | 1.00 × 10⁻³ | 9.82 × 10⁻⁴ | 1.16 × 10⁻³ |
| ARD (kg Sb eq.) | 3.59 × 10⁻⁴ | 5.01 × 10⁻⁴ | 2.36 × 10⁻³ | 1.18 × 10⁻³ | 1.59 × 10⁻³ |

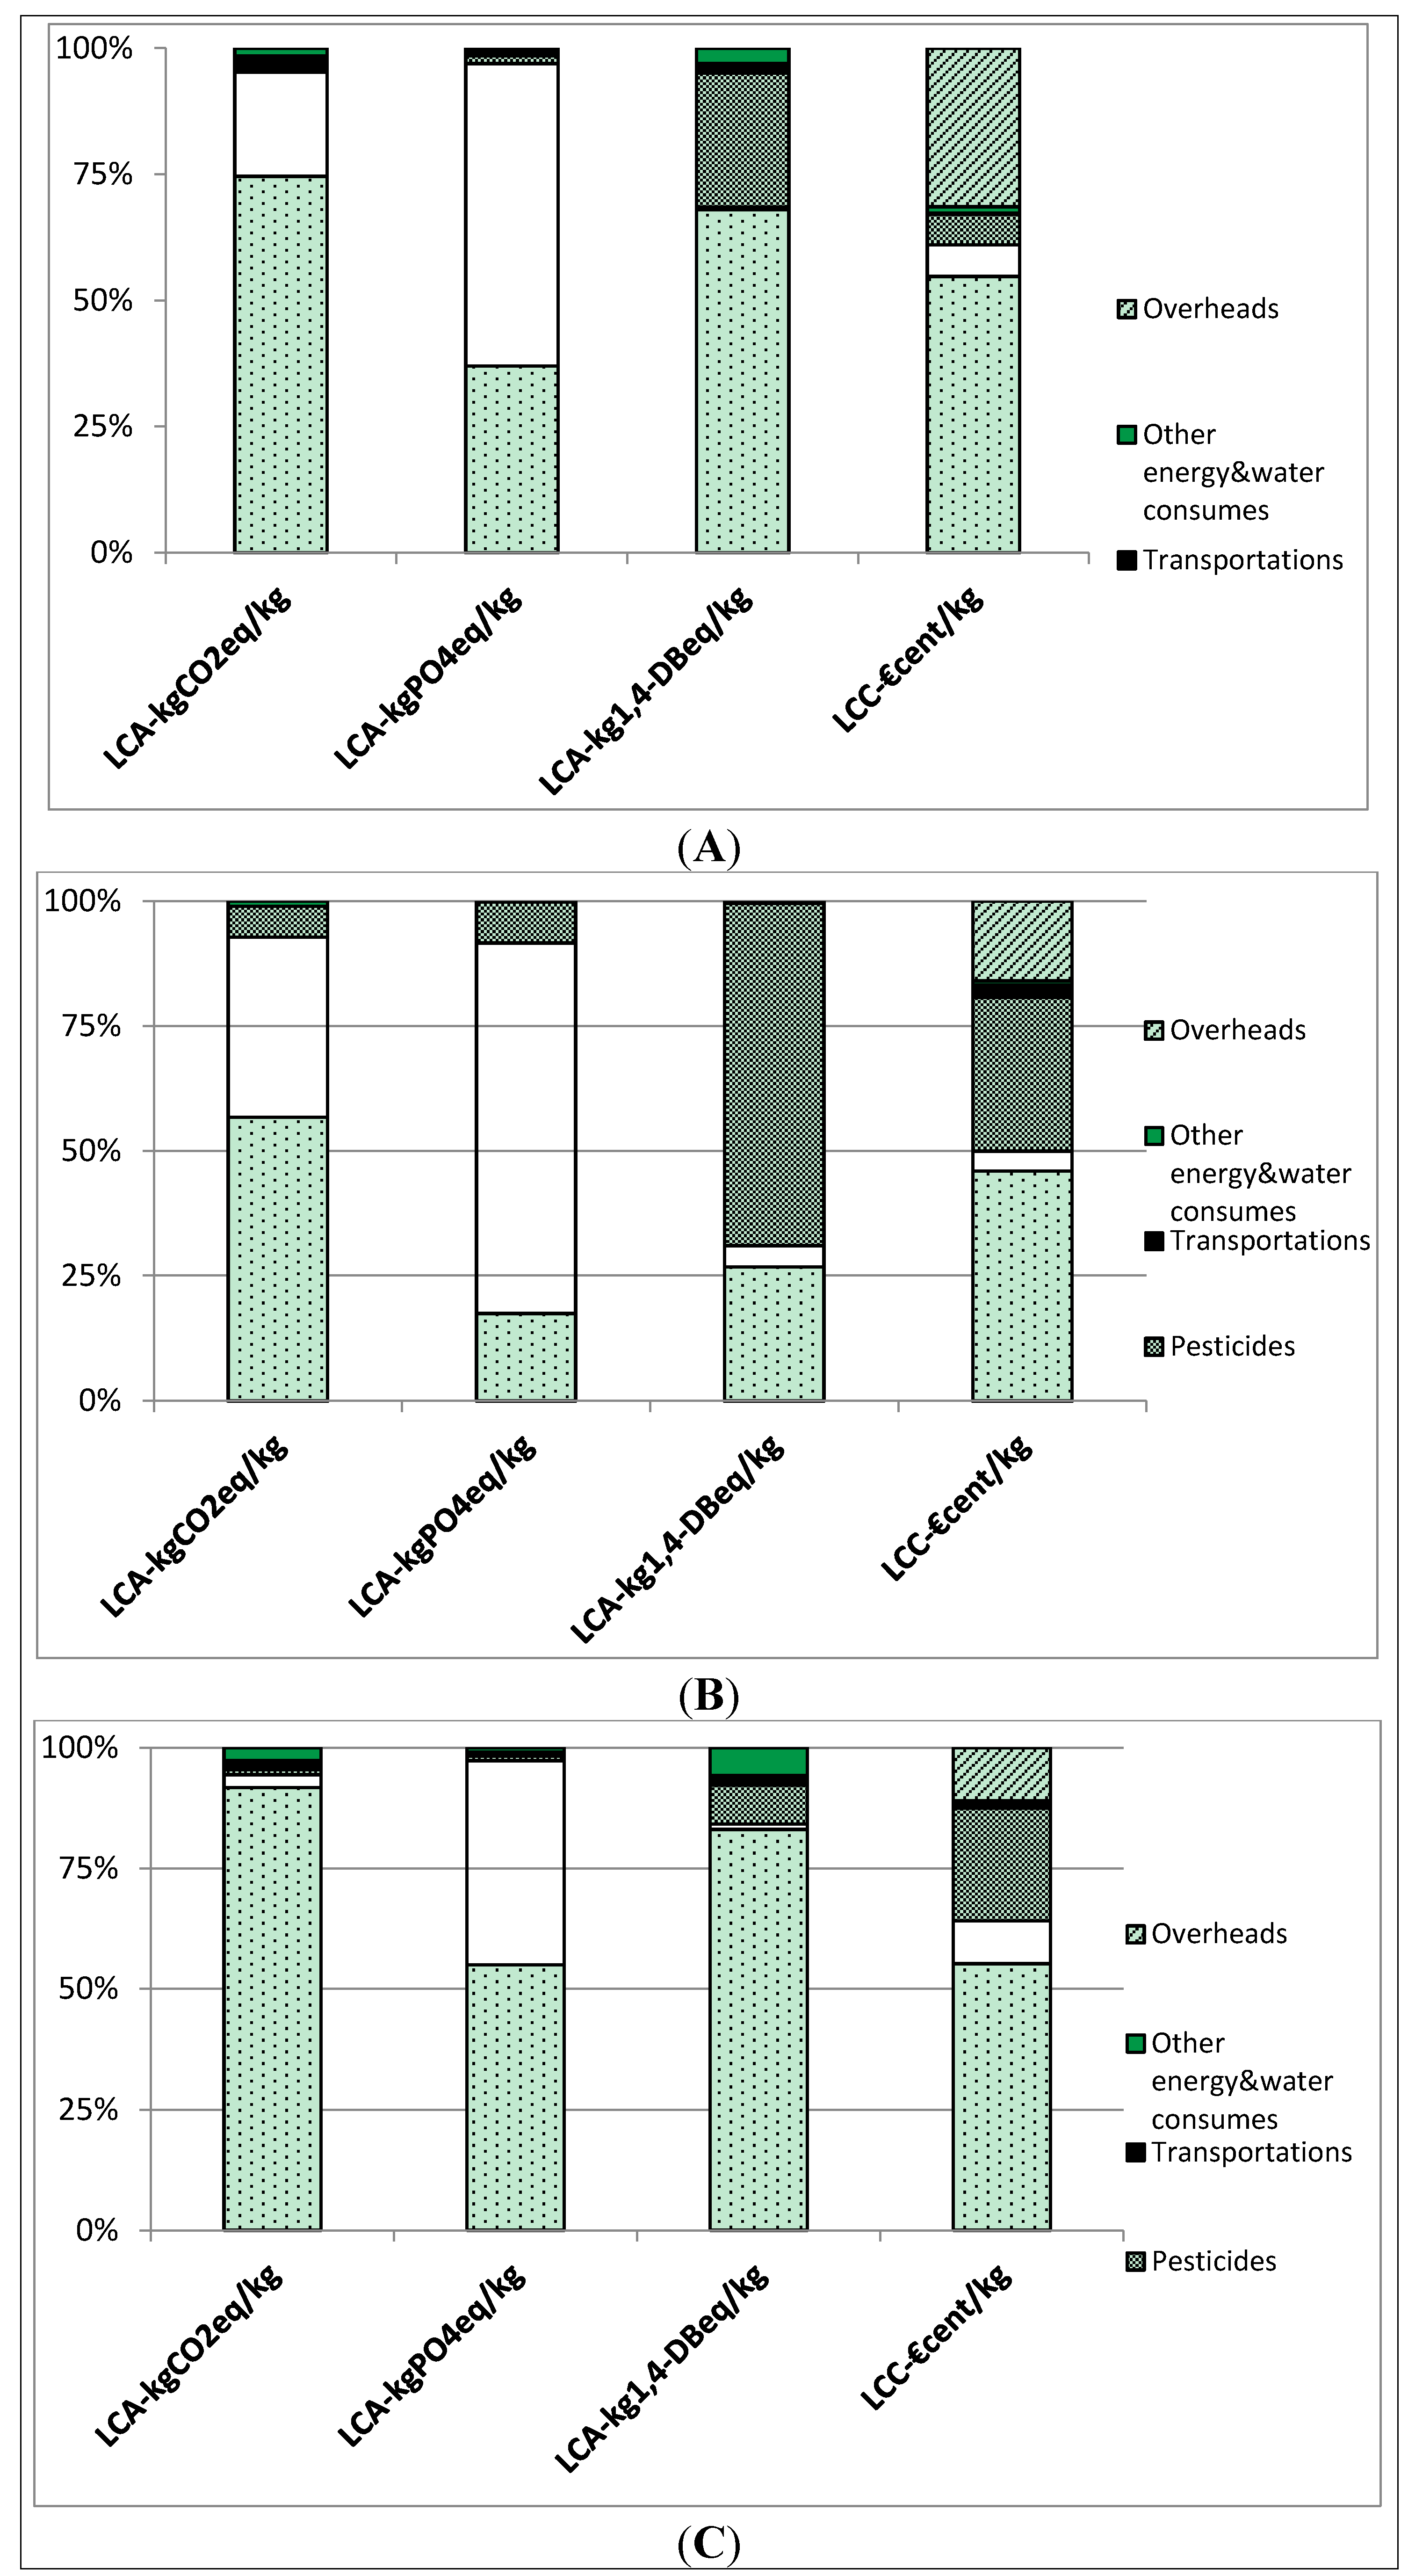
3.2. LCC
| Tomato | Apple | Pear | Wheat | Chicory | |
|---|---|---|---|---|---|
| Cost of field operations | 1.27 | 2.29 | 20.41 | 5.23 | 13.51 |
| Orchard plantation | - | 0.67 | 0.77 | - | - |
| Seeds | - | - | - | 1.55 | - |
| Machineries | 0.56 | 1.05 | 5.70 | 1.75 | 11.13 |
| Fuel | 0.71 | 0.57 | 13.97 | 0.60 | 0.80 |
| Labor | 1.36 | 1.36 | 3.28 | 1.33 | 1.58 |
| Cost of fertilizers | 0.30 | 0.32 | 3.83 | 2.21 | 1.62 |
| Cost of pesticides | 0.29 | 2.45 | 10.04 | 1.92 | 1.70 |
| Cost of transports | 0.01 | 0.19 | 0.56 | 0.35 | 0.81 |
| Cost of other resources | 0.06 | 0.07 | 0.07 | 0.08 | 0.26 |
| Cost of overheads | 1.51 | 1.27 | 4.75 | 1.71 | 3.55 |
| Total costs of life cycle | 4.80 | 7.95 | 42.96 | 11.50 | 21.45 |
3.3. Integrated LCC and LCA
| Tomato | Apple | Pear | Wheat | Chicory | |
|---|---|---|---|---|---|
| Modeled fertilizers emissions (kg-N/kg) | 3.29 × 10⁻⁴ | 10.05 × 10⁻⁴ | 15.63 × 10⁻⁴ | 97.17 × 10⁻⁴ | 41.87 × 10⁻⁴ |
| Externalities calculated from fertilizers emissions (€cent/kg) | 1.38 | 4.23 | 6.58 | 40.93 | 17.62 |
| Modeled pesticides emissions (kg-active ingredients/kg) | 2.86 × 10⁻⁴ | 14.09 × 10⁻⁴ | 8.12 × 10⁻⁴ | 19.22 × 10⁻⁴ | 16.54 × 10⁻⁴ |
| Externalities calculated from pesticides emissions (€cent/kg) | 1.42 | 7.05 | 4.06 | 96.41 | 32.70 |


4. Conclusions
Acknowledgments
Author Contributions
Conflicts of Interest
References
- Brown, L.R. Challenges of the New Century. In State of the World 2000; Starke, L., Ed.; Norton & Company: Washington, DC, USA, 2000; pp. 3–21. [Google Scholar]
- International Energy Agency. World Energy Outlook 2014; OECD/IEA Publication: Paris, France, 2014. [Google Scholar]
- Chappell, M.J.; La Valle, L.A. Food Security and Biodiversity: Can We Have Both? An Agroecological Analysis. Agric. Hum. Values 2011, 28, 3–26. [Google Scholar] [CrossRef]
- Tilman, D.; Cassman, K.G.; Matson, P.A.; Naylor, R.; Polasky, S. Agricultural sustainability and intensive production practices. Nature 2002, 418, 671–677. [Google Scholar] [CrossRef] [PubMed]
- Gómez-Limón, J.A.; Sanchez-Fernandez, G. Empirical evaluation of agricultural sustainability using composite indicators. Ecol. Econ. 2010, 69, 1062–1075. [Google Scholar] [CrossRef]
- Kulak, M.; Nemecek, T.; Frossard, E.; Gaillard, G. How Eco-Efficient Are Low-Input Cropping Systems in Western Europe, and What Can Be Done to Improve Their Eco-Efficiency? Sustainability 2013, 5, 3722–3743. [Google Scholar] [CrossRef]
- Börjesson, P.; Tufvesson, L.M. Agricultural crop-based biofuels—Resource efficiency and environmental performance including direct land use changes. J. Clean. Prod. 2011, 19, 108–120. [Google Scholar] [CrossRef]
- Nemecek, T.; Dubois, D.; Huguenin-Elie, O.; Gaillard, G. Life cycle assessment of Swiss farming systems: I. Integrated and organic farming. Agric. Syst. 2011, 104, 217–232. [Google Scholar] [CrossRef]
- Ruviaro, C.F.; Gianezini, M.; Brandão, F.S.; Winck, C.A.; Dewes, H. Life cycle assessment in Brazilian agriculture facing worldwide trends. J. Clean. Prod. 2012, 28, 9–24. [Google Scholar] [CrossRef]
- Bare, J.C. Life cycle impact assessment research developments and needs. Clean Technol. Environ. Policy 2010, 12, 341–351. [Google Scholar] [CrossRef]
- Environmental Management—Life Cycle Assessment—Requirements and Guidelines; ISO 14044–2006; International Organization for Standardization: Geneva, Switzerland, 2006.
- Hunkeler, D.; Lichtenvort, K.; Rebitzer, G. Environmental Life Cycle Costing; CRC Press: Boca Raton, FL, USA, 2008. [Google Scholar]
- Dreyer, L.; Hauschild, M.; Schierbeck, J. A framework for social life cycle impact assessment. Int. J. Life Cycle Assess. 2006, 11, 88–97. [Google Scholar] [CrossRef]
- Zamagni, A. Life cycle sustainability assessment. Int. J. Life Cycle Assess. 2012, 17, 373–376. [Google Scholar] [CrossRef]
- Sala, S.; Farioli, F.; Zamagni, A. Life cycle sustainability assessment in the context of sustainability science progress (part 2). Int. J. Life Cycle Assess. 2013, 18, 1686–1697. [Google Scholar] [CrossRef]
- Norris, G.A. Integrating Life Cycle Cost Analysis and LCA. Int. J. Life Cycle Assess. 2001, 6, 118–120. [Google Scholar]
- Swarr, E.T.; Hunkeler, D.; Klopffer, W.; Pesonen, H.-L.; Ciroth, A.; Brent, A.C.; Pagan, R. Environmental life-cycle costing: A code of practice. Int. J. Life Cycle Assess. 2011, 16, 389–391. [Google Scholar] [CrossRef]
- Shapiro, K.G. Incorporating Costs in LCA. Int. J. Life Cycle Assess. 2001, 6, 121–123. [Google Scholar]
- Kruse, S.A.; Flysjö, A.; Kasperczyk, N.; Scholz, A.J. Socioeconomic indicators as a complement to life cycle assessment—An application to salmon production systems. Int. J. Life Cycle Assess. 2009, 14, 8–18. [Google Scholar] [CrossRef]
- Jørgensen, A.; le Bocq, A.; Nazarkina, L.; Hauschild, M. Methodologies for social life cycle assessment. Int. J. Life Cycle Assess. 2008, 13, 96–103. [Google Scholar] [CrossRef]
- Hunkeler, D. Societal LCA methodology and case study. Int. J. Life Cycle Assess. 2006, 11, 371–382. [Google Scholar] [CrossRef]
- Norris, G. Social impacts in products life cycles towards life cycle attribute assessment. Int. J. Life Cycle Assess. 2006, 11, 97–104. [Google Scholar] [CrossRef]
- Andrews, E.S. Guidelines for Social Life Cycle Assessment of Products; Benoit, C., Ed.; United Nations Environment Programme: Nairobi, Kenya, 2009. [Google Scholar]
- Pretty, J.N.; Brett, C.; Gee, D.; Hine, R.E.; Mason, C.F.; Morison, J.I.L.; Raven, H.; Rayment, M.D.; van der Bijl, G. An assessment of the total external costs of UK agriculture. Agric. Syst. 2000, 65, 113–136. [Google Scholar] [CrossRef]
- Abramovitz, J. Valuing nature’s services. In State of the World; Brown, L., Flavin, C., French, H., Eds.; Worldwatch Institute: Washington, DC, USA, 1997; pp. 95–114. [Google Scholar]
- Bailey, A.P.; Rehman, T.; Park, J.; Keatinge, J.D.H.; Tranter, R.B. Towards a method for the economic evaluation of environmental indicators for UK integrated arable farming systems. Agric. Ecosyst. Environ. 1999, 72, 145–158. [Google Scholar] [CrossRef]
- Tegtmeier, E.M.; Duffy, M.D. External costs of agricultural production in the United States. Int. J. Agric. Sustain. 2004, 2, 1–20. [Google Scholar] [CrossRef]
- Blengini, G.A.; Busto, M. The life cycle of rice: LCA of alternative agri-food chain management systems in Vercelli (Italy). J. Environ. Manag. 2009, 90, 1512–1522. [Google Scholar] [CrossRef]
- Salomone, R.; Ioppolo, G. Environmental impacts of olive oil production: A Life Cycle Assessment case study in the province of Messina (Sicily). J. Clean. Prod. 2012, 28, 88–100. [Google Scholar] [CrossRef]
- Cellura, M.; Longo, S.; Mistretta, M. Life Cycle Assessment (LCA) of protected crops: An Italian case study. J. Clean. Prod. 2010, 28, 56–62. [Google Scholar] [CrossRef]
- Willer, H. Organic Farming in Europe. In The World of Organic Agriculture. Statistics and Emerging Trends; Willer, H., Lernoud, J., Eds.; FIBL: Frick, Switzerland, 2014. [Google Scholar]
- Cerutti, A.; Sander, B.; Beccaro, G.L.; Bounous, G. A review of studies applying environmental impact assessment methods on fruit production systems. J. Environ. Manag. 2011, 92, 2277–2286. [Google Scholar] [CrossRef]
- Van der Werf, H.M.G.; Tzilivakis, J.; Lewis, K.; Basset-Mens, C. Environmental impacts of farm scenarios according to five assessment methods. Agric. Ecosyst. Environ. 2007, 118, 327–338. [Google Scholar] [CrossRef]
- Statistics for Energy, 2011. Ministry of Economic Development, Italy, 2012. Available online: http://dgerm.sviluppoeconomico.gov.it (accessed on 15 December 2014).
- Koerber, G.R.; Edwards-Jones, G.; Hill, P.W.; Milà i Canals, L.; Nyeko, P.; York, E.H.; Jones, D.L. Geographical variation in carbon dioxide fluxes from soils in agro-ecosystems and its implications for life-cycle assessment. J. Appl. Ecol. 2009, 46, 306–314. [Google Scholar] [CrossRef]
- Bosco, S.; di Bene, C.; Galli, M.; Remorini, D.; Massai, R.; Bonari, E. Greenhouse gas emissions in the agricultural phase of wine production in the Maremma rural district in Tuscany, Italy. Ital. J. Agron. 2011, 6, 93–100. [Google Scholar]
- Hischier, R.; Weidema, B. Implementation of Life Cycle Impact Assessment Methods. In Ecoinvent Report No.3; Weidema, B., Hischier, R., Eds.; Ecoinvent Center: Bern, Switzerland, 2010. [Google Scholar]
- Nemecek, T.; Heil, A.; Huguenin, O.; Meier, S.; Erzinger, S.; Blaser, S.; Zimmermann, A. Life cycle inventories of agricultural production systems. Data v2. 0. Available online: http://db.ecoinvent.org/reports/15_Agriculture.pdf (accessed on 17 December 2014).
- ARPA. Regional Yearbook of Climate, 2011; ARPA: Rimini, Italy, 2012. [Google Scholar]
- ISPRA. Agriculture: National emission inventory and NUTS 3 level disaggregation. In ISPRA Report 85/2008; Istituto Superiore per la Protezione e la Ricerca Ambientale (ISPRA): Lombardy, Italy, 2008. [Google Scholar]
- IPCC. Prepared by the National Greenhouse Gas Inventories Programme. In IPCC Guidelines for National Greenhouse Gas Inventories; Eggleston, H.S., Buendia, L., Miwa, K., Ngara, T., Tanabe, K., Eds.; IGES: Kanagawa, Japan, 2006; pp. 159–245. [Google Scholar]
- Mackay, D.; Shiu, W.Y.; Ma, K.C. Pesticide chemicals. In Illustrated Handbook of Physical-Chemical Properties and Environmental Fate for Organic Chemicals; Lewis publishers: Boca Raton, FL, USA, 1997. [Google Scholar]
- Luo, L.; van der Voet, E.; Huppes, G. Life cycle assessment and life cycle costing of bioethanol from sugarcane in Brazil. Renew. Sustain. Energy Rev. 2009, 13, 1613–1619. [Google Scholar] [CrossRef]
- Oi, W.Y. Labor as a Fixed Factor. J. Polit. Econ. 1962, 70, 538–555. [Google Scholar] [CrossRef]
- Becker, S.O.; Ekholm, K.; Jäckle, R.; Muendler, M.A. Location Choice and Employment Decisions. Rev. World Econ. 2005, 141, 693–731. [Google Scholar] [CrossRef]
- Hulme, P.E.; Roy, D.; Cunha, T.; Larsson, T.B. A pan-European inventory of alien species: Rationale, implementation and implications for managing biological invasions. In The Handbook of Alien Species in Europe; DAISIE, Ed.; Springer: Berlin, Germany, 2008; pp. 1–18. [Google Scholar]
- Skinner, C.; Gattinger, A.; Muller, A.; Mäder, P.; Flieβbach, A.; Stolze, M.; Ruser, R.; Niggli, U. Greenhouse gas fluxes from agricultural soils under organic and non-organic management—A global meta-analysis. Sci. Total Environ. 2014, 468, 553–563. [Google Scholar] [CrossRef] [PubMed]
- Cellura, M.; Ardente, F.; Longo, S. From the LCA of food products to the environmental assessment of protected crops districts: A case-study in the south of Italy. J. Environ. Manag. 2012, 93, 194–208. [Google Scholar] [CrossRef]
- Carlsson-Kanayma, M.P.; Ekstrom, H. Food and life cycle energy inputs: Consequences of diet and ways to increase efficiency. Ecol. Econ. 2003, 44, 293–307. [Google Scholar] [CrossRef]
- Williams, A.G.; Audsley, E.; Sandars, D.L. Determining the environmental burdens and resource use in the production of agricultural and horticultural commodities. In Main Report. Defra Research Project IS0205; Cranfield University and Defra: Bedford, UK, 2005. [Google Scholar]
- Liu, Y.; Langer, V.; Høgh-Jensen, H.; Egelyng, H. Life Cycle Assessment of fossil energy use and greenhouse gas emissions in Chinese pear production. J. Clean. Prod. 2010, 18, 1423–1430. [Google Scholar] [CrossRef]
- Milà i Canals, L.; Muñoz, I.; McLaren, S.J.; Brandão, M. LCA Methodology and Modelling Considerations for Vegetable Production and Consumption; CES Working Paper 02/07; Milà i Canals, L., Ed.; Centre for Environmental Strategy, University of Surrey: Guildford, UK, 2007; pp. 9–31. [Google Scholar]
- Cerutti, A.K.; Beccaro, G.L.; Bagliani, M.; Donno, D.; Bounous, G. Multifunctional ecological footprint analysis for assessing eco-efficiency: A case study of fruit production systems in Northern Italy. J. Clean. Prod. 2013, 40, 108–117. [Google Scholar] [CrossRef]
- Freney, J.R. Emission of nitrous oxide from soils used for agriculture. Nutr. Cycl. Agroecosyst. 1997, 49, 1–6. [Google Scholar] [CrossRef]
- Pelletier, N.; Arsenault, N.; Tyedmers, P. Scenario modeling potential eco-efficiency gains from a transition to organic agriculture: Life cycle perspectives on Canadian canola, corn, soy, and wheat production. Environ. Manag. 2008, 42, 989–1001. [Google Scholar] [CrossRef]
- HDR Engineering, Inc. Handbook of Public Water Systems; John Wiley and Sons, Inc.: Chicester, UK, 2001. [Google Scholar]
- Bilancio Energetico Nazionale, 2011; Ministry of Economic Development, Energy Department: Rome, Italy, 2012.
- Milà i Canals, L.; Chenoweth, J.; Chapagain, A.; Orr, S.; Anton, A.; Clift, R. Assessing freshwater use impacts in LCA: Part I-inventory modeling and characterization factors for the main impact pathways. Int. J. Life Cycle Assess. 2009, 14, 28–42. [Google Scholar] [CrossRef]
- Hernandez-Ramirez, G.; Brouder, S.M.; Ruark, M.D.; Turco, R.F. Nitrate, phosphate, and ammonium loads at subsurface drains: Agroecosystems and nitrogen management. J. Environ. Qual. 2011, 40, 1229–1240. [Google Scholar] [CrossRef] [PubMed]
- Tuomisto, H.L.; Hodge, I.D.; Riordan, P.; Macdonald, D.W. Does organic farming reduce environmental impacts?—A meta-analysis of European research. J. Environ. Manag. 2012, 112, 309–320. [Google Scholar] [CrossRef]
- Audsley, E.; Alber, S.; Clift, R.; Cowell, S.; Crettaz, P.; Gaillard, G.; Hausheer, J.; Jolliet, O.; Kleijn, R.; Mortensen, B.; et al. Harmonisation of Environmental Life Cycle Assessment for Agriculture, Final Report; Concerted Action AIR3-CT94-2028; CE DG VI-Centre de documentation: Gothenburg, Sweden, 2008. [Google Scholar]
- Tsuda, K.; Hara, K.; Uwasu, M. Prospects and Challenges for Disseminating Life Cycle Thinking towards Environmental Conscious Behaviors in Daily Lives. Sustainability 2013, 5, 123–135. [Google Scholar] [CrossRef]
- Wu, R.; Yang, D.; Chen, J. Social Life Cycle Assessment Revisited. Sustainability 2014, 7, 4200–4222. [Google Scholar] [CrossRef]
- Pretty, J.; Brett, C.; Gee, D.; Hine, R.; Mason, C.; Morison, J.M. Policy Challenges and Priorities for Internalizing the Externalities of Modern Agriculture. J. Environ. Plan. Manag. 2001, 44, 363–383. [Google Scholar] [CrossRef]
- Sala, S.; Pant, R.; Hauschild, M.; Pennington, D. Research needs and challenges from science to decision support. Lesson learnt from the development of the international reference life cycle data system (ILCD) recommendations for life cycle impact assessment. Sustainability 2012, 4, 1412–1425. [Google Scholar] [CrossRef] [Green Version]
- Bo, P.; Weidema, B. The integration of economic and social aspects in Life Cycle Impact Assessment. Int. J. Life Cycle Assess. 2006, 11, 89–96. [Google Scholar] [CrossRef]
- Shakhramanyan, N.G.; Schneider, U.A.; McCarl, B.A. US agricultural sector analysis on pesticide externalities—The impact of climate change. Clim. Change 2013, 117, 711–723. [Google Scholar] [CrossRef]
© 2015 by the authors; licensee MDPI, Basel, Switzerland. This article is an open access article distributed under the terms and conditions of the Creative Commons Attribution license (http://creativecommons.org/licenses/by/4.0/).
Share and Cite
Tamburini, E.; Pedrini, P.; Marchetti, M.G.; Fano, E.A.; Castaldelli, G. Life Cycle Based Evaluation of Environmental and Economic Impacts of Agricultural Productions in the Mediterranean Area. Sustainability 2015, 7, 2915-2935. https://doi.org/10.3390/su7032915
Tamburini E, Pedrini P, Marchetti MG, Fano EA, Castaldelli G. Life Cycle Based Evaluation of Environmental and Economic Impacts of Agricultural Productions in the Mediterranean Area. Sustainability. 2015; 7(3):2915-2935. https://doi.org/10.3390/su7032915
Chicago/Turabian StyleTamburini, Elena, Paola Pedrini, Maria Gabriella Marchetti, Elisa Anna Fano, and Giuseppe Castaldelli. 2015. "Life Cycle Based Evaluation of Environmental and Economic Impacts of Agricultural Productions in the Mediterranean Area" Sustainability 7, no. 3: 2915-2935. https://doi.org/10.3390/su7032915