Article

Profit Distribution in Guaranteed Savings Contracts: Determination Based on the Collar Option Model

1
Sustainable Building Research Center, Hanyang University, 55 Hanyangdaehak-ro, Sangrok-gu, Ansan-si, Gyeonggi-do 426-791, Korea
2
School of Architecture and Architectural Engineering, Hanyang University, 55 Hanyangdaehak-ro, Sangrok-gu, Ansan-si, Gyeonggi-do 426-791, Korea
*
Author to whom correspondence should be addressed.
Sustainability 2015, 7(12), 16273-16289; https://doi.org/10.3390/su71215816
Submission received: 7 August 2015 / Revised: 15 November 2015 / Accepted: 25 November 2015 / Published: 8 December 2015
(This article belongs to the Special Issue Sustainable Business and Development II)

Abstract

:
This paper seeks to determine the value of Energy Service Company (ESCO) contracts based on the guaranteed savings contracts, which are relatively widely used among ESCO contract models. A framework is proposed based on the collar option model to qualitatively calculate the profit distribution ratio between energy users and the ESCO. The profit distribution model is defined with the guaranteed and target savings, changes in energy cost reductions, and volatility. The model determines a profit distribution ratio such that the energy user offers the ESCO profits equivalent to the value of the guarantee. The model is evaluated using a case study. The model suggested in this study is expected to resolve previous issues with making decisions based on past experiences, as the profit distribution ratio is determined objectively. Moreover, it is possible to effectively assess various profit structures in guaranteed savings contracts according to changes in the guaranteed and target savings. Ultimately, this model is expected to assist in revitalizing the Korean ESCO market.

1. Introduction

The 4th IPCC (Intergovernmental Panel on Climate Change) report predicts that the energy efficiency business has the greatest potential to reduce greenhouse gases in the next 20–30 years [1]. Moreover, the recent fifth report suggested that managing end-user demand would be a core solution in reducing greenhouse gas emissions. This would require an 18% and 25% reduction by 2030 and 2050, respectively, in the energy used to operate buildings [2], as this makes up approximately 32% of total global energy usage [3,4]. This has resulted in the commercialization [5,6] of innovative, energy efficient buildings that use less energy, such as the three-litter house, the 2000-watt house [7], and the zero energy building [8]. In Korea, buildings constructed before 2000, when insulation standards were strengthened, make up approximately 74% of all buildings [9] meaning that there is a high potential to reduce energy use by improving the energy efficiency of buildings.
The potential of energy efficiency improvement is not fully realized due to several barriers, such as information imbalance, distortion of incentives, lack of resources, risk from new technological applications, uncertainty regarding performance, and systematic factors [10,11]. The Energy Service Company (ESCO) is a tool that can overcome these barriers through a performance contract.
ESCO refers to an energy saving expert company or an energy saving service that installs energy saving facilities by providing technology. It funds and recoups the investment costs from the energy savings that are generated in a case where the energy user cannot replace the existing energy facilities due to technological and/or economic burdens. Firstly, the installation of energy saving facilities through an ESCO is advantageous because there is no burden of an initial investment cost for the consumer. The merits also include decreasing economic and technological risks that accompany facility investment, professional services provided by an ESCO, and tax benefits. Energy users can reduce energy and maintenance costs through the ESCO contract, which also provides indirect benefits, such as increased productivity, replacement of deteriorating equipment, and environmental improvement [12].
ESCO contracts provide clients with great advantages in terms of energy efficiency retrofit projects. However, both clients and ESCOs are profit-oriented, with building clients mainly concerned about economic profit during an energy efficiency retrofit project [13]. Moreover, as Korea is maintaining a low energy pricing policy for the competitiveness of the industrial sector, a relatively long timeline is required for a return on the investment compared to other countries. Such a financial barrier in an ESCO business creates a vicious cycle of insufficient technology and professional manpower, minimal investment in technological development, and a low level of technology. National financial supports are underway in Korea as the government recognizes the importance of an energy supply policy and the difficult factors in an ESCO business. However, this initiative is hindered by diverse problems, such as fund size, interest rates, and public confidence.
This indicates that government supports for an ESCO business should be minimized, allowing the ESCO businesses to run independently based on long-term market mechanisms. The enhancement of energy saving technology, the reliability of energy savings predictions, and the advancements in an ESCO profitability analysis will be critical for this.
A number of studies have been published on energy reduction technology and reliability measurements for the energy efficiency enhancement of green buildings. Previous reports on ESCO contracts have been discussed from diverse points of view, including analysis on the developmental direction, the supplement of procedural problems, and the disturbing factors of an ESCO contract. However, objective evaluations of an ESCO contract from a market view through the analysis of its profit structure have been limited.
To address this gap, this study aims to determine the value of ESCO contracts based on guaranteed savings contracts, the more common ESCO contract model, and to determine the framework that quantitatively computes the profit distribution ratio between the building client and the ESCO based on the results.

2. Background

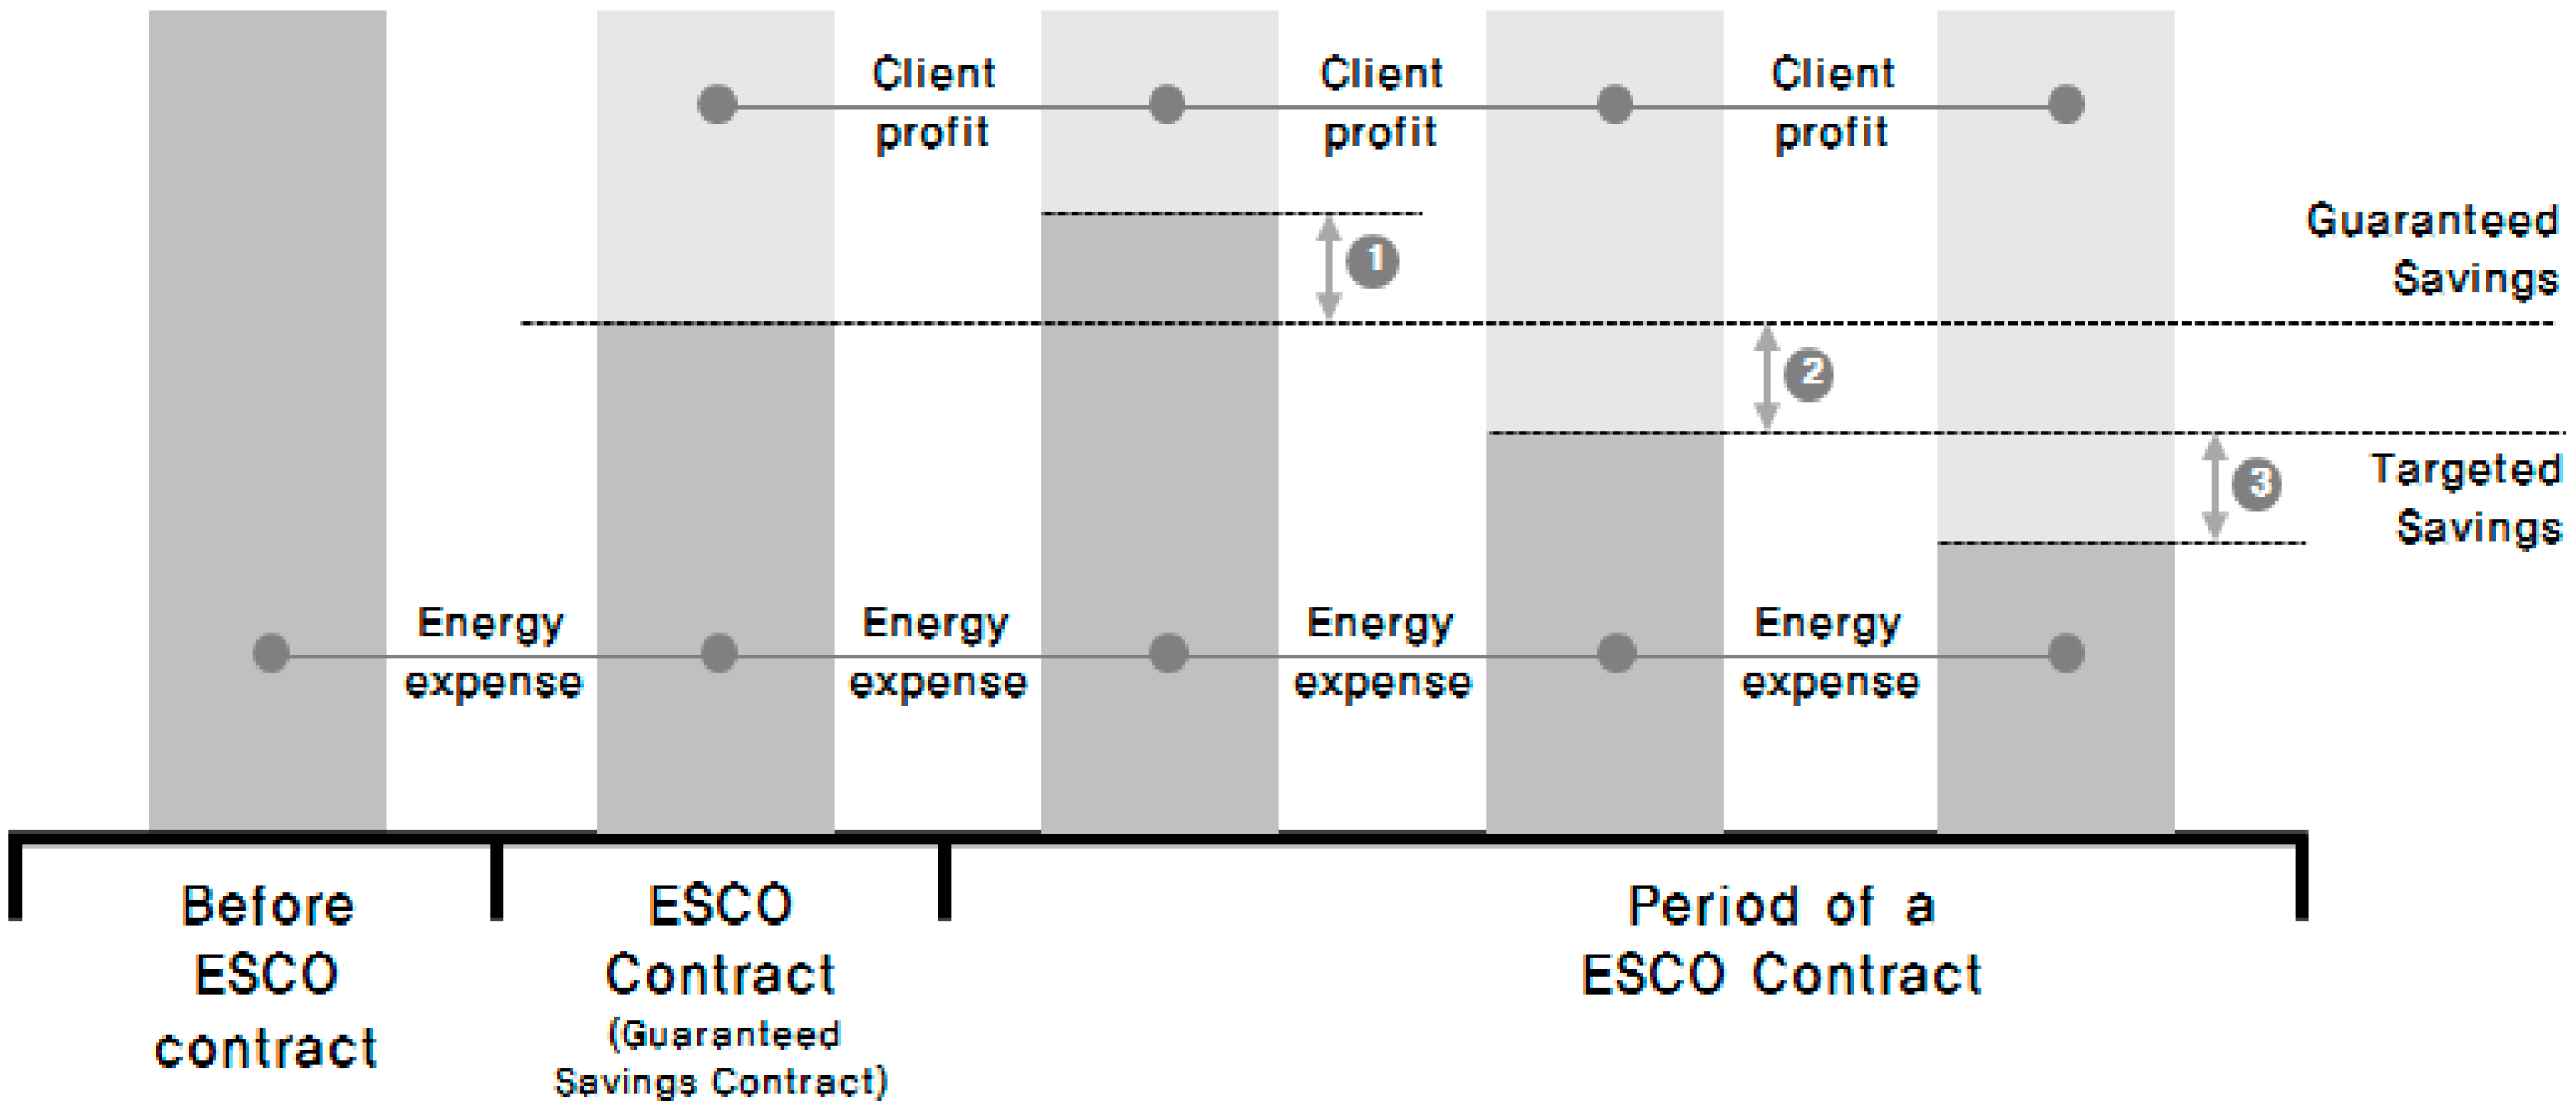
2.1. An ESCO’s Business Structure in a Guaranteed Savings Contract

ESCO contracts can largely be divided into two types: a shared savings contract and a guaranteed savings contract. However, the proportion of guaranteed savings contracts is relatively large in advanced countries [14]. Because ESCO businesses in Korea can progress based on a guaranteed savings contract, this paper focuses on the guaranteed savings contract.
Conceptually, the guaranteed savings contract involves an exchange wherein the energy user finances the energy reduction system and the ESCO is responsible for the performance of the business. The energy user gathers the financial capital required through a bank or equipment lease, and the ESCO guarantees the savings from the energy reduction system. If the minimum pre-agreed level of energy reduction is not achieved, the ESCO compensates the energy user and thus guarantees project performance [15,16]. Table 1 provides the key terms in a standard guaranteed savings contract in Korea.
Table 1. Key definitions for standard guaranteed savings contracts in Korea.
TermDefinition
Energy savingsEnergy reductions from the installation of the energy reduction system
Target savingsThe maximum energy savings that the ESCO calculates through an energy usage diagnosis or other methods to guarantee a level of performance
Performance guaranteeThe act of guaranteeing an energy reduction value from installing the energy reduction system. The ESCO provides this guarantee to the energy user
Guaranteed savingsThe amount of guaranteed energy reductions that the ESCO provides to the user, which must be more than 80% of the target reduction value
Performance guarantee periodThe period to recover the entire project investment amount through the guaranteed energy savings
Profit distributionThe distribution of profits resulting from surpassing the target reduction value between the energy user and the ESCO
Combining the major terms in Table 1 with the conceptual definition of the guaranteed savings contract above, the profit structure of the guaranteed savings contract can be defined in three parts, as shown in Figure 1. First, zone ② is where the energy savings are between the guaranteed savings and the target savings; this can be regarded as a neutral zone. In this zone, the ESCO obtains profits from the energy user as a service cost when implementing the energy saving business. This is based on the general contract relating to the energy saving business. Accordingly, the standard contract specifies that the ESCO and the energy user are not obligated to allocate guarantees of performance if the energy savings fall between the guaranteed savings and the target savings. The characteristic feature of the guaranteed savings contract is that zone ① and zone ③ are generated in the profit structure. During zone ①, the energy savings are lower than the guaranteed savings. In this case, the ESCO must pay the difference to the energy user based on the additional performance guarantee contract. Zone ③ is where the energy savings exceed the target savings. In this case, the ESCO obtains a certain part of the performance that exceeded the target savings based on an additional performance distribution contract. As a result, the ESCO acquires the right to obtain additional profit. Here, the value of the guarantee that the ESCO provides in zone ① and the value of the right to profit acquired in zone ③ differ according to the set guaranteed savings and the target savings. Such energy savings are generally determined by the ESCO, but the energy users verify this based on an energy diagnosis report by an external expert organization.
Because zone ② takes the form of a general service contract, the value of the guarantee provided in zone ① and the value of the right to profit obtained from the performance distribution contract of zone ③ must be identical. Hence, if the ESCO-guaranteed value in zone ① is evaluated and the profit distribution ratio is computed in zone ③ to match that evaluated value, a logical guaranteed savings contract between the ESCO and the energy user can be determined.
Figure 1. Profit structure of a guaranteed savings contract.
Sustainability 07 15816 g001

2.2. Literature Review

Long-term payback time, risk exposure, and initial cost are the financial barriers in the activation of a green building project [17]. An important goal of investors is to secure profit through investment. The rate of return can be divided into three indices: payback time, return on investment, and internal rate of return. In particular, payback time is the most commonly used index for assessing investment value. Investment projects that improve energy efficiency require a payback time of approximately eight years in general [17]. However, ordinary investors prefer an investment with a shorter payback time [18]. A longer payback time means a higher opportunity cost of the investment, that is, a higher accrued interest that emerges with time. As a result, investors try to reduce this cost. With buildings having a life cycle of over 30 years, the time to recoup an investment cost by reducing operational costs through higher energy efficiency can be long. Consequently, investors become very conservative regarding investments in green building projects [17]. Risk exposure is one of the factors that investors take seriously. In general, a higher risk exposure means a higher rate of return. Investors normally prefer the safest investment that yields the highest rate of return. Although a green building project generally has a high-risk exposure due to the long payback time, its rate of return is low compared to the risk. This acts as a deterrent when procuring resources for a green building project [17].
Finally, an increase in the initial cost is also a factor of concern. A previous study indicated that consumers who agreed to buy products with a long life cycle showed a tendency of eventually purchasing products that had a low energy efficiency due to the low initial cost [19]. Although cash flow can be improved by using various technologies and facilities that can enhance energy efficiency, lenders tend to take a very conservative position due to the possibility of an increase in the initial cost. As a result, financial barriers, including long payback time, relatively high interest rates, and increasing initial cost act as a major hindrance to the activation of a green building project.
Du et al., 2014 [20] studied 15 barriers with the aid of information collected through questionnaires and semi-structured interviews. Analysis of the entire sample showed that the stakeholders’ reluctance to use it was the largest barrier, followed by high initial investment and low profitability [20]. Zhang et al., 2011 [21] examined the costs and barriers in applying the green elements to the process of developing property projects. By analyzing the additional cost of the three types of green buildings, it is concluded that the major barrier, the higher costs, has hindered the extensive application of green technologies in China [21]. Shi et al., 2013 [22] classified the general barriers to the implementation of green construction in China by a questionnaire survey and proposed initiatives to push forward an integrated system between government and contractors for green construction. The results showed that additional cost, incremental time, and limited availability of green suppliers and information are critical barriers [22]. As such, not only technological or institutional aspects, but also a business model from a market point of view is very important for the vitalization of green building. The ESCO business model can be an alternative.
The literature related to ESCOs can be largely classified into two types. The first stream analyzes reasons behind the difference in the level of investment in energy efficiency between the real and socially optimal levels from the perspectives of market failure or market barriers, and proposes ESCO contracts as one of the methods to overcome this difference.
Goldman et al. (2005) empirically analyzed the ESCO’s business characteristics and results in the US as a business entity, its average investment by sector, type of equipment, and investment return periods, and proposed that the ESCO has a role in overcoming obstructing factors and market failures such as risks related to energy efficiency projects, information asymmetry, and transactional costs [12]. Steinberger et al. (2009) suggested that for ESCO contracts to grow as a performance-based energy policy tool to attract socially optimal levels of investments in energy efficiency, they require financial resources, improvements to the regulations related to ESCO contracts, standardized contract protocols, training for experts, and the spreading of ESCO-related information [23].
The second stream analyzes national ESCO policies in the US, Japan, China, Europe, and developing countries, in addition to relevant case studies, to empirically identify the factors obstructing the ESCO business and suggest methods for improvement. Vine (2005) estimated the size of the ESCO market using survey results from 38 countries, and analyzed ESCO’s investment characteristics by country, factors restricting regulations on ESCOs, and obstructive factors from the users’ perspectives [24]. Painuly et al. (2003) focused on ESCOs’ potential in the energy reduction business, and listed various limiting factors, such as the barriers in raising capital, policy and financial barriers, and cultural barriers [15]. Gan (2009) proposed market, policy, financial, and technological barriers as factors limiting the growth of ESCOs in China, which ranks second in the world in energy use and greenhouse gas emissions, and is only in the implementation stage of ESCOs [25].
Moreover, research has been conducted related to ESCOs’ applicability for energy efficiency projects. Xu et al. (2011) develop a set of Critical Success Factors (CSFs) of energy performance contracting (EPC) for sustainable Building Energy Efficiency Retrofits (BEER) of hotel buildings in China, which include the project organization process, EPC project financing, knowledge of EPC, implementation of a sustainable development strategy, contractual arrangements, and the external economic environment [13]. Jensen et al. (2013) present current research on Danish municipalities’ use of ESCOs as a way to improve public buildings and to increase energy efficiency [26]. Li et al. (2009) describe ESCOs as an alternative to bridge the technical and financial gaps in the building efficiency market [27]. Earlier research highlights the possibility of effectively carrying out building energy efficiency projects through the ESCO business model. For the guaranteed savings contract, which is one of the ESCO business models, applicability to green building will be particularly high considering it can minimize the uncertainty of investors as the guarantee on energy savings is contained. Realistically, the profit structure between the building owner and the ESCO is very important and there are limited valuations of the ESCO contract model based on energy performance.

2.3. Real Options

The Discounted Cash Flow (DCF) model, which was used as the main stream of an evaluating model, pointed out the main problems because it could bring about erroneous investment decisions by ignoring uncertainties of a project’s expected cash flows and a manager’s strategic flexibilities to cope with these uncertainties [28,29]. To overcome DCF’s problems, Myers (1984) proposed the framework of real options as the methodology for making investment decisions based on the option pricing theory [28].
As shown in Table 2, there are several similarities between financial options and real options, but variables are somewhat different because of characteristics of the investment assets [30].
Table 2. Comparison of real options’ variables with those of financial options.
Financial OptionsReal Options
Stock pricePresent value of expected incomes
Exercise priceCosts of irreversible follow-on investment
Time to maturityTime until the investment opportunity disappears
Volatility of stock returnVariability of project value
Risk-free rate of returnRisk-free rate of return
Copeland et al., 2003 [30].
There are five main techniques to valuing options: the Black-Scholes Option Pricing Model (BSOPM), the Binomial Option Pricing Model (BOPM), the Risk-Adjusted Decision Trees (RADT), the Monte Carlo Simulation (MCS), and finally, Hybrid Real Options (HRO) [31].
As shown in Table 3, the results of evaluating the value of a project using RADT and MCS are unclear. Because of estimating the volatility considering only one factor in this paper, HRO is not needed. BSOPM, which assumes a continuous timeline, is unsuitable for applying to real assets. This study therefore uses the Binomial Option Pricing Model (BOPM) for valuing the ESCO contracts.
Table 3. Valuation methods.
MethodsAdvantagesDisadvantages
BSOPMSimple to calculate the option value.Only applicable to European options;
Only works with normal distributions;
Require advanced financial knowledge;
Required assumptions limit the use of the model (price, volatility, duration);
Able to deal with only one factor of uncertainty.
BOPMEffective when dealing with one factor of uncertainty;
Provides project managers with an appropriate evolution of the underlying asset;
Estimates the value of several option futures.
Requires advanced financial knowledge;
Able to deal with only one factor of uncertainty.
RADTAllows mapping complex problems;
Able to deal with multiple uncertainties;
Enables decision makers to develop insights into ROs;
Useful in the case of a possible drastic change in systems.
Does not provide the true value of the project;
If the number of branches is high, it becomes too complicated and unclear.
MCSDemonstrates graphically the analysis results;
Able to deal with multiple uncertainties;
Not required to understand financial theory;
Helpful for problems with path-dependency;
User-friendly multiple document interface.
Lacks transparency;
Hard methodology to implement with American options.
HROsAble to deal with multiple uncertainties;
Combining the best of decision analysis and options analysis;
Independent handling of technical and financial parts.
Hard methodology to implement (it requires highly sophisticated mathematical modeling skills).
Martins et al., 2015 [31].
Based on the theoretical basis, there have been many studies applying the real options in the construction sector.
Cui et al. (2008) presented an independent analysis of the effectiveness of the warranty clauses. This paper evaluated the warranty-ceiling clause on NM 44 (New Mexico Highway 44) using the real options approach [32]. Kim et al. (2012) proposed a real option-based framework for rationally quantifying the amount of government subsidies required by private entities in order to implement a clean energy generation system [33]. Park et al. (2013) proposed a real option–based contract model to ensure appropriate privatization risk sharing in underground infrastructures between private entities and governments [34]. Lee et al. (2014) developed and exemplified a real options valuation framework that could be used to evaluate the financial impact of phased investments in a building portfolio [35]. Kashani et al. (2015) addressed the theoretical limitations of current real options models and created a new real options model to evaluate investment options for renewable energy systems under uncertainty [36]. Mirzadeh et al. (2015) developed an option-pricing framework that enabled the financial assessment of different types of road projects in the presence of different government support mechanisms [37]. Martins et al. (2015) provided an overview of the current literature on real options, thereby filling a gap in the current academic literature. It addressed the main types of options and valuation mechanisms and provided an extensive overview of their application to the infrastructure sector [31]. As a result, this study uses real options as a way to evaluate the value of ESCO contracts.

3. Research Methodology

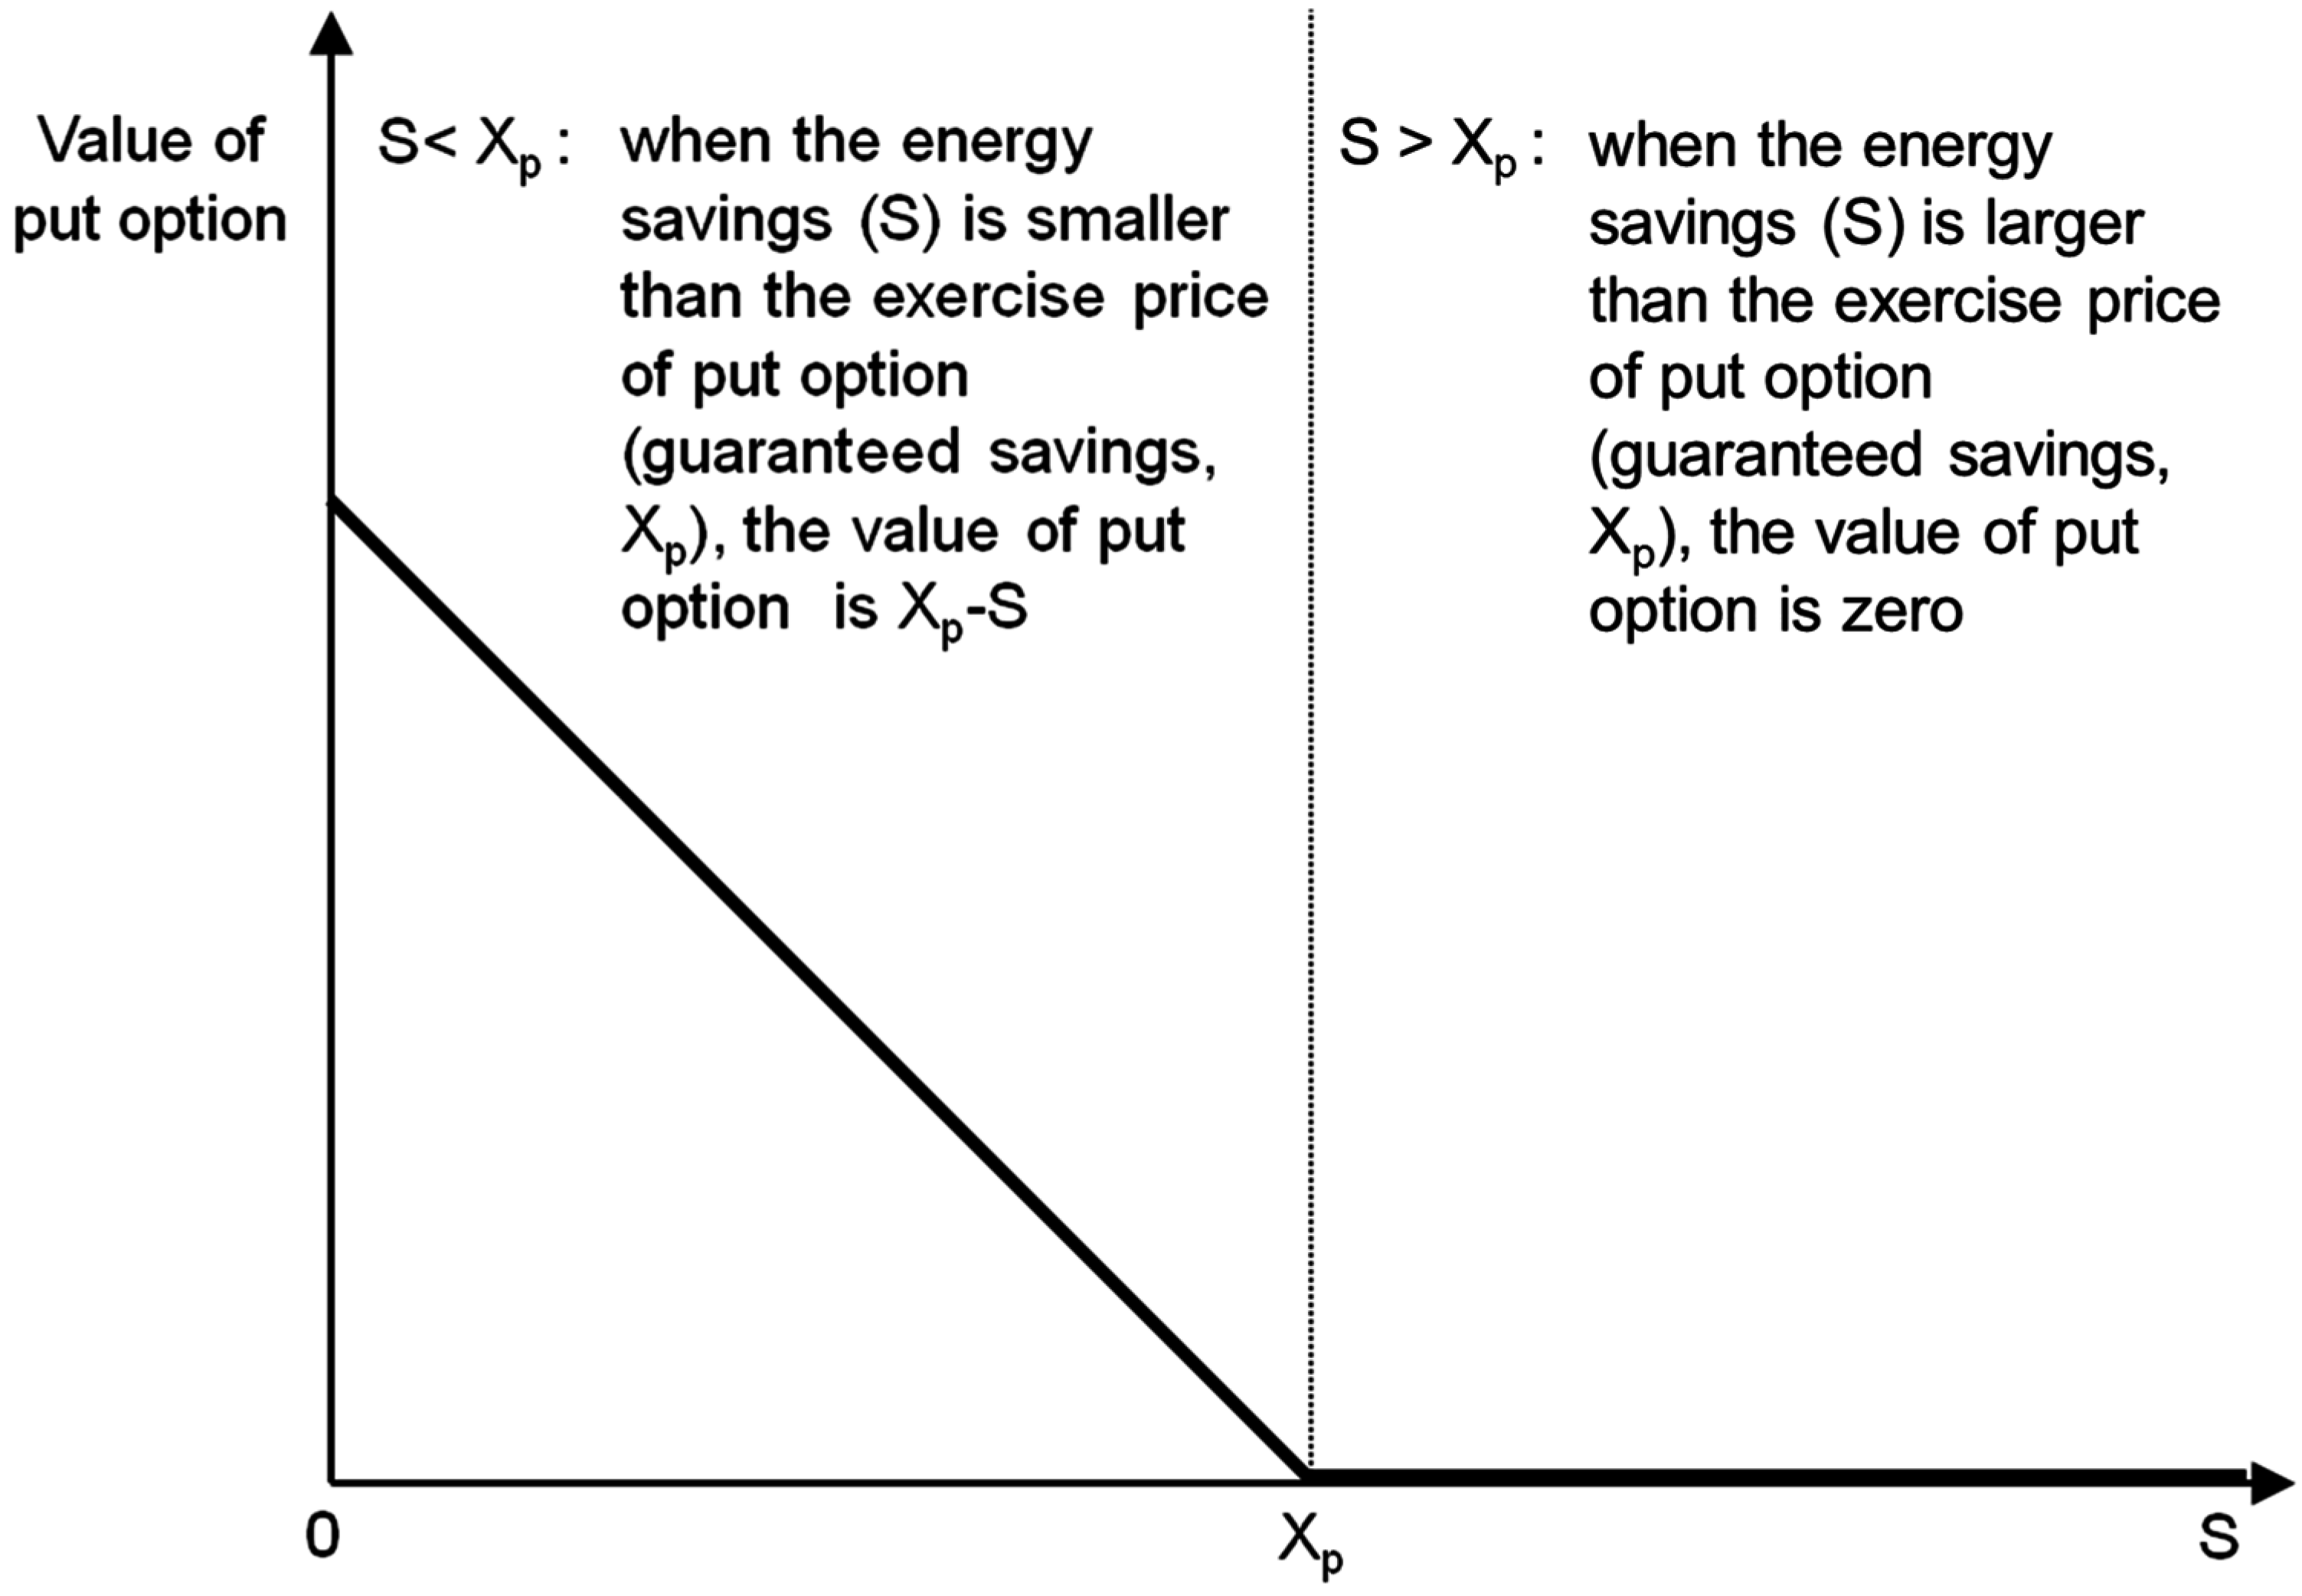
3.1. Profit Distribution Framework Using the Collar Option Model

The collar option model is used to value the ESCO guarantee and compute a profit distribution ratio such that the ESCO’s share of the profit is equivalent to the guarantee.
An option is defined as the security of giving the right to buy or sell an asset, subject to certain conditions, within a specified period of time [38]. An option is a right, but not an obligation, to take an action in the future. In financial markets, the most common types of options are a call option and a put option. A call option gives the owner the right to buy stock at a predetermined exercise price on a specified maturity date. A put option can be viewed as the opposite of a call option. A put option gives its owner the right to sell the stock at a fixed exercise price. Stock prices are notorious for their volatility [39].
A collar option is a more complex arrangement than a put option and a call option; it is a combination of a call option and a put option [40]. A popular type of collar is the zero-cost collar. Typically, the proceeds from the sale of the call are used to offset the cost of the put, which eliminates the cost of the hedging instrument. The put provides insurance to the holder against any downward movement in the stock price below the strike price. Any movement above the strike price of the call is lost profit [41].
Figure 2 illustrates the profit structure of the guaranteed savings contract using the collar option model. This model comprises the zone of exercising a put option for the energy user when the energy savings decreases (Zone A), the zone of exercising a call option for the ESCO when the energy savings increases (Zone B), and a neutral zone (Zone C). The exercise price of the put option is the guaranteed savings, and the exercise price of the call option is the target savings. If the expected energy savings after installing the energy reduction system at the beginning of the performance guarantee period (t = 0) is S0, S0 rests between the exercise price of put option (Xp), the guaranteed savings, and the exercise price of the call option (Xc), the target savings.
Figure 2. Valuation of guaranteed savings contract based on the collar option model.
Sustainability 07 15816 g002
As shown in Figure 3, if the energy savings (S) fall below the guaranteed savings (Xp), the energy user can receive the difference from the guaranteed savings, and the value of the guarantee is positive. However, if S is larger than Xp, the value of the guarantee from the energy user’s perspective is equivalent to 0. Therefore, depending on the change in S, the value of the guarantee is represented by the graph, which demonstrates the change of value of the put option.
Figure 3. Change in the value of the guarantee according to fluctuation in the energy savings.
Sustainability 07 15816 g003
Moreover, as shown in Figure 4, if energy savings (S) increase beyond the target savings (Xc), the ESCO can obtain a certain portion of the difference between the energy savings and the target savings as profit. However, if S is less than Xc, there is no profit. Therefore, based on Xc and the corresponding changes to S, the ESCO obtains the right to profit. The change in the value of the right to profit is shown in a graph that demonstrates the value of the call option.
Figure 4. Change in the value of the Energy Services Company’s (ESCO) right to profit according to fluctuation in the energy savings.
Sustainability 07 15816 g004
Thus, from Figure 2, the energy user has a put option where the guaranteed savings is the exercise price (Xp), and the ESCO has a call option where the target savings value is the exercise price (Xc). As the guaranteed savings contract is a bilateral agreement between both parties, if one profits, the other faces a loss. Therefore, the value of the option possessed by each side must be equal. If the target and guaranteed savings are set contractually between the ESCO and the energy user, the value of the put option owned by the energy user is determined. Therefore, the profit distribution ratio (K) in Zone B, where the value of the call option is determined, can be modified to change the slope by using Equation (1) such that the value of the energy user’s guarantee and the ESCO’s right to profit are equal.
V a l u e p u t =   V a l u e call × K
V a l u e p u t   : value of put option; V a l u e c a l l : value of call option; K : Profit distribution ratio.

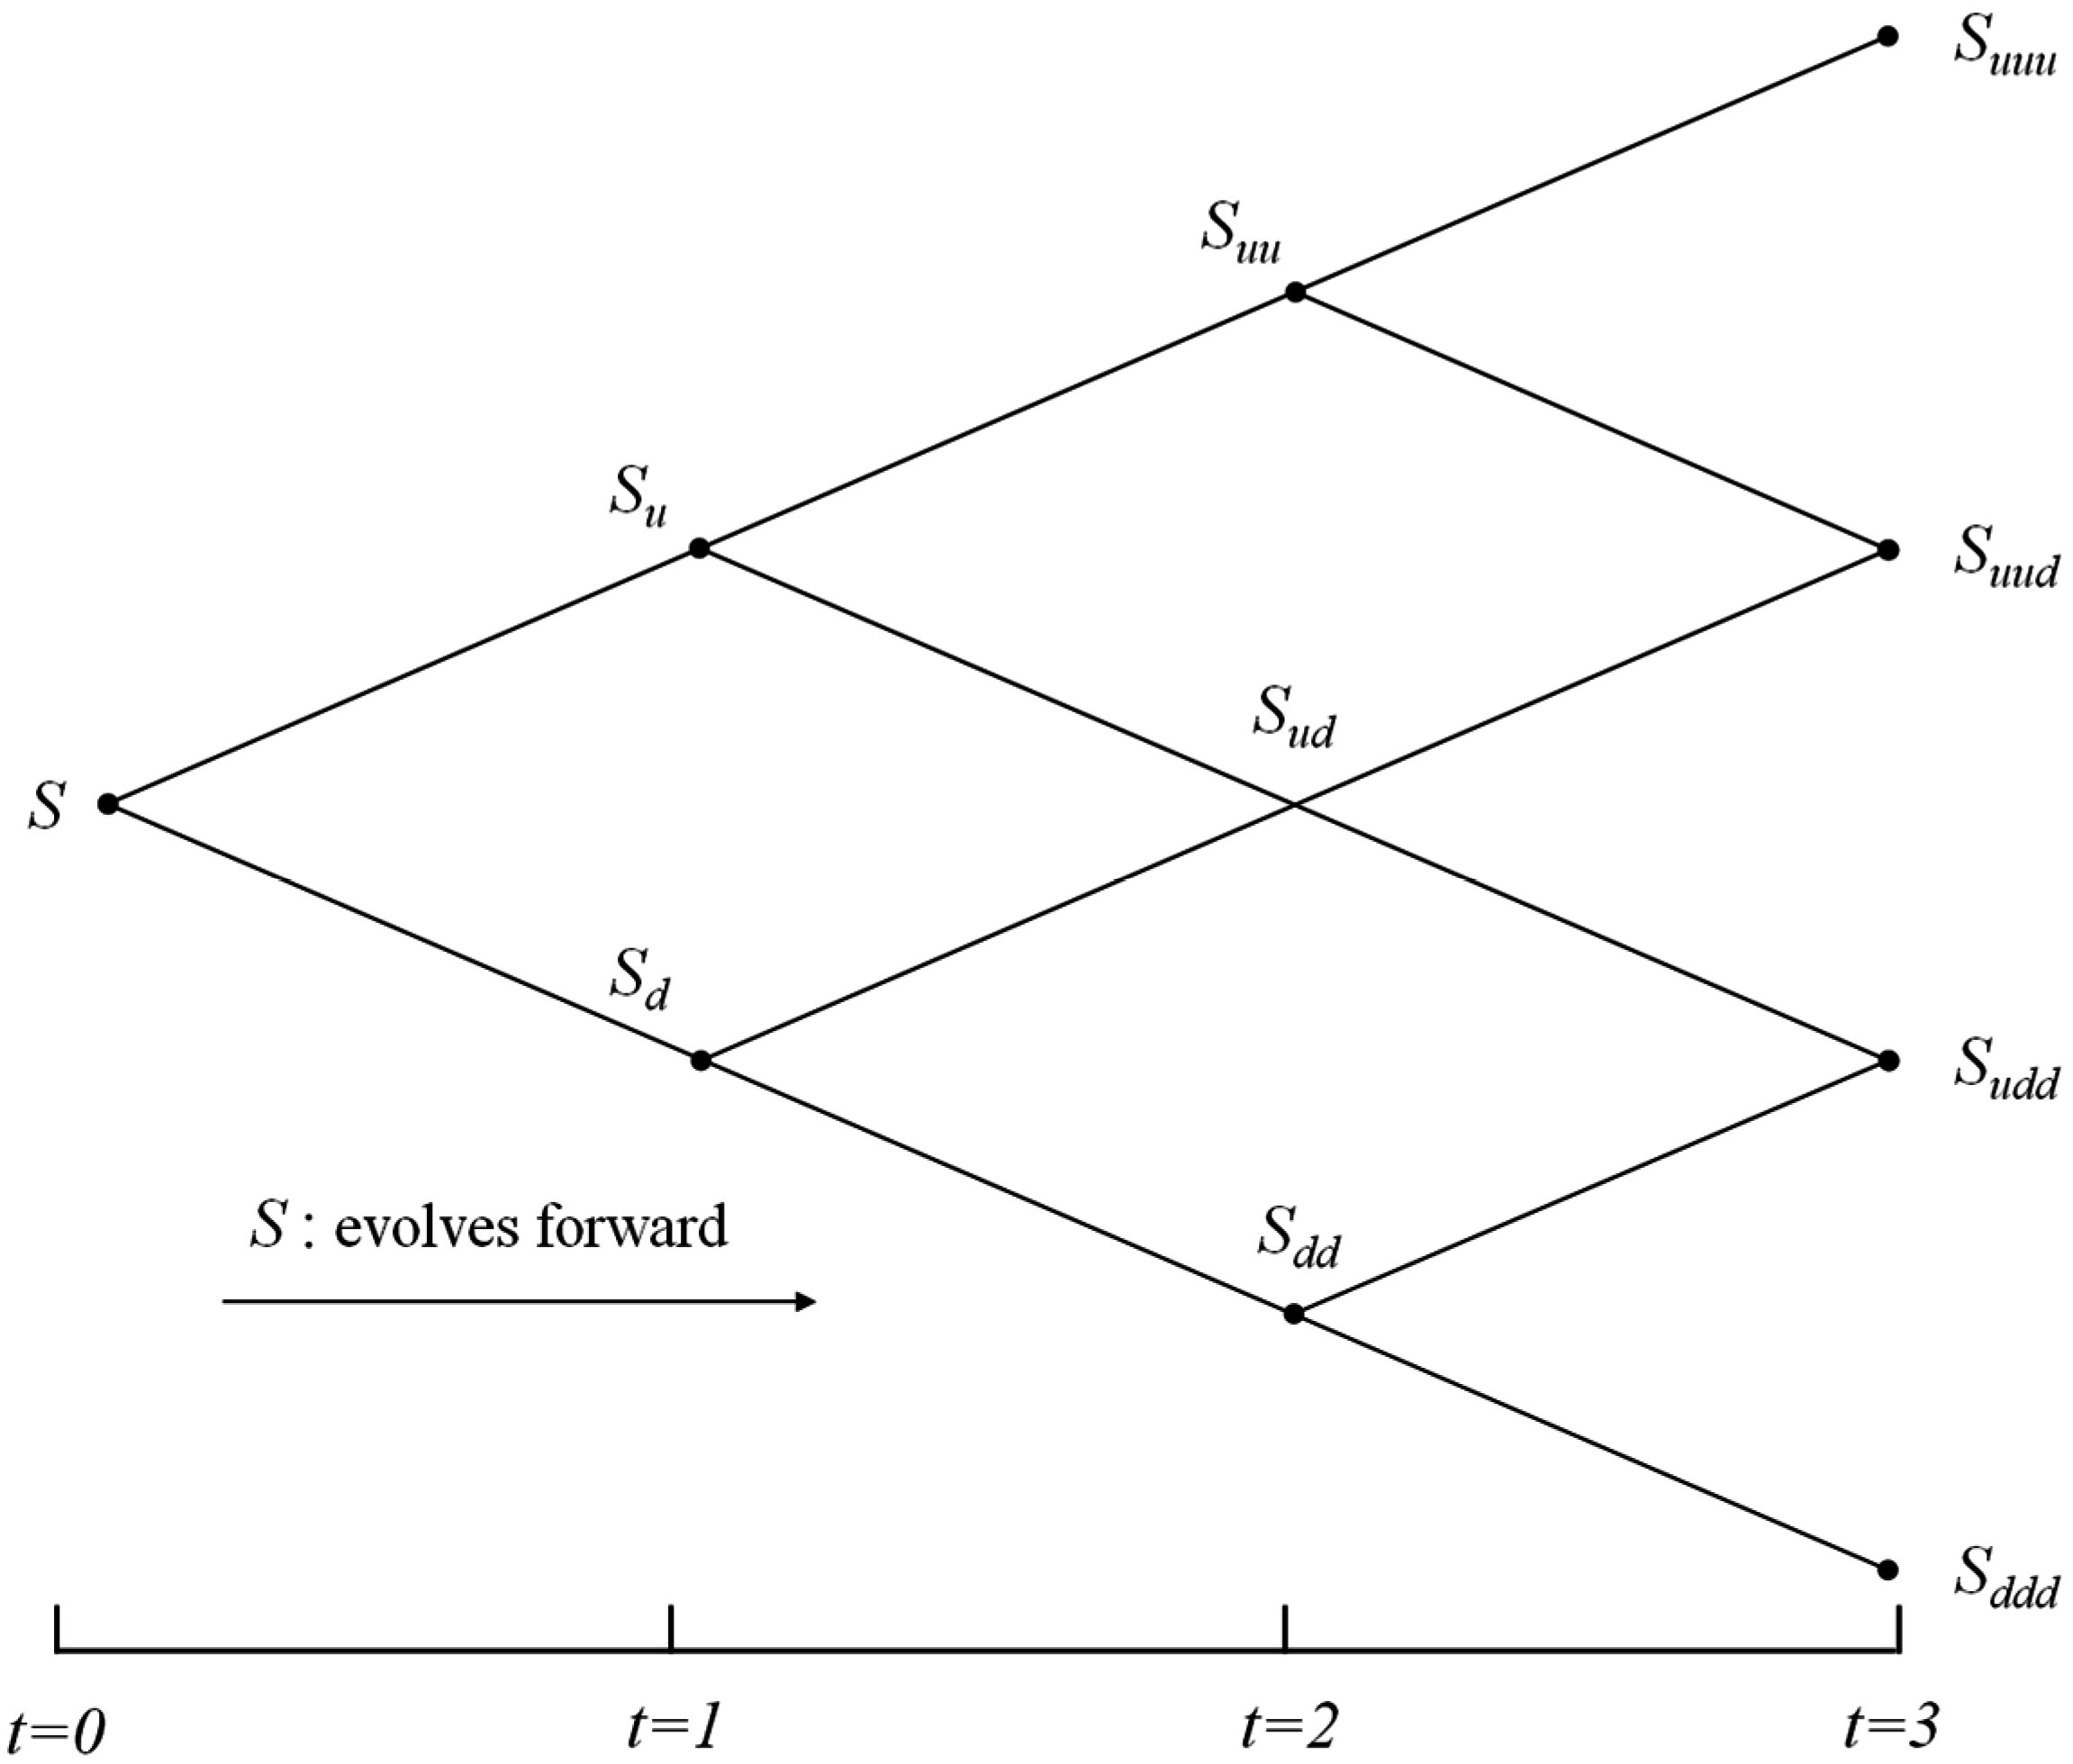
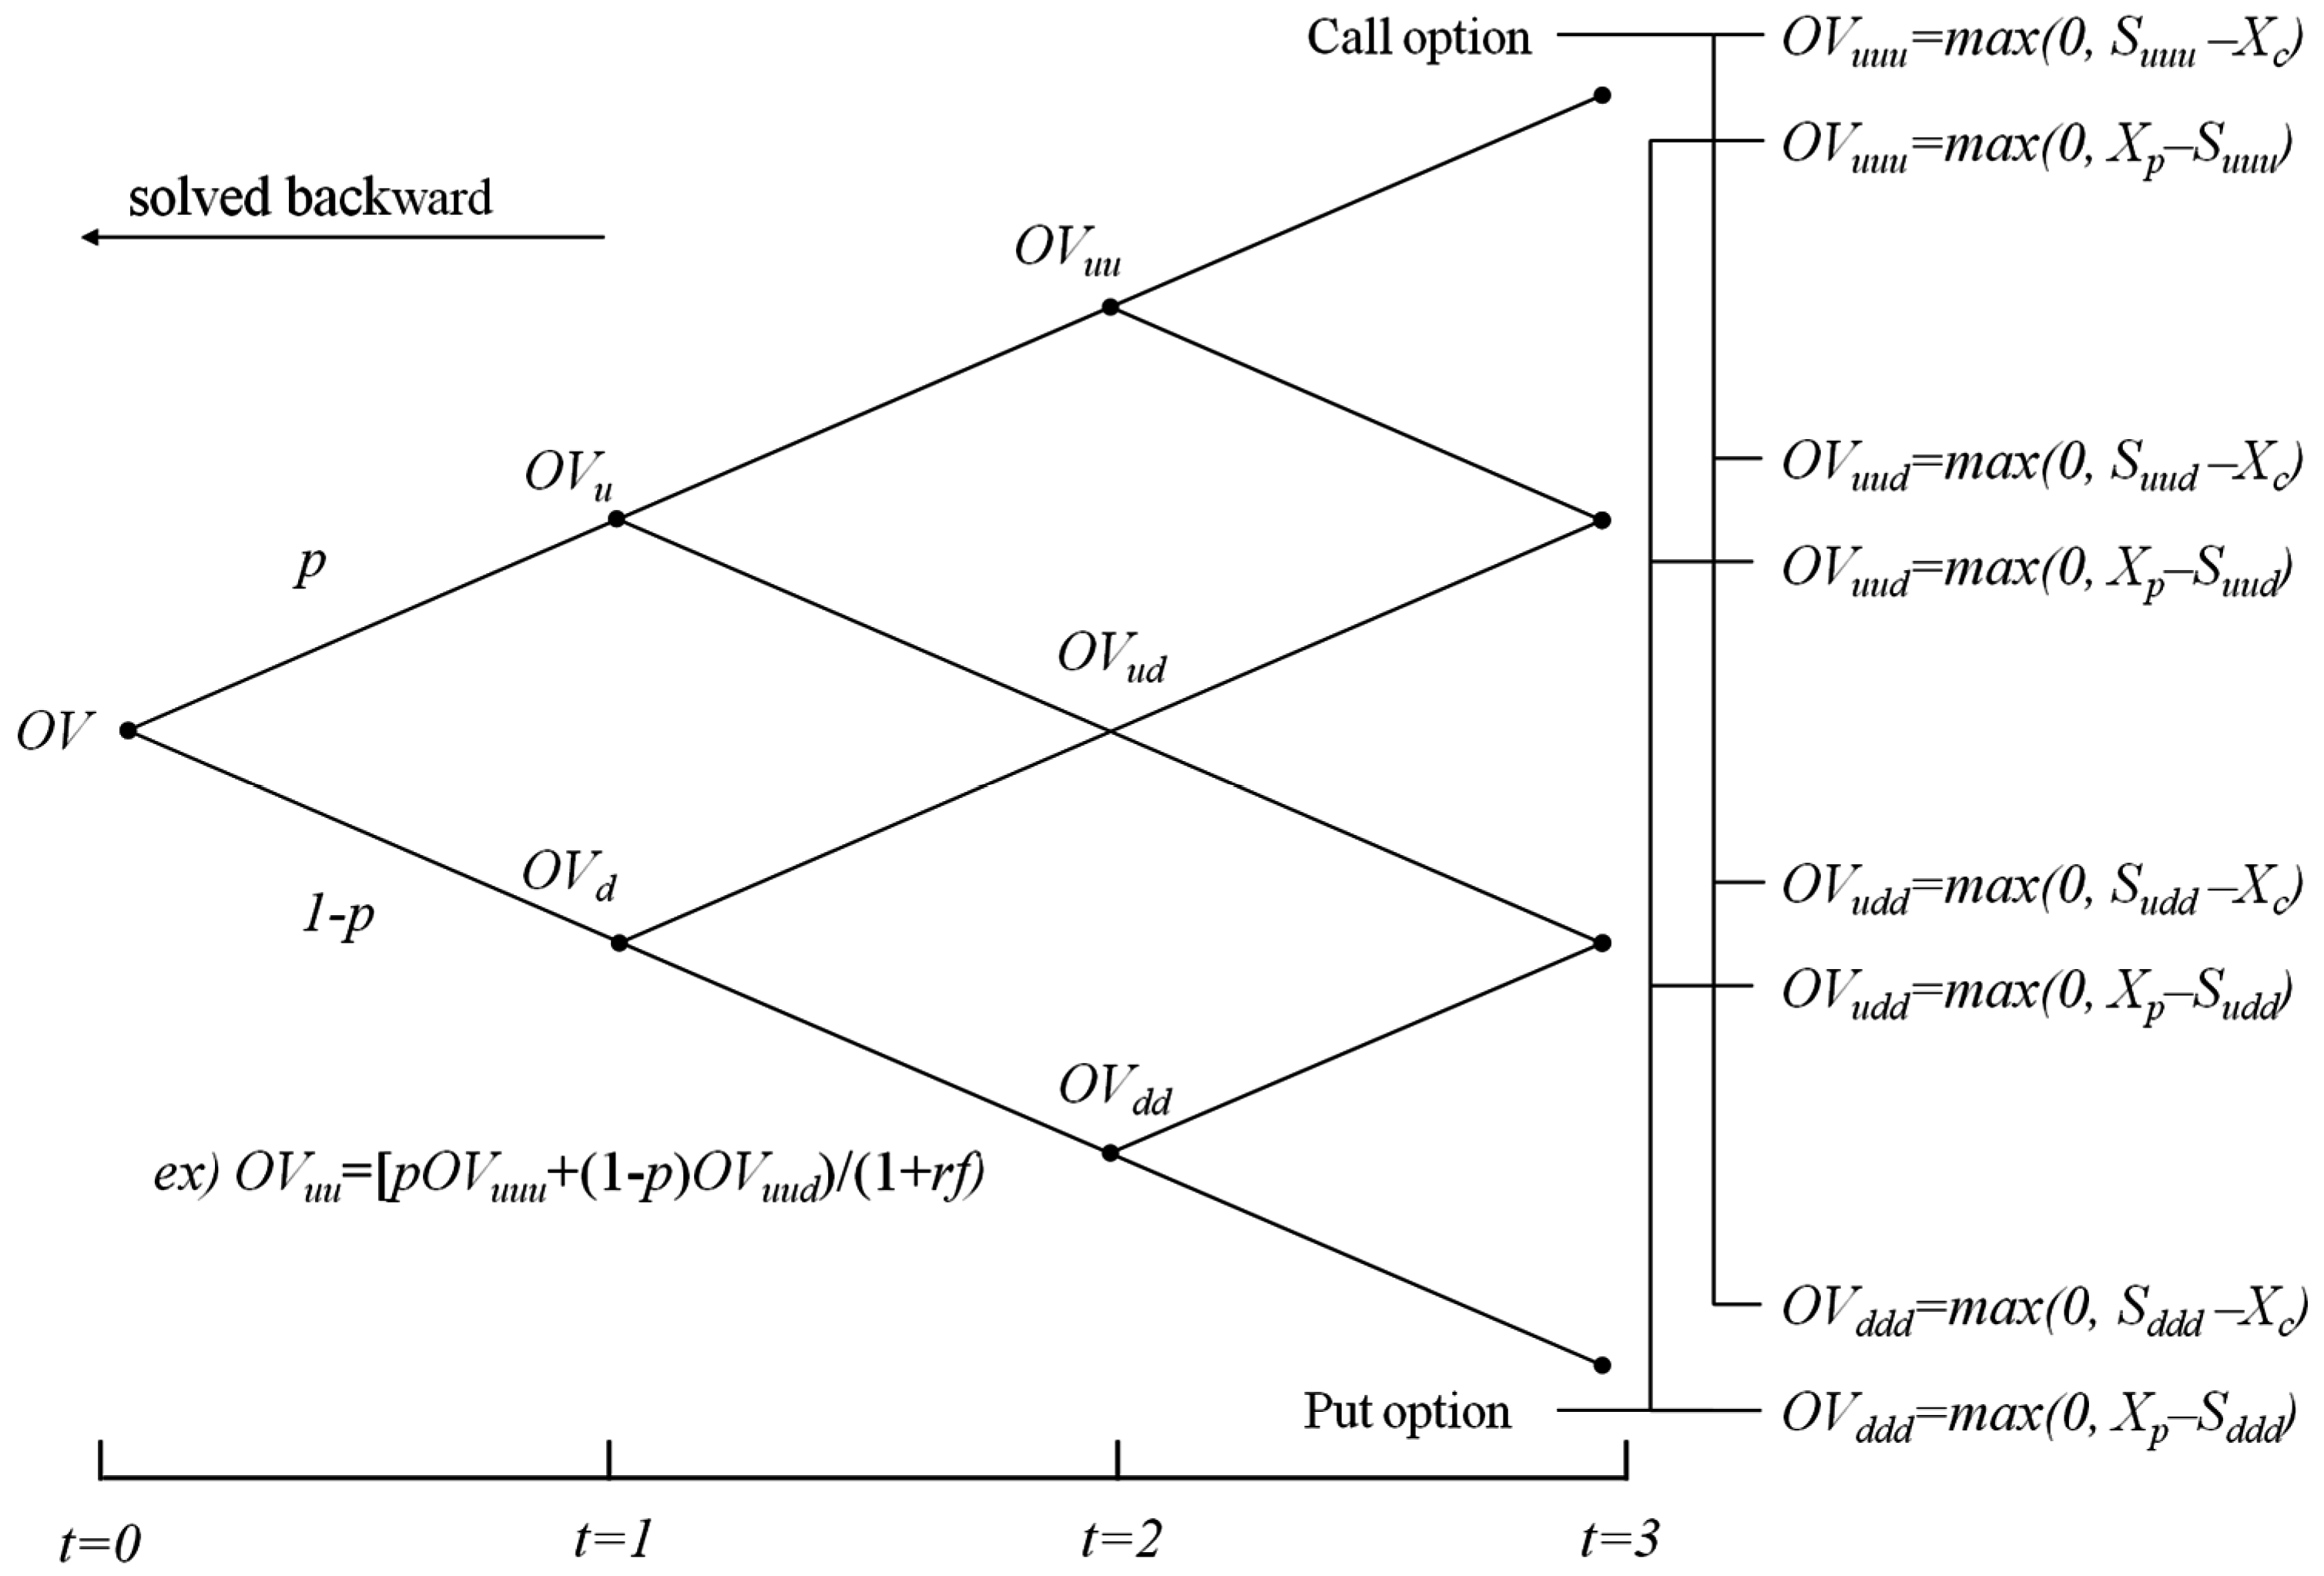
3.2. Binomial Lattice Model to Calculate the Option Value

Cox et al. (1976) suggested the binominal lattice model as a method to evaluate the value of options assuming that changes in the underlying asset follows a binomial distribution [42]. The binomial lattice model can solve a more complex and realistic option for pricing problems. The binomial lattice model has two calculations, where Figure 5 illustrates the binomial tree of the distribution of underlying assets, and Figure 6 illustrates another binomial tree constructed to calculate the option value [43]. The underlying asset (S) in Figure 5 must first be determined. In this study, as changes in the value of the option is determined by changes to the energy savings, the underlying asset is the present value of the expected energy savings at the endpoint of the guaranteed savings contract. The binomial tree following a forward process is the process for determining probable scenarios created over time based on the uncertainty of the energy savings. Under the option theory, the binomial tree is calculated using Equations (2) and (3) to determine the rise and fall rates, and these rise rates (u) and fall rates (d) are applied repeatedly to the underlying asset (S) to determine the binomial tree.
u = e σ δ t
d = e σ δ t
u : rise rates; d : fall rates; σ : volatility.
Based on a binomial tree from the forward process (Figure 5), the backward process in Figure 6 is used to calculate the option value. Equation (4) is an example of the correlation between the node at t-1 and the two nodes at t. In other words, Equation (4) indicates that the OVuu node is obtained by calculating the expected value using the OVuuu node, and the OVuud node. In this way, the binomial tree in Figure 6 displays the process of repeated calculations on the present node after calculating the value of the call or put option using the equation at the final stage. Risk-neutral probabilities (p) are determined using Equation (5).
O V u u = [ p O V u u u + ( 1 p ) O V u u d ] /   ( 1 + r f )
p = e r f ( δ t ) d u d
r f   = risk-free rate; p = risk-neutral probabilities.
This study uses the binomial lattice model to evaluate the value of the guarantee owned by the energy user, and the value of the ESCO’s right to profit. Equation (1) determines the profit distribution ratio.
Figure 5. Binomial tree of S’s distribution.
Sustainability 07 15816 g005
Figure 6. Binomial tree for solving the option value.
Sustainability 07 15816 g006

4. Applications

4.1. Data Collection

This section presents a case study that applies the proposed profit distribution model to assess its realistic use. As shown in Table 4, the case project is a retrofit project for the energy efficiency improvement of an office building that has a total floor area of approximately 30,147.63 m2 and has been over 20 years since the completion of construction.
Table 4. Project overview.
CategoryDetails
Year Built1994 (20 years since completion)
Site area97,140.28 m2
Principal useOffice space
Building size1 floor underground, 7 floors aboveground
Building area17,512.66 m2
Total floor area30,147.63 m2
EquipmentAbsorption chiller-heater, steam boiler
Total project costHeat insulation317,570 USD
Windows298,010 USD
Total615,580 USD
This case includes a guaranteed savings contract between the ESCO and the energy user who sought to increase energy efficiency through heat insulation and windows at a total project cost of USD 615,580.
Table 5 provides the key data from the guaranteed savings contract. The ESCO suggested the target and guaranteed savings, of 88,200 USD/year and 70,560 USD/year, respectively. Moreover, an external agency confirmed the expected savings of 77,616 USD/year throughout the performance guarantee period. The energy user, based on the report, concludes the guaranteed savings contract with the ESCO.
Table 5. Guaranteed savings contract: key information.
CategoryEstimated Value
Target savings88,200 USD/year
Guaranteed savings70,560 USD/year
Expected savings77,616 USD/year
Performance guarantee period9 years
To determine the performance guarantee period, a discount rate was first calculated (Table 6). The discount rate was obtained by calculating the real annual discount rate using the interest rate and the inflation rate through Equation (6) and then averaging it. As a result, the discount rate was set at 0.96%.
Table 6. Discount rate calculation.
YearInterest RateInflation RateReal Discount RateAverage Discount Rate
20043.753.60.140.96
20053.572.80.74
20064.362.22.11
20075.012.52.45
20085.674.70.93
20093.232.80.42
20103.183.00.17
20113.693.60.09
20123.432.21.20
20132.701.31.38
I = { ( 1 + i ) / ( 1 + j ) } 1
I = Real discount rate; i = interest rate; j = Inflation rate.
The performance guarantee period means the period for recouping the investment cost from the guaranteed savings, as shown in Table 1. Accordingly, Table 7 shows the calculation of the performance guarantee period of the USD 615,580 investment cost in guaranteed savings. In this paper, the performance guarantee period was determined by first discounting the guaranteed savings to the present value by using the discount rate obtained above, and then summing them. As can be seen in Table 7, most of the investment cost is retrieved in around nine years. Hence, our performance guarantee period was set at nine years.
Table 7. Calculation of the performance guarantee period.
TimeInvestment CostGuaranteed Savings (Constant)Guaranteed Savings (Discounted)Guaranteed Savings (Discounted) Accumulated Sum
0615,580
1 70,56069,88969,889
2 70,56069,225139,114
3 70,56068,566207,680
4 70,56067,914275,594
5 70,56067,269342,863
6 70,56066,629409,492
7 70,56065,995475,487
8 70,56065,368540,855
9 70,56064,746605,601
10 70,56064,131669,731

4.2. Results

Table 9 displays the key variables used in the valuation of the guaranteed savings contract. First, the underlying asset(S) becomes the starting point to calculate the various estimated energy savings values with the volatility resulting from uncertainty. As such, the proxy values for the underlying asset was set as the underlying asset’s future expected values, and converts the annual estimated savings value for the performance guarantee period to the present value, which was defined as the applicable variable. The underlying asset is thus valued at USD 668,158.
Using Figure 2, the exercise price of the put option (Xp) in Zone A is USD 607,416, which is the present value of the annual guaranteed savings. The exercise price of the call option (Xc) in Zone B is USD 759,270, which is the present value of the annual target savings.
Volatility (σ) was calculated based on the annual gas and electricity usage data over the past 10 years, shown in Table 8. Although gas and electricity prices differ each year, they were assumed to be identical. This is because the energy price is identically applied in the ESCO contract as a standard price. Considering this, the volatility estimation also focused on the change in the savings rather than the price fluctuation. The derived volatility was approximately 10%. The reason behind such volatility could be the constant energy consumption by the building. However, it is conjectured that diverse factors, including temperature change, behavioral patterns of the users inside the building, and various actions for energy savings have affected the results.
Table 8. Volatility estimation.
YearGasElectricityEnergy Cost (USD)Change RateVolatility
Used Amount (Nm3)Unit Price (USD/Nm3)Used Amount (KWh)Unit Price (USD/KWh)
200458,7170.9252,575,6820.127381,425 10.00
200574,7590.9252,743,3210.127417,5549.05
200647,3240.9252,442,4820.127353,970−16.52
200748,7830.9252,649,5360.127381,6157.52
200842,2860.9252,526,9690.127360,039−5.82
200965,5150.9252,637,8170.127395,6049.42
201051,0180.9252,520,6400.127367,313−7.42
201182,2450.9252,661,9460.127414,14412.00
201269,0830.9252,629,3200.127397,825−4.02
201350,7360.9252,544,8040.127370,121−7.22
The risk-free rate (rf) was set at 2% based on the 3-year government bond rate, and the unit of time is in years. Based on this, the rise rate (u), fall rate (d), and the risk-neutral probabilities (p) were calculated using Equations (2), (3), and (5); Table 9 reports the results.
Table 9. Guaranteed savings contract—key information.
VariablesEstimated Value
Underlying asset (S)668,158 USD
Put option exercise price (Xp)607,416 USD
Call option exercise price (Xc)759,270 USD
Volatility(σ)10.0%
Risk-free rate (rf)2.00%
Time interval1 year
Rise Rates (u)1.105
Fall Rates (d)0.905
Risk-neutral probability (p)0.576
Using the values from Table 9, Table 10 provides the various probable scenarios for the underlying asset generated from the forward process. The maximum energy savings value is approximately USD 1,643,403, and the minimum is approximately USD 271,653.
Based on the binomial tree of S’s distribution created from the forward process, the backward process was applied to calculate the value of the guarantee obtained by the energy user, which is the difference between the energy savings and guaranteed savings calculated using the put option valuation model. As shown in Table 11, the value of the guarantee owned by the energy user is USD 15,601.
Table 10. Results of S’s distribution using the forward process.
0123456789
668,158738,429816,090901,919996,7751,101,6061,217,4631,345,5051,487,0131,643,403
604,574668,158738,429816,090901,919996,7751,101,6061,217,4631,345,505
547,041604,574668,158738,429816,090901,919996,7751,101,606
494,984547,041604,574668,158738,429816,090901,919
447,880494,984547,041604,574668,158738,429
405,258447,880494,984547,041604,574
366,693405,258447,880494,984
331,797366,693405,258
300,223331,797
271,653
Table 11. Valuation of guarantees for the energy user using the backward process (put option).
0123456789
15,601775229687013500000
26,99314,61461861638850000
45,07326,74512,6543823204000
72,08347,13925,240891649100
109,34879,09448,59220,77511820
155,580124,23788,65148,3572842
205,472178,411147,538112,433
251,901228,741202,158
295,224275,619
335,764
Next, the value of right to profit is the difference between the energy savings and target savings, calculated using the call option valuation model. As shown in Table 12, the value of right to profit is USD 94,651. At this point, the value of the guarantee obtained by the energy user and the value of the ESCO’s right to profit must be equal, and as such requires a ratio that distributes the value of the right to profit, calculated using Equation (1). Table 13 shows the profit distribution ratio for the ESCO as 16.5%.
An analysis was performed on the ESCO profit distribution ratio, as shown in Table 14. Guaranteed savings (Xp), target savings (Xc), and volatility were selected as major variables for the sensitivity analysis. Guaranteed savings and target savings are the points where guaranteed value and right to profit are created. When each one changes, there is an impact on the guaranteed value and the right to profit. As volatility is an index that indicates the extent of energy savings uncertainty, it is likely to have a great influence on the ESCO profit distribution ratio.
Based on the results of the analysis, we confirmed that the ESCO profit distribution ratio increases as the guaranteed savings (Xp) increases. Since the increased guaranteed savings (Xp) means that a relatively high business safety of the ESCO is provided to the energy user through the guarantee, the ESCO profit distribution ratio increases. We also confirmed that the ESCO profit distribution ratio increases as the target savings (Xc) increase. Since the increased target savings (Xc) means that acquiring profit becomes relatively difficult following excessive performance, the right to profit decreases. As the guaranteed value that is calculated under the condition of fixed guaranteed savings (Xp) and the volatility are identical, the ESCO profit distribution ratio increases relatively. Finally, we confirmed that the ESCO profit distribution ratio increases as volatility increases. An increase in volatility means greater uncertainty for energy savings, which eventually increases the ESCO profit distribution ratio.
Table 12. Valuation of right to profit using the backward process (call option).
0123456789
94,651131,390179,186239,637313,746401,651502,707616,249742,924884,133
49,23472,693105,559150,319209,192283,386372,254473,321586,235
19,70431,49849,76677,475118,322176,092252,589342,336
4619818214,49225,66945,46780,535142,649
000000
00000
0000
000
00
0
Table 13. ESCO Profit distribution ratio.
CategoryEstimated Value
Value of guarantee15,601 USD
Value of right to profit94,651 USD
ESCO Profit distribution ratio16.5%
Table 14. Results of sensitivity analysis.
Xc (USD)Volatility (%)Xp (USD)
560,000580,000600,000620,000640,000668,158
668,1585%0.17%0.34%0.77%1.21%1.92%4.21%
10%7.07%8.58%10.10%13.34%17.10%22.39%
15%16.64%19.07%23.15%27.24%31.32%37.07%
680,0005%0.19%0.37%0.84%1.31%2.07%4.56%
10%7.42%9.01%10.60%14.01%17.95%23.51%
15%17.19%19.71%23.93%28.15%32.37%38.31%
710,0005%0.24%0.46%1.05%1.64%2.59%5.69%
10%8.49%10.32%12.14%16.04%20.5%26.91%
15%18.78%21.54%26.15%30.76%35.37%41.86%
740,0005%0.30%0.58%1.33%2.07%3.27%7.19%
10%9.90%12.02%14.14%18.68%23.94%31.35%
15%20.70%23.74%28.82%33.90%38.98%46.13%
770,0005%0.40%0.79%1.80%2.81%4.43%9.74%
10%11.05%13.42%15.79%20.87%26.74%35.01%
15%23.06%26.44%32.09%37.75%43.41%51.38%
800,0005%0.54%1.05%2.39%3.73%5.89%12.95%
10%12.51%15.20%17.88%23.63%30.28%39.64%
15%24.88%28.53%34.63%40.74%46.85%55.44%

5. Discussion and Conclusions

This paper proposes a profit distribution model based on the collar option model to support fair decision-making in guaranteed savings contracts between an energy user and an ESCO. The profit distribution model uses the guaranteed and target savings as reference points to calculate the value of the guarantee and the right to profit. The right to profit was set to equal the value of the guarantee to calculate the profit distribution ratio.
When the profit distribution model was applied to a case study, the project had a profit distribution ratio of 16.5%. This also uses probability theory to objectively determine the profit distribution ratio, and could improve past methods where decisions were based on past experience. Moreover, this model easily calculates the profit distribution ratio for different scenarios according to changes in the target and guaranteed savings. In other words, this model can be used to assess various profit structure scenarios in guaranteed savings contracts.
For Korea, aging buildings is a serious issue since approximately 74% of all buildings are more than 20 years old, and many of these have very low energy efficiency. On the national level of energy supply and demand, energy efficiency in the building sector is highlighted as a very important issue, and the related technology is developing at a rapid rate. From this perspective, the Korean ESCO market has a very high potential for growth.
ESCOs mainly depend on financial support from the government. This is because investment in the private market is not voluntarily undertaken. To induce active participation of the private sector in the ESCO business, the improvement of profitability and transparency, and the promotion of the ESCO business are critical. From this point of view, the ESCO profit distribution model suggested in this paper is believed to be effective in securing the transparency and objectivity of the ESCO contract. However, the real problem of the ESCO profit distribution model is the reliability of the variables that are determined during the initial business contract, such as guaranteed savings, target savings, and predicted savings. The technology and professional manpower that are currently required for a comprehensive energy diagnosis are not sufficient in most cases except for several companies in Korea. Moreover, energy users cannot logically determine each condition in the contract, as they are usually not equipped with professional knowledge in the ESCO business.
In solving these problems to enhance the usability of the ESCO profit distribution model and to guarantee the transparency and objectivity of the ESCO contract, public institutions that have public confidence need to comprehensively manage the verification work on the clauses within the initial contract. Moreover, if direct intervention by public institutions is likely to create a market disturbance, public institutions will need to provide support by reviewing the introduction of the systems, such as the ESCO certificate system at a minimum, so that energy users can built trust in the ESCO.
The advancement of management is also important in the development and commercialization of technology. We believe that if energy savings reliability can be secured, the ESCO profit distribution model suggested in this paper will contribute to the vitalization of the ESCO market in Korea.

Acknowledgments

This research was supported by Basic Science Research Program through the National Research Foundation of Korea (NRF) funded by the Ministry of Science, ICT & Future Planning (No. 2015R1A5A1037548).

Author Contributions

Sanghyo Lee developed the concept and drafted the manuscript. Sungho Tae revised the manuscript and supervised the overall work. Sungwoo Shin reviewed the manuscript. All authors read and approved the final manuscript.

Conflicts of Interest

The authors declare no conflict of interest.

References

  1. Pachauri, R.; Reisinger, A. IPCC Fourth Assessment Report; IPCC: Geneva, Switzerland, 2007. [Google Scholar]
  2. Pachauri, R.; Meyer, L. IPCC Fifth Assessment Report; IPCC: Copenhagen, Denmark, 2014. [Google Scholar]
  3. International Energy Agency (IEA). Energy Technology Perspectives 2010; IEA: Paris, France, 2010. [Google Scholar]
  4. Li, X.; Yang, F.; Zhu, Y.; Gao, Y. An assessment framework for analyzing the embodied carbon impacts of residential buildings in China. Energy Build. 2014, 85, 400–409. [Google Scholar] [CrossRef]
  5. Zabaneh, G. Zero net house: Preliminary assessment of suitability for Alberta. Renew. Sustain. Energy Rev. 2011, 15, 3237–3242. [Google Scholar] [CrossRef]
  6. Ionescu, C.; Baracu, T.; Vlad, G.; Necula, H.; Badea, A. The historical evolution of the energy efficient buildings. Renew. Sustain. Energy Rev. 2015, 49, 243–253. [Google Scholar] [CrossRef]
  7. Pfeiffer, A.; Koschenz, M.; Wokaun, A. Energy and building technology for the 2000 W society-potential of residential buildings in Switzerland. Energy Build. 2005, 37, 1158–1174. [Google Scholar] [CrossRef]
  8. Cellura, M.; Guarino, F.; Longo, S.; Mistretta, M. Different energy balances for the redesign of nearly net zero energy buildings: An Italian case study. Renew. Sustain. Energy Rev. 2015, 45, 100–112. [Google Scholar] [CrossRef]
  9. Ministry of Land Infrastructure and Transport (MOLIT). Available online: http://www.molit.go.kr/USR/NEWS/m_71/dtl.jsp?id=95072458 (accessed on 2 July 2015).
  10. DeCanio, S.J. The Efficiency Paradox: Bureaucratic and Organizational Barriers to Profitable Energy-Saving Investments. Energy Policy 1998, 26, 441–454. [Google Scholar] [CrossRef]
  11. Jaffe, A.B.; Stavins, R.N. The Energy-Efficiency Gap-What Does it Mean. Energy Policy 1994, 22, 804–810. [Google Scholar] [CrossRef]
  12. Goldman, C.A.; Hopper, N.C.; Osborn, J.G. Review of US ESCO industry market trends: An empirical analysis of project data. Energy Policy 2005, 33, 387–405. [Google Scholar] [CrossRef]
  13. Xu, P.; Chan, E.H.; Qian, Q.K. Success factors of energy performance contracting (EPC) for sustainable building energy efficiency retrofit (BEER) of hotel buildings in China. Energy Policy 2011, 39, 7389–7398. [Google Scholar] [CrossRef]
  14. Larsen, P.; Goldman, C.; Satchwell, A. Evolution of the U.S. energy service company industry: Market size and project performance from 1990–2008. Energy Policy 2012, 50, 802–820. [Google Scholar] [CrossRef]
  15. Painuly, J.; Park, H.; Lee, M.; Noh, J. Promoting energy efficiency financing and ESCOs in developing countries: Mechanisms and barriers. J. Clean. Prod. 2003, 11, 659–665. [Google Scholar] [CrossRef]
  16. Patari, S.; Sinkkonen, K. Energy Service Companies and Energy Performance Contracting: Is there a need to renew the business model? Insights from a Delphi study. J. Clean. Prod. 2014, 66, 264–271. [Google Scholar] [CrossRef]
  17. De T’Serclaes, P. Financing Energy Efficient Homes: Existing Policy Responses to Financial Barriers; International Energy Agency: Paris, France, 2007. [Google Scholar]
  18. Golove, W.H.; Eto, J.H. Market Barriers to Energy Efficiency: A Critical Reappraisal of the Rationale for Public Policies to Promote Energy Efficiency; Lawrence Berkeley National Laboratory: Berkeley, CA, USA, 1996.
  19. Brown, M.A. Market failure and barriers as a basis for clean energy policies. Energy Policy 2001, 29, 1197–1207. [Google Scholar] [CrossRef]
  20. Du, P.; Zheng, L.Q.; Xie, B.C.; Mahalingam, A. Barriers to the adoption of energy-saving technologies in the building sector: A survey study of Jing-jin-tang, China. Energy Policy 2014, 75, 206–216. [Google Scholar] [CrossRef]
  21. Zhang, X.; Platten, A.; Shen, L. Green property development practice in China: Costs and barriers. Build. Environ. 2011, 46, 2153–2160. [Google Scholar] [CrossRef]
  22. Shi, Q.; Zuo, J.; Huang, R.; Huang, J.; Pullen, S. Identifying the critical factors for green construction—An empirical study in China. Habitat Int. 2013, 40, 1–8. [Google Scholar] [CrossRef]
  23. Steinberger, J.; Niel, J.; Bourg, D. Profiting from megawatts: Reducing absolute consumption and emissions through a performance-based energy economy. Energy Policy 2009, 37, 361–370. [Google Scholar] [CrossRef]
  24. Vine, E. An International Survey of the Energy Service Company (ESCO) Industry. Energy Policy 2005, 33, 691–704. [Google Scholar] [CrossRef]
  25. Gan, D. Energy Service Companies to Improve Energy Efficiency in China: Barriers and Removal Measures. Procedia Earth Planet. Sci. 2009, 1, 1695–1704. [Google Scholar]
  26. Jensen, J.O.; Nielsen, S.B.; Harsen, J.R. Greening Public Buildings: ESCO-Contracting in Danish Municipalities. Energies 2013, 6, 2407–2427. [Google Scholar] [CrossRef]
  27. Li, J.; Colombier, M. Managing carbon emissions in China through building energy efficiency. J. Environ. Manag. 2009, 90, 2436–2447. [Google Scholar] [CrossRef] [PubMed]
  28. Myers, S. Finance theory and financial strategy. Interfaces 1984, 14, 126–137. [Google Scholar] [CrossRef]
  29. Trigeorgis, L.; Mason, S. Valuing managerial flexibility. Midl. Corp. Financ. J. 1987, 5, 14–21. [Google Scholar]
  30. Copeland, T.; Antikarov, V. Real Options: A Practitioner’s Guide; Texere: New York, NY, USA, 2003. [Google Scholar]
  31. Martins, J.; Marques, R.C.; Cruz, C.O. Real Options in Infrastructure: Revisiting the Literature. J. Infrastruct. Syst. 2015. [Google Scholar] [CrossRef]
  32. Cui, Q.; Johnson, P.; Quick, A.; Hastak, M. Valuing the Warranty Ceiling Clause on New Mexico Highway 44 Using a Binomial Lattice Model. J. Constr. Eng. Manag. 2008, 134, 10–17. [Google Scholar] [CrossRef]
  33. Kim, B.; Lim, H.; Kim, H.; Hong, T. Determining the Value of Governmental Subsidies for the Installation of Clean Energy Systems Using Real Options. J. Constr. Eng. Manag. 2012, 138, 422–430. [Google Scholar] [CrossRef]
  34. Park, T.; Kim, B.; Kim, H. Real Option Approach to Sharing Privatization Risk in Underground Infrastructures. J. Constr. Eng. Manag. 2013, 139, 685–693. [Google Scholar] [CrossRef]
  35. Lee, H.W.; Choi, K.; Gambatese, J.A. Real Options Valuation of Phased Investments in Commercial Energy Retrofits under Building Performance Risks. J. Constr. Eng. Manag. 2014. [Google Scholar] [CrossRef]
  36. Kashani, H.; Ashuri, B.; Shahandashti, S.M.; Lu, J. Investment Valuation Model for Renewable Energy Systems in Buildings. J. Constr. Eng. Manag. 2015. [Google Scholar] [CrossRef]
  37. Mirzadeh, I.; Birgisson, B. Evaluation of Highway Projects under Government Support Mechanisms Based on an Option-Pricing Framework. J. Constr. Eng. Manag. 2015. [Google Scholar] [CrossRef]
  38. Black, F.; Scholes, M. The Pricing of Options and Corporate Liabilities. J. Polit. Econ. 1973, 81, 637–659. [Google Scholar] [CrossRef]
  39. Hull, J.C. Options, Futures, and Other Derivatives; Prentice-Hall: Upper Saddle River, NJ, USA, 1997. [Google Scholar]
  40. Shan, L.; Garvin, M.J.; Kumar, R. Collar Options to Manage Revenue Risks in Real Toll Public-Private Partnership Transportation Projects. Constr. Manag. Econ. 2010, 28, 1057–1069. [Google Scholar] [CrossRef]
  41. Bettis, J.C.; Bizjak, J.M.; Lemmon, M.L. Managerial Ownership, Incentive Contracting, and the Use of Zero-Cost Collars and Equity Swaps by Corporate Insiders. J. Financ. Quant. Anal. 2001, 36, 345–370. [Google Scholar] [CrossRef]
  42. Cox, J.; Ross, S.; Rubinstein, M. Option pricing: A simplified approach. J. Financ. Econ. 1979, 7, 229–263. [Google Scholar] [CrossRef]
  43. Ho, P.S.; Liu, L.Y. How to Evaluate and Invest in Emerging A/E/C Technologies under Uncertainty. J. Constr. Eng. Manag. 2003, 129, 16–24. [Google Scholar] [CrossRef]

