Article

Landscape Ecological Risk Responses to Land Use Change in the Luanhe River Basin, China

Key Laboratory of Pollution Processes and Environmental Criteria of Ministry of Education, Numerical Simulation Group for Water Environment, Tianjin Key Laboratory of Environmental Remediation and Pollution Control, College of Environmental Science and Engineering, Nankai University, Tianjin 300350, China
*
Author to whom correspondence should be addressed.
Sustainability 2015, 7(12), 16631-16652; https://doi.org/10.3390/su71215835
Submission received: 20 September 2015 / Revised: 10 December 2015 / Accepted: 14 December 2015 / Published: 17 December 2015

Abstract

:
Land use change has large effects on natural ecosystems, which is considered to be the main factor in eco-environment change. We analyzed the future characters of land use change by the CLUE-S model and explored landscape ecological risk responses to land use change by the landscape ecological risk index method. Using the Luanhe River Basin as a case study, we simulated future land use change from 2010 to 2030 under 3 scenarios (i.e., trend, high economic growth, and ecological security), and identified the hotspots of land use change. Afterward, we quantitatively investigated the degree of land use development and landscape ecological risk patterns that have occured since 2000 and that are expected to occur until 2030. Results revealed that, under the three scenarios, construction land and forest are expanding mainly at the expense of agriculture land and grassland. The hotspots of land use change are located in the vicinity of Shuangluan and Shuangqiao District of Chengde City in the midstream of the Luanhe River Basin, where urbanization has been strong since 2000 and is projected to continue that way until 2030. During this time period, hotspots of land use development have been gradually transferring from the downstream to the midstream since 2000 and, again, is expected to continue that way until 2030, which will impact the spatial distribution of landscape ecological risk. We found that the landscape ecological risk of the entire basin has shown a negative trend. However, a few areas still have serious ecological risk, which are mainly located in the east of upstream (Duolun County and Weichang County), the middle region (Shuangluan and Shuangqiao District, Chengde County, and Xinglong County), and the downstream (Qinglong County). These can provide key information for land use management, and for helping to prepare future eco-environmental policies in the Luanhe River Basin.

1. Introduction

Land use and land cover (LUCC) change have been considered an important issue of global environmental change [1]. LUCC can be defined as the result of nature or human-driving forces [2]. Land use changes can transform a large proportion of land surface, which can influence biodiversity, water resources, carbon cycling, and radiation budgets [3]. Many studies have focused on land use and land cover change, which are necessary for understanding land use change mechanisms and future trends [4]. Meanwhile, LUCC is the critical base for further studies on the impact of land use change on ecological processes. Land use change can influence the change of landscape ecology, and landscape ecological studies can bridge the gap between planning and ecology [5]. Recently, models are considered to be very helpful tools for understanding the complex mechanisms of economic, social, and physical variables that affect land use change, and for evaluating the influence of land use change on environment and ecology [6]. Due to the possibility of simulating different scenarios, the CLUE-S model (Conversion of Land Use and its Effects at Small regional extent) is considered an excellent tool for providing decision makers with full support to improve land use management [4,7]. The CLUE-S model is a spatially explicit, dynamic, land use change model, and specifically developed for the analysis of land use in small regions. It is based on the CLUE (Conversion of Land Use and its Effects) model, which simulates land use change by empirically quantified relations between land use and its driving factors. It is considered to be suitable for scenario analysis in a wide range of study areas and land use change situations in order to better understand the complexity of land use change and to consider, among others, the exploration of future land use management options [8]. Recently, the CLUE-S model has been frequently and successfully used in different regions of the world to simulate spatiotemporal changes and conversion of land use, such as Philippines [6,7], Europe [9,10,11,12], United States [13], Indonesia [14], Japan [15] and others [16]. In China, the CLUE-S model also performs well in many regions, such as Beijing [17,18], Hong Kong [4], Yantai [19], Hun-Taizi River Watershed [20], and others [8].
Land use degree is an important research subject of land use change, which can reflect not only the natural attributes of land but also integrated effects of anthropogenic factors and natural factors [21]. It is a powerful indicator for the degree of land use development. The land use degree index method can quantify and analyze land use degree of different regions, which provides information for land use planning [22]. The regions with a high degree of land use development have intensive human activities. Additionally, ecological risk assessment at the landscape level is a significant ecological issue, on which many researchers have focused. Zhang et al. (2013) analyzed the temporal-spatial distribution of landscape ecological risk of Shiyang River Basin. The results showed that the trend of environmental deterioration was clear [23]. Weber (2004) studied the Chesapeake Bay Watershed’s landscape ecology and identified an ecological network and the most valued lands for protection. They indicated that much of the Chesapeake Bay Watershed was still fairly intact [24]. Malekmohammadi and Blouchi (2014) found that the highest risk areas of Shadegan International Wetland were in the northern region, and that the lowest risk zones were in the southern part of the wetland [25]. Tian et al. (2011) identified that the built-up areas in Kowloon and along the coast of Hong Kong Island exhibited the highest landscape fragmentation level of green spaces [26]. Ribeiro et al. (2015) found that the Minho river estuary is the third most naturally vulnerable among these systems [27]. The landscape ecological risk index (ERI) model was employed to assess the ecological risk at the regional landscape scale [28]. The ERI model is different from traditional ecological risk assessment. The ERI model pays more attention to spatial-temporal heterogeneity and the scale effect, and concerns the characteristics of spatial-temporal differentiation and the risk expression of the specific spatial pattern for ecological function and process.
Luanhe River is an important river in Bohai Rim that is another hot zone besides Changjiang (Yangtze) River Delta and Zhujiang (Pearl) River Delta in China [19,29]. The Luanhe River is also the vital water source and the guarantee of harmonious development of the social economies of North China including those of Tianjin, Tangshan, Chengde, and Qinhuangdao [30]. In the upstream of the Luanhe River Basin, there are core areas of the ecological environment construction of Beijing [31]; in the midstream of the Luanhe River Basin, there are two important reservoir systems (Panjiakou and Daheiting reservoirs), which are the source of Luanhe River Diversion Project that is the first inter-basin water supply project in China [30]; and, in the downstream, delta alluvial plain with developed transportation is the most important grain production base in the Hebei Province [32]. Indeed, the Luanhe River Basin has an important political, economic, and ecological status due to the advantage of the natural and economic factors. However, unreasonable land use has seriously influenced the landscape function and deteriorated ecological environment in this basin, such as serious grassland degradation in the upstream, wetland atrophy in the downstream plain, reduced water source, and others [33]. Furthermore, the worsening eco-environment in this basin has led to the decrease in the environmental quality of the atmosphere of the whole of North China, especially Beijing and Tianjin [31]. For example, the desertification in the upstream of the Luanhe River Basin has led to the sandstorms in Beijing and Tianjin. Indeed, the Luanhe River Basin is facing increasing conflicts with regard to environment protection and land use development because of the rapid development of the economy and the increase in population. Previous studies in this basin have mainly focused on investigating the historical land-use change processes of the Luanhe River Basin, or one part of this basin. Little attention has been paid to the future development of land use and its eco-environment effects. These studies can improve our understanding of the causes and consequences of land use change [8]. First, the analysis of possible future land use is quite important because decision-makers are interested not only in the future potential risk but also in the information of adjusting land use planning [34]. Second, the analysis of the spatio-temporal patterns of land use can act as a foundation for the investigation of the development status of potential ecological risk. In addition, landscape ecological risk and the regional differences of the degree of land use will put forward a theoretical basis for land use planning in the Luanhe River Basin whereby it can be decided whether certain regions can continue to be developed, or have reached their limit. These studies will influence future land use by achieving a balance between environmental and stakeholder needs [7]. Therefore, the research of future land use change and its eco-environment effects in the Luanhe River Basin are vital.
In this study, the CLUE-S model is used to simulate three scenarios occurring between 2010 and a possible 2030 in a spatially explicit manner and to produce maps of potential future land use for the Luanhe River Basin. Further, the landscape ecological risk index and land use degree index are used to analyze the temporal and spatial dynamics of landscape ecological risk and land use development. The primary objectives of this study are to: (1) study the driving factors of land use change, analyze the trend of spatio-temporal distributions of land use change and the degree of land use development, and identify the hotspots of land use change and land use development from 2000 to 2030; and (2) investigate the temporal and spatial dynamics of landscape ecological risk and identify the critical ecological risk areas in this basin from 2000 to 2030.

2. Materials and Methods

2.1. Study Area

The Luanhe River Basin is located in the north of China, which involves 27 counties (districts/banners) of Hebei Province, Inner Mongolia and Liaoning Province (Figure 1), such as Guyuan County, Taipusi Banner, Zhenglan Banner, Keshiketeng Banner, Duolun County, Fengning County, Shuangluan Direct and Shuangqiao Direct of Chengde City, and Chengde County. The Luanhe River is the most important water resources of North China. The area of the Luanhe River Basin is about 44,750 km2, and 98.2% of the total area is mountainous [35]. The population is about 13.42 million, with a density of 225 residents/km2 [36]. The study area has a prosperous economy; the GDP per capita of this basin is 1.46 times of the national average [36]. However, the problem of ecological environment is serious, such as grassland degeneration, desertification and soil erosion [31,37]. The dominant land use types are forest, agriculture land, grassland, water, and construction land (Figure 2). Forest area is the largest, accounting for about 60% of the total area in this study area. From 2000 to 2010, the forest and grassland slightly increased. The construction land change was the most significant, with a 25% increase. On the contrary, agriculture land, water and other land slightly decreased (Figure 2).
Figure 1. Location of the Luanhe River Basin.
Sustainability 07 15835 g001
Figure 2. Land use maps of year 2000 (a); year 2010 (b) and spatial changes during 2000–2010 (c).
Sustainability 07 15835 g002

2.2. Data Sources

(1) All Landsat imagery in 2000 and 2010 (Landsat 5 TM), with a resolution of 30 m, was obtained from the United States Geological Survey (USGS) [38]. According to national land use classification criteria, and for the purposes of this study, types of land use are divided into six categories, namely forest, grassland, water, agriculture land, construction land and other land. The class aggregation of land use is as follows. Forest includes woodland with >30% canopy density, scrub and shrubs with >40% canopy density and <2 m tall, open forest land with between 10% and 30% canopy density, young afforested land, nursery gardens, and different kinds of orchard. Grassland consists of grass with coverage larger than 5% and grass-mixed scrub (canopy density <10%). Water areas are mainly comprised of rivers and reservoirs. Agriculture land includes irrigated arable land and rained croplands (non-irrigated arable land). Construction land contains built-up areas of city and town, rural residential areas, and industrial and mining areas. Other land includes sand, gobi, bare land and so on.
For an accuracy assessment of satellite images, image preprocessing was carried out, which included satellite image radiometric correction, geometric correction, image cropping, image mosaic, and image enhancement. Different land use types have different tones, shapes, sizes, textures, and associations. For example, in this study, construction land is white and caesious, and the shape is regular sheet; forest is dull-red, which has no textures and an irregular shape; water bodies are dark blue; agriculture land has a regular shape; and dry land is green or pink in the false color composite images (band combination 4, 3, 2). According to the above, land use information was extracted from the data by a combination of supervised classification and visual interpretation of satellite images using ENVI 4.8 and ArcGIS 9.3 [14,19]. Furthermore, random sampling for every land use type was used to sample about 10% of the total sample points [12]. The procedures were confirmed and produced a good Kappa coefficient of 0.85 through the verification test.
(2) Soil data (1:1,000,000) was derived from Harmonized World Soil Database, which was obtained from the Cold and Arid Regions Sciences Data Center at Lanzhou [39]. Soil textures and soil organic matter were also derived from Harmonized World Soil Database.
(3) A 90 m × 90 m DEM was downloaded from the USGS [40]. Slope, aspect, and elevation were created from the DEM by ArcGIS 9.3.
(4) Meteorological data (temperature, precipitation, solar radiation) were obtained from the Data Center for Resources and Environmental Sciences, Chinese Academy of Sciences (RESDC) [41].
(5) Social economic data such as population density and GDP (2000 and 2010) were provided by the Data Center for Resources and Environmental Sciences, Chinese Academy of Sciences (RESDC) [42].
(6) The transport vector map of 2009 came from National Road Traffic Data, which was used for the analysis of road locations.
According to the quality of the data and situation of the study area, all data were transformed into a consistent spatial coordinate system (GCS_Krasovsky_1940, Albers Conical Equal Area) and resolution (1000 m × 1000 m) for subsequent analyses.

2.3. Modeling Approach

2.3.1. CLUE-S Model

The CLUE-S model requires parameterization of the following components: land use requirements (demand), location characteristics, land use type conversion characteristics, and spatial policies and restrictions [7,16].
(1) Land Use Requirements (Demand)
The demands of different land use types determine the actual area of each land use type, allocated by the CLUE-S model [9]. Land use demands are calculated at the aggregate level (the level of the Luanhe River Basin as a whole) as part of a specific scenario, which constrain the simulation by defining the total required change in land use [6]. In this study, land use requirements of the Luanhe River Basin were calculated by an extrapolation of trends [6,14].
(2) Location Characteristics
Location characteristics imply that a series of factors impact the land use change. These factors determine the relative suitability of a location for the different land use types [6,14], which are chosen to analyze the probable location of six land use types in this study area.
These driving factors can be divided into two categories: bio-physical factors and socio-economic factors, which were used for the analysis in the logistic regression and the CLUE-S model [7,19]. In this study, based on related previous researches and the actual situation of the Luanhe River Basin [8,9,14,
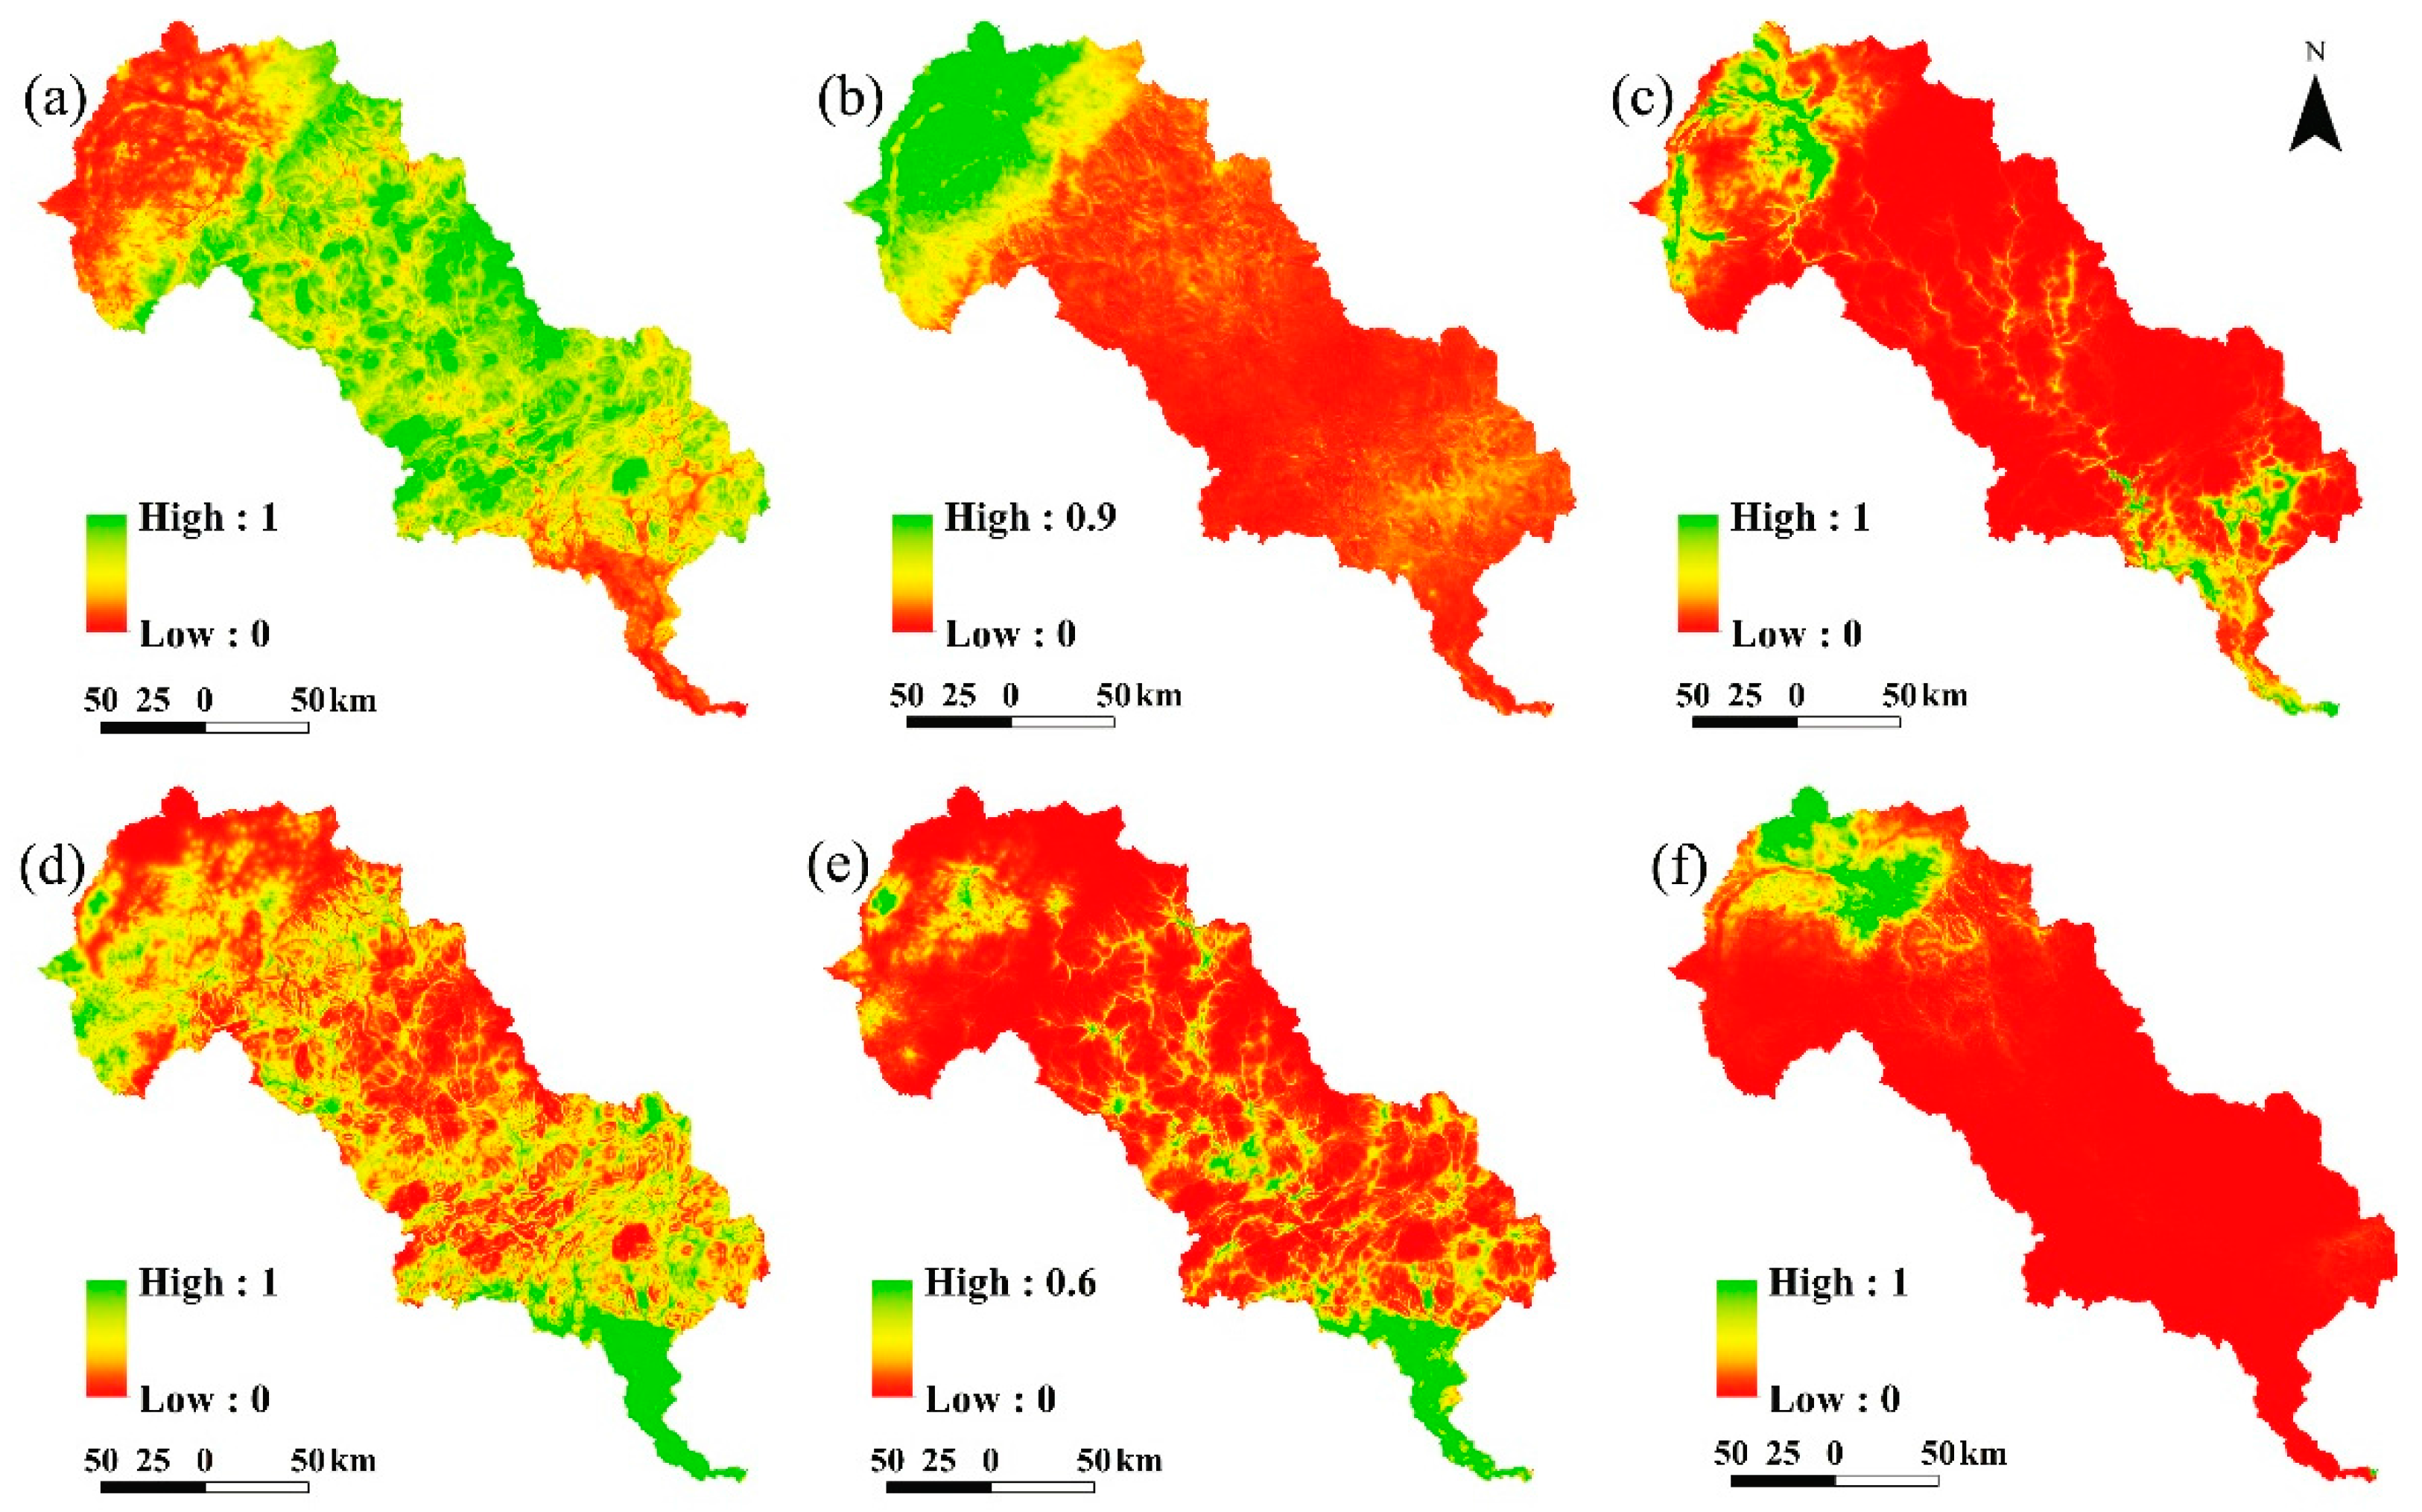
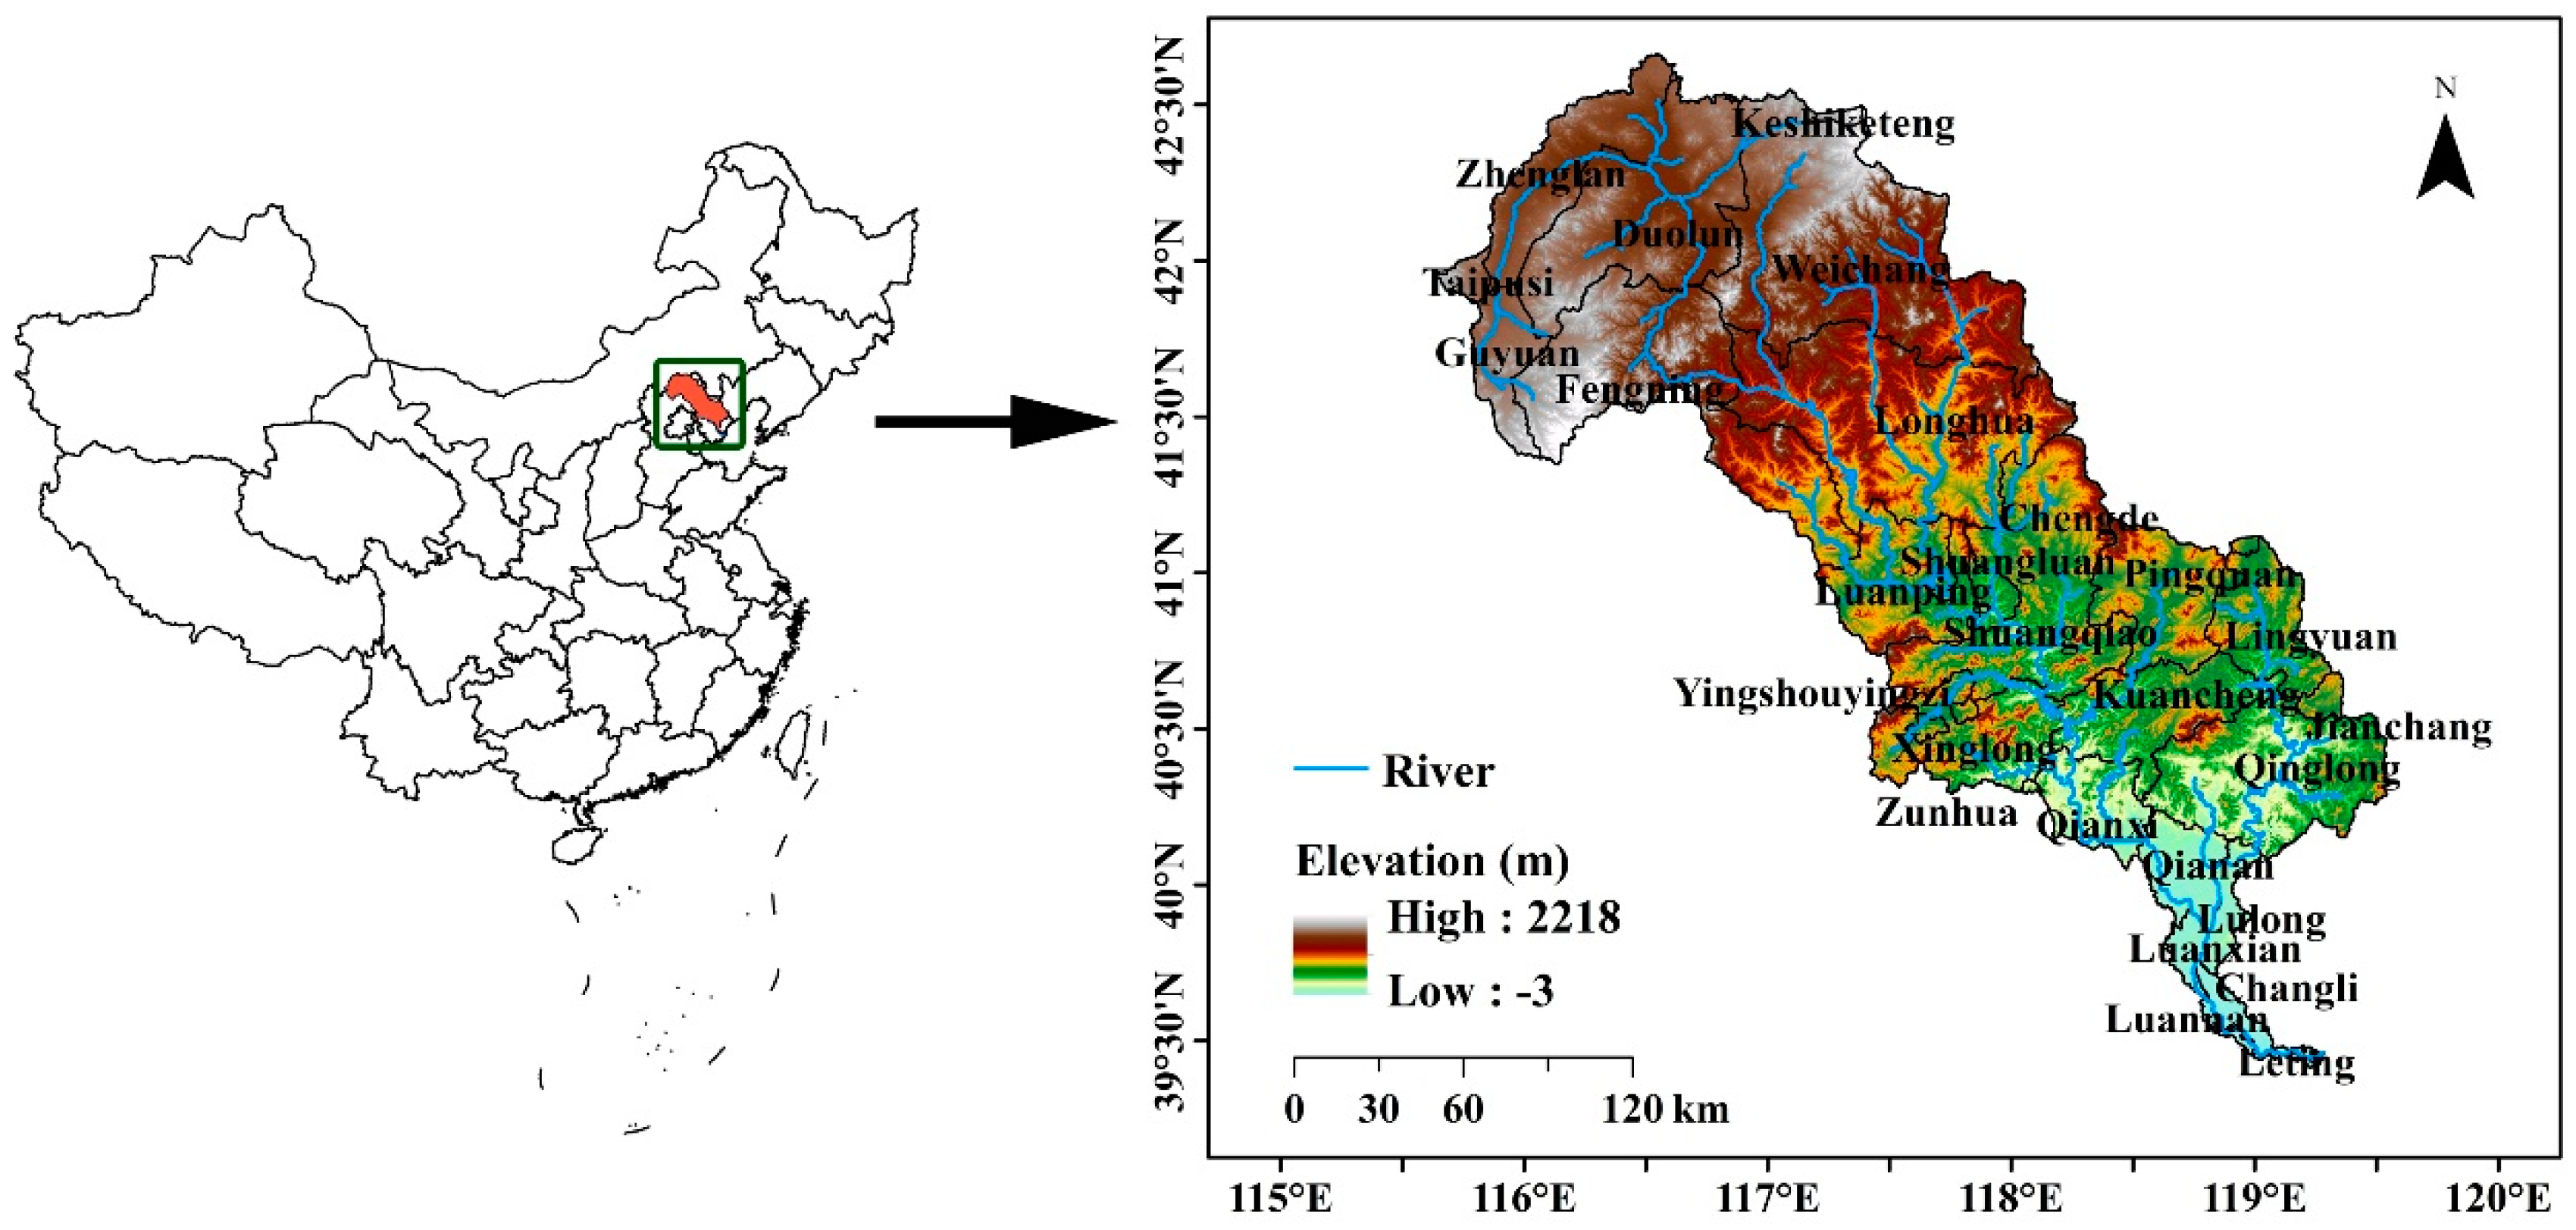
20], 19 driving factors were chosen, including 9 bio-physical factors (elevation, slope, aspect, annual mean temperature, annual mean precipitation, solar radiation, soil texture, soil organic matter, and distance to river) and 10 socio-economic factors (population density, GDP, distance to city center, distance to town center, distance to rural settlement, distance to railway, distance to high way, distance to national road, distance to provincial road, and distance to county road). In this study, slope, aspect, and elevation were created from the DEM by ArcGIS 9.3. The above driving factors related to distance were calculated using spatial analysis tools of ArcGIS 9.3 based on the transport vector map of 2009. Annual mean temperature, precipitation and solar radiation are attained by the spatial interpolation of meteorological data from 1970 to 2010. We used SPSS 13.0 to make the collinearity diagnostics to prevent the correlation of driving factors.
Logistic regression is an essential step in the simulation process, which aims to examine the relationships between location factors and different land use types [4]. The stepwise procedure can help to select the relevant driving factors that are assumed to influence the land use pattern. If variables have no significant contribution to the explanation of land use pattern, they will be excluded from the final regression equation [7]. In this study, a binary logistic regression model is used to investigate the effects of selected driving factors on the probability of land use transition and to calculate maps of the relative suitability for the different land use types. The logistic regression model [7] is as follows:
log ( P i 1 P i ) = β 0 + β 1 X 1 , i + β 2 X 2 , i + + β n X n , i
where Pi is the probability of a grid cell for the occurrence of the considered landuse type i; X is the driving factor; β is estimated through logistic regression using the actual land use pattern as a dependent variable. The dependent variable is a binary vector coded as 1 (changed) or 0 (no change) [19]. Landuse categories and driving factors for each raster cell are determined by ArcGIS 9.3 and transformed into ASCII data, which are further analyzed by binary logistic regression in SPSS 13.0 to determine the relationship between each landuse type and its influence factors [43]. Finally, the beta values of logistic regression (β), Exp(β) and ROC (relative operating characteristic) can be obtained. Exp(β) values indicate the change in odds upon a one-unit change in the independent variable. When Exp(β) > 1, the probability increases upon an increase in the value of the independent variable; when Exp(β) < 1, the probability decreases [7,8]. The Relative Operating Characteristic (ROC) was applied to evaluate the good fit of the logistic regression model [7]. A ROC value of 0.5 indicates complete randomness and a ROC value of 1 indicates a perfect fit [6,44].
(3) Land Use Type Specific Conversion Conditions
Land use types have specific characteristics that influence their conversion and cause the differences in their spatio-temporal behaviors [9]. Each land use type needs a value to be specified that represents the relative elasticity of change, ranging from 0 (easy conversion) to 1 (irreversible change) [6]. The conversion elasticity reflects the relative elasticity of change from one land use type to any other land use type in the CLUE-S model [7]. In this study, the conversion elasticity is obtained from the experience of experts and from repeatedly modifying the calibration of the model in order to achieve the optimal simulating effect. Finally, the conversion elasticity values of forest, grassland, water area, agriculture land, construction land and other land are 0.9, 0.2, 0.8, 0.2, 0.9 and 0.9 respectively.
(4) Spatial Policies and Restrictions
The CLUE-S model provides the definition of land use policies and areas restricted from land use conversions [38]. In this study, based on the actual situation of the Luanhe River Basin, there are no special restriction zones or regions on land conversion within the study area.
(5) Model Validation
Kappa is generally used to evaluate the validity of resulted land use map from the CLUE-S model, which is more reliable than simple percent agreement calculation because it considers chance agreement [
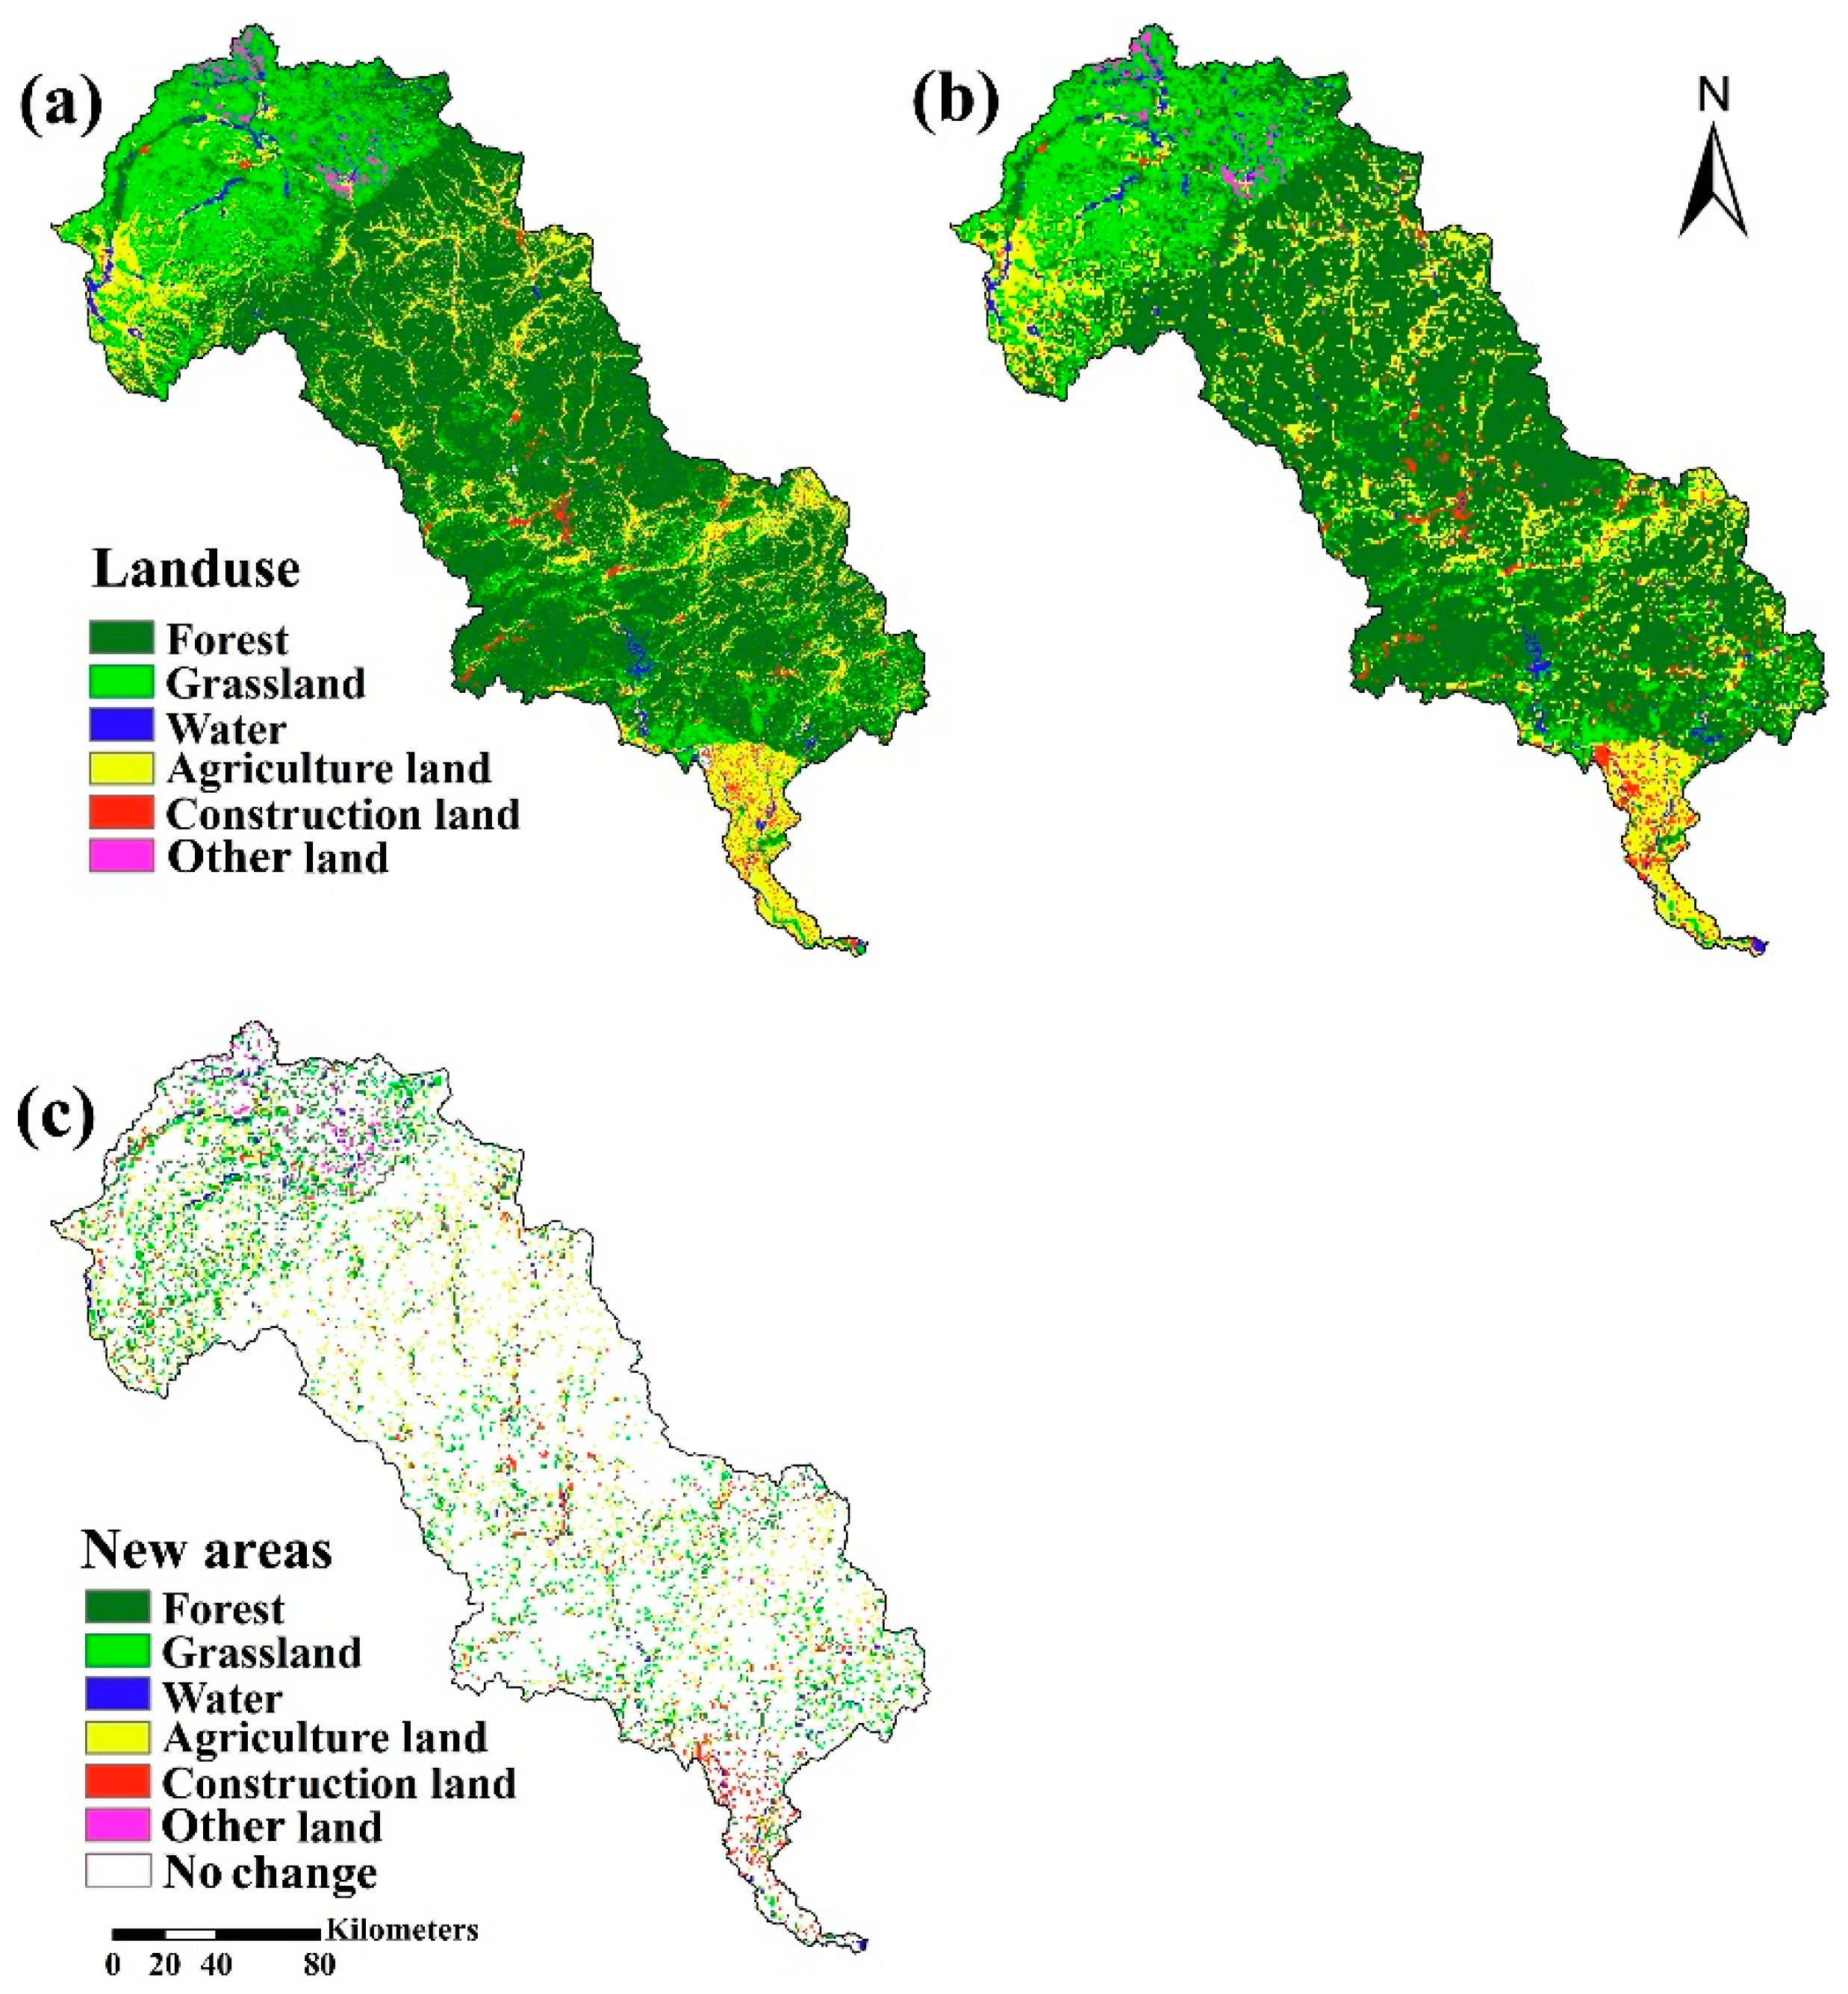
4]. In this study, the simulated land use in 2010 of the Luanhe River Basin that is based on land use in 2000 by the CLUE-S model is compared to land use in 2010. The general equation for Kappa is as follows:
K a p p a = ( P 0 P c ) / ( P p P c )
where P0 is the observed correct proportion, Pc is the expected correct proportion due to chance, and Pp is the correct proportion when classification is perfect [45]. When Kappa = 1, the two comparing maps are in complete agreement; when Kappa > 0.8, the two comparing maps are in strong agreement; when 0.6 < Kappa < 0.8, the two comparing maps are in high agreement; when 0.4 < Kappa < 0.6, the two comparing maps are in moderate agreement; and when Kappa < 0.4, the agreement is poor [46].
In order to more comprehensively evaluate the validity of simulated land use map, Kstandard (standard kappa), Kno (alternative kappa), Klocation (location kappa), and Kquantity (quantity kappa) were specially developed based on Kappa. A more detailed description of these special Kappa statistics are given by Pontius (2000), which could distinguish between quantification error and location error [45].
(6) Scenario Assumptions
Regarding the development of future land use, scenarios are envisaged according to the approximation of possible future development plans [11]. On the one hand, about 82% area of the Luanhe River Basin is located in the northeastern of Hebei Province so that we pay more attention to the future development goals and strategies of “General Land Use Planning in Hebei Province (2006–2020)”. The major goals on the future land use in this study are protecting the cultivated land, effectively controlling the construction land, and increasing the forest coverage rate. On the other hand, “The Sandification Combating Project Phase II for areas in the vicinity of Beijing and Tianjin (2013–2022)” is implemented across the entire basin. The major goal of the project is improving the eco-environment and realizing the sustainable development by returning the grain plots to forestry, afforestation, restoring degenerative grasslands [47]. In this study, based on land use spatial policies and planning (“General Land Use Planning in Hebei Province (2006–2020)” and “The Sandification Combating Project Phase II for areas in the vicinity of Beijing and Tianjin (2013–2022)”) in the near future, three main predictions regarding the possible development of scenarios for land use types are made about the Luanhe River Basin, spanning the period from 2010 to 2030. In the following, the scenarios used for the land use development are described in more detail.
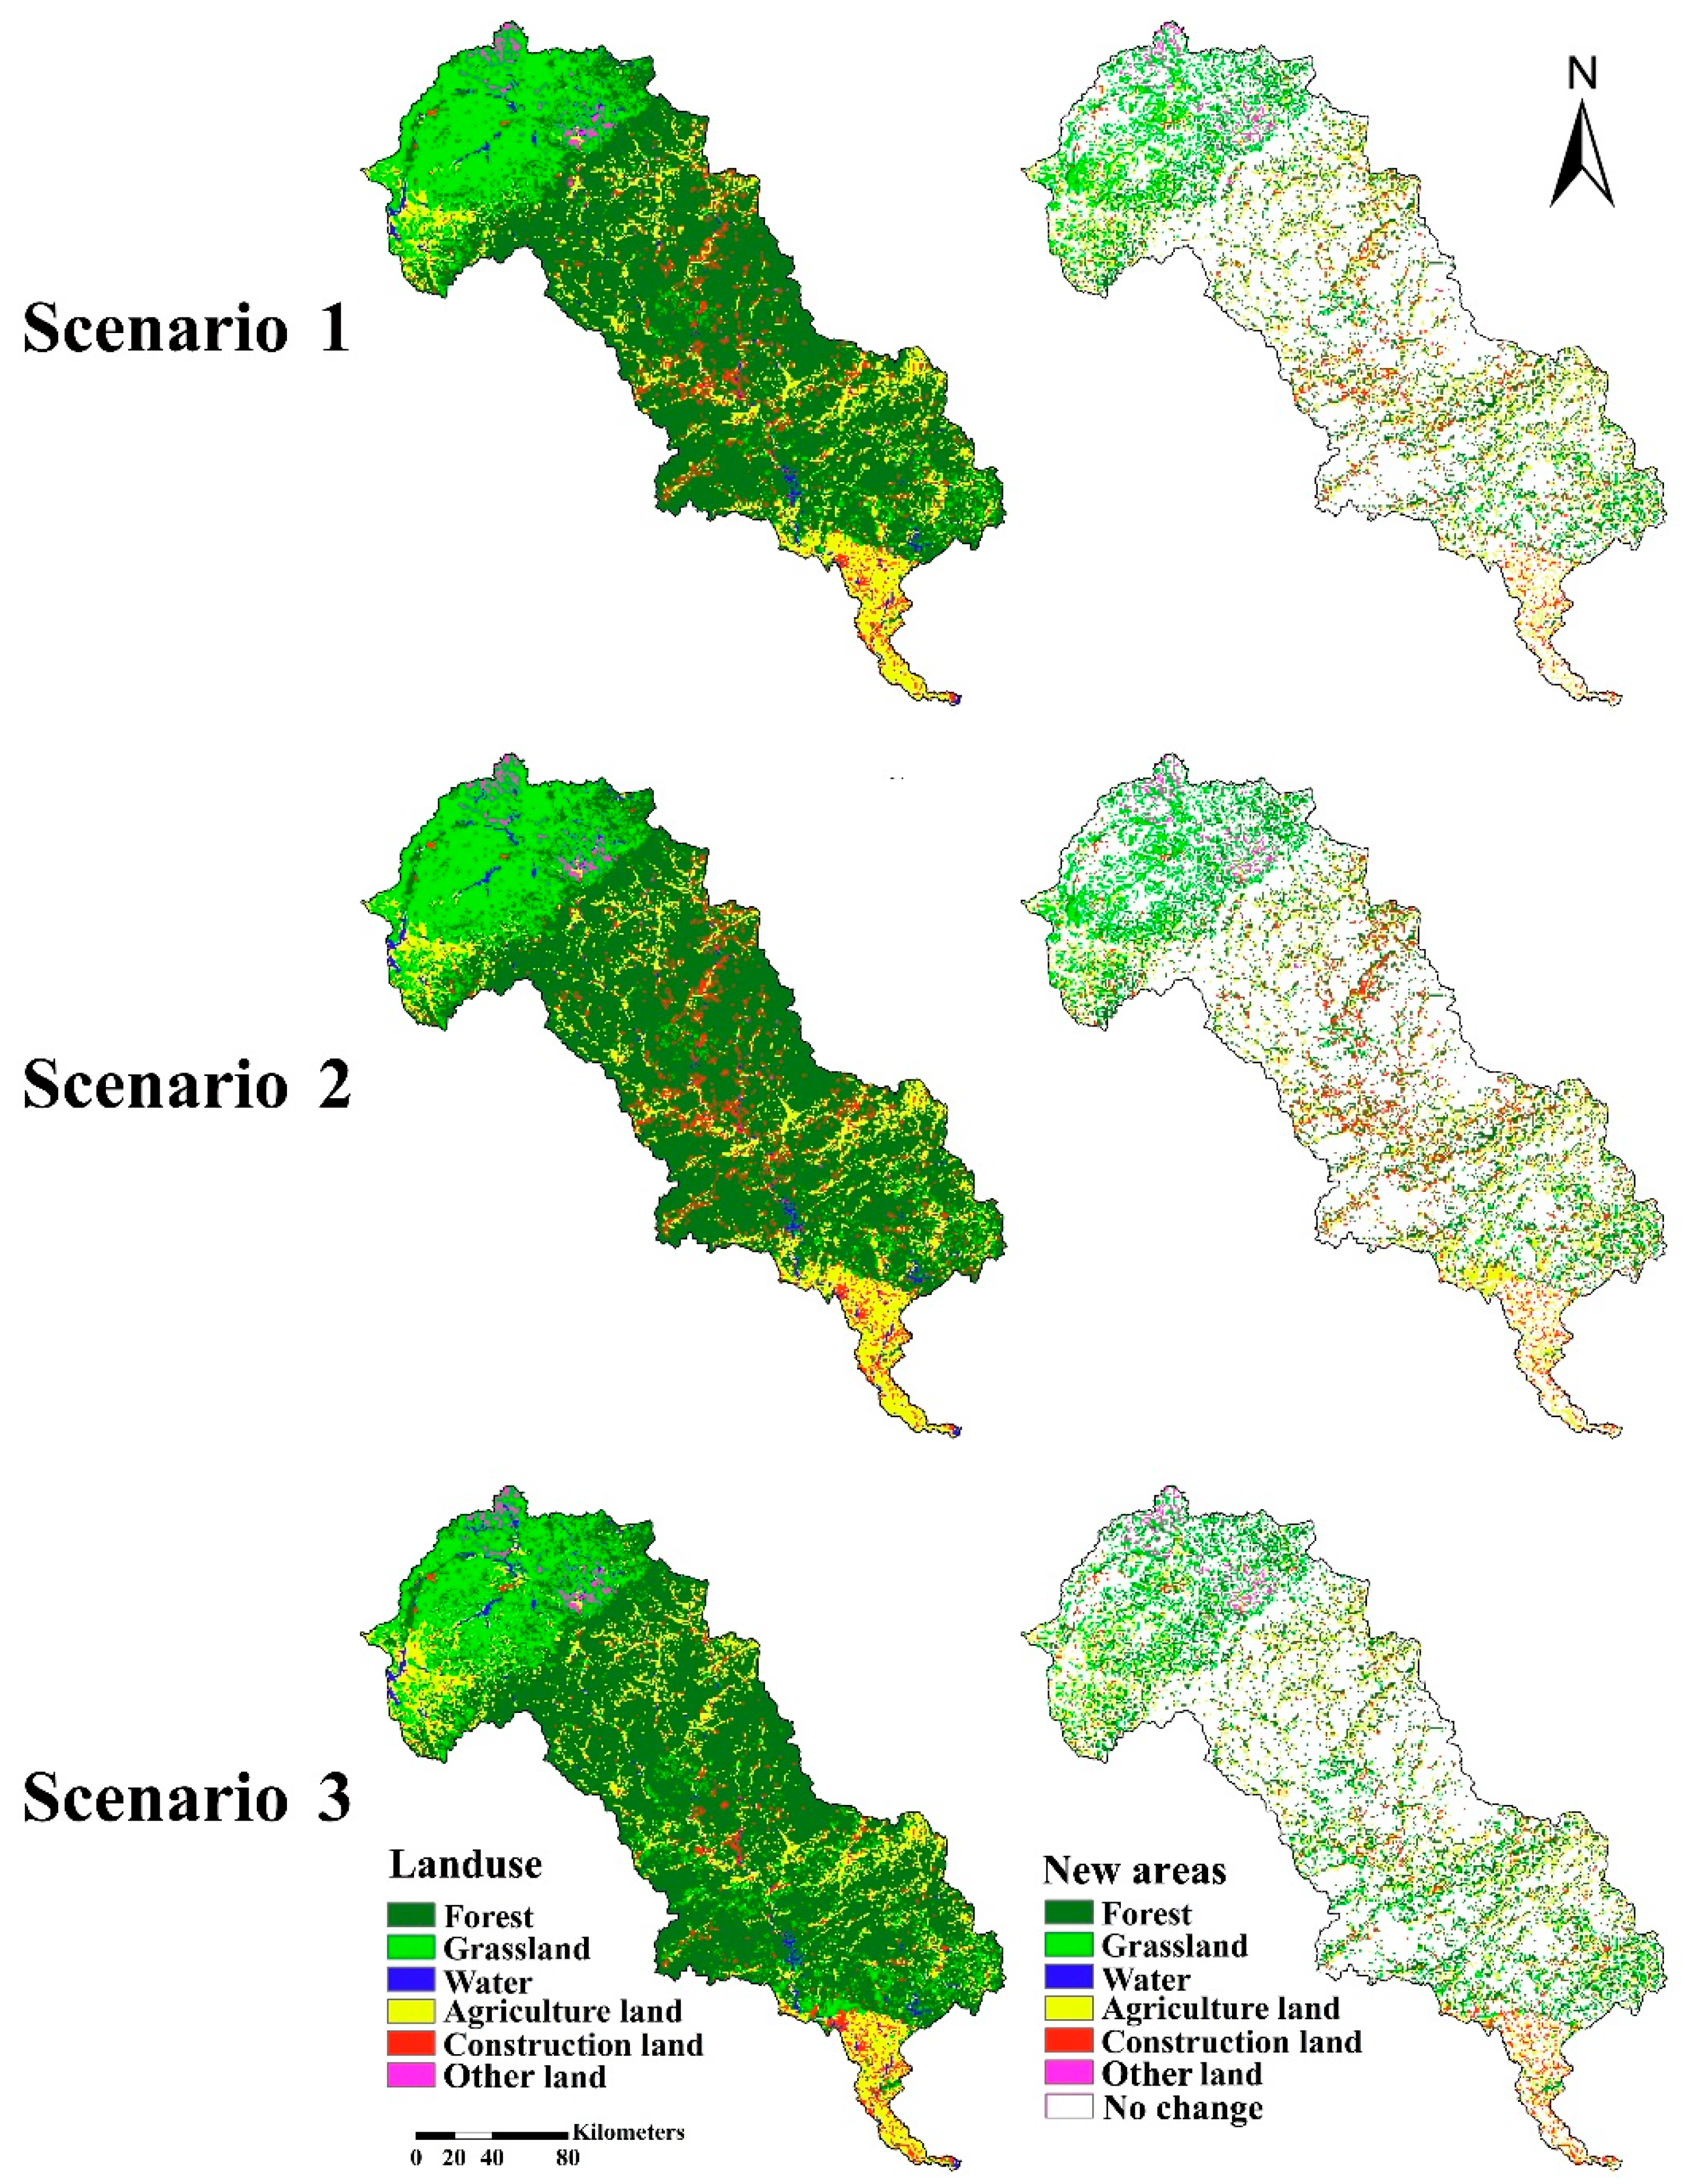
Scenario 1: Trend Scenario
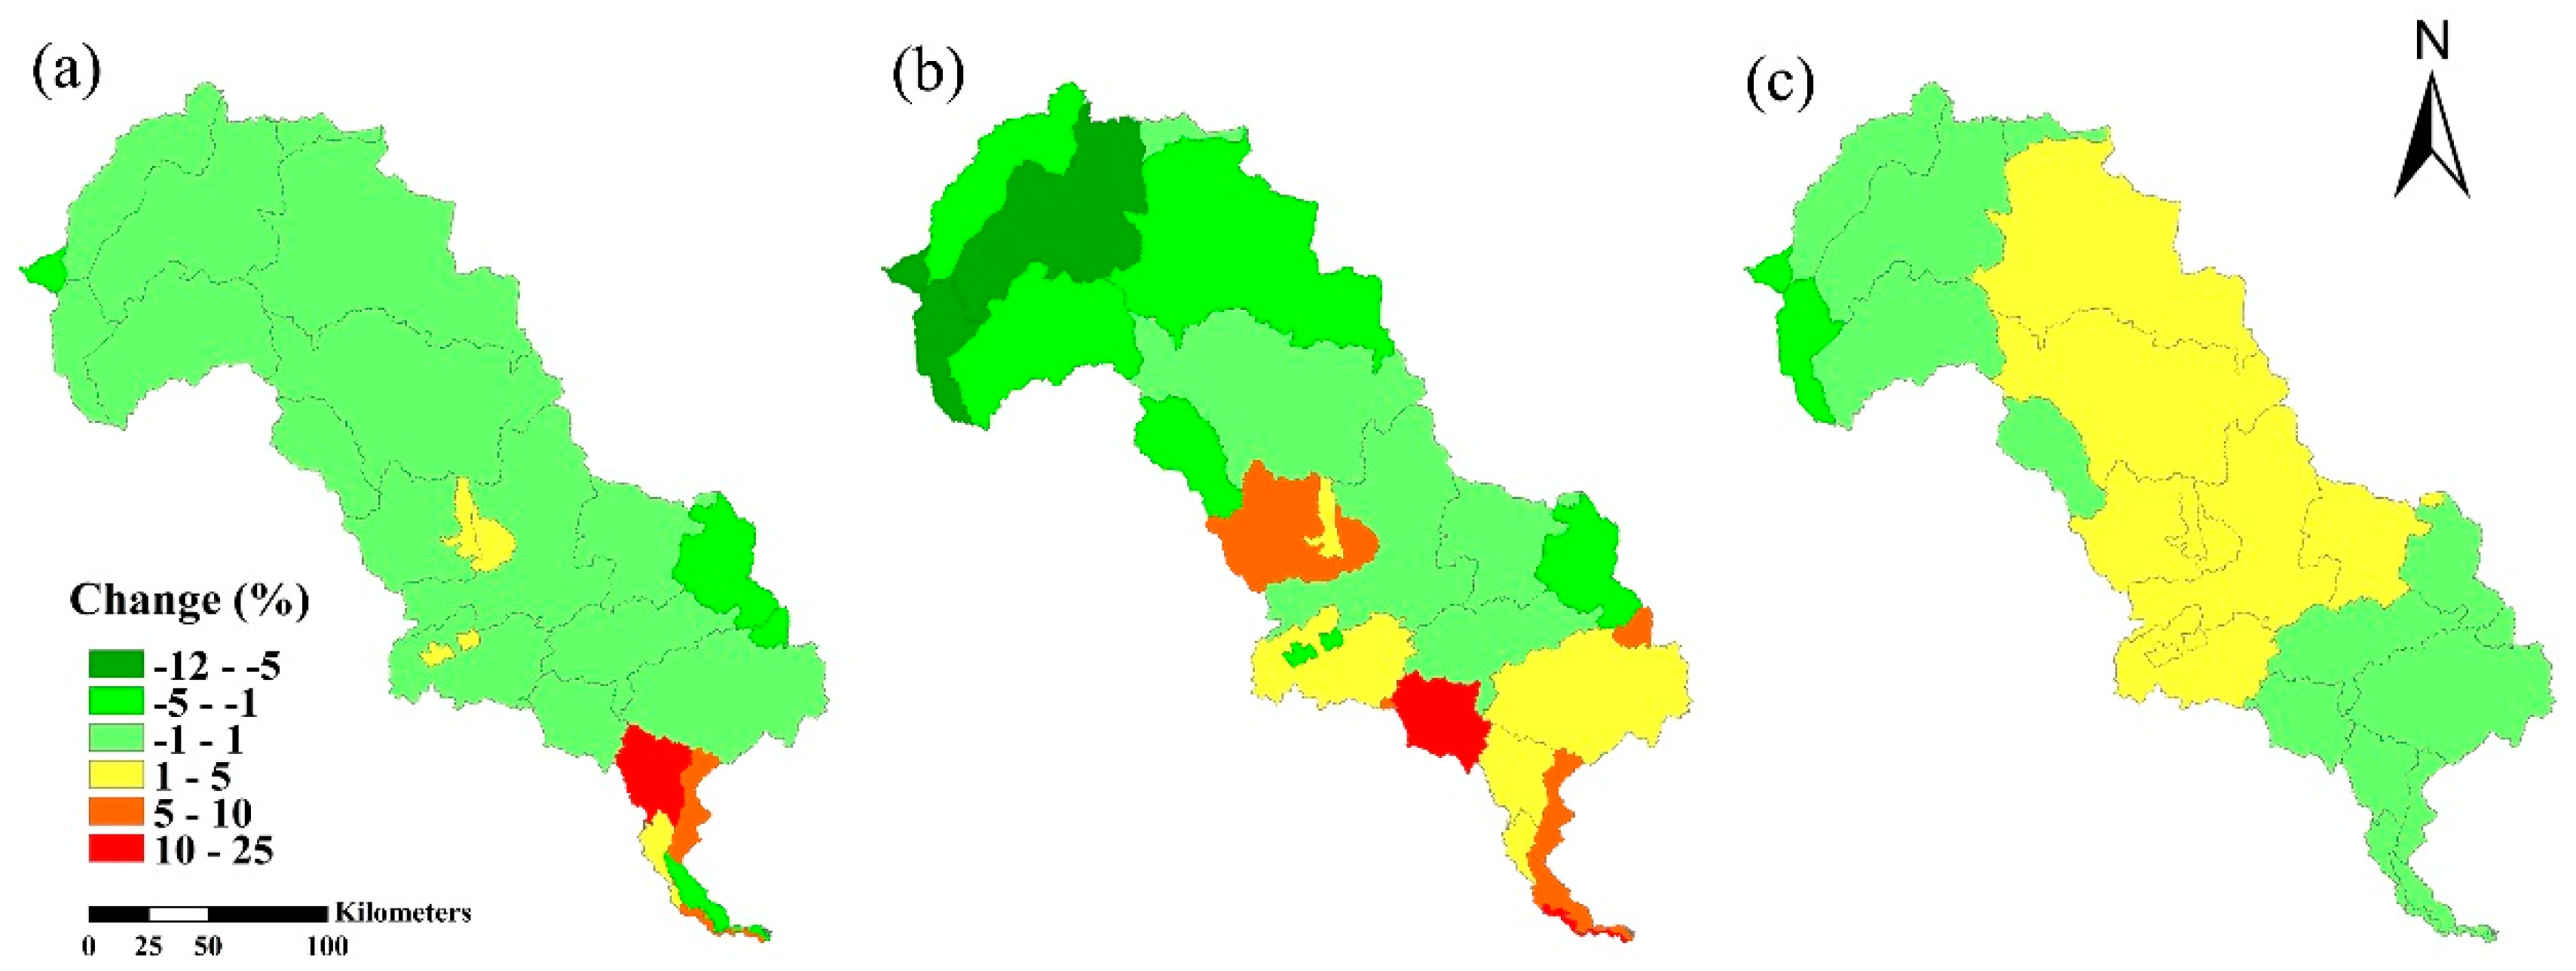
In this scenario, land use demand for the year 2030 is formulated based on the historical statistics of land use change from 2000 and 2010 by a linear interpolation of total area of each land use type. The trends show that the area of forest, grassland and construction land increases slowly by 0.75%, 1.4%, and 25.5%, respectively. On the contrary, the area of other land use types reduces continuously. The area of agriculture land, water and “other land” decreases by 5.8%, 3.5% and 19.5%, respectively. Therefore, assuming this scenario, by 2030, the area of forest, grassland and construction land will have increased by 1.5%, 2.8% and 51%, respectively; the area of agriculture land, water and “other land” will have decreased by 11.6%, 7%, and 39% respectively.
Scenario 2: High Economic Growth
This scenario assumes the economy of the Luanhe River Basin will continue growing at a high speed. This scenario type is characterized by an acceleration of rapid urbanization. By 2030, in this scenario, the area of construction land will have increased by 90%, and forest area will have increased by 1%. In addition, the area of agriculture land, grassland, water and “other land” will have decreased by 15%, 0.5%, 5%, and 40%, respectively.
Scenario 3: Ecological Security
There is an emphasis on the development of higher ecological awareness in the Luanhe River Basin. This implies that the expansion of construction land is slow. The area of forest, by comparison, is growing strongly. The agriculture land is protected, and land use types with high ecosystem service value such as grassland and water area are also protected. By 2030, in this scenario, the area of forest and construction land will have slowly increased by 2% and 10%, respectively. The area of agriculture land, grassland, and water will not have changed significantly. Meanwhile, “other land” area will have decreased by 50%.

2.3.2. Land Use Degree Index Method

The degree of land use can express comprehensively the degree of influence of human activities on land use change. In this study, the land use degree index method is used to analyze the quantitative change characters and trends in the degree of land use in the Luanhe River Basin. The index (I) of land use degree is calculated as [21]:
I = 100 × i = 1 n A i × C i
Δ I b a = I b I a = { ( i = 1 n A i × C i b ) ( i = 1 n A i × C i a ) } × 100
where I is the land use degree index of the study area; Ai is the ith grade index of land use degree classification; Ci is the area percentage of land use degree of ith level; ΔIb-a is the land use degree variability index, when ΔIb-a is a positive value, land use degree index of b zone is greater than that of a zone, otherwise the former is less than the latter; Ia is the land use degree index of the study area at the a time; Ib is the land use degree index of the study area at the b time; Cia is the area percentage of land use degree of ith grade at the a time; Cib is the area percentage of land use degree of ith grade at the b time. In accordance with previous research [21], and the actual situation of this study area, the land use degree is divided into four grades (Table 1).
Table 1. Grades of land use degree classification.
Land Use TypeGrade Index
Other land1
Forest, Grassland, Water2
Agriculture land3
Construction land4

2.3.3. Landscape Ecological Risk Index Method

In this research, landscape ecological risk of the Luanhe River Basin is analyzed using the landscape ecological risk index method, which can quantitatively evaluate the spatial and temporal distribution characteristics of landscape ecological risk based on landscape disturbance index and landscape fragility [48]. A more detailed description of the method is given as follows:
(1) Landscape ecological risk index (ERI)
E R I i = i = 1 N A k i A k ( E i × F i )
where ERIi is the ith risk area’s ecological risk index, Aki is the ith landscape’s area in the kth region. Ak is the area of kth region, Ei is the landscape disturbance degree index of ith landscape, Fi is the fragile index of ith landscape [23]. The detailed calculation methods of Ei and Fi are given in Table 2 [48].
Table 2. Calculation methods for landscape pattern indices.
NameCalculation Methods
Landscape Fragmentation Index (Ci) C i = n i / A i
Landscape Isolation Index (Si) S i = A × n i / A / 2 A i
Landscape Dominance Index (DOi) D O i = ( Q i + M i ) / 4 + L i / 2
Landscape Disturbance Index (Ei) E i = a C i + b S i + c D O i
Landscape Fragility Index (Fi)other land (0.7), water (0.6), agriculture land (0.5), grassland (0.4), forest land (0.3), and construction land (0.2) [49,50]
Note: ni, the number of patches ith landscape; Ai, the area of ith landscape; A, the area of all the landscape; Qi, the sample number of ith pattern/total number of samples; Mi, the number of ith patches/total number of patches; Li, the area of ith patches/area of samples; a, b, and c represent the weights of landscape fragmentation, landscape isolation and landscape dominance index, respectively, and a + b + c = 1.
In Table 2, the weights (a, b, c) of land use landscape indices in four periods (2000, 2010, 2020, and 2030) are obtained by the entropy weight method. This method can resolve the problem of many indices not having unique standard and reduce the disturbance of subjectivity in the assessment process in order to more objectively reflect the contribution of each index to ecological risk of this study area [51]. According to the entropy weight method, the weights of landscape indices in four periods (2000, 2010, 2020, and 2030) are respectively a = 0.2711, b = 0.6445, c = 0.0844 in 2000; a = 0.2707, b = 0.646, c = 0.0833 in 2010; a = 0.2911, b = 0.6183, c = 0.0906 in 2020; and a = 0.2923, b = 0.6182, c = 0.0895 in 2030.
(2) Sampling Method
In this study area, according to the scope of the study area and workload, the hexagonal grid sampling method is used to obtain 405 units with an area of 115 km2. Based on the above ERI method, the landscape ecological risk index was calculated for each sampling unit, and the result in each sampling unit was considered the ecological risk value of the central point of the sampling unit.
(3) Spatial Analysis Method
The regional ecological risk index can be analyzed by the geostatistics method to show the law of heterogeneity [23]. The semivariogram analysis is an essential component of geostatistics, which can describe and identify the spatial structure and is also applied to spatial interpolation (Kriging) [49]. The equation for Space Analysis [43] is as follows:
γ ( h ) = 1 2 N ( h ) i = 1 N ( h ) [ Z ( x i ) Z ( x i + h ) ] 2
where, γ(h) is the variation function, h is the step length, the matching of sampling space distance, N(h) is the interval distance of the sample logarithm, Z(xi) and Z(xi + h) are the observed values of the ecological risk index on the spatial location of xi and x + hi, i = 1, 2,…, N(h).
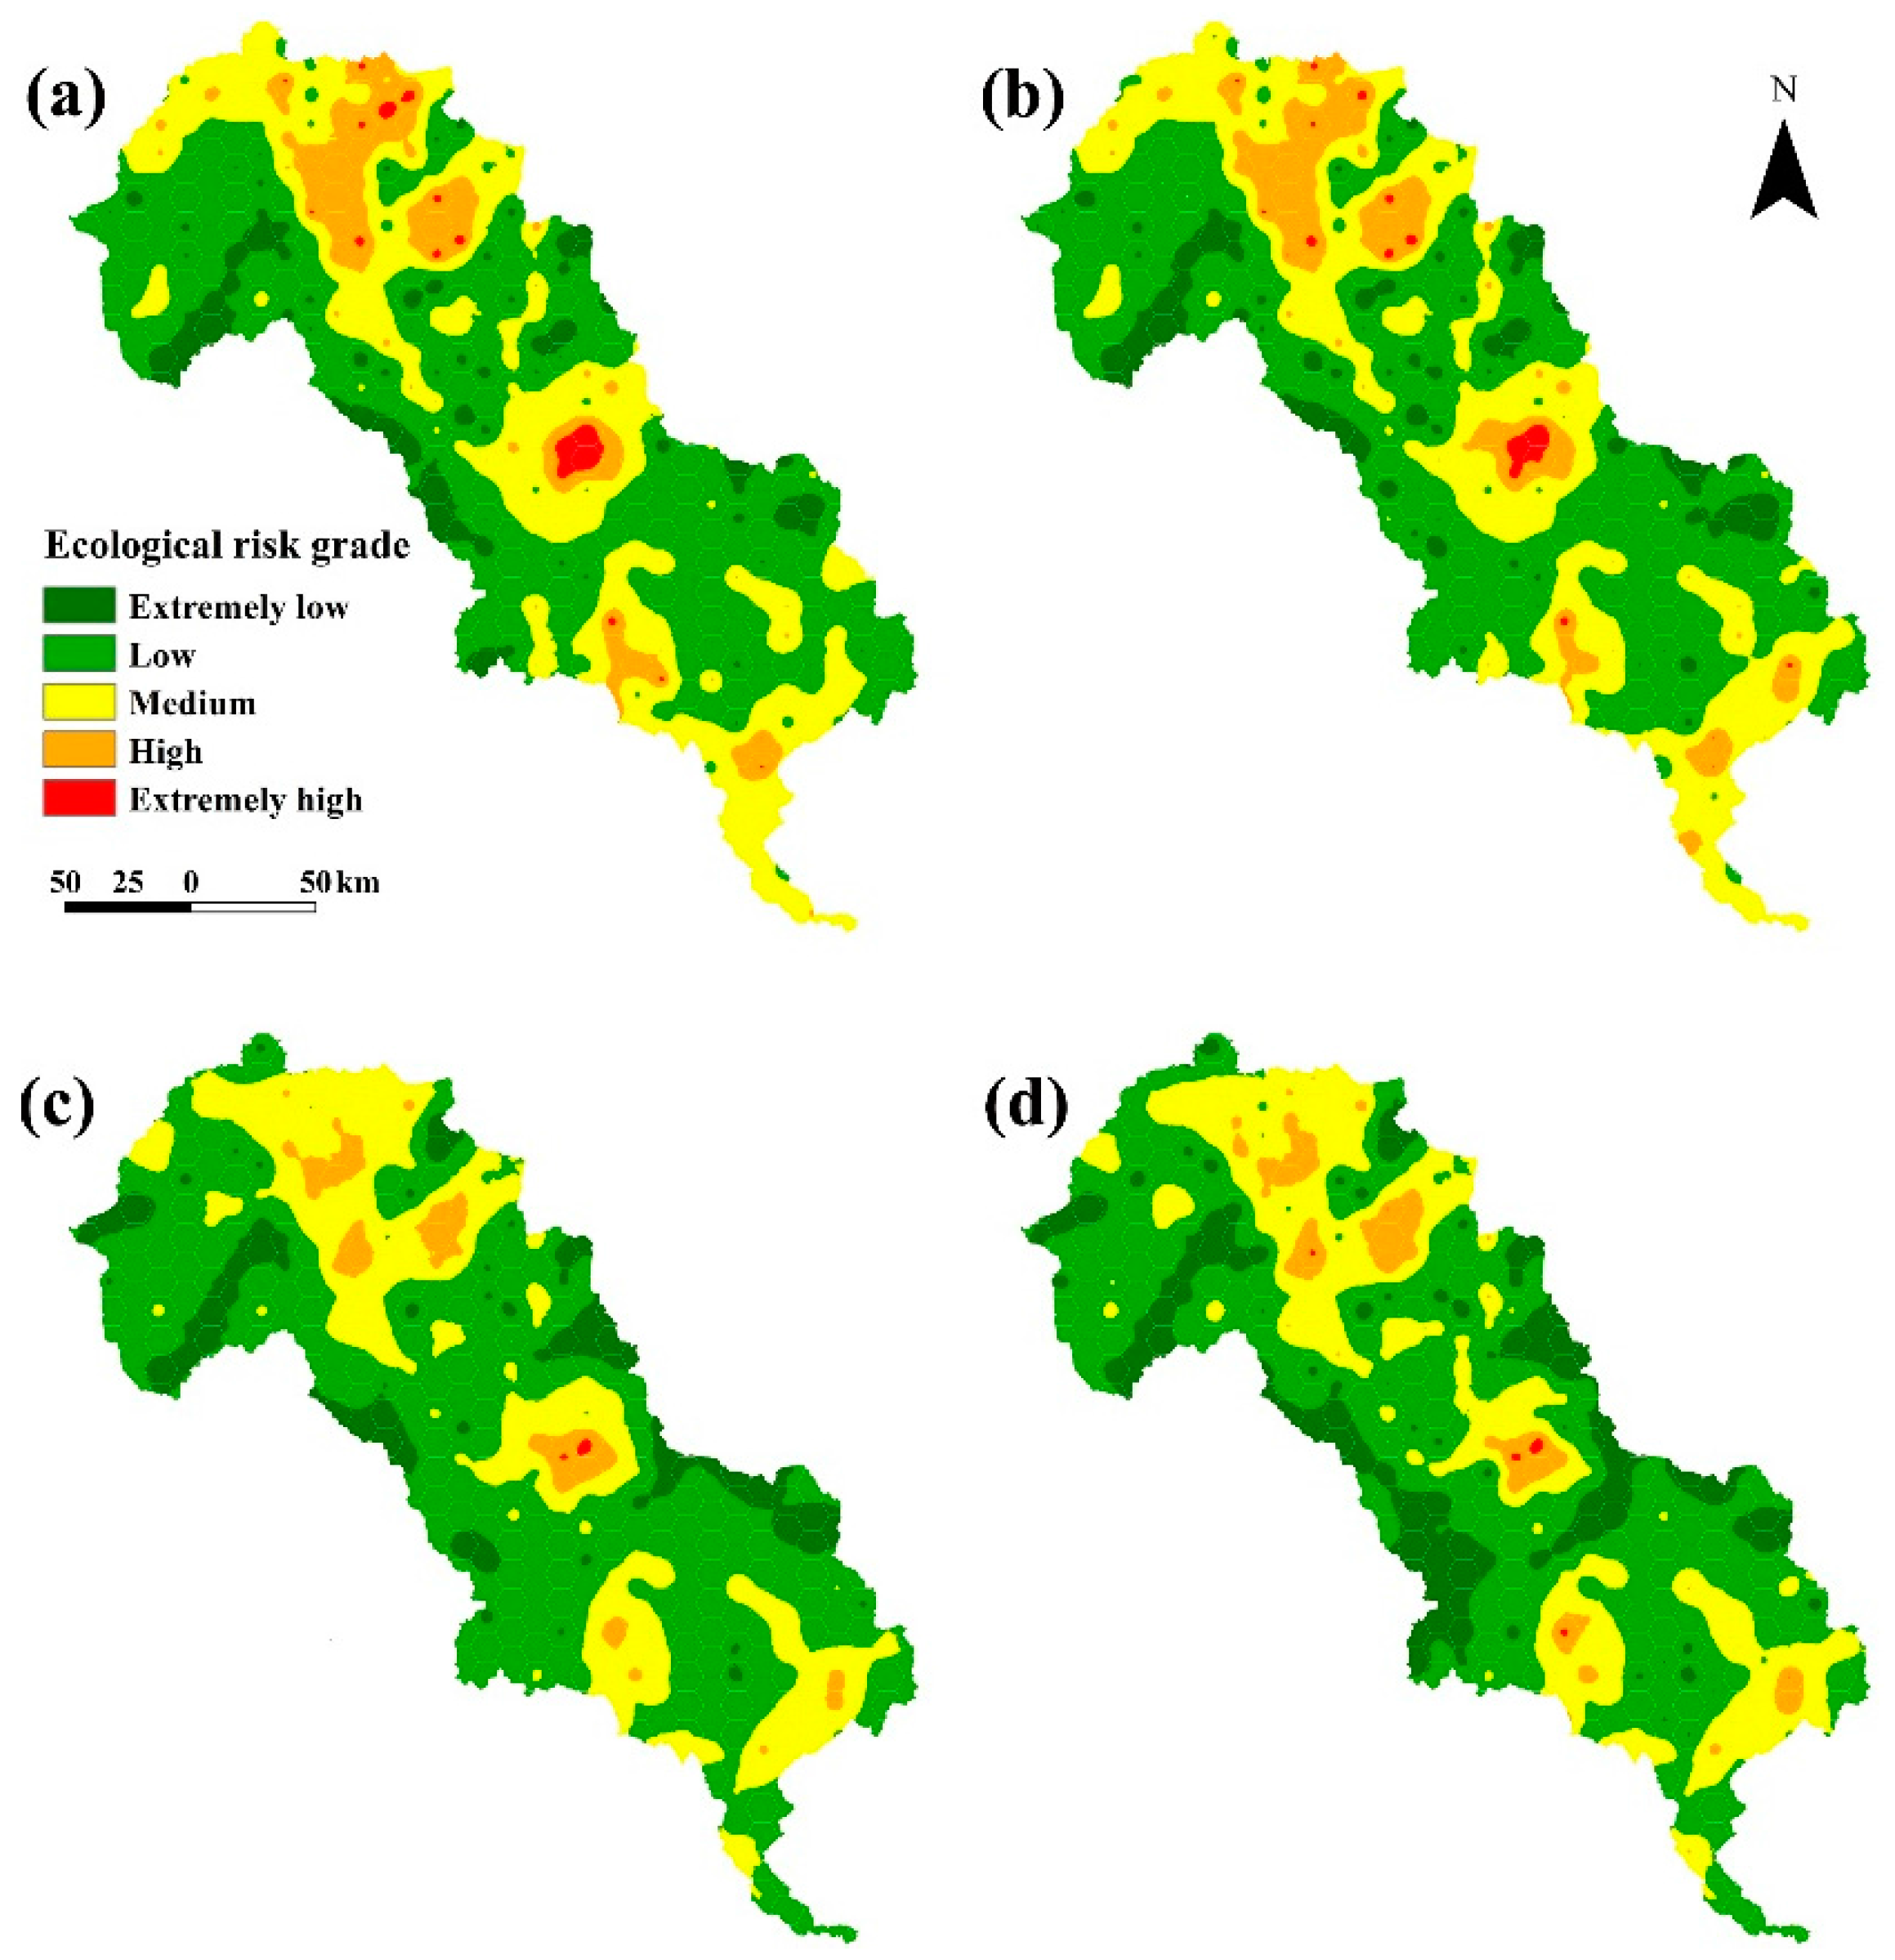
According to the experiences of other studies and ERI values, ecological risk regions were divided into five classifications in the study area: regions with extremely low ecological risk, low ecological risk, moderate ecological risk, high ecological risk and extremely high ecological risk respectively.

3. Results

3.1. Regression Analysis of Land Use

Table 3 presents driving factors and coefficients for the logistic regression. The probability maps are also obtained based on the logistic regression results, which can analyze the location suitability for each land use type (Figure 3). The results show that different land use types have different factors contributing to their locations. Agriculture land has the maximum amount of location factors, which is mainly impacted by slope and annual average temperature. When slope adds a one-unit change, the probability of agriculture land decreases 30.42%; when annual average temperature adds a one-unit change, the probability of agriculture land increases 6.26%. These indicate that agriculture land is located in plain zones of lower latitude in the Luanhe River Basin. The distribution of forest is mainly related to slope and annual average temperature. There is a positive correlation between forest and slope, and a negative correlation between forest and annual average temperature. When slope adds a one-unit change, the probability of forest increases 45.4%; when annual average temperature adds a one-unit change, the probability of forest decreases 10.7%. This indicates that forest has a higher probability of being located at mountainous and relatively high latitude regions in the Luanhe River Basin, which fits the actual situation. Soil is the most important factor for grassland. The distribution of water area is mainly related to slope and soil texture. When slope adds a one-unit change, the probability of water area decreases 23.97%. Construction land and “other land” are both mainly negatively correlated with slope. With the increase of the slope, the probability of both construction land and “other land” decrease.
To validate the reliability of the logistic regression results, the Relative Operating Characteristic (ROC) method was used. The ROC values in Table 3 were greater than 0.8 for all land use types, which indicates a high degree of spatial consistency between the simulated and actual land transition, and also indicates preferable explanations for the land use patterns by these selected driving factors.
Figure 3. Probability maps of different land use types in the Luanhe River Basin: (a) Forest; (b) Grassland; (c) Water; (d) Agriculture land; (e) Construction land; (f) Other land.
Sustainability 07 15835 g003
Table 3. Results of Logistic regression for different land use types in the Luanhe River Basin.
DriverForestGrasslandWaterAgriculture landConstruction landOther land
βExp(β)βExp(β)βExp(β)βExp(β)βExp(β)βExp(β)
Constant−2.69400.0680−63.57832.4451 × 10−2812.2138201,550.776818.184978,995,500.99−0.00950.9905168.75521.95 × 1073
Elevation−0.00300.9970−0.00360.9964−0.00380.99620.00221.0022--0.00761.0076
Slope0.37401.4540--−0.27400.7603−0.36270.6958−0.31930.7266−0.14470.8653
Aspect0.00001.00000.00051.0005−0.00110.9988−0.00110.9996−0.00040.9995--
Average annual temperature−0.11300.8930--0.04471.04580.06081.06260.05111.0524--
Average annual precipitation0.00201.00200.00921.0092−0.02390.9764−0.00360.9964−0.00740.9926−0.01120.9888
Average annual Solar radiation0.00001.00000.00011.0001--−0.00010.9999--−0.00030.9997
Soil texture−0.04100.96000.09271.0972−0.21030.81040.02211.02240.04941.0506--
Soil organic matter--0.00111.0011--0.00071.00060.00141.0013−0.00180.9982
Distance to river--−0.00010.9999−0.00010.99990.00001.0000----
Distance to city0.00001.00000.00001.00000.00001.00000.00001.00000.00001.0000−0.00010.9999
Distance to village0.00001.0000−0.00010.99990.00001.0000−0.00030.9996−0.00020.99970.00011.0001
Distance to town0.00001.00000.00001.00000.00001.0000−0.00010.9999−0.00010.99990.00011.0001
Distance to railway--−0.00010.99990.00001.00000.00001.0000−0.00010.99990.00001.0000
Distance to highway0.00001.00000.00001.0000--0.00001.00000.00001.00000.00011.0001
Distance to national road0.00001.00000.00001.00000.00001.0000−0.00010.9999−0.00010.9999−0.00010.9999
Distance to provincial road--−0.00010.99990.00001.00000.00001.0000−0.00010.9999−0.00010.9999
Distance to county road0.00001.0000−0.00010.9999−0.00010.9999−0.00010.9999−0.00010.9999−0.00010.9999
Population density0.00001.0000−0.00030.9997−0.00090.9991−0.00010.99990.00021.00020.00020.9962
GDP−0.00100.99900.00101.00100.00021.0002−0.00010.99990.00011.00010.00831.0083
ROC 0.858 0.822 0.875 0.812 0.859 0.974

3.2. Model Validation

The simulated land use map of 2010 was achieved on the basis of a land use map of 2000 by the CLUE-S model. The Kappa value was then calculated by comparing the simulated land use map of 2010 with the actual map of 2010 using the ENVI 4.8. The overall accuracy of simulation was 95.86%. The values of Kstandard (standard kappa), Kno (alternative kappa), Klocation (location kappa), and Kquantity (quantity kappa) were 0.936, 0.950, 0.937 and 0.999, respectively, which indicates that the simulation obtains excellent accuracy. Especially outstanding is the area simulation (Table 4). When Kappa value is above only 0.8, the simulation represents strong agreement or accuracy [4]. Therefore, the CLUE-S model has good applicability in the Luanhe River Basin, and can be used to predict the future simulation of land use change.
Table 4. The results of kappa coefficient.
TypeValue
Klocation (location kappa)0.937
Kstandard (standard kappa)0.936
Kquantity (quantity kappa)0.999
Kno (alternative kappa)0.950

3.3. Spatial and Quantitative Analysis of Land Use Changes

The land use changes were simulated using the CLUE-S model under three scenarios from 2010 to 2030. The interplay between demands, spatial policies and competition for six land use types led to differences in land use dynamics among these scenarios. To reveal the trend of land use changes and identify the hotspots of land use change in this basin, we compared the land use image of 2010 with the land use images of 2030 by ArcGIS9.3 in order to analyze the changes of the area (Table 5) and the spatial distribution (Figure 4).
Table 5. Area percent of land use types under different scenarios.
Land Use Types2010 (%)2030
Scenario 1 (%)Scenario 2 (%)Scenario 3 (%)
Forest59.5460.4360.3560.59
Grassland17.5918.0717.5017.25
Water1.411.311.381.42
Agriculture land17.0015.0314.6316.73
Construction land2.694.085.083.01
Other land1.771.081.060.96
Scenario 1 is defined as a continuation of the history land use change trend from 2000 to 2010. The results show that from 2010 to 2030, the area of construction land, forest and grassland will have a positive trend (Table 5), which is mainly at the expense of forest, agricultural land and grassland. The expanded regions are mainly located in the vicinity of Shuangluan and the Shuangqiao District of Chengde City of the midstream, including the southeast of Weichang County, Longhua County, Luanping County, Xinglong County, Chengde County, and Yingshouyingzi Mining Direct, where increases in construction land come from agriculture land and grassland. Meanwhile, the changes are slight both in the upstream and downstream, which will mainly be converted from grassland and forest. Additionally, the area of forest and grassland will have a slight increase, about 285 km2 and 174 km2 in 2030, respectively. The increase of forest mainly comes from agricultural land and grassland in the midstream. The increase of grassland mainly comes from forest and agricultural land in the upstream within Duolun County and Zhenglan Banner. Remarkably, almost all the agriculture land in the east of Duolun will be converted into grassland from 2010 to 2030. In addition, the area of “other land” will mainly be converted to grassland of the upstream, and forest and agricultural land of the midstream. Water area will be converted into agriculture land in the downstream, which is connected with nearly interruptible flows in the lower reaches of the Luanhe River, which leads to the process of flood land reclamation.
Figure 4. Simulated scenarios of land use in 2030 and spatial changes during 2010 to 2030.
Sustainability 07 15835 g004
Scenario 2 is defined as a rapid economic development scenario and thus, as expected, results in the most extreme land use pattern changes with a strong trend toward urbanization. By 2030, urbanization will have been concentrated in the center of the basin (Figure 4). The expanded construction land will have mainly come from agricultural land, grassland and forest. Urbanization will also have been concentrated in the southeast of Weichang County and Longhua County, where construction land will have come from agriculture land. In addition, in Luanping County, Xinglong County, Chengde County, and Yingshouyingzi Mining Direct, grassland and agriculture land will have been converted into construction land. Moreover, a few construction land sprawls in the upstream (north of Fengning County, Duolun County and north of Weichang County) will have come from agriculture land; some construction land will have expanded in the downstream (Qinglong County), where construction land area will have increased by occupying agriculture land and grassland. Furthermore, other land use types show a negative trend, except for forest. Scattered “other land” in the midstream of the basin will have been converted into forest, grassland and farmland; agricultural land will primarily have been converted into forest, grassland and construction land.
In Scenario 3, forest area has a more striking increase than other scenarios from 2010 to 2030, which mainly comes from agricultural land and grassland. Forest will expand towards the mountainous zones of the midstream. Agriculture land will be turned into forest in the east of the upstream and Qinglong County of the downstream. A lot of grassland in the south (Lulong County) of downstream will be converted to forest. The increase of construction land will come from forest and grassland around the Shuangluan District and Shuangqiao District in the midstream, and Yueting County and Changli County of the downstream. Conversely, “other land” will reduce about 45.73% in the upstream and midstream, which will mainly be converted into forest and grassland. In addition, neither of water and grassland will have obvious change. Scenario 3 has a clear difference from Scenario 1 and Scenario 2 in that its landscape fragmentation and landscape isolation is obvious improved.
Overall, the model predicts the same hotspot in the midstream where construction land has further development under the 3 scenarios. The urbanization is widespread and commonly occurs at the expense of agricultural land and grassland in the Luanhe River Basin. However, there are other different key areas among the three scenarios as follows. In Scenario 1, Duolun County in the upstream is the second important focus, where almost all agriculture land turns into grassland. The south of Qianan and the east of Qianxi in the downstream are other remarkable regions where agriculture land expands at the expense of all grassland. In both Scenario 2 and Scenario 3, Qinglong County in the downstream is another critical region, except the midstream. In Scenario 2, the main type in Qinglong County is the construction land, whereas, in Scenario 3, it is forest. In addition, Changli County and Yueting County in the south of downstream are also critical hotspots in Scenario 3.

3.4. Spatial and Temporary Change Analysis of Land Use Development Degree

Scenario 1 is selected as an example for land use development degree analysis because it indicates the closest to actual development, and the development of Scenario 1 is at the moderate level compared with other scenarios. The results show that land use degree indices of 2000, 2010, 2020, and 2030 are 236.98, 238.32, 240.45, and 241.20, respectively, in the Luanhe River Basin, which is a slight increase for the entire study area. However, Table 6 shows that land use degree of some regions has few changes and a negative trend. Generally speaking, in this study, when the changes are less than 1%, the degree of land use development is considered to have few changes. 90% of the basin undergoes little change from 2000 to 2010 (Table 6). From 2010 to 2020, the area of increased and decreased land use degree is about 25% and 44%. From 2020 to 2030, 60% of the basin has few changes. Additionally, 36% of the study area sees an increase in the degree of land use development, but the increment is less than 4%.
The spatial patterns and critical areas of land use development degree are clearly different from 2000 to 2030 (Figure 5). During 2000–2010, hotspots of land use development are located in the downstream (Qianan City and Lulong County) of the Luanhe River Basin. Conversely, the minimal development degree areas are located in the upstream (Taipusi Banner, Guyuan County, and Fengning County) and midstream (Pingquan County, Liangyuan City and Jianchang County) of the Luanhe River Basin. During 2010–2020, the area and degree of land use development hotspots are both increasing. The hotspots are located in the downstream (Qianxi County, Lulong County, Changli County, and Yueting County) and midstream (Luanping County and Jianchang County) of the Luanhe River Basin. The land use degree significantly decreases in most areas of the upstream and Lingyuan County of the midstream. During the above two stages, the hotspots of land use development are mainly in the downstream of the Luanhe River Basin. Meanwhile, the great decreased areas of land use degree are located in the upstream region. During 2020–2030, the hotspots of land use development will have a great change. The focus of land use development will gradually transfer from the downstream to the midstream. Luanping County, Shuangluan Direct, Shuangqiao District, Pingquan County, Xinglong County, Zunhua County and Yingshouyingzi Mining Direct will especially see the highest degree of land use development.
Figure 5. Spatial pattern of land use development degree in the Luanhe River Basin from 2000 to 2030: (a) 2000–2010; (b) 2010–2020; (c) 2020–2030.
Sustainability 07 15835 g005
Table 6. The change areas of land use development degree.
YearChange of Land Use Development Degree (%)Area (%)
2000–2010Few changes (−1~1)89.74
Increase5.46
Decrease4.80
2010–2020Few changes (−1~1)31.43
Increase24.79
Decrease43.78
2020–2030Few changes (−1~1)61.21
Increase36.17
Decrease2.62

3.5. The Temporal and Spatial Dynamics of Landscape Ecological Risk

3.5.1. The Temporal Change of Landscape Ecological Risk

The ERI method was used to evaluate the landscape ecological risk of the Luanhe River Basin in 2000, 2010, 2020 and 2030. Scenario 1 is selected as an example for landscape ecological risk analysis. According to the natural breakpoint method in ArcGIS 9.3, landscape ecological risk is divided into five grades [23]: extremely low ecological risk (0.3–0.4), low ecological risk (0.4–0.5), moderate ecological risk (0.5–0.6), high ecological risk (0.6–0.7), and extremely high ecological risk (0.7–0.8).
The landscape ecological risk indices of this basin are 0.494, 0.492, 0.479, and 0.472 in 2000, 2010, 2020, and 2030, respectively. The total area of low and extremely low risk regions are about 25,678 km2, 26,098 km2, 30,449 km2, and 30,363 km2 in 2000, 2010, 2020, and 2030 respectively. The area of extremely low ecological risk regions has the most striking positive trend, while the area of extremely high ecological risk regions has the strongest negative trend from 2000 to 2030 (Table 7). Additionally, the area of both moderate ecological risk and high ecological risk regions has a negative trend from 2000 to 2030 (Table 7). Table 7 shows that dynamic conversions among different ecological risk grades from 2000 to 2030. On the one hand, the conversion area from the moderate ecological risk to low ecological risk regions is the largest (about 5911 km2), and the conversion rate is 40.90%. The conversion area from low ecological risk to extremely low ecological risk regions is the second largest (about 4491 km2), with a 19.84% conversion rate. On the other hand, the highest conversion ratio is from the high ecological risk regions to moderate ecological risk regions, about 60.85%. Furthermore, very few areas (only about 7 km2) are converted from extremely low risk and low risk regions to extremely high risk, high risk and moderate risk regions. This indicates that the environmental governance project (the sandification combating program Phase II (2013–2022)) can obtain noticeable achievements in the Luanhe River Basin up to 2030. The area of forest and grassland is gradually growing, which plays an important role in ecological security in order to decrease the landscape ecological risk of the Luanhe River Basin. Additionally, according to the land use planning of Hebei Province (2006–2020), the development of construction land is controlled effectively, which also plays an important role in reducing the landscape ecological risk.
Table 7. Landscape ecological risk conversion matrix from 2000 to 2030 (Unit: %).
Ecological Risk GradeExtremely LowLowMediumHighExtremely High2000
Extremely low73.4526.480.070.000.006.77
Low19.8473.376.770.020.0050.60
Medium1.3940.9055.522.180.0132.30
High0.002.6860.8536.470.009.39
Extremely high0.000.0012.7775.7111.520.94
203015.4652.3827.204.850.11
20107.2451.0831.019.960.71
202010.0258.0327.714.170.74

3.5.2. Identifying the Critical Zones of Landscape Ecological Risk

To identify the critical zones with high and extremely high landscape ecology risk, the spatial distributions of landscape ecological risk of the Luanhe River Basin were analyzed in 2000, 2010, 2020 and 2030 (Figure 6). The results show that the general distribution characteristic from 2000 to 2030 is that higher risk areas (extremely high ecological risk and high ecological risk) are mainly distributed in the midstream and the east of upstream. Additionally, the moderate ecological risk regions surround higher ecological risk, which presents the layer pattern from the inside to outside arrangement: extremely high ecological risk, high ecological risk and moderate ecological risk. Conversely, lower ecological risk (extremely low risk and low risk) regions are located in the west of upper and middle of the basin and the east of midstream, where there are widely distributed forest and grassland with low ecological risk.
The critical risk areas in 2000 are distributed in Duolun County, Weichang County and Keshiketeng Banner in the east of the upstream, Shuangluan and Shuangqiao District of Chengde City, Chengde County, and Xinglong County of the middle region, and Qianan County, Qianxi County, and Lulong County of the downstream (Figure 6). Compared to 2000, the critical risk regions were in the same counties as the year 2010, except for Luan County and Qinglong County of the downstream, but the area of critical risk regions was reduced. From 2010 to 2020, extremely high and high ecological risk regions will clearly shrink on the basis of the original location. Especially in the upstream, extremely high and high ecological risk areas will have the most remarkable changes, with a 59.38% reduction. At the same time, all the high ecological risk regions in the downstream will be converted into the moderate risk regions.
From 2020 to 2030, areas of the extremely high and high ecological risk will slightly broaden, while areas of the extremely low and low ecological risk will broaden more strongly (Figure 6). Landscape ecological risk will be controlled and improved in the study area. However, a few regions of this basin are still very serious in Duolun County and Weichang County of the east of the upstream, Shuangluan and Shuangqiao District of Chengde City, Chengde County and Xinglong County of the midstream, and Qinglong County of the downstream.
Overall, the landscape ecological risk in the near future shows a negative trend in the Luanhe River Basin, and may mainly change from high risk to low risk. The ecological environment has been improving since 2000 and should continue that way until 2030.
Figure 6. The temporal and spatial distribution of landscape ecological risk in the Luanhe River Basin: (a) 2000; (b) 2010; (c) 2020; (d) 2030.
Sustainability 07 15835 g006

4. Discussion

The land use changes were simulated using the CLUE-S model under three scenarios in the near future. The kappa values are more than 0.9, demonstrating the reliability of the simulation in the Luanhe River Basin. In this study, the model considers land use allocation factors including socio-economic and bio-geographical attributes, which are comparatively comprehensive. Furthermore, the probability maps for different land use types provide an explicit understanding of land allocation probability spatially. For instance, grassland is most likely to distribute in the upstream of the Luanhe river basin, because the soil types including chestnut soil, sand soil and meadow soil are the main soil types, which are conducive to grass growth [29].
The interplay between demands, spatial policies and competition for six land use types leads to differences in land use dynamics among these scenarios. Decision makers could discover possible problems of land use in order to make more informed decisions. In all scenarios, the model predicts the same hotspot where urbanization is concentrated in the center of the basin. The possible reason is that construction land is the most prevalent in the vicinity of existing urban areas with large population density, lower elevation, lower incline, and good access to major roads and public transport, such as Shuangluan and Shuangqiao District of Chengde City. The phenomenon is similar to some areas of the world [12].
Geographical differences of human activity intensity can lead to regional heterogeneity of land use change. Scenario 1 is selected as an example for land use development degree analysis. During 2000–2010 and 2010–2020, the hotspots of land use development are both mainly in the downstream of this basin. The possible reason is that the plain regions of the Luanhe River Basin are focused on the downstream, which is more suitable for human activities than mountains are. The greatly decreased areas of development degree are located in the upstream region, which is related to the sandification combating project and other environmental projects [50]. Additionally, soil and water loss regions of the upstream are controlled by afforestation and restoring degenerative grassland [47], where ecological environment has been protected so that the degree of land use has a negative trend. During 2020–2030, the hotspots of land use development will move to the midstream from the downstream. The possible reasons are as follows: (1) Due to the limited area of plain regions, land use development might be restricted; (2) environmental engineering projects might improve the ecological environment and control the degree of land use development of the downstream.
With the development of the basin from 2000 to 2030, landscape ecological risk is controlled and ecological environment is improved in the study area. The possible reasons are as follows: (1) The strong changes of land use development degree could be seen only from the spatial distribution (Figure 5). The great increase and decrease of the degree of land use development exist in only partial areas of the basin (Table 6). However, for the whole basin, the increase of the degree of land use development is slight, which could be related to General Land Use Planning of Hebei Province (2006–2020). The planning shows that the area of construction land should be effectively controlled. Land use development can influence the area changes of different land use types. (2) Landscape ecological risk is not only influenced by the area of land use types, but also by the spatial location and configuration (e.g., landscape fragmentation) of landscape types. In Scenario 1, forest, grassland and construction land all have a slow positive trend. The increase area of construction land is similar to the total increase of forest and grassland. The difference between them is only 4 km2, which is very small compared to the study area. However, the spatial location and configuration of landscape types are improved by “General Land Use Planning in Hebei Province (2006–2020)” and “The Sandification Combating Project Phase II for Areas in the Vicinity of Beijing and Tianjin (2013–2022)". These projects pay attention to environmental protection and ecological restoration. Many measures such as afforestation, returning cultivated land to forestry, restoring degenerative grasslands can improve the spatial location and configuration of landscape types in order to improve the eco-environment. Thus, with the development of this basin, landscape ecological quality will be improved by 2030. These also indicate that forest and grassland construction play an important role in ecological security in the Lunhe River Basin. Similarly, in Moncayo Natural Park of Spain, forest management also plays a significant role in the landscape patterns [52]; In Washington’s Palouse, a small area of buffer vegetation can deliver a large improvement in a watershed’s ecological function [51].
Although the ecological quality of the study area will be improved by 2030, some regions still have very serious ecological risk, for instance, in the east of upstream, Shuangluan and Shuangqiao District of Chengde City, Chengde County and Xinglong County of the midstream, and Qinglong County of the downstream. These regions are mainly dominated by construction land, where human activities are frequent and intensive, so they have higher ecological risk. Furthermore, these regions are dominated by bare land. The ecological structure is simple with little biomass, and its ecological system is fragile, which can lead to the high ecological risk [23].
Overall, the critical areas of land use change, development, and ecological risk are all identified in the Luanhe River Basin in 2030. These areas should be the most important ones to be monitored in the present and the near future, where effective planning and management of land use are most needed.

5. Conclusions

We simulated the patterns of land use that might emerge in 2030, and explored the hotspots of land use change, the hotspots of land use development degree, and critical areas of landscape ecological risk in 2030 in the Luanhe River Basin, which was the critical base of information for making suitable land use planning.
(1) The CLUE-S model was a capable modeling tool for scenario analysis and simulating trajectories of land use change in the future years in the Luanhe River Basin. We predicted land use patterns of the Luanhe River Basin from 2010 to 2030 under three different scenarios (trend development, high economic growth, and ecological security), and obtained excellent accuracy: the overall accuracy of the CLUE-S model was over 95%; ROC of all land use types were more than 0.8. The results revealed the future possible trends of land use change and provided the basis for further analyses of the possible impact on the degree of land use and landscape ecological risk in the Luanhe River Basin. We found that the hotspot for each scenario was a further development of construction land at the expense of agricultural land and grassland in the vicinity of Shuangluan and Shuangqiao District in the midstream. However, other different critical areas among the three scenarios were also identified respectively.
(2) The land use degree index method was used to further understand and quantify the degree of land use development, and to identify the hotspots of land use development at county level in the Luanhe River Basin. The analysis of the spatio-temporary changes of land use development degree showed that land use degree had a slow growth tendency in the Luanhe River Basin from 2000 to 2030. Furthermore, the spatial patterns of the degree of land use were clearly different during three stages. During 2000–2010, hotspots of land use degree were located in the downstream (Qianan City and Lulong County) of the Luanhe River Basin; during 2010–2020, the hotspots would expand in the downstream (Qianxi County, Lulong County, Changli County, and Yueting County) and midstream (Luanping County and Jianchang County); during 2020–2030, the hot areas of land use degree would gradually transfer from the downstream to midstream regions.
(3) The ecological risk index method was used to further quantitatively evaluate the trends of landscape ecological risk change and identify the critical ecological risk areas of this basin in 2000, 2010, 2020, and 2030. The investigation found that the landscape ecological risk showed a negative trend and a main conversion from high risk to low risk from 2000 to 2030. However, in the near future, a few regions will still have very serious ecological risk, which means that effective planning and management in the east of upstream (Duolun County and Weichang County), the middle region (Shuangluan and Shuangqiao District of Chengde City, Chengde County, and Xinglong County), and the downstream (Qinglong County) is necessary. By identifying the hotspots of land use change and landscape ecological risk, we found that large-scale environmental policy interventions such as returning agriculture land to forest, afforestation, and restoration of degenerated grassland could greatly reduce the ecological risk of this basin.

Acknowledgments

This work was financed by the National Science Foundation of China (Grant No. 51079068), the National Science Foundation of Tianjin (Grant No. 15JCYBJC22500).

Author Contributions

Ying Li and Suiliang Huang designed this study; Ying Li wrote the paper under Suiliang Huang’s supervision; Suiliang Huang revised the paper. All authors read and approved the final manuscript. Anonymous reviewers’ comments and suggestions are heavily appreciated, which greatly improved our manuscript’s readability and quality.

Conflicts of Interest

The authors declare no conflict of interest.

References

  1. Veldkamp, A.; Lambin, E.F. Predicting land-use change. Agric. Ecosyst. Environ. 2001, 85, 1–6. [Google Scholar] [CrossRef]
  2. Debolini, M.; Schoorl, J.M.; Temme, A.; Galli, M.; Bonari, E. Changes in agriculture land use affecting future soil redistribution patterns: A case study in southern Tuscany (Italy). Land Degrad. Dev. 2015, 26, 574–586. [Google Scholar] [CrossRef]
  3. Turner, B.L., II. Local faces, global flows: The role of land use and land cover in global environmental change. Land Degrad. Dev. 1994, 5, 71–78. [Google Scholar] [CrossRef]
  4. Zheng, H.W.; Shen, G.Q.P.; Wang, H.; Hong, J.K. Simulating land use change in urban renewal areas: A case study in Hong Kong. Habitat Int. 2015, 46, 23–34. [Google Scholar] [CrossRef]
  5. Leitäo, A.B.; Miller, J.; Ahern, J.; McGarigal, K. Measuring Landscapes: A Planner’s Handbook; Island Press: Washington, DC, USA, 2006; pp. 27–32. [Google Scholar]
  6. Verburg, P.H.; Veldkamp, A. Projecting land use transitions at forest fringes in the Philippines at two spatial scales. Landsc. Ecol. 2004, 19, 77–98. [Google Scholar] [CrossRef]
  7. Verburg, P.H.; Soepboer, W.; Veldkamp, A.; Limpiada, R.; Espaldon, V.; Mastura, S.S.A. Modeling the spatial dynamics of regional land use: The CLUE-S model. Environ. Manag. 2002, 30, 391–405. [Google Scholar] [CrossRef] [PubMed]
  8. Liu, M.; Hu, Y.M.; Chang, Y.; He, X.Y.; Zhang, W. Land use and land cover change analysis and prediction in the upper reaches of the Minjiang River, China. Environ. Manag. 2009, 43, 899–907. [Google Scholar] [CrossRef] [PubMed]
  9. Verburg, P.H.; Schulp, C.J.E.; Witte, N.; Veldkamp, A. Downscaling of land use change scenarios to assess the dynamics of European landscapes. Agric. Ecosyst. Environ. 2006, 114, 39–56. [Google Scholar] [CrossRef]
  10. Verburg, P.H.; Overmars, K. Combining top-down and bottom-up dynamics in land use modeling: Exploring the future of abandoned farmlands in Europe with the Dyna-CLUE model. Landsc. Ecol. 2009, 24, 1167–1181. [Google Scholar] [CrossRef]
  11. Promper, C.; Puissant, A.; Malet, J.P.; Glade, T. Analysis of land cover changes in the past and the future as contribution to landslide risk scenarios. Appl. Geogr. 2014, 53, 11–19. [Google Scholar] [CrossRef]
  12. Price, B.; Kienast, F.; Seidl, I.; Ginzler, C.; Verburg, P.H.; Bolliger, J. Future landscapes of Switzerland: Risk areas for urbanisation and land abandonment. Appl. Geogr. 2015, 57, 32–41. [Google Scholar] [CrossRef]
  13. Prato, T.; Clark, A.S.; Dolle, K.; Barnett, Y. Evaluating alternative economic growth rates and land use policies for Flathead County, Montana. Landsc. Urban Plan. 2007, 83, 327–339. [Google Scholar] [CrossRef]
  14. Kurniawan, A.; Krol, B.G.C.M. Spatio-temporal analysis of land use change for supporting landslide exposure assessment. Ind. J. Geogr. 2014, 46, 104–124. [Google Scholar]
  15. Fan, M.; Shibata, H. Simulation of watershed hydrology and stream water quality under land use and climate change scenarios in Teshio River watershed, northern Japan. Ecol. Indic. 2015, 50, 79–89. [Google Scholar] [CrossRef]
  16. Fox, J.; Vogler, J.B.; Sen, O.L.; Giambelluca, T.W.; Ziegler, A.D. Simulating land-cover change in montane mainland Southeast Asia. Environ. Manag. 2012, 49, 968–979. [Google Scholar] [CrossRef] [PubMed]
  17. Huang, Q.; Zheng, X.Q.; Hu, Y.C. Analysis of land-use emergy indicators based on urban metabolism: A case study for Beijing. Sustainability 2015, 7, 7473–7491. [Google Scholar] [CrossRef]
  18. Han, H.R.; Yang, C.F.; Song, J.P. Scenario simulation and the prediction of land use and land cover change in Beijing, China. Sustainability 2015, 7, 4260–4279. [Google Scholar] [CrossRef]
  19. Qin, W.S.; Zhang, Y.F.; Li, G.D. Driving mechanism of cultivated land transition in Yantai Proper, Shandong Province, China. Chin. Geogr. Sci. 2015, 25, 337–349. [Google Scholar] [CrossRef]
  20. Liu, M.; Hu, Y.M.; Zhang, W.; Zhu, J.J.; Chen, H.W.; Xi, F.M. Application of land-use change model in guiding regional planning: A case study in Hun-Taizi River Watershed, Northeast China. Chin. Geogr. Sci. 2011, 21, 609–618. [Google Scholar] [CrossRef]
  21. Jiang, H.T.; Tashipolat, T.; Hou, Y.J.; Zhang, Y.J.; Zhang, F.; Tao, L.H. Analysis of the land use degree of Mary Oasis, Turkmenistan using remote sensing and GIS. J. Geo-Inf. Sci. 2013, 15, 776–782. (In Chinese) [Google Scholar] [CrossRef]
  22. Zhuang, D.F.; Liu, J.Y. Study on the model of regional differentiation of land use degree in China. J. Nat. Resour. 1997, 12, 105–111. (In Chinese) [Google Scholar]
  23. Zhang, X.B.; Shi, P.J.; Luo, J. Landscape ecological risk assessment of the Shiyang River Basin. Geo-Inf. Resour. Manag. Sustain. Ecosyst. 2013, 399, 98–106. [Google Scholar]
  24. Weber, T. Landscape ecological assessment of the Chesapeake Bay Watershed. Environ. Monit. Assess. 2004, 94, 39–53. [Google Scholar] [CrossRef] [PubMed]
  25. Malekmohammadi, B.; Blouchi, L.R. Ecological risk assessment of wetland ecosystems using Multi Criteria Decision Making and Geographic Information System. Ecol. Indic. 2014, 41, 133–144. [Google Scholar] [CrossRef]
  26. Tian, Y.H.; Jim, C.Y.; Tao, Y.; Shi, T. Landscape ecological assessment of green space fragmentation in Hong Kong. Urban For. Urban Green. 2011, 10, 79–86. [Google Scholar] [CrossRef]
  27. Ribeiro, D.C.; Costa, S.; Guilhermino, L. A framework to assess the vulnerability of estuarine systems for use in ecological risk assessment. Ocean Coast Manag. 2015, 119, 267–277. [Google Scholar] [CrossRef]
  28. Hunsaker, C.T.; Graham, R.L.; Suter II, G.W.; O'Neill, R.V.; Barnthouse, L.W.; Gardner, R.H. Assessing Ecological Risk on a Regional Scale. Environ. Manag. 1990, 14, 325–332. [Google Scholar] [CrossRef]
  29. Wang, G.; Yan, D.H.; Zhang, C.; Qin, T.L. Analysis on spatial distribution characteristics of soil organic matter in the Luanhe River Basin. J. Anhui Agric. Sci. 2011, 39, 17254–17257. (In Chinese) [Google Scholar]
  30. Cao, Z.G.; Liu, J.L.; Luan, Y.; Li, Y.L.; Ma, M.Y.; Xu, J.; Han, S.L. Distribution and ecosystem risk assessment of polycyclic aromatic hydrocarbons in the Luan River, China. Ecotoxicology 2010, 19, 827–837. [Google Scholar] [CrossRef] [PubMed]
  31. Liu, H.Y.; Tian, Y.H.; Ding, D. Contributions of different land cover types in Otindag Sandy Land and Bashang area of Hebei Province to the material source of sand stormy weather in Beijing. Sci. Bull. 2003, 48, 1853–1856. [Google Scholar] [CrossRef]
  32. Sun, Y.L.; Hu, Y. Soil and water loss and prevention and control measurements for major control areas in the upstream of Panjiakou Reservoir. Haihe Water Resour. 2003, 4, 41–42, 66. (In Chinese) [Google Scholar]
  33. Li, J.Z.; Tan, S.M.; Chen, F.L.; Feng, P. Quantitatively analyze the impact of land use/land cover change on annual runoff decrease. Nat. Hazards 2014, 74, 1191–1207. [Google Scholar] [CrossRef]
  34. Frazier, T.G.; Walker, M.H.; Kumari, A.; Thompson, C.M. Opportunities and constraints to hazard mitigation planning. Appl. Geogr. 2013, 40, 52–60. [Google Scholar] [CrossRef]
  35. Wang, Y.X.; Li, J.Z.; Feng, P.; Chen, F.L. Effects of large-scale climate patterns and human activities on hydrological drought: A case study in the Luanhe River basin, China. Nat. Hazards 2015, 76, 1687–1710. [Google Scholar] [CrossRef]
  36. Liu, Y.F. An analysis of the hydrology, geology and economic situation of the Luanhe River Basin. J. Hebei Normal Univ. Nat. 2012, 32, 24–26. (In Chinese) [Google Scholar]
  37. Li, Y.L.; Liu, J.L.; Cao, Z.G.; Lin, C.; Yang, Z.F. Spatial distribution and health risk of heavy metals and polycyclic aromatic hydrocarbons (PAHs) in the water of the Luanhe River Basin, China. Environ. Monit. Assess. 2010, 163, 1–13. [Google Scholar] [CrossRef] [PubMed]
  38. USGS. Landsat 5 TM Data (2000 and 2010). Available online: http://usgs.gov/ (accessed on 15 March 2014).
  39. WESTDC. Soil Data. Available online: http://westdc.westgis.ac.cn/ (accessed on 15 March 2014).
  40. USGS. SRTM 90m Digital Elevation Data. Available online: http://usgs.gov/ (accessed on 15 March 2014).
  41. RESDC. Meteorological Data. Available online: http://www.resdc.cn/ (accessed on 15 March 2014).
  42. RESDC. GDP and Population Data (2000 and 2010). Available online: http://www.resdc.cn/ (accessed on 15 March 2014).
  43. Hu, Y.C.; Zheng, Y.M.; Zheng, X.Q. Simulation of land-use scenarios for Beijing using CLUE-S and Markov composite models. Chin. Geogr. Sci. 2013, 23, 92–100. [Google Scholar] [CrossRef]
  44. Cammerer, H.; Theken, A.H.; Verburg, P.H. Spatio-temporal dynamics in the flood exposure due to land use changes in the Alpine Lech Valley in Tyrol (Austria). Nat. Hazards 2012, 68, 1243–1270. [Google Scholar] [CrossRef]
  45. Pontius, R.G., Jr. Quantification error versus location error in comparison of categorical maps. Photogram. Eng. Remote. Sens. 2000, 66, 1011–1016. [Google Scholar]
  46. Landis, J.R.; Koch, G.G. The measurement of observer agreement for categorical data. Biometrics 1977, 33, 159–174. [Google Scholar] [CrossRef] [PubMed]
  47. Shi, S.; Zou, X.Y.; Zhang, C.L.; Su, G.R.L. Investigation of vegetation restoration in the area of Beijing and Tianjin sandstorm source control project. Sci. Soil Water Conserv. 2009, 7, 86–92. (In Chinese) [Google Scholar]
  48. Xie, H.L. Spatial characteristic analysis of land use eco-risk based on landscape structure: A case study in the Xingguo County, Jiangxi Province. China Environ. Sci. 2011, 31, 688–695. (In Chinese) [Google Scholar]
  49. Jia, Y.H.; Zhao, J.; Nan, Z.R.; Zhao, C.Y.; Wang, S.L. Ecological safety assessment of grassland based on entropy-right method: A case study of Gansu pastoral area. Chin. J. Ecol. 2006, 25, 1003–1008. (In Chinese) [Google Scholar]
  50. Cao, J. The effect and method of water conservation of the sandification combating program: Phase 1 for areas in the vicinity of Beijing and Tianjin. Soil Water Conserv. China 2014, 11, 8–11. (In Chinese) [Google Scholar]
  51. Klein, L.R.; Hendrix, W.G.; Lohr, V.I.; Kaytes, J.B.; Sayler, R.D.; Swanson, M.E.; Elliot, W.J.; Reganold, J.P. Linking ecology and aesthetics in sustainable agricultural landscapes: Lessons from the Palouse region of Washington, U.S.A. Landsc. Urban Plan. 2015, 134, 195–209. [Google Scholar] [CrossRef]
  52. Castillo, E.M.; García-Martin, A.; Aladren, L.A.L.; Luis, M. Evaluation of forest cover change using remote sensing techniques and landscape metrics in Moncayo Natural Park (Spain). Appl. Geogr. 2015, 62, 247–255. [Google Scholar] [CrossRef]

