1. Introduction
Schaltegger and Gualandris [
1] believed that firm sustainability performance is a multi-dimensional concept which is not directly measurable and requires a set of indicators to be assessed. Literature on sustainability management studies have been highlighted that knowledge management [
2,
3,
4], business strategy [
5,
6], and organizational learning [
7,
8] are considered as vital indicators of firm sustainability performance improvement. Some researchers confirm that knowledge management and its output, organizational knowledge, are antecedents of organizational learning [
9,
10] and company business strategy [
11,
12]. Reviewing the previous studies, many scholars conducted research to recognize the linkage among knowledge management, organizational learning, and firm sustainability performance [
13,
14,
15,
16]. However, research that studies the interconnection among those three concepts with business strategy, simultaneously, is still rare. We found few studies discussing the practical relationship among knowledge management, business strategy, organizational learning, and firm sustainability performance index [
17].
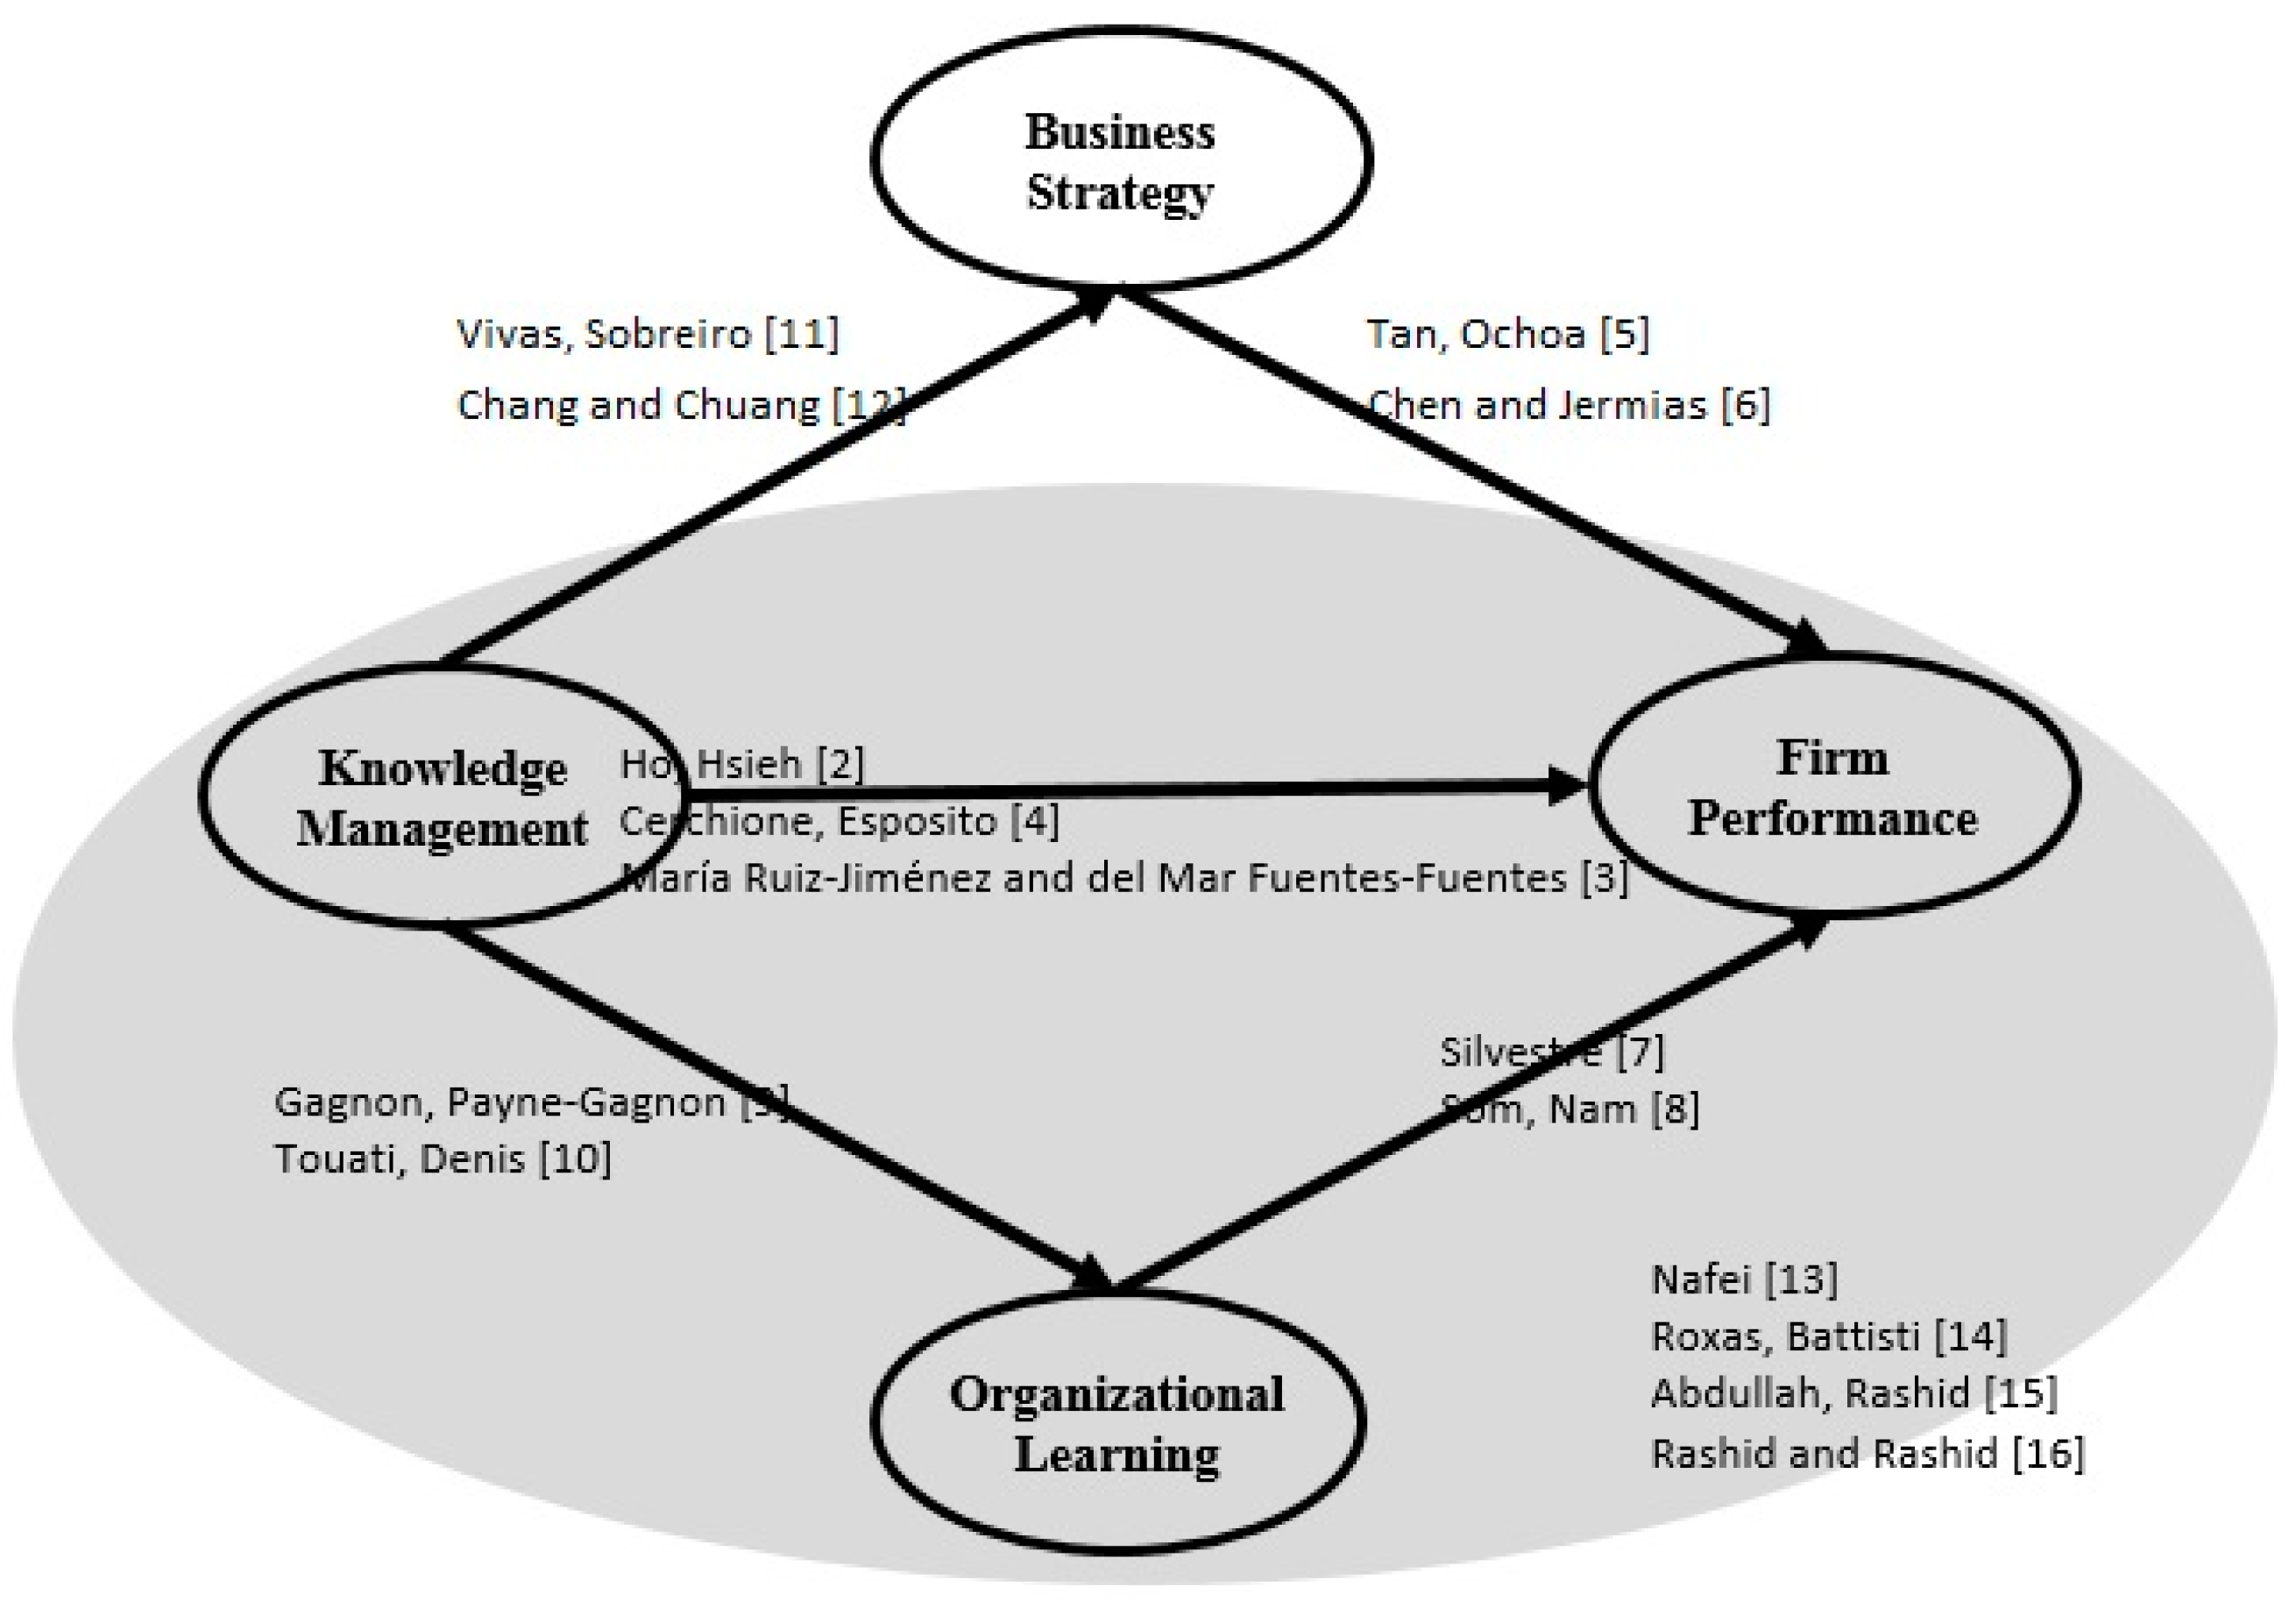
Figure 1 shows some literature of the linkages between any two variables, the relationship among three main indicators (knowledge management, learning, and performance), and the whole picture about our research model.
Figure 1.
Theoretical framework of the research model.
Figure 1.
Theoretical framework of the research model.
Firm sustainability performance status is usually collected based on secondary or survey data. This information is helpful for manager and decision-makers to distribute capital resources logically when their planning is activated for controlling firm sustainability. This information is able to be condensed in a single measure, named a sustainability performance index, and it is essential to detect the indicators that could impact upon it.
Ordinary least square regression [
18,
19,
20], artificial neural network [
21,
22], fuzzy logic [
23,
24], and partial least square [
25] have been applied as the statistical methodology for estimating firm sustainability performance. Classical structural equation modeling (CSEM) has intentioned and applied a dramatic rise in the variety of scientific and technical studies over the last decade. This application presents an advanced version of linear regression and the main purpose of it is to examine the research hypothesis which observed that the covariance matrix related to a set of measured indicators is equal to the covariance matrix described by the hypothesized model. Multivariate normal distribution of the independent and identically-distributed observations is the vital assumption in CSEM [
26]. Otherwise, we cannot, in standard approach, determine the sample covariance matrix. Therefore, to overcome this issue, use of Bayesian structural equation modeling (BSEM), as a representative of semi-parametric modeling, is offered by so many researchers [
27]. BSEM, for the parameters of interest, allows the researchers to apply the prior information for updating the current information. This involves the use of a Gibbs sampler [
28] to obtain samples of arbitrary sizes for summarizing the posterior distribution for describing the interested parameters. From these samples, the user can compute the point and interval estimation and measure standard deviations for the purpose of making an inference. Regarding the interested parameters, the Bayesian approach is attractive since it enables us to update recent information based on prior information.
The main objective of the current paper is to illustrate the value of the CSEM and BSEM for developing a model which describes the sustainability performance index of a food manufacturing company establishing in Taiwan, Malaysia, and China. The interrelationship among the latent variables such as knowledge management, organizational learning, and business strategy, and between the latent variables and their respective manifest variables, are determined using the data found from the survey that were undertaken in those three countries.
2. Theoretical Background and Implications
In CSEM, new models and statistical methods have been developed for better analyses of more complex data structures in substantive research. These include but are not limited to: (i) CSEM analysis with categorical data [
29,
30,
31]; (ii) linear or nonlinear CSEM with covariates [
32,
33]; (iii) CSEM with nonlinear correlation [
34,
35], (iv) CSEM with multilevel dimensions [
36,
37,
38]; (v) mixtures of CSEM [
39,
40]; (vi) CSEM with exponential indicators [
41], (vii) CSEM with multi-sample [
42,
43], and (viii) CSEM with missing data [
44,
45].
The above articles not only provide theoretical results, but also have significant practical value. The methodology of CSEM is developed based on a Bayesian approach as the second generation of CSEM which involves a much wider class of CSEM [
26]. The advantages of a Bayesian approach include allowing the use of genuine prior information in addition to that available in the observed data and providing useful statistics, such as mean and percentiles, of the posterior distribution. In addition, as pointed out by many articles in Bayesian analysis of SEM [
46,
47,
48], the sampling based Markov chain Monte Carlo (MCMC) methods do not rely on asymptotic theory and, hence, give more reliable results for situations with small samples. Bayesian estimates of the unknown parameters are obtained from a sufficiently large number of observations, which are sampled from the posterior distribution by the standard Gibbs sampler [
49], and the Metropolis Hastings (MH) algorithm [
50,
51]. In addition to the standard error estimates, the highest posterior density (HPD) intervals [
52] are also presented for assessing the variability of the Bayesian estimates. The goodness of fit of the posited model is assessed by the posterior predictive (PP)
p-value that is developed by Gelman, Meng [
53].
We define
and
and to be the latent continuous variables and categorical data matrices, respectively, and
be considered the matrix of latent variables with the following structures:
The observed data are augmented with the latent data in the posterior analysis. The indicate parameter space is defined by , where is denoted as the structural parameter.
The prior distribution equation is determined by:
where, due to the categorical ordinal structure of thresholds, a diffuse prior can be adopted. Specifically, for some constant
:
We call the process for
as an instant. Precisely, let:
Moreover, to accommodate a subjective perspective, a natural conjugate prior can be assumed for
with conditional representation
. More specifically, let:
In above conditional distribution
has gamma distribution
where
denotes the gamma distribution,
be the
th row of, and
is the
kth diagonal element of
. we assume an inverse-Wishart distribution for
is indicated by:
Furthermore, we consider that all hyper-parameters are known and denoted a posterior distribution.
The computation posterior distribution is complicated, therefore we use Markov Chain Monte Carlo (MCMC) method to produce a sequence of random observations from .
A convergence test of the research model parameters is the next step of BSEM procedure.
Following Yanuar, Ibrahim [
54], we perform model diagnostics via designing time series diagrams to evaluate the accuracy of the research parameters with different starting values graphically, and illustrate a diagnosis based with tracing the diagrams [
47,
55]. Moreover, we apply the Brooks– Gelman–Rubin convergence statistics [
56].
For assessing the plausibility of our proposed model which includes the measurement equation and structural equation, we plot the residual estimates
versus latent variable estimates to give information for the fit of the model. The residual estimates for the measurement equation (
) can be obtained from:
where
and
are Bayesian estimates obtained via the MCMC method. The estimates of residuals in the structural equation (
) can be obtained from following estimated model:
where
,
,
and
are Bayesian estimates that are obtained from the corresponding simulated observations through the MCMC.
The measurement model is defined by:
Our research model include four latent variables therefore we have .
The structural model of BSEM has the following equation:
: the coefficient of knowledge management indicator
: the coefficient of organizational learning indicator
: the coefficient of business strategy indicator
where
is distributed as
and independent with
which is distributed as
.
3. Material and Methods
In this study, a quantitative survey applied to empirically analyze the research hypotheses related to our conceptual framework. A validated questionnaire is considered and distributed randomly in selected Malaysia, China, and Taiwan in food manufacturing district from October 2012 to June 2014. From 650 questionnaires, 250 of them were sent to China in Mandarin and Cantonese (two popular dialects in China) languages; 200 of the questionnaires were sent to Malaysia in Chinese (Mandarin), Malay, and English languages; and 200 of them were sent to Taiwan in Chinese (Mandarin) and English languages.
Table 1.
Sample Characteristics.
Table 1.
Sample Characteristics.
| Country | Distributed | Completed | Number of Employee | Distributed | Completed |
|---|
| China | 250 | 185 | Less than 50 | 378 | 252 |
| Taiwan | 200 | 121 | Between 50 to 100 | 185 | 88 |
| Malaysia | 200 | 80 | More than 100 | 87 | 46 |
| Position of the respondents | Completed | Firm age (year) | Completed |
| Direct manager | 125 | Less than 10 | 85 |
| Senior manager | 148 | Between 10 to 20 | 162 |
| Project manager | 72 | Between 20 to 30 | 75 |
| CEO | 41 | More than 30 | 38 |
| Type of Food Manufacturing |
| Type | Distributed | Completed | Type | Distributed | Completed |
| 1.Baby food market | 10 | 2 | 11.Soup market | 35 | 23 |
| 2. Fruit and vegetables market | 50 | 31 | 12.Sweeteners and sugar market | 25 | 18 |
| 3.Bakery market | 70 | 25 | 13.Processed fish market | 30 | 19 |
| 4.Sauces and seasonings market | 40 | 29 | 14.Dairy market | 28 | 15 |
| 5.Sweet spreads market | 25 | 12 | 15.Meat and egg products market | 30 | 22 |
| 6.Pet food market | 30 | 9 | 16.Savoury spreads market | 25 | 17 |
| 7.Snacks market | 45 | 26 | 17.Desserts and ice cream market | 35 | 24 |
| 8.Breakfast cereals market | 25 | 11 | 18.Side dishes market | 27 | 21 |
| 9.Chocolate confectionery market | 35 | 29 | 19.Sugar and gum confectionery market | 60 | 42 |
| 10.Meals and meal centers market | 25 | 11 | | | |
The confirmed questionnaires were mailed to companies via self-addressed envelopes with stamps and a cover letter. The objective of the research was explained in the cover letter and people who were knowledgeable about their products were requested to respond, like direct managers, senior managers, project manager, or even CEOs who have a “big and bright view” of the companies’ achievements. Only 386 (59% of response) manufacturers returned the completed distributed questionnaires.
Table 1 presents the sample characteristics.
We use knowledge management model which is suggested by Gold and Malhotra [
57] and they considered three main processes. These are knowledge acquisition, knowledge conversation, and knowledge application. Organizational learning is measured based on Jerez-Gomez, Céspedes-Lorente [
58] research. Four dimensions were determined, including management commitment, system perspective, openness and experimentation, and knowledge transfer and integration. Business strategy is measured from Ryu and Lee's [
59] theory that divided in three cost-reduction, innovation, and quality-enhancement. Recently, sustainability accounting indicators are considered as the main measurement for identifying firm sustainability level [
60,
61]. Therefore, we considered four familiar accounting indicators to measure firm sustainability performance index. These are return on equity, return on assets, return on sales, and return on investment performance. AMOS version 18 and WinBUGS version 1.4 were used for analyzing the research model based on CSEM and BSEM techniques.
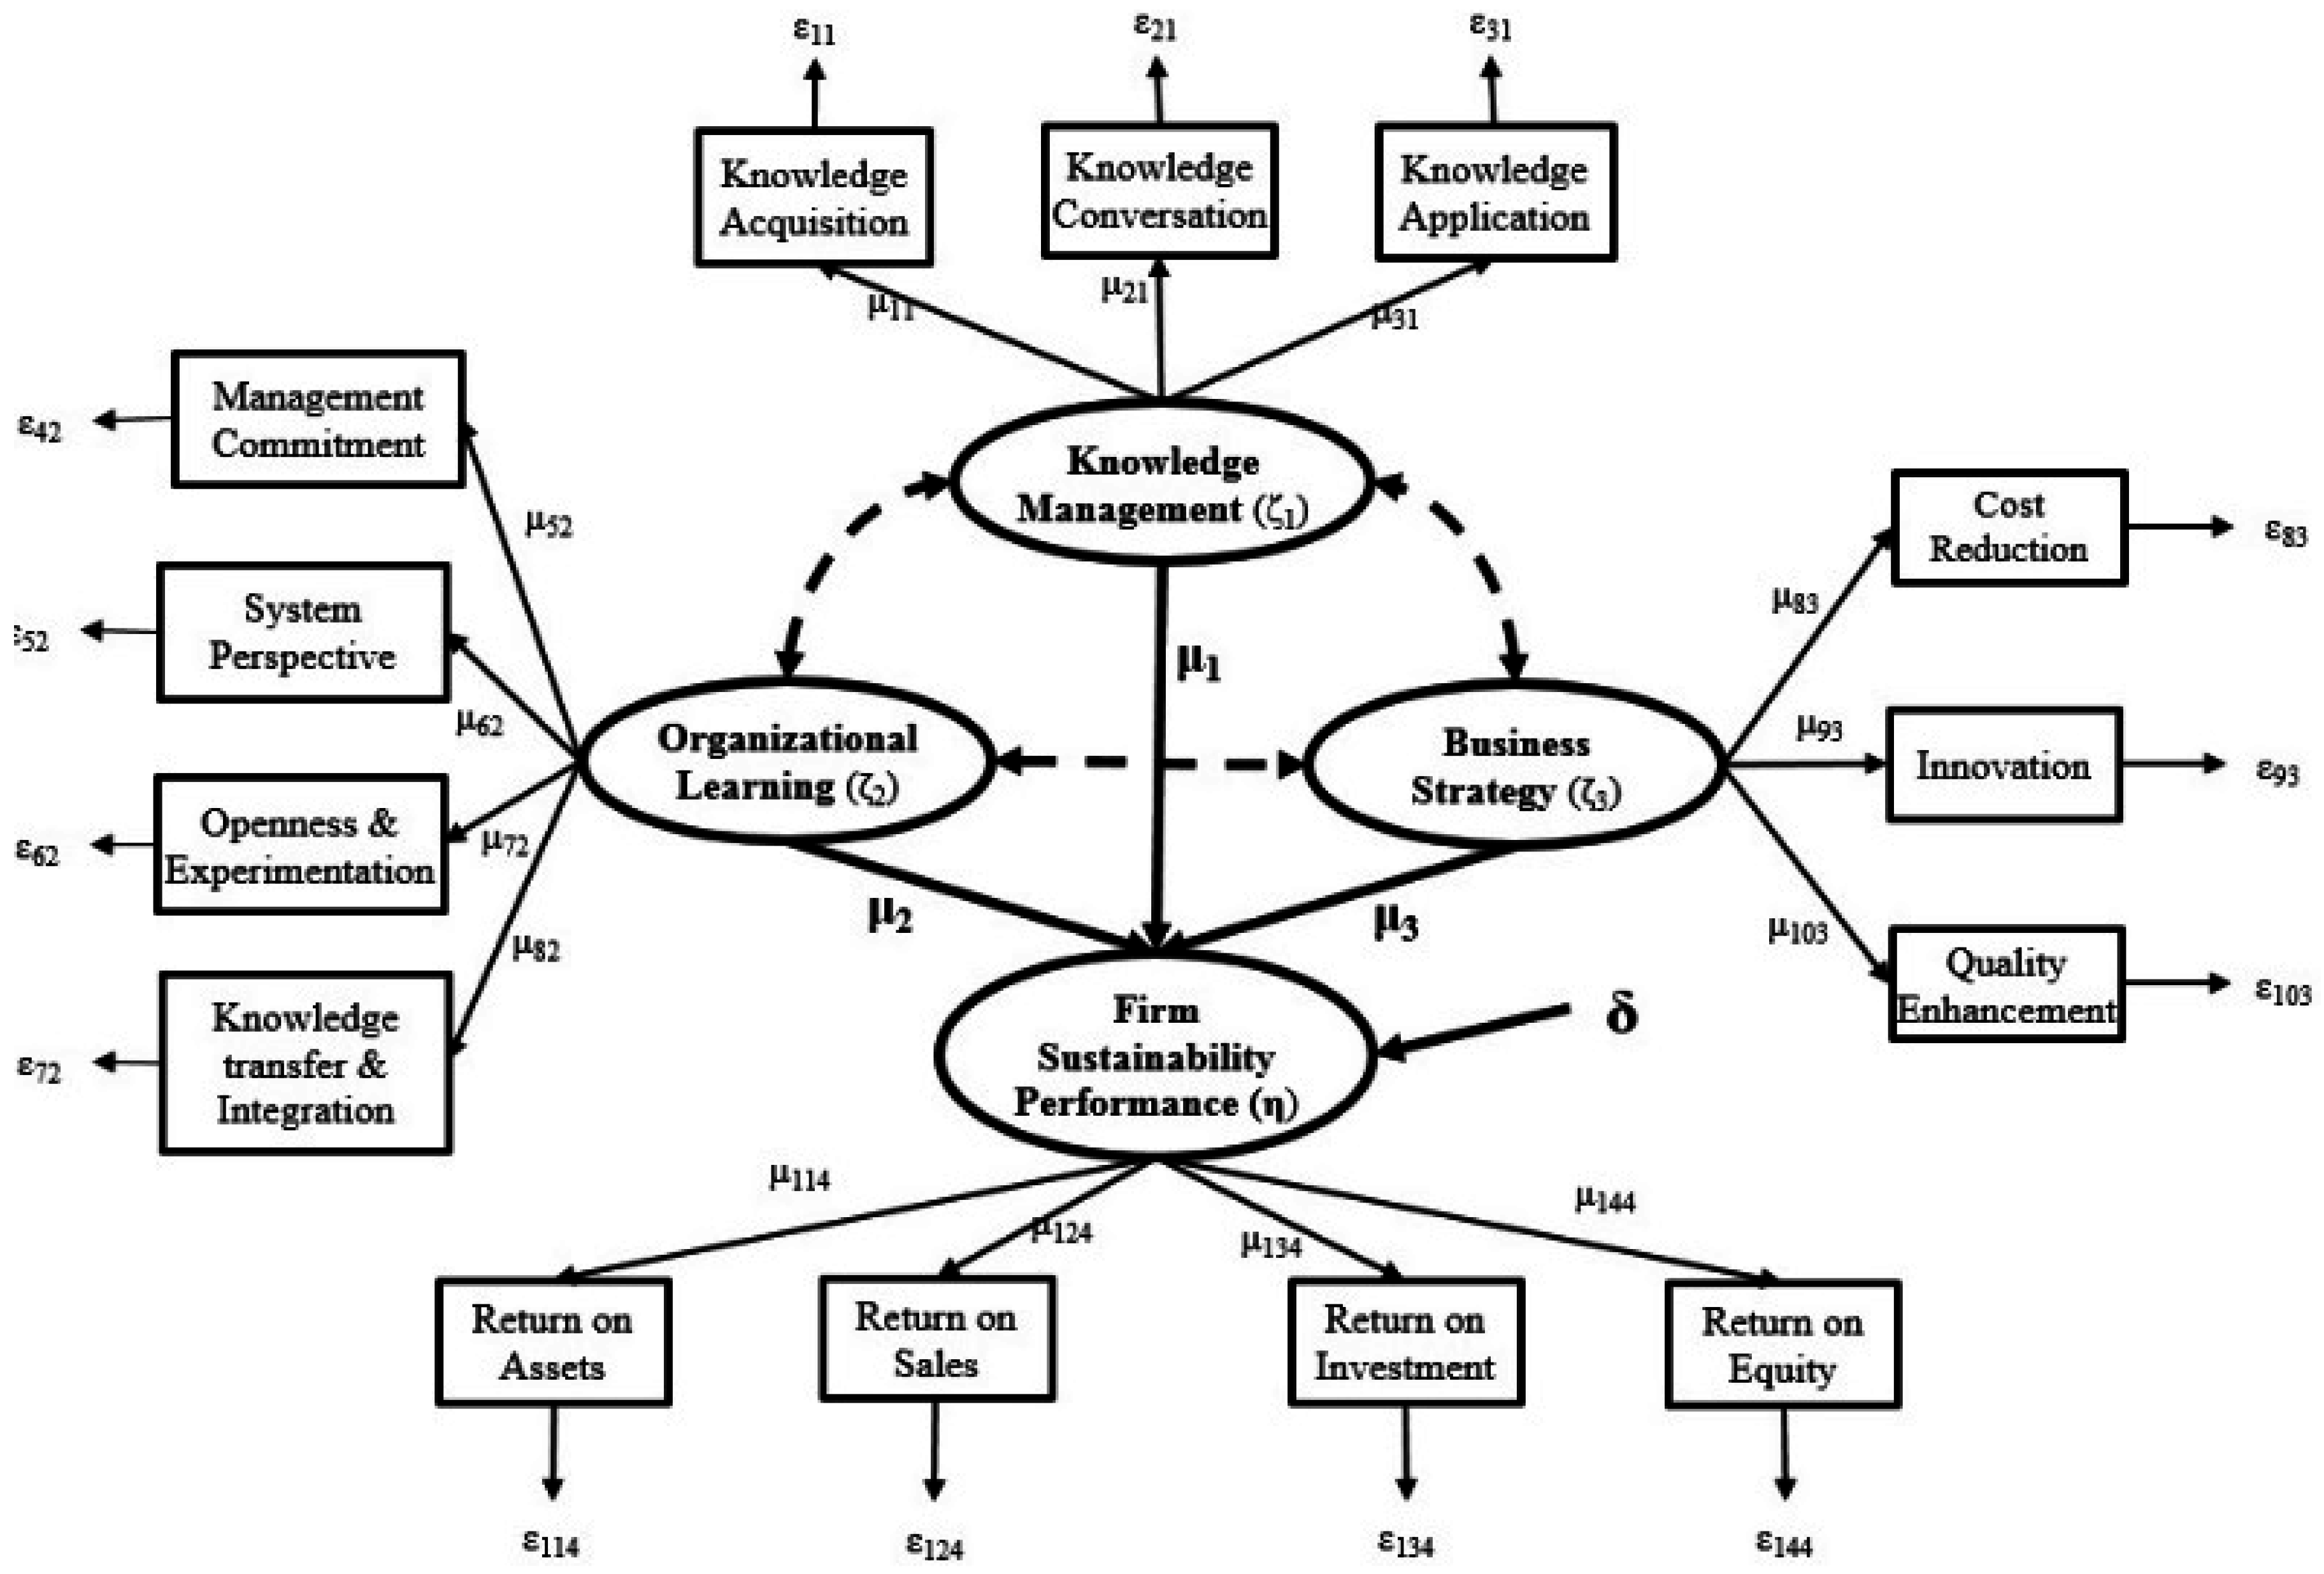
Figure 2 presents the hypothesized research model that involves latent variables and their indicators is used to show the impact of knowledge management on the organizational learning, business strategy, and firm sustainability performance. The figure illustrates that there is inter-correlation among the first three constructs. As a result, our research model includes four constructs and fourteen measurements.
Figure 2.
Research Framework.
Figure 2.
Research Framework.
4. Results and Discussion
Fornell and Larcker [
62] defined reliability and validity of the research based on a) validity— Cronbach’s alpha of every construct must be equal or higher than 0.7 [
63]; and b) reliability–the average variance extracted (AVE) must be equal or higher than 0.50 [
64]. As it can be seen from
Table 2, all Cronbach’s Alpha and AVE values can meet the recommended norms and standards, which mean that the proposed construct validity and reliability of the measurement model is adequate.
Table 2.
The AVE and Cronbach’s Alpha values.
Table 2.
The AVE and Cronbach’s Alpha values.
| Latent Variables | AVE | Cronbach’s Alpha |
|---|
| Firm Sustainability Performance | 0.54 | 0.78 |
| Knowledge Management | 0.62 | 0.73 |
| Business Strategy | 0.84 | 0.81 |
| Organizational Learning | 0.62 | 0.71 |
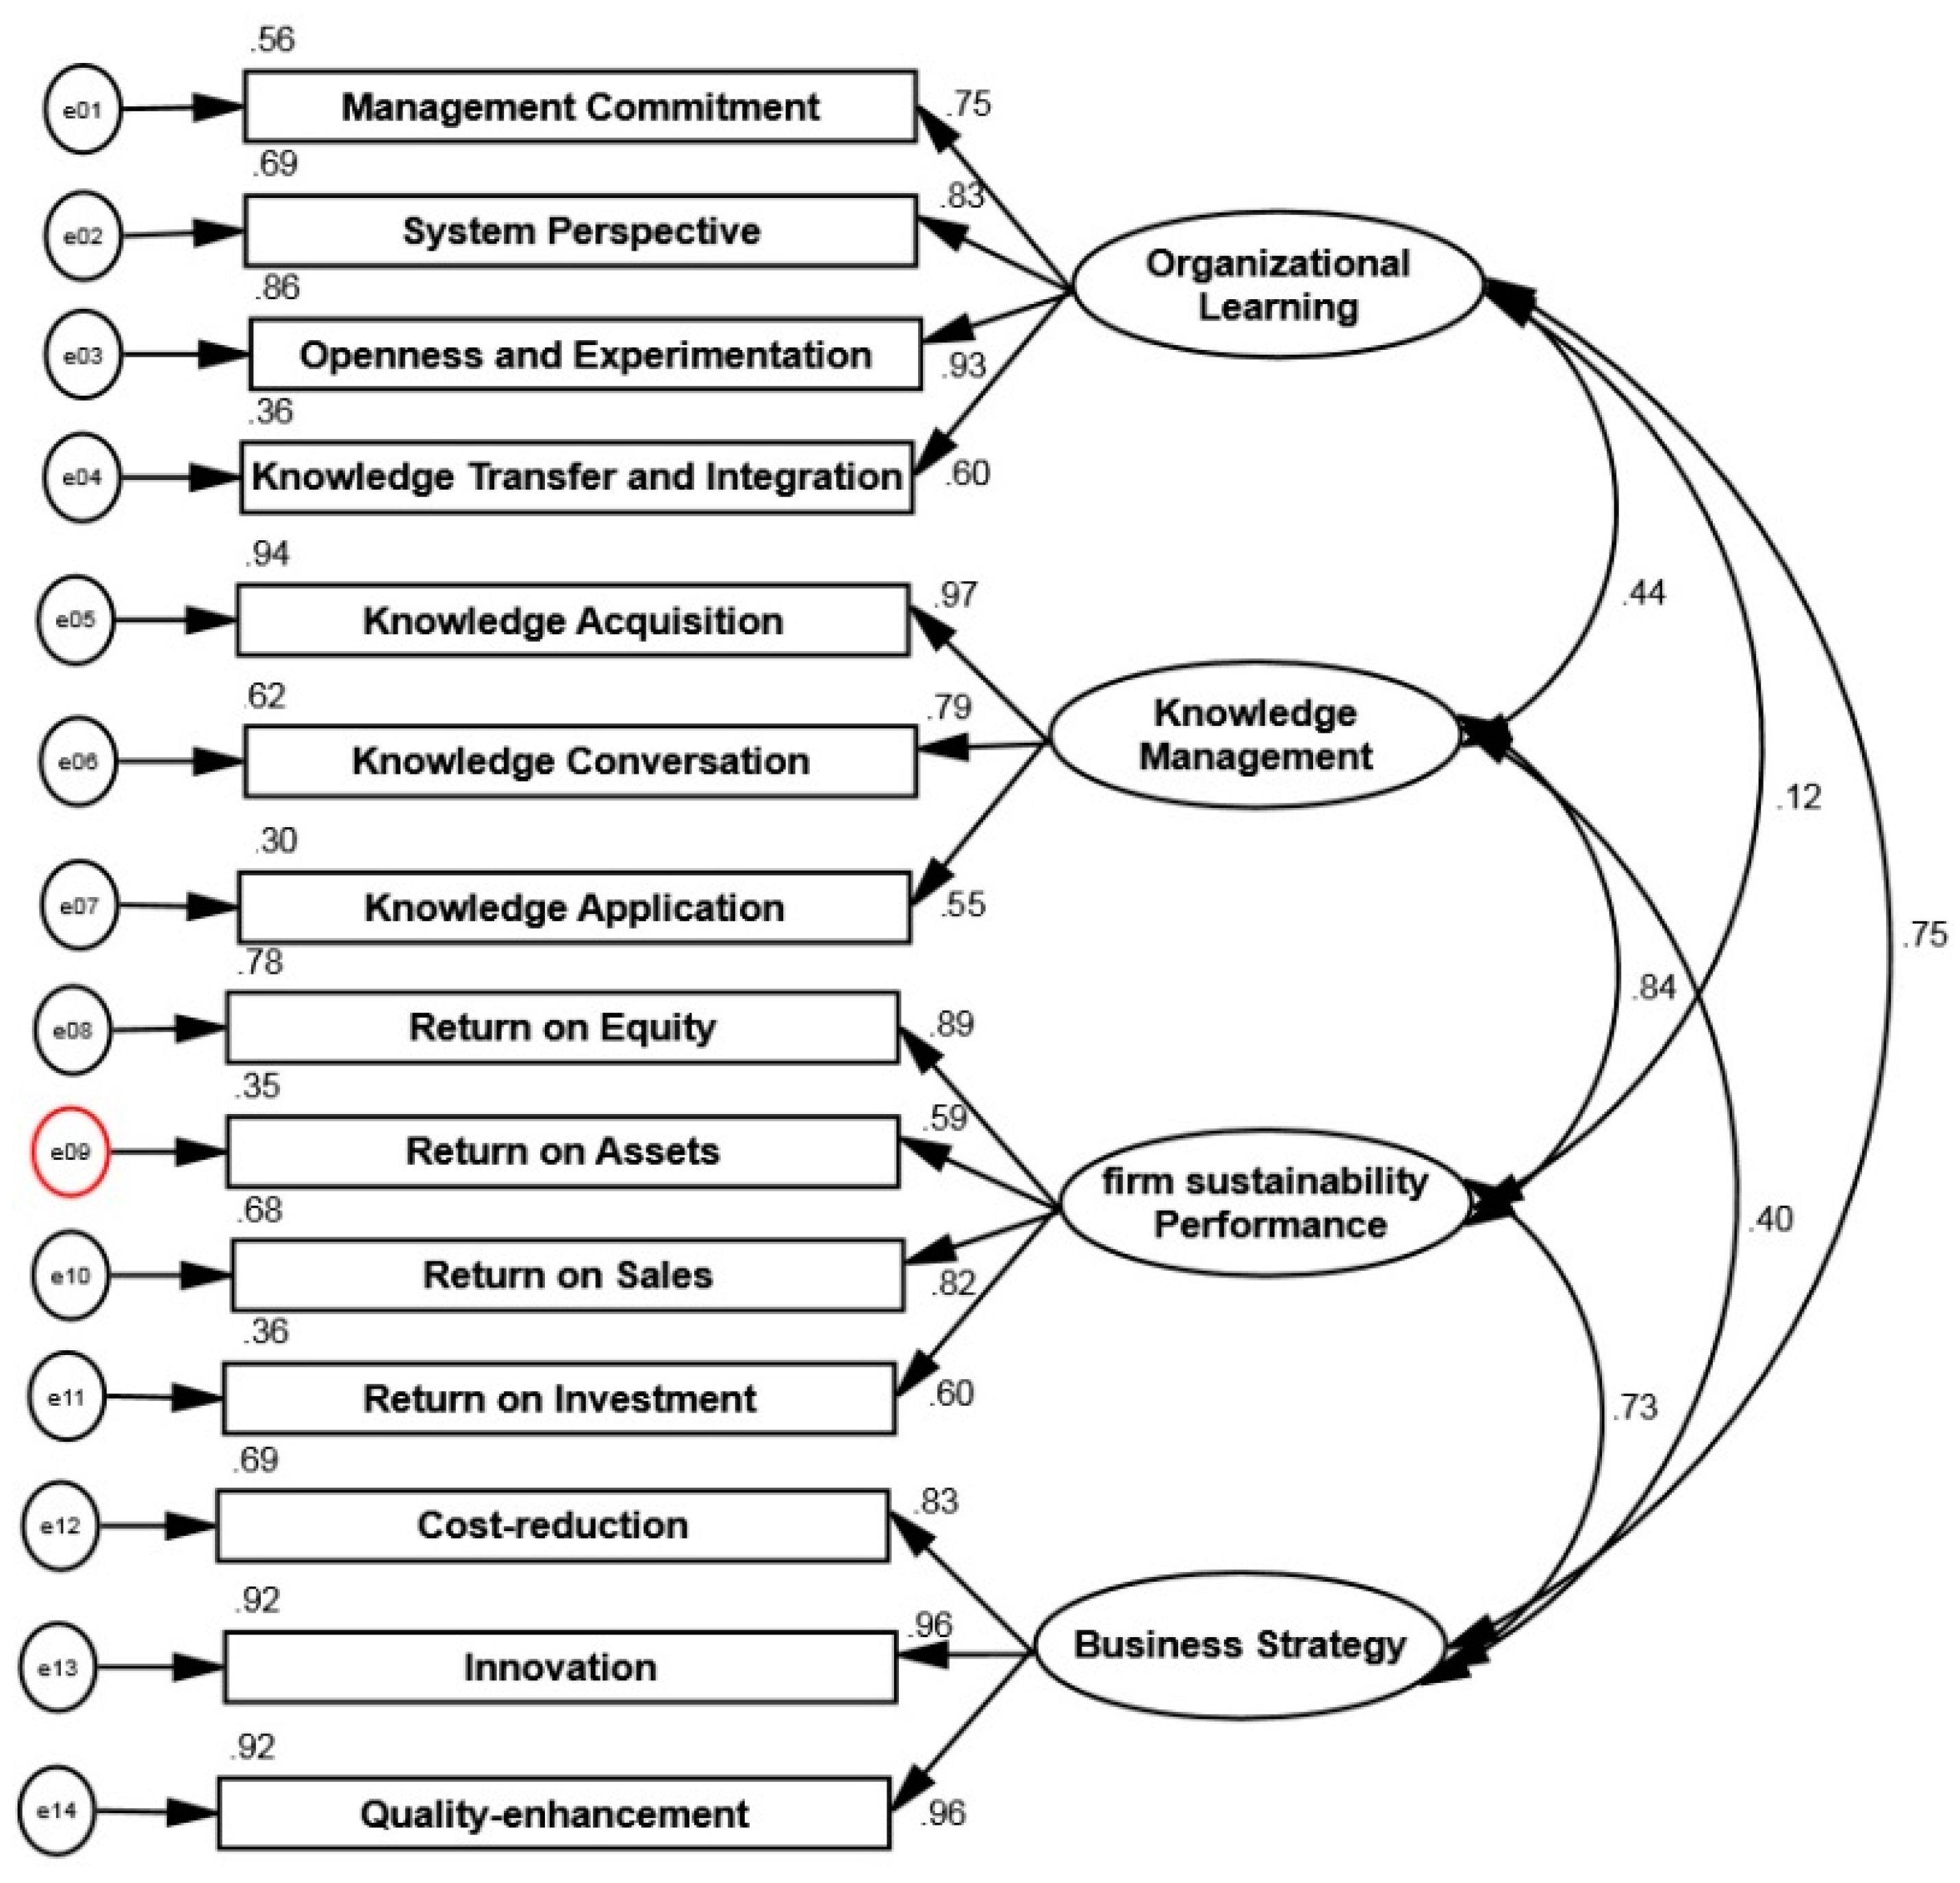
The covariance between the constructs that was presented in
Figure 3 proved a strong impact among the proposed latent variables (knowledge management, business strategy, organizational learning, and firm sustainability performance). Kline [
65] determined that, the high correlation between two latent constructs, bigger than 0.85, shows the multi-collinearity issue. Regarding our output in
Figure 3, the correlation among of four latent constructs did not exceed 0.85 which is confirmed that no multi-collinearity exists in the model.
Figure 3.
Multi-collinearity analysis.
Figure 3.
Multi-collinearity analysis.
Table 3 obtained the results of model fitting based on the CSEM approach. The value of NFI, CFI, GFI, and RMSEA are not inside the acceptable area. Therefore, we have nearly 100% power of rejecting the research hypothesis that the current model is not fitted for our data at the 5% significance level. Moreover, the kurtosis statistic value for the multivariate normality test is equal to 33.84, which is not less than 10. Therefore, the multivariate normality hypothesis is rejected.
Table 3.
The analysis of model fitting.
Table 3.
The analysis of model fitting.
| Fit Index | Value | Critical (Acceptable) Value | Acceptability |
|---|
| NFI (Normed fit index) | 0.708 | >0.9 | − |
| CFI (Comparative fit index) | 0.807 | >0.9 | − |
| TLI (Tucker Lewis index) | 0.922 | >0.9 | + |
| IFI (Incremental fit index) | 0.978 | >0.9 | + |
| RFI (Relative fit index) | 0.934 | >0.9 | + |
| GFI (goodness of fit index) | 0.836 | >0.9 | − |
| Chi-square fit (p-value) | 0.000 | >0.05 | − |
| RMSEA (Root means square error of approximation) | 0.122 | <0.08 | − |
We can see from
Table 4 that the parameter estimates and standard errors obtained by various prior inputs are reasonably close. With BSEM technique we could conclude that the evaluated statistics is not sensitive to these three different prior inputs. Moreover, we can also say that the BSEM used here is quite robust to the different prior inputs. Accordingly, for the purpose of discussion of the results found using the BSEM, we will use the results obtained using Type I prior.
Table 4.
Bayesian estimation coefficients for three types of prior.
Table 4.
Bayesian estimation coefficients for three types of prior.
| Parameter | Type I Prior | Type II Prior | Type III Prior |
|---|
| Estimate | Standard Error | Estimate | Standard Error | Estimate | Standard Error |
|---|
| μ1 | 0.651 | 0.036 | 0.644 | 0.019 | 0.662 | 0.059 |
| μ2 | 0.219 | 0.047 | 0.2 | 0.076 | 0.22 | 0.001 |
| μ3 | 0.511 | 0.022 | 0.505 | 0.085 | 0.525 | 0.076 |
| μ21 | 0.589 | 0.073 | 0.59 | 0.083 | 0.598 | 0.027 |
| μ31 | 0.756 | 0.093 | 0.751 | 0.020 | 0.771 | 0.088 |
| μ41 | 0.625 | 0.036 | 0.614 | 0.052 | 0.616 | 0.025 |
| μ62 | 0.324 | 0.023 | 0.318 | 0.043 | 0.325 | 0.008 |
| μ72 | 0.612 | 0.064 | 0.603 | 0.089 | 0.63 | 0.037 |
| μ93 | 0.689 | 0.027 | 0.674 | 0.066 | 0.697 | 0.012 |
| μ103 | 0.781 | 0.057 | 0.776 | 0.040 | 0.799 | 0.059 |
| μ124 | 0.458 | 0.024 | 0.455 | 0.069 | 0.471 | 0.030 |
| μ134 | 0.635 | 0.091 | 0.626 | 0.008 | 0.63 | 0.069 |
| μ144 | 0.485 | 0.022 | 0.469 | 0.028 | 0.488 | 0.040 |
| Φ11 | 0.687 | 0.035 | 0.682 | 0.085 | 0.708 | 0.070 |
| Φ12 | 0.824 | 0.060 | 0.816 | 0.055 | 0.805 | 0.073 |
| Φ13 | 0.689 | 0.008 | 0.672 | 0.048 | 0.694 | 0.063 |
| Φ22 | 0.427 | 0.074 | 0.422 | 0.003 | 0.443 | 0.046 |
| Φ23 | 0.519 | 0.042 | 0.513 | 0.030 | 0.541 | 0.051 |
| Φ33 | 0.487 | 0.096 | 0.479 | 0.002 | 0.499 | 0.004 |
| Ψδ | 0.851 | 0.032 | 0.833 | 0.047 | 0.853 | 0.066 |
| Ψδ11 | 0.609 | 0.011 | 0.606 | 0.073 | 0.624 | 0.023 |
| Ψε21 | 0.547 | 0.005 | 0.54 | 0.021 | 0.548 | 0.032 |
| Ψε31 | 0.509 | 0.097 | 0.491 | 0.043 | 0.51 | 0.080 |
| Ψε41 | 0.318 | 0.009 | 0.311 | 0.012 | 0.329 | 0.028 |
| Ψε52 | 0.785 | 0.053 | 0.766 | 0.058 | 0.786 | 0.093 |
| Ψε62 | 0.806 | 0.009 | 0.8 | 0.087 | 0.792 | 0.039 |
| Ψε72 | 0.613 | 0.069 | 0.608 | 0.013 | 0.611 | 0.006 |
| Ψε83 | 0.731 | 0.044 | 0.715 | 0.095 | 0.716 | 0.003 |
| Ψε93 | 0.859 | 0.047 | 0.837 | 0.045 | 0.858 | 0.048 |
| Ψε103 | 0.807 | 0.072 | 0.795 | 0.008 | 0.808 | 0.044 |
| Ψε114 | 0.908 | 0.033 | 0.907 | 0.055 | 0.919 | 0.094 |
| Ψε124 | 0.804 | 0.016 | 0.822 | 0.030 | 0.805 | 0.025 |
| Ψε134 | 0.855 | 0.026 | 0.863 | 0.047 | 0.869 | 0.043 |
| Ψε144 | 0.743 | 0.070 | 0.749 | 0.094 | 0.734 | 0.038 |
Test of convergence statistics for all of interested parameters are plotted and we found that the R values are near to one. The diagrams of sequences of observations corresponding to some research parameters created by two different primary values are also examined. All plots illustrate that the algorithm converged in less than 10,000 iteration. Plots of the estimated residual versus the case number are also checked to assess the plausibility of the proposed model. We identified that all designed diagrams lie within two parallel horizontal lines, centered at zero, and they have no trend. We could conclude here that the estimated model which is obtained based on the BSEM analysis would be considered adequate and could be acceptable.
The next analysis is the simulation study using the bootstrap technique. The goal of the simulation study here is to illustrate the ability of the Bayesian approach procedure and its relation to an algorithm which is recovering the accurate parameters. The simulation study does so by generating a set of new data set by sampling with a replacement from the original dataset, and fitting the model to each new dataset. To compute standard errors for calculating the 95% confidence interval of all parameters in this study, roughly 100 model fits are determined.
Table 5 presents the results taken from the simulation study.
Table 5 shows that all parameter estimates fall within the 95% bootstrap percentile intervals obtained from the simulation study. Bootstrap percentile intervals seem to work well here. This means that the estimated posterior mean are acceptable. Thus, we believe that the power of our BSEM could yield the best fit for the model.
Table 5.
Results of the bootstrap method.
Table 5.
Results of the bootstrap method.
| Parameter | Bootstrap | Bootstrap | 95% Bootstrap Percentile Interval |
|---|
| Mean | Standard Deviation | Lower Bound | Upper Bound |
|---|
| μ1 | 0.652 | 0.003 | 0.633 | 0.678 |
| μ2 | 0.225 | 0.029 | 0.186 | 0.252 |
| μ3 | 0.503 | 0.002 | 0.494 | 0.547 |
| μ21 | 0.591 | 0.082 | 0.573 | 0.616 |
| μ31 | 0.761 | 0.027 | 0.725 | 0.827 |
| μ41 | 0.626 | 0.095 | 0.595 | 0.664 |
| μ62 | 0.325 | 0.020 | 0.304 | 0.386 |
| μ72 | 0.62 | 0.084 | 0.595 | 0.674 |
| μ93 | 0.683 | 0.089 | 0.663 | 0.714 |
| μ103 | 0.774 | 0.065 | 0.766 | 0.818 |
| μ124 | 0.453 | 0.019 | 0.436 | 0.506 |
| μ134 | 0.636 | 0.010 | 0.61 | 0.65 |
| μ144 | 0.487 | 0.088 | 0.463 | 0.493 |
| Φ11 | 0.695 | 0.001 | 0.654 | 0.719 |
| Φ12 | 0.828 | 0.062 | 0.772 | 0.842 |
| Φ13 | 0.69 | 0.057 | 0.65 | 0.703 |
| Φ22 | 0.433 | 0.029 | 0.404 | 0.492 |
| Φ23 | 0.527 | 0.035 | 0.457 | 0.573 |
| Φ33 | 0.49 | 0.047 | 0.441 | 0.518 |
| Ψδ | 0.855 | 0.056 | 0.792 | 0.869 |
| Ψε11 | 0.614 | 0.029 | 0.582 | 0.632 |
| Ψε21 | 0.555 | 0.070 | 0.453 | 0.566 |
| Ψε31 | 0.503 | 0.078 | 0.472 | 0.518 |
| Ψε41 | 0.322 | 0.067 | 0.276 | 0.346 |
| Ψε52 | 0.783 | 0.091 | 0.752 | 0.802 |
| Ψε62 | 0.803 | 0.019 | 0.754 | 0.845 |
| Ψε72 | 0.606 | 0.002 | 0.581 | 0.621 |
| Ψε83 | 0.725 | 0.055 | 0.699 | 0.748 |
| Ψε93 | 0.855 | 0.047 | 0.808 | 0.875 |
| Ψε103 | 0.816 | 0.036 | 0.761 | 0.822 |
| Ψε114 | 0.914 | 0.075 | 0.829 | 0.94 |
| Ψε124 | 0.808 | 0.067 | 0.763 | 0.873 |
| Ψε134 | 0.856 | 0.052 | 0.843 | 0.891 |
| Ψε144 | 0.751 | 0.083 | 0.7 | 0.769 |
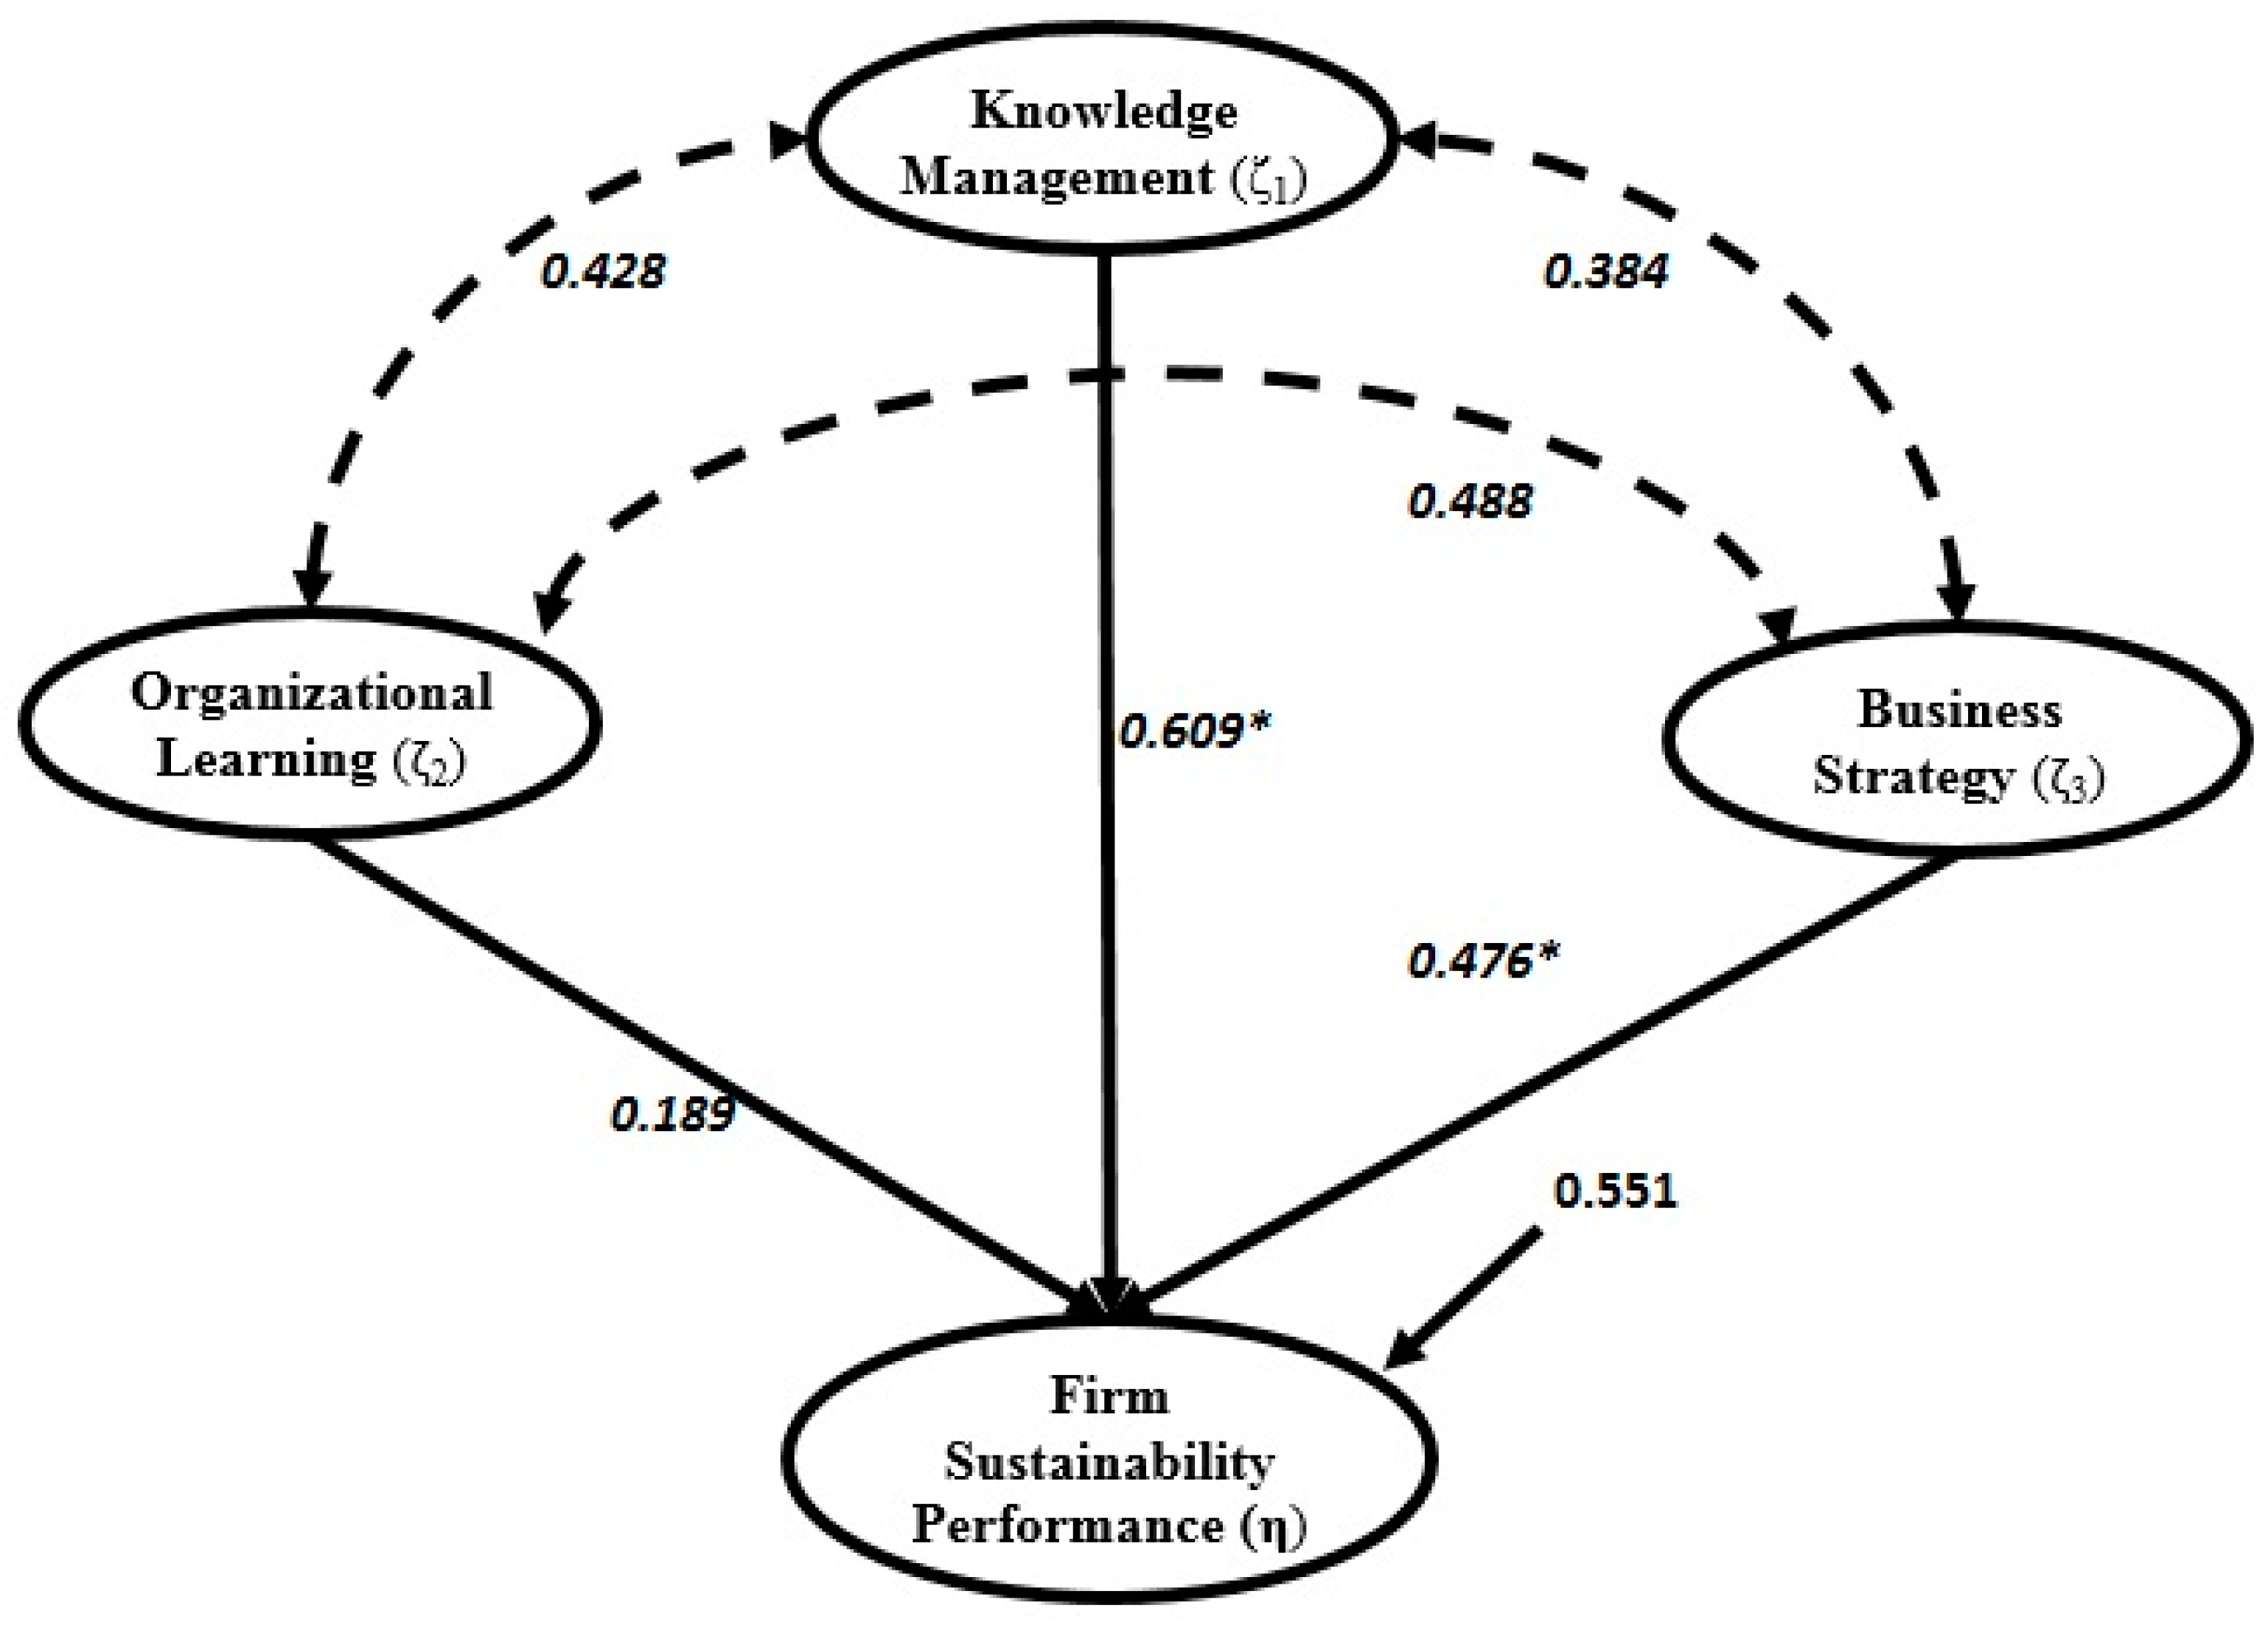
Based on
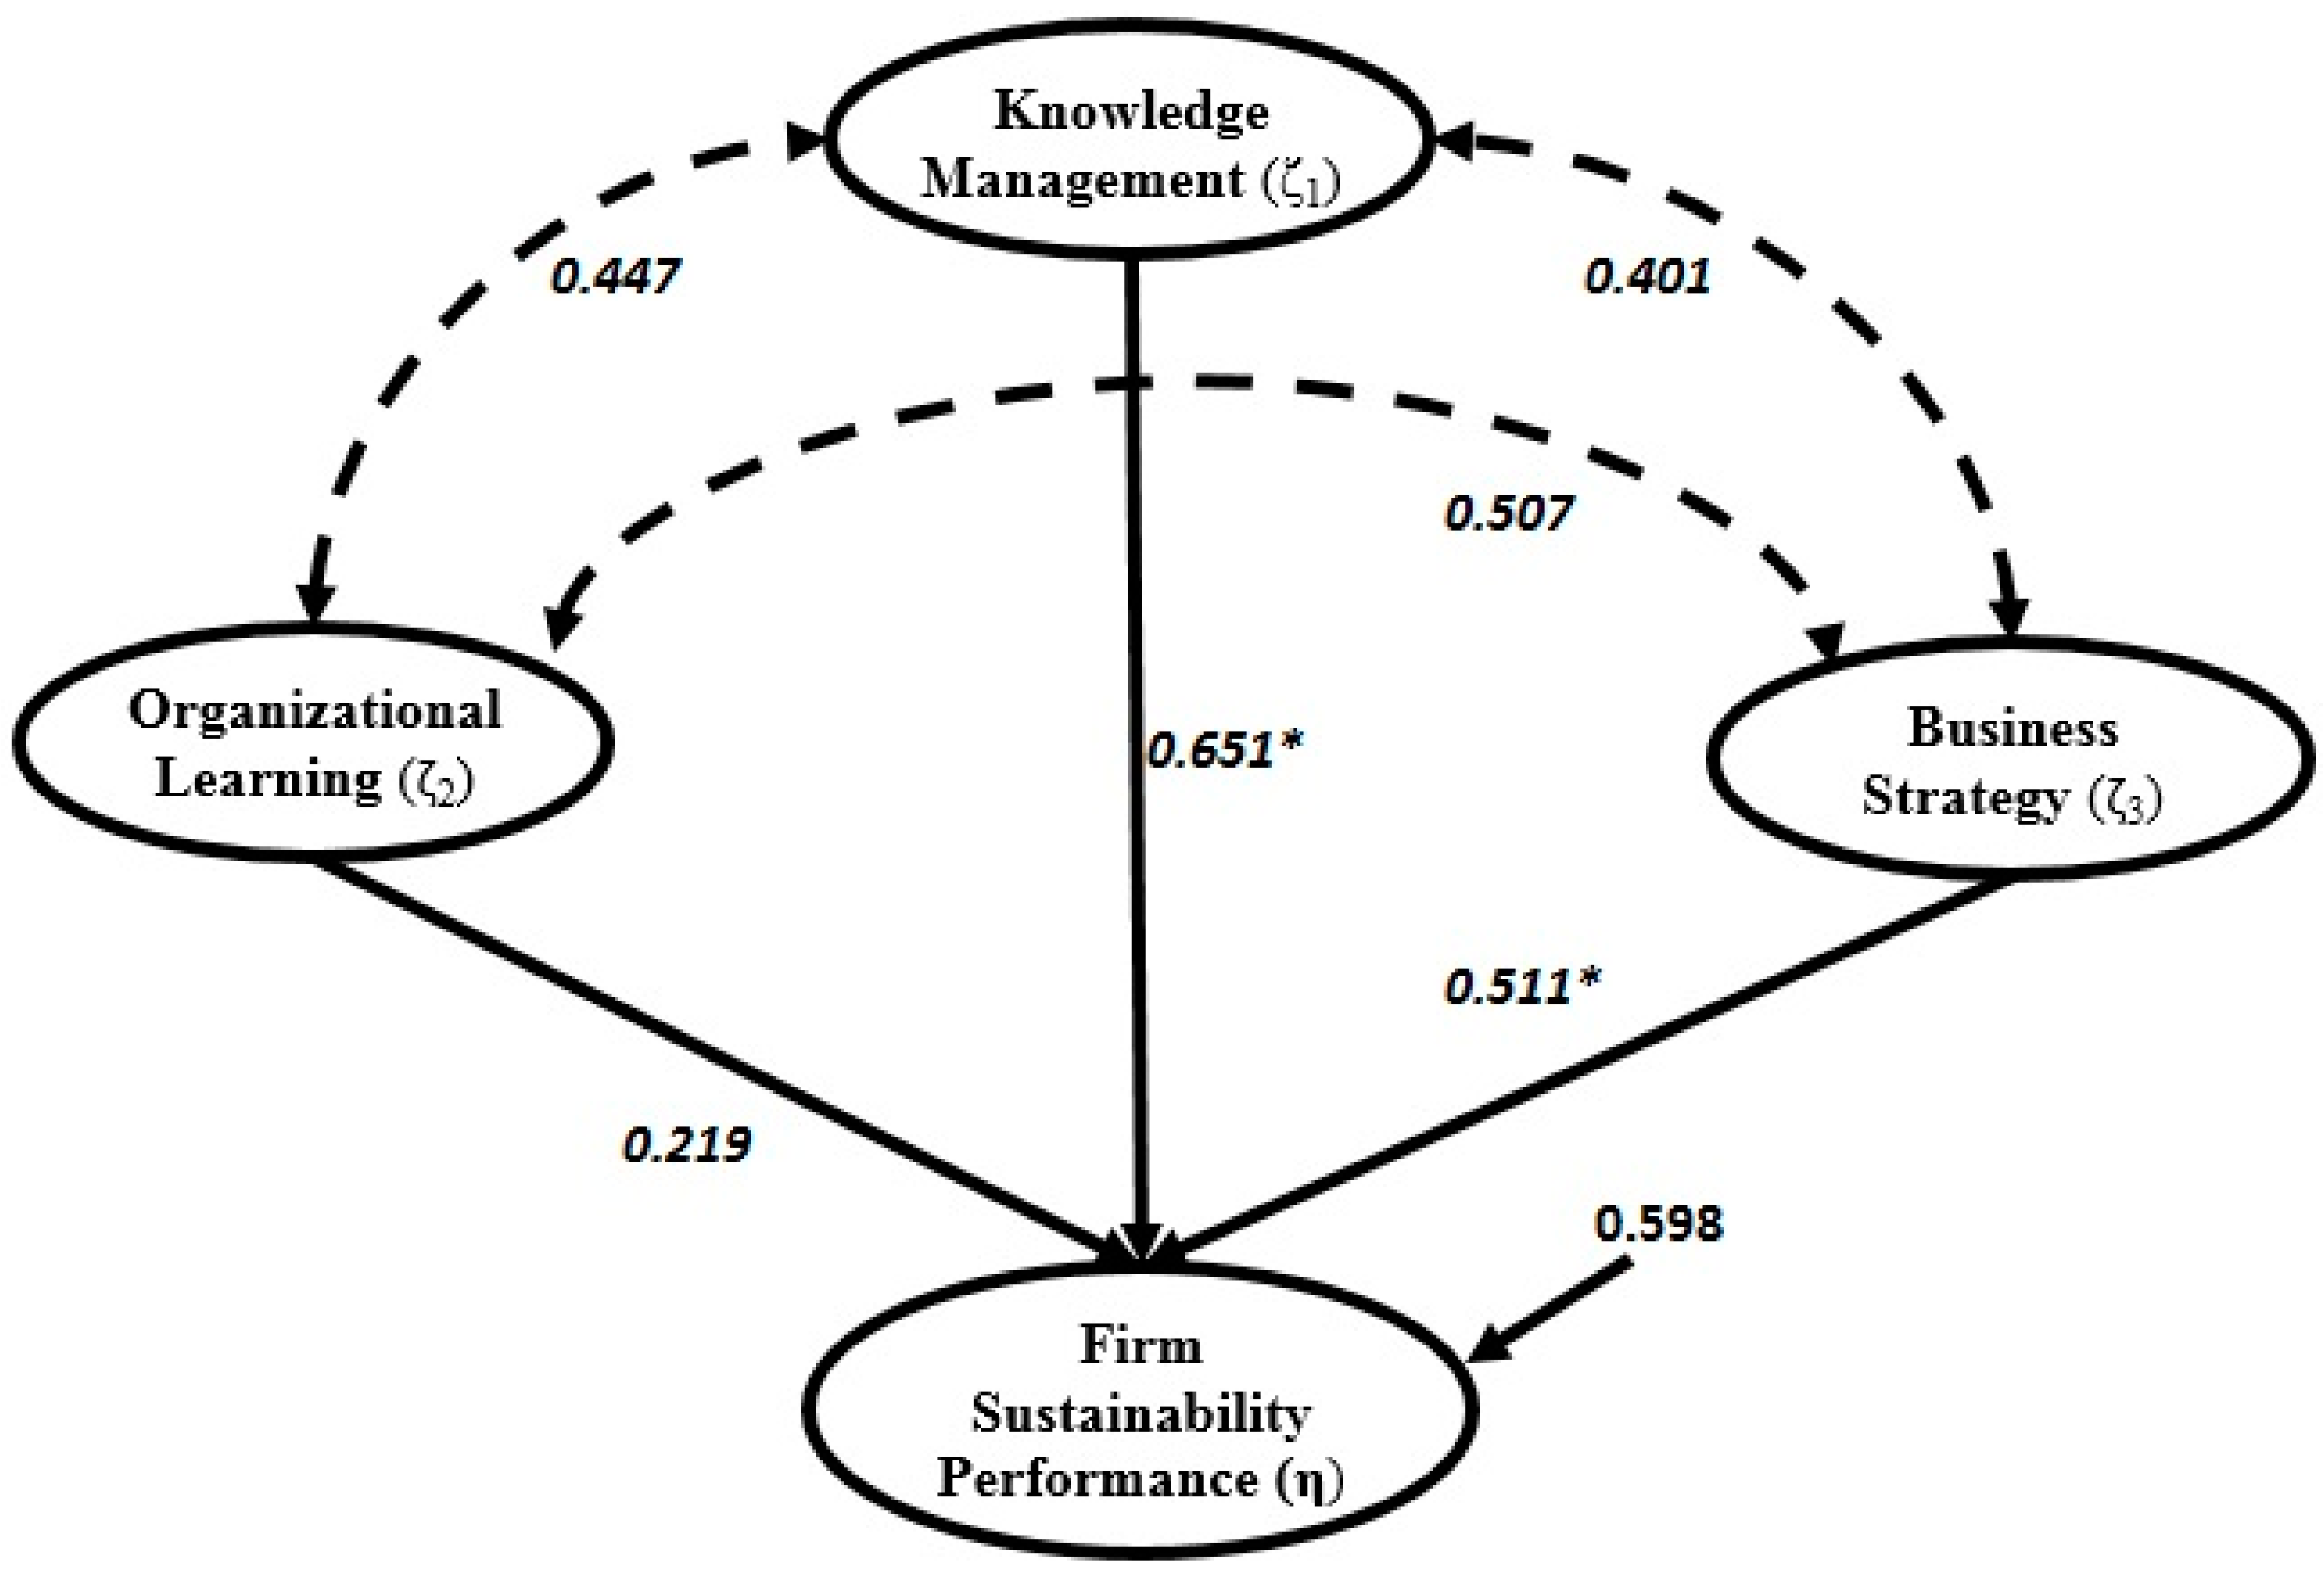
Figure 4 and
Figure 5, we obtain the estimated structural equations that address the relationship between the performance index with knowledge management, business strategy and organizational learning for the CSEM and the BSEM which are given by:
and:
respectively.
Figure 4.
CSEM results of research model.
Figure 4.
CSEM results of research model.
Figure 5.
BSEM results of research model.
Figure 5.
BSEM results of research model.
These estimated structural equations indicated that knowledge management (ξ1) has the greatest effect on the firm sustainability performance (η) than the other two latent variables. The association between knowledge management and firm sustainability performance index is positive and significant. One can conclude here that knowledge management is significantly correlated to the company performance condition, which implies that the company with good leading of the knowledge and strategy tend to experience a better performance situation. This study also finds that business strategy has a direct impact on the firm sustainability performance index and this connection is statistically significant. It was also obtained that organizational learning has no significant relationship to the firm sustainability performance index. The values of the standardized regression coefficient and their confidence interval for each indicators in the measurement equations obtained based on both approaches are presented in
Table 6.
Table 6.
Coefficient estimation of measurement model.
Table 6.
Coefficient estimation of measurement model.
| Construct | Measurement Variable | Estimation |
|---|
| CSEM (CI) | BSEM (CI) |
|---|
| Knowledge Management |
| | knowledge Acquisition | 1 | 1 |
| | knowledge Conversation | 0.958 * (0.842, 0.988) | 0.924 * (0.888, 0.965) |
| | knowledge Application | 0.636 * (0.592, 0.373) | 0.314 * (0.599, 0.661) |
| Organizational Learning |
| | management commitment | 1 | 1 |
| | system perspective | 0.652 * (0.595, 0.701) | 0.633 * (0.601, 0.667) |
| | openness and experimentation | 0.402 * (0.298, 0.442) | 0.369 * (0.309, 0.463) |
| | knowledge transfer and integration | 0.277 * (0.182, 0.379) | 0.219 * (0.191, 0.364) |
| Business Strategy |
| | Cost-reduction | 1 | 1 |
| | Innovation | 0.689 * (0.582, 0.812) | 0.637 * (0.591, 0.792) |
| | Quality-enhancement | 0.471 * (0.398, 0.511) | 0.385 * (0.311, 0.462) |
| Firm Sustainability Performance |
| | Return on Equity | 1 | 1 |
| | Return on Assets | 0.132 * (0.028, 0.268) | 0.211 * (0.117, 0.326) |
| | Return on Sales | 0.215 * (0.137, 0.298) | 0.168 * (0.097, 0.236) |
| | Return on Investment | 0.676 * (0.538, 0.801) | 0.521 * (0.422, 0.632) |
It is clear from
Table 5 that both models yield almost identical estimates of the factor loading. All indicators that we considered as predictors in the research model are significantly associated to their respective latent variables. It is interesting to observe that standard errors for the parameter estimates found under the BSEM are generally slightly smaller than those found based on the CSEM.
Table 6 also shows that the length of the 95% confidence intervals associated with the parameters obtained from the BSEM are generally shorter compared with those of the CSEM. This is not surprising due to the extra information brought by the prior distribution.
In our Bayesian analysis, we have used the conjugate prior distribution for updating the current information on the parameter. In the case of no prior information, it has been argued that it is better to use non-informative prior inputs rather than bad subjective prior inputs [
48]. In this study, however, we have a large sample, thus, the estimated parameters obtained are found to be less sensitive to the different choices of the prior inputs considered. Thus, prior inputs should be selected with great care, particularly when the sample size is small.
Finally, the BSEM output were compared with CSEM. Chatterjee [
66] introduced three indices include R
2, mean absolute error, and root mean squared error:
In the above indices,
is the
ith actual value of the dependent variable and
is the
ith predicted value.
Table 7 presents the values of the three performance indices, include R
2, mean absolute error, and root mean squared error for CSEM and BSEM. The R
2 value for the BSEM technique (0.598) is greater than the CSEM analysis (0.551), and the mean absolute error and root mean squared error values of the BSEM model (0.298; 0.039) are less than the CSEM model (0.361; 0.053). Therefore, the performance indices with the BSEM technique in estimating firm sustainability performance index are better than the CSEM model.
Table 7.
Comparison analysis between classical and Bayesian SEM outputs.
Table 7.
Comparison analysis between classical and Bayesian SEM outputs.
| | Performance Indices |
|---|
| Method | R2 | Mean Absolute Error | Root Mean Squared Error |
|---|
| Classical SEM | 0.551 | 0.361 | 0.053 |
| Bayesian SEM | 0.598 | 0.298 | 0.039 |
5. Conclusions
The main objective of the present paper is to demonstrate the value of the CSEM and the BSEM technique in modeling with firm sustainability performance index on food manufacturing factories in Taiwan, China, and Malaysia. Under the classical perspective, CFA CSEM is used to test the appropriate number of latent variables for explaining the observed items. The strength of CSEM is its ability to do a simultaneous test in order to describe the relationship between the observed variables and the respective latent variables, as well as the relationship among the latent variables [
67]. The analysis in this study is implemented under AMOS version 18, a flexible tool which allows one to examine the relationship involving the violation of normal assumptions of the variables considered in the model. In addition, for comparison with the results under the classical approach, the BSEM is applied using winBUGS version 1.4.
In this article, CSEM was applied as a representative parametric modeling technique and BSEM as a representative semi-parametric modeling technique to explore sustainability firm performance index prediction. According to the R2, mean absolute error, and root mean squared error indices, Bayesian SEM modeling is more effective in predicting firm performance with the dataset obtained from the food manufacturing industry in Malaysia, China, and Taiwan.
Even though many works have been done on determining the firm sustainability performance index, not much works have done on modeling of this index using SEM, particularly when information on knowledge management, organizational learning, business strategy, and food manufacturing companies are considered.
This study found that knowledge management has a significant effect on the performance index, but organizational learning does not. These findings are similar to the study of [
68], who indicated that hypertension, which he considered as an indicator of a performance index, is significantly related to indicators of knowledge management, such as knowledge acquisition, knowledge conversation, and knowledge application and indicators of organizational learning
i.e., management commitment, system perspective, openness and experimentation, and knowledge transfer and integration. He also finds that organizational learning does not have a significant effect on the firm sustainability performance index.
We propose a Bayesian approaches for analyzing useful structural equation model in firm sustainability performance index modeling. In formulating CSEM, and in developing the Bayesian methods, the emphasis is placed on the raw individual random observations rather than on the sample covariance matrix. Lee [
26], in his book entitle “Structural Equation Modeling: A Bayesian Approach” mentioned several advantages of this formulation.
First advantage, the improvement of statistical techniques is based on the first moment properties of the raw individual observations which is simpler than the second moment properties of the sample covariance matrix. Hence, it is easier to apply in more complex states.
Second advantage, it leads to a direct estimation of the latent variables which is better than the classical regression method for obtaining the factor score estimates.
Third advantage, as it directly models manifest variables with their latent variables through the familiar regression functions, it gives a more direct interpretation and can use the common methods in regression modeling such as residual and outlier analyses in conducting statistical analysis.
In Bayesian approaches estimation, Dunson [
46], Scheines, Hoijtink [
47], and Lee and Song [
48] believes that this technique allows the researchers to use of genuine prior information in addition to the information that is available in the observed data for producing better outputs, delivers valuable statistics, and indices, such as the mean and percentiles of the posterior distribution of the unknown parameters, and gives more reliable results for small samples.
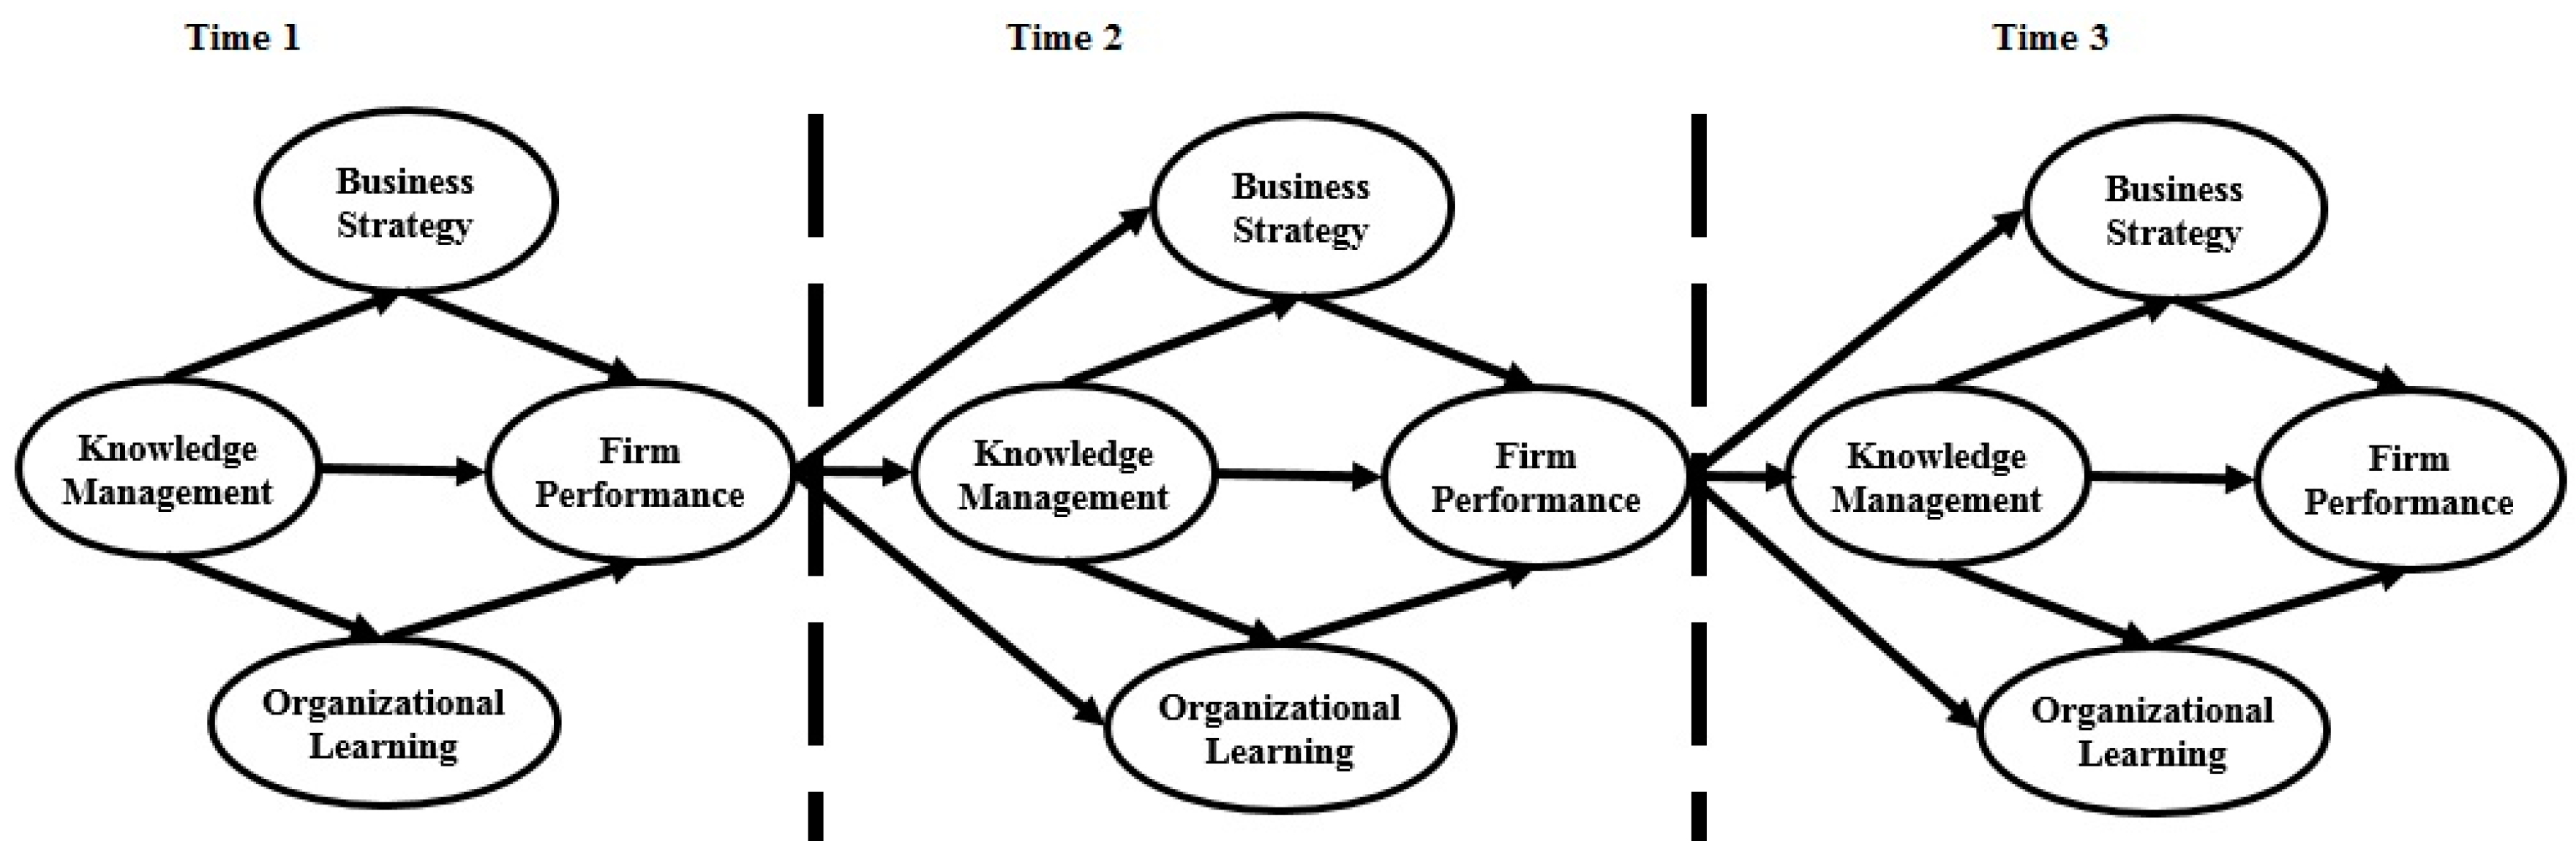
Our study, CSEM and BSEM with cross-sectional data, is able to analyze the impact of knowledge management, business strategy, and organizational learning on firm sustainability performance. However, our methodology is not able to analyze the
vice versa impact of firm sustainability performance on of knowledge management, business strategy, and organizational learning. To overcome with this issue we suggest for the future study to do dynamic SEM with longitudinal data.
Figure 6 presents a sample of dynamic SEM with concerning our research framework.
Figure 6.
Dynamic SEM framework.
Figure 6.
Dynamic SEM framework.
This study was carried out in the food manufacturing industry. Future comparison studies are recommended between CSEM and BSEM in other industries, like banking, transportation, public health, etc. CSEM is a parametric methodology and BSEM is semi-parametric, therefore a comparison study among a neural network (non-parametric method) and Bayesian structural equation modeling is recommended.


 ,
, 

