1. Introduction
The formation of metropolitan cities, with geographic extensions much greater than the past, and the integration of original cultures from different countries raise the level of complexity of infrastructures in urban systems (transport, education, health, sports,
etc.). At the same time, the recent economic crisis has placed the institutions that have historically been producers of the investment needed for such public works in front of the problem of having to find sufficient financial resources. In Europe, the financing channels have been primarily identified as the resources made available by the European Community, as well as the most advanced forms of public-private partnership. Private partners base the decision about their adhesion to projects of public interest on the fundamental criterion of the economic and financial convenience, which must be verified by using the appropriate financial evaluation techniques. Although the verification of the economic and financial feasibility is a necessary requirement for the realization of the project by private parties, the interest of the local community can be measured through a purely monetary analysis [
1,
2,
3,
4]. Therefore, the point of view of the public authority is broader. Based on the adopted strategic policies, it is interesting to know the level of satisfaction on social, cultural and environmental requests [
5].
Public authorities should therefore be able to expertly mediate between the monetary feasibility of investments and its social and political coherence compared to the demands of growth and development from the population. In this perspective, it is important to be capable of “measuring” the suitability of either a public project or a project of public interest, in meeting the needs expressed by the local community. The measure of this capacity can be applied to a dual purpose: (1) identification of local priority projects to be considered within the definition of tools for territorial government; and (2) preparation of appropriate measures supporting the projects of public interest, which, although possibly characterized by a smaller economic attractiveness for private investors, can make a more significant contribution to the welfare of the community.
The assessment of the ability of a project of public interest in meeting the needs of the local community has a multidimensional nature and must be able to integrate the local political preferences delegated to land management.
To this end, the definition of composite indices, capable of integrating the quality of the urban projects from the point of view of the community into an overall assessment, is useful. These synthetic indexes can be used as evaluation instruments of the quality of urban projects from the perspective of the community and can pose parameters of judgment to identify reliefs, for example of a financial or tax nature, that can direct the membership of private partners to projects that are more favorable to the community. They can also be used to identify priority actions in the field of local strategic and financial planning.
The main functions of a composite index of sustainability related to a public work or a work of public interest can be identified in the ability to synthetically express the quality of the project in terms of the objectives of sustainability, to encourage communication with all of the involved parties and to legitimize choices derived from a rational and transparent analysis of the available alternatives [
6].
The purpose of this paper is the construction of socio-environmental convenience indexes and integrated sustainability indexes for the provision of sports facilities. The index must summarize the main needs expressed by the stakeholders. Composite indicators of this type can also be defined for different types of projects.
This objective is pursued using different multi-criteria evaluation techniques, in view of the distinction between “weak sustainability” and “strong sustainability”, opposing the idea of the almost complete against the idea of only the limited substitutability of natural capital with physical capital, respectively [
7]. In particular, two different decision-making models, suitable for evaluating the contribution of public investments and private investments of public interest from the two-fold point of view of sustainability understood in a weak and strong sense, are proposed.
The model described in this paper is useful for the construction of a multi-dimensional index of “restricted social convenience” and “overall social convenience” or “overall sustainability” for investments targeted at the creation or adaptation of municipal swimming pools in the province of Salerno (Italy). The paper is organized in some introductory
Section 2,
Section 3,
Section 4,
Section 5,
Section 6 and
Section 7 on multicriteria tools for the construction of convenience indicators, in sections on the processing of models (8 and 9) and sections summarizing and discussing the results in
Section 10 and
Section 11.
2. The Formulation of a Social Convenience Index for Investments of a Public Nature
Synthetic indexes or composite indicators are evaluation tools widely used in decision-making on economy, environment, globalization, society, innovation and technology [
8], public policies [
9], sustainability about single civil engineering works [
10] and at a local level [
11], as well as in ranking countries [
12].
Several aggregation procedures have been proposed to build a composite indicator integrating manifold issues [
13,
14]; however, from an operational point of view, they are the result of an aggregation rule applied to values representing the performance of a given alternative on a set of criteria.
The construction of a social synthetic index includes the following fundamental steps:
the carrying out of a detailed analysis of the basic needs of the local community as an instrument guiding the identification of the relevant points of view in the analysis of alternatives [
15];
the choice of a suitable aggregation procedure, considering the use of the composite indicator in the sustainable management of the territory and the necessity of being easily understandable for local administrators, even if they do not have specific technical competences in decision analysis;
the weighting of considered indicators;
the implementation of the aggregative model for each alternative, in order to obtain the value of the indexes.
In general, either weights are directly attributed by experts or special techniques used in order to achieve more objective values. The assignment of weights to single indicators for their aggregation is considered a crucial step in social multicriteria evaluation, and a good solution could be the renunciation of their same assignment, considering, therefore, equal weights for all of the indicators. In this case, the number of the considered indicators will represent the importance of the criterion that they express [
8].
The choice of aggregation procedure is also an important step for the essential implications of each procedure. Furthermore, it is known that the application of different decision models can lead to different results for the same decision problem [
6,
16].
The main aggregation approaches belong to Multiple Attribute Utility Theory (MAUT) [
17,
18], outranking methods, introduced by Bernard Roy [
19], and other “non-classical” approaches [
20].
Procedures belonging to classical approaches are all suitable for handling the aggregation of single one-dimensional indicators in a comprehensive index, since they can deal with both quantitative and qualitative information, as well as give as an outcome a measure of the performance of the considered alternatives.
The procedures belonging to the outranking approach, like the PROMETHEE (Preference Ranking Organization METHod for Enrichment Evaluations) [
21] and ELECTRE (ELimination Et ChoixTraduisant la REalité) methods [
19], which are based on a pair-wise comparison of the alternatives, use weights representing the coefficient of importance and are not, in general, totally compensatory methods [
22]. This is the reason why they are able to support a strong sustainability concept in which a bad performance on an indicator is not fully compensated by a good performance on another one [
8]. The outranking approach assumes the hypothesis of the preferential independence of any sub-family of indicators [
22].
Approaches based on multi-attribute utility theory require the consideration of an n-dimensional utility function that assigns a value to each alternative, representing its preferability. In general, the n-dimensional utility function is constructed by aggregating one-dimensional utility functions on a single criterion, to which a weight may be associated [
18]. Using this kind of procedure, the preferential independence of the family of indicators is also assumed, so that the marginal utilities can be assessed; the different indicators have to be expressed on the same scale; and the weights represent substitution rates [
22].
The additive and multiplicative techniques are the most widely used form of aggregation function [
23]. Other aggregation techniques, such as the class of Ordered Weighted Averaging (OWA) operators [
24] and the Choquet integral [
25,
26], belong to the MAUT framework and are extensions of weighted means. OWA operators are able to express vague quantifications, and the Choquet integral can model interactions among criteria [
27].
3. Social Convenience Indexes for Investments in Swimming Pools
In the present paper, a synthetic index of “restricted social convenience” related to projects for supplying sports facilities to a local community is defined. The proposed composite indicator comprehends both environmental aspects, as well as appropriate social aspects. Furthermore, a composite index of “overall social convenience”, also called “overall sustainability”, for the same projects is defined. It synthesizes the environmental, social and financial aspects.
Various reasons can explain the preference commonly given to the use of procedures based on additive value functions in the construction of synthetic indexes of sustainability:
- -
the modeling of preferences is rather intuitive and therefore easily understandable by non-experts;
- -
the value functions assign a comprehensive value to each alternative and not a measure of the degree of preference of an alternative over another;
- -
unlike the outranking methods, the comparability of alternatives is always possible [
22];
- -
the outcomes are robust due to the independent evaluation of each alternative [
28].
The above-mentioned reasons also justify the decision to use the MAUT approach, in the weighted linear form, for the formulation of an index of social convenience relating to investments for the creation or adaptation of sports facilities [
29]. Furthermore, MAUT approaches allow for compensation among the different points of view integrated in the assessment procedure [
22], with the result being agreeable to the assumption of a weak conception of sustainability [
8], that is suitable for local contexts with several social needs to be satisfied.
With the aim of testing the results obtained with different aggregation techniques, in relation to the conception of sustainability in the strong or weak sense, in the present study, a comparison is made between the results achieved with the use of a compensatory aggregation procedure and of one that tends to partly compensate for the poor performance on some criteria with the favorable performance on other criteria. Therefore, the outcomes of the available alternatives’ evaluation through the weighted linear sum aggregation model, in the simplified version SMART (simple multi-attribute rating technique), will be compared to those obtained by using a less compensatory aggregation technique. In particular, the PROMETHEE II procedure will be used. The choice of the two aggregation procedures is justified in the following section.
4. Reasons for the Choice of Aggregation Procedures
Using multi-criteria assessments for real decision-making problems in the public sector, the easiness of understanding the method and the minimum request for preference information from the decision-makers have been highlighted as key features of a suitable decision-making model [
6]. Since in the evaluation process for the formulation of the aggregate index of the investments’ social convenience, the role of the decision-maker is held by political institutions, in general not equipped with specific skills in the field of mathematical techniques for multi-criteria evaluation; the simplicity of the method is considered essential for the contribution of the decision-makers in eliciting their preferences, with it being more conscious and less prone to errors of interpretation.
As stated, the use of the MAUT approach is a widespread choice in the elaboration of sustainability indexes. In view of the difficulties detected in practice for defining the trade-off between the criteria [
28] and due to the lack of information on the marginal utility functions, it was decided to resort to the simplified formulation of the linear model MAUT, known as SMART. In contrast to the SMART method, which like the other additive models is fully compensatory, an outranking method is used. Procedures belonging to this class may have more or less a degree of compensation between the criteria [
22].
Endowed with a greater comprehensibility for the decision-makers than ELECTRE methods [
30], the PROMETHEE II procedure is implemented here. It provides a single complete preorder, although the non-compensatory level is more limited compared to other ELECTRE methods, in particular in the absence of thresholds of preference, indifference and veto [
31]. Applying the PROMETHEE II, we opt for the functional form of the “usual criterion”, which avoids the definition of indifference and/or preference thresholds, which is typically a complex [
28,
31,
32] and time-consuming [
33] exercise for decision-makers. Neglecting the use of thresholds implies that any difference between two evaluations produces a strict preference for the alternative having a better, even if small, evaluation with respect the considered criterion.
SMART and PROMETHEE II are relatively simple multi-criteria evaluation procedures and therefore easily comprehensible by non-expert actors involved in the assessment. In particular, as previously mentioned, among the possible forms adoptable for the preference function of the outranking procedure, the “usual criterion” is chosen, since it does not require the definition of additional parameters and whose understanding is intuitive. The application domains of both procedures fit our decision problem [
34], since they can treat discrete cardinal and ordinal information; they can also solve choice and ranking decision problems; they use the same type of inter-information between criteria, since weights reflect the relative importance between criteria [
21,
35]; they can be implemented using a simple spreadsheet. In addition, weights do not depend on the measurement scale of the criteria, both in the PROMETHEE II procedure [
30] and in SMART, since in the latter, the measurement scales are normalized [
35]. These circumstances make their task easier for decision-makers [
33] and allow for the comparison of the results obtained by the two procedures.
5. Insertion of the Present Work in Literature Reviews
SMART and PROMETHEE methods are among the most used aggregation tools and have been applied to a wide variety of decision problems.
A literature review up to the year 2010 is given by Behzadian
et al. [
30], revealing an abundant production of the applications of PROMETHEE methods concerning logistic and transportation problems; energy, water, environment and business management; chemistry, manufacturing and social topics. In more recent years, there has been a great deal of interest in applying the various PROMETHEE methods, and a large number of applications about the management of natural resources is available; see Kuang
et al. [
36]. Only a recent interest has been shown for the specific field of assessment for the sustainability of cities and territories. The surveyed applications are on decisions at a building scale [
37], urban scale [
32,
38] and on an overall assessment of global cities [
39].
The main application of SMART is on environmental management decisions [
40,
41,
42], but it is also proposed for a public assessment application for mitigation and adaptation policy [
43], as well as transport [
44]. On an urban scale, it is used in assessing the sustainability of built heritage [
45], local energy systems [
46] and urban ecosystems [
47,
48,
49,
50].
The main aspects central to the present work are the comparison between different aggregation procedures in multicriteria assessment and the issue of weak and strong sustainability. Previous works have made comparisons between different assessment methods, according to the technical characteristics of algorithms, as in [
16,
51], in order to make choices coherent with sustainability assessment problems [
23] or to compare the results with aided decisions [
52]. Compared to previous works, we aim to compare the outcomes from different assessment methods with regard to the compensatory effect, and confronting SMART and PROMETHEE II, we exclude the use of thresholds, as in [
51], in order to investigate the differences between the considered methods under maximum similarity conditions. Regarding sustainability assessment, there is a very large amount of literature on every sector and, in particular, urban areas, as in [
53], while the issue of weak and strong sustainability has been mainly addressed from a methodological point of view [
8,
13,
54,
55,
56]. Although there have been some specific applicatory works on regions [
57], countries [
58,
59], fisheries [
60] and urban heritage [
61], the need to address the issue of assessment application on weak and strong sustainability [
62] has been recognized. In this work, the SMART and PROMETHEE II methods are used to assess the sustainability of single public projects in an urban context. In particular, they are applied to a swimming pool ranking problem.
6. Aggregation by the SMART Procedure
The weighted linear aggregation is the usual procedure used in the computation of composite indicators. Using SMART, a simplified form of MAUT [
35,
63] given a set of alternatives {
A1,
A2, …
Am}, a set of indicators {
c1,
c2, …
cn} and their respective weights {
w1,
w2, …
wn}, a synthetic index (
V) related to the alternative
j is obtained by applying a weighted additive aggregation model, according to the following mathematical rule:
with:
where
vi,j is the normalized performance value on the indicator ci and
wi is the normalized weight [
8].
The assessment
vi,j is standardized to a 0–1 scale, where zero and one represent the worst and best performances, respectively [
36]. The weights can be assigned by the direct rating method, according to which raw weights are assigned to criteria ranked according to their importance, attributing a score of 10 to the least important criterion, then assigning increasing scores to the other criteria in relation to the first score and, finally, normalizing the sum of the assigned weights to one [
35].
While in MAUT models, weights reflect both scale and importance, in SMART, weights reflect only importance, since the scales are transformed to a common basis [
64].
7. Aggregation by the PROMETHEE II Procedure
PROMETHEE procedures are based on the outranking relation, according to which an alternative outranks another alternative if, given the preferences of the decision-makers, there are sufficient arguments for recognizing that the first alternative is not less preferable than the second one [
22]. The construction of the outranking relation in the PROMETHEE II method is characterized by the use of variables and parameters that are easily understandable by unexperienced decision-makers [
22].
Introduced by Brans and Vincke [
21], the PROMETHEE methods have been used in applications related to multiple fields [
32], but their use is not widespread in the construction of composite indicators.
Given a set of alternatives {
A1,
A2, …
Am} and a system of indicators {
c1,
c2, …
cn} with their respective weights {
w1,
w2, …
wn} and knowing the performances of alternatives on single criteria, the outranking degree corresponding to an ordered couple of alternatives (
Ar,
As) is defined by the aggregated preference index, expressing the preference of A
r over A
s according to all of the criteria [
65]:
in which
Pi (
Ar,
As) is a preference function related to the criteria
i. Preference functions are defined by suitable functional forms and associated parameters, assigning to the differences between the performance of two alternatives on a criterion,
di (
Ar,
As) =
ci (
Ar) −
ci (
As), a preference degree ranging from 0–1. Among the available forms of the preference function [
65], the one able to better express the preferences of the decision-makers will be chosen for each criterion. In the proposed assessment model, the usual criterion has been adopted for all of the considered criteria. In case of a criterion
i to be maximized, comparing the alternatives
Ar and
As, the usual criterion expresses a strict preference of
Ar in comparison with
As only if the difference di (
Ar,
As) is positive. The choice is founded on the need to use a very simple assessment model that can be easily understood by decision-makers and on the advisability of not requiring the use of a threshold of indifference and/or of strict preference. Thus, the generalized usual criterion does not require additional information in comparison to the simple formulation of MAUT considered here. The preference function related to the usual criterion is expressed as follows [
65]:
This form of the generalized criterion corresponds to the “true criterion” [
66], expressing a strict preference for any difference between two evaluations [
67].
Finally, the PROMETHEE II procedure leads to a unique complete preorder ranking the alternatives according to a decreasing order of values of the net outranking flow
φ(
Ar) for each alternative that is given by:
where
φ+(
Ar) is the positive flow and
φ−(
Ar) is the negative flow, representing how the alternative
Ar outranks the other ones and how
Ar is outranked by the other alternatives. Positive and negative flows are expressed as follows [
65]:
8. Three Projects for Municipal Pools in the Province of Salerno (Italy)
8.1. The swimming pool in Nocera Inferiore
The project involves the construction of an indoor swimming center to be built in the town of Nocera Inferiore (Salerno). The plant will be able to be approved by the Italian Swimming Federation, based on the safety standards of the Italian Olympic National Committee (CONI) and the Ministry of Interior, which set the size of the tanks according to the activities that must take place. The plant is designed to emit into the atmosphere the least possible amount of pollutants and adopts alternative methods of energy production, in the present case thermo-photovoltaic hybrid panels.
The project involves the construction of a semi-Olympic indoor pool with a size of 25 per 16.66 m and of two smaller swimming pools of 16.66 per 8 m, one dedicated to children and the other for rehabilitation activities and water aerobics. Some services dedicated to users are also planned. They include a bar, a solarium, a sauna and a gym. The structure is articulated on a single level consisting of a space for the swimming pools and a service block. The structure of external cladding of the service block will be made of panels with improved thermal performances, while the coverage of the swimming pool area will be in curved laminated wood.
8.2. The swimming pool in Sapri
This swimming pool will be realized in the city of Sapri, more precisely in the south, in Brizzi, close to the town center. Currently, the area is a sports ground, and with the realization of the structure, it will become a real sports center. This project involves the construction of a concrete structure cast in situ to be used as a reception and dressing room for athletes. The construction of the roof of the swimming pool is planned in precast prestressed concrete.
The pool for sports (swimming, water polo) has dimensions of 12.60 m for 25.00 m and a constant depth of 2.00 m, with an area of 315 m2 and a volume of 630 m3. The flat roof around the pool will have a width of 2.50 m along the long side and of 4.00 m along the other side, according to the norms of the Italian Olympic National Committee (CONI).
The pool cover, entirely prefabricated, will consist of prestressed elements and pillars, with a total area of 747 m2 (40.60 m for 18.40 m) and a practicable deck.
8.3. The swimming pool in Salerno
The plant is located in the center of Salerno. The project will cover the top of the adult pool, the reconstruction of the same pool, the construction of adjacent changing rooms, the renovation of the existing building and the installation of parking areas equipped with photovoltaic shelters. The projected plant includes an outdoor swimming pool of 28 m × 20 m × 1.60 m, an outdoor swimming pool for children of 11 m × 6 m × 0.50 m, a solarium around the swimming pools, two changing rooms with toilets and showers, a waiting room with reception, an infirmary, a bar room, an engine room, a boiler room, an outdoor parking area for about fifty cars and a green area adjacent to the swimming plant.
9. Calculation of the Composite Indicators for the Three Municipal Pools
Relevant indicators have been selected on the basis of an in-depth analysis of the local context conducted by the provincial public authority [
68], as well as data taken from ISTAT (Istituto Nazionale di Statistica—National Institute of Statistics) on the local social, environmental and economic characteristics. According to ISTAT, young people are the main users of sports facilities; some student associations as the potential user basin of each swimming pool were involved in a discussion aimed at understanding their opinions about what features they expected a sustainable swimming pool should have.
Table 1 presents the final value tree, including the goal, criteria and indicators, while
Table 2 describes the single indicators, and
Table 3 shows their direction and the measurement scales. The set of selected criteria represents all of the key sustainability aspects in relation to the specific context, avoiding redundancy [
66].
While the environmental and social aspects define the “restricted social convenience” of the investments in question, the addition of the pre-taxation internal rate of return allows for the assessment of the “overall sustainability”, which integrates the financial feasibility.
The aesthetic quality of the projects has not been included in the set of criteria, because the alternatives can be considered as having the same level of architectonic quality.
While indicators I1, I4, I6 and I7 are measured in their natural scales, indicators I2, I3 and I5 express qualitative judgments. Their levels of performance are measured according to the values shown in
Table 4.
Table 1.
Value tree.
| Goal | Criteria | Codes‒Indicators |
|---|
| Overall sustainability | Environmental issues | I1—Spared emissions from plants |
| I2—Preservation of natural land |
| I3—Accessibility |
| Social issues | I4—Level of supply of swimming services |
| I5—Synergistic effect |
| I6—Employment effect |
| Financial issue | I7—Pre-taxation internal rate of return |
Table 2.
Description of indicators.
Table 2.
Description of indicators.
| Codes‒Indicators | Description |
|---|
| I1—Spared emissions from plants | It measures the spared emission of CO2 per user due to the reduction of energy consumption from traditional energy sources |
| I2—Preservation of natural land | It expresses the quality of a project regarding the shift of natural land to artificial areas |
| I3—Accessibility | It regards the presence of dedicated parking for users and the quality of a suitable public transport service |
| I4—Level of supply of swimming services | It concerns the level of the supply of swimming services against the local level of demand. |
| I5—Synergistic effect | It is achieved if the swimming plant is localized near other sports facilities, creating an integrated system of sports facilities useful also as a center for social gathering |
| I6—Employment effect | It expresses the contribution to the development of new employment |
| I7—Pre-taxation internal rate of return | It expresses the financial feasibility of the investment |
Table 3.
Information on indicators.
Table 3.
Information on indicators.
| Codes‒Indicators | Direction | Measurement Scale |
|---|
| I1—Spared emissions from plants | To be maximized | kg CO2/year |
| I2—Preservation of natural land | To be maximized | Judgment measured on an ordinal scale |
| I3—Accessibility | To be maximized | Judgment measured on an ordinal scale |
| I4—Level of supply of swimming services | To be maximized | Supply of swimming services/relative demand |
| I5—Synergistic effect | To be maximized | Judgment measured on an ordinal scale |
| I6—Employment effect | To be maximized | Number of employees |
| I7—Pre-taxation internal rate of return | To be maximized | Value on 0–1 scale |
Table 4.
Levels of performance for indicators I2, I3 and I5.
Table 4.
Levels of performance for indicators I2, I3 and I5.
| I2 | I3 | I5 |
|---|
| Performance-Score | Performance-Score | Performance-Score |
|---|
| Reuse of already built land | 10 | Presence of dedicated parking and of a suitable public transport service | 10 | Nearness to more than one sports facility | 10 |
| | | Presence of dedicated parking and of an insufficient public transport service | 5 | Nearness to one sports facility | 5 |
| Shifting of natural land to artificial area | 0 | Absence of dedicated parking and of a suitable public transport service | 0 | Nearness to no sports facility | 0 |
Table 5 summarizes the performance of the considered projects for swimming facilities on the set of indicators. The projects cover three geographical areas of the province of Salerno, which are the city of Salerno, the city of Nocera and the city of Sapri.
Table 5.
Performance table.
Table 5.
Performance table.
| Indicators | Projects |
|---|
| | Salerno | Nocera | Sapri |
|---|
| Environmental issues | I1 (kg CO2/year) | 81,620 | 80,465 | 106,000 |
| I2 (ordinal judgment) | 10 | 0 | 0 |
| I3 (ordinal judgment) | 10 | 5 | 5 |
| Social issues | I4 (supply/demand) | 0.96 | 1 | 1 |
| I5 (ordinal judgment) | 5 | 10 | 5 |
| I6 (number of employees) | 25 | 40 | 15 |
| Fin. issue | I7 (Pre-taxation internal rate of return) | 0.129 | 0.117 | 0.140 |
For the purposes of the aggregation of the performances of the alternatives using the SMART method, we consider the standardized marginal utility functions assigning the value one to the best performance according to the considered indicator and the value zero to the worst one with the linear form of marginal utilities for indicators.
The aggregation of performances by the PROMETHEE II method does not require the transformation into a common scale, thanks to a pairwise comparison between the alternatives.
Initially, we calculated the synthetic index of the “restricted” social convenience relative to the alternatives under consideration. Regarding the weights, in the first assessment, we attached the same value to all of the indicators (0.166), by giving the same importance to the social and environmental criteria. This choice is justified by the consideration that the social and environmental issues are the main topics of sustainability in the considered local context.
Using the “distance from the best and worst performers” technique [
6], the normalized performance table is obtained (
Table 6).
Finally, according to Equations (1) and (5), the composite indicators of the restricted social convenience (RSC) related to the considered projects are calculated (
Table 7). They express the environmental and social quality of each project.
The local administrations involved can choose the system of weights that best suit their policies. The composite indicators shown in
Table 7 refer to a situation in which the same importance is attached to individual indicators and then to the two social and environmental criteria. However, if the social aspects are considered doubly more important than the environmental ones, the composite indicators will become the RSC’ ones of
Table 8.
Table 6.
Normalized performance table.
Table 6.
Normalized performance table.
| Criteria | Projects |
|---|
| Salerno | Nocera | Sapri |
|---|
| I1 | 0.05 | 0 | 1 |
| I2 | 1 | 0 | 0 |
| I3 | 1 | 0 | 0 |
| I4 | 0 | 1 | 1 |
| I5 | 0 | 1 | 0 |
| I6 | 0.40 | 1 | 0 |
Table 7.
Composite indicators of social convenience obtained by assuming equal importance of the social and environmental aspects. RSC, restricted social convenience; SMART, simple multi-attribute rating technique.
Table 7.
Composite indicators of social convenience obtained by assuming equal importance of the social and environmental aspects. RSC, restricted social convenience; SMART, simple multi-attribute rating technique.
| Projects | Composite Indicators |
|---|
| RSC (SMART) | RSC (PROM.) |
|---|
| Salerno | 0.41 | 0.083 |
| Nocera | 0.50 | 0.082 |
| Sapri | 0.33 | −0.167 |
On the contrary, if the environmental issues are twice preferred in comparison to the social issues, the requested synthetic indexes are those in the columns RSC’’ of
Table 8. The different preferences related to the relative importance among the indicators could still be considered to better represent the preferences of the decision-maker.
Table 8.
Composite indicators of social convenience obtained taking a double preference for the social aspects with respect to the environmental ones (RSC′) and vice versa (RSC″).
Table 8.
Composite indicators of social convenience obtained taking a double preference for the social aspects with respect to the environmental ones (RSC′) and vice versa (RSC″).
| Projects | RSC′ (SMART) | RSC′ (PROM.) | RSC″ (SMART) | RSC″ (PROM.) |
|---|
| Salerno | 0.316 | −0.111 | 0.499 | 0.278 |
| Nocera | 0.667 | 0.333 | 0.333 | −0.167 |
| Sapri | 0.333 | −0.222 | 0.333 | −0.111 |
We then calculated the composite indicators of the overall sustainability (SC) obtained by integrating in the evaluation the contribution of the financial feasibility to the aspects of social convenience.
Table 9 shows the composite indexes of integrated sustainability obtained with the SMART and PROMETHEE II procedures assuming equal importance to the three categories (the social, environmental and financial one) of the indicators.
Table 9.
Composite indicators of integrated sustainability obtained by assuming equal importance for the social, environmental and financial aspects.
Table 9.
Composite indicators of integrated sustainability obtained by assuming equal importance for the social, environmental and financial aspects.
| Projects | Composite Indicators |
|---|
| SC (SMART) | SC (PROM.) |
|---|
| Salerno | 0.449 | 0.055 |
| Nocera | 0.333 | −0.278 |
| Sapri | 0.555 | 0.222 |
Finally,
Table 10 presents the aggregate indices obtained by attributing to the social aspects a double importance compared to the environmental ones, while the environmental and financial aspects are considered of equal importance (SC′) and the aggregate indices obtained by giving to the environmental aspects a double importance in comparison to the social ones, while the financial and social aspects are considered of equal importance (SC″).
Table 10.
Composite indicators of integrated sustainability obtained by assuming a double preference for the social aspects over the environmental and financial ones (SC′) and vice versa (SC″).
Table 10.
Composite indicators of integrated sustainability obtained by assuming a double preference for the social aspects over the environmental and financial ones (SC′) and vice versa (SC″).
| Projects | SC′ (SMART) | SC′ (PROM.) | SC″ (SMART) | SC″ (PROM.) |
|---|
| Salerno | 0.371 | −0.083 | 0.509 | 0.208 |
| Nocera | 0.501 | 0.000 | 0.250 | −0.375 |
| Sapri | 0.500 | 0.083 | 0.500 | 0.167 |
10. Summary and Discussion of the Results
In this paper, the simplified linear aggregative model SMART and the PROMETHEE II model have been tested with the aim of verifying their utility in the elaboration of synthetic indexes for the choice or ranking of investments in urban development.
Table 11 presents the rankings obtained through the use of the two procedures for the aggregation of the partial evaluation of the alternatives on the criteria.
As expected, the outcomes of the evaluation carried out by the considered methods lead to different scenarios. The comparison between the evaluation table (
Table 3) and the ranking table (
Table 11) induces the following considerations.
Assuming the same importance attributed to the classes of indicators, the exclusion of the financial parameter in the valuation of the synthetic index penalizes the investment in the territory of Sapri, which is the most disadvantaged for two out of three indicators for both the social category and the environmental aspects. Using SMART, the best performances of the alternative A2 (Nocera) on the social indicators offset the very bad performances on the environmental aspects. On the contrary, PROMETHEE II rewards the more balanced performances of the alternative A1 (Salerno).
If an equal importance is recognized for the various classes of indicators, the inclusion of the financial parameter in the evaluation of the synthetic index reverses the ranking of the investment in Sapri, which is the most disadvantaged for two out of three indicators for both the social and environmental categories. The drawback is re-balanced by the best financial performance.
Assuming a greater importance is attributed to the class of indicators on the social aspects compared to all of the remaining considered classes, the exclusion of the financial parameter in the evaluation of the synthetic index rewards, using both aggregation procedures, the investment in the territory of Nocera, which has the best performance on the social category. For the successive positions of the ranking, while PROMETHEE II awards the most balanced performances for the environmental aspects of the alternative A1-Salerno, SMART gives the highest-ranking to the alternative A3-Sapri, for which the best performance on the indicator I1 is able to balance the bad performances on the remaining environmental indicators. Analogous considerations can be made about the remaining rankings.
Nevertheless, the analysis of the results outlines some clearly legible trends.
Table 11.
The obtained rankings.
Table 11.
The obtained rankings.
| RSC (SMART) | RSC (PROM.) |
|---|
| Nocera | Salerno |
| Salerno | Nocera |
| Sapri | Sapri |
| SC (SMART) | SC (PROM.) |
| Sapri | Sapri |
| Salerno | Salerno |
| Nocera | Nocera |
| RSC′ (SMART) | RSC′ (PROM.) |
| Nocera | Nocera |
| Sapri | Salerno |
| Salerno | Sapri |
| SC′ (SMART) | SC′ (PROM.) |
| Nocera | Sapri |
| Sapri | Nocera |
| Salerno | Salerno |
| RSC″ (SMART) | RSC″ (PROM.) |
| Salerno | Salerno |
| Nocera-Sapri | Sapri |
| Nocera-Sapri | Nocera |
| SC″ (SMART) | SC″ (PROM.) |
| Salerno | Salerno |
| Sapri | Sapri |
| Nocera | Nocera |
In the aggregation carried out neglecting the financial criterion, both aggregative models indicate that the project in Sapri is the poorer. In fact, four times it is the last in the ranking, and two times it is penultimate. On the contrary, the projects in Nocera and Salerno share the leadership, with three first positions and two second places in the rankings.
Moreover, the compensatory effect of the procedure SMART seems to show itself. In fact, the procedure favors the project in Nocera (two first places and one second place in the rankings), whose profile of performances consists of three maximum values and three minimum values (see
Table 4). Instead, the PROMETHEE method favors the project with a more balanced profile (Salerno; two times in the first position in the rankings and one time in the second position).
The outlined framework dismantles itself with the introduction of the financial criterion. First, the project in Sapri becomes by far the dominant one (three times it is in the first position of the rankings and three times first in the second one). It is followed by the project in Salerno (two times in the first position of the rankings and two times in the second one) and then by the project in Nocera (one time in the first position of the rankings and one time in the second one).
However, what is most striking is the substantial stabilization of the rankings obtained using the two methods. In developing the indices SC and SC″, the rankings obtained by the two methods do not change. Sapri-Salerno-Nocera is the ranking outlined applying both SMART and PROMETHEE in the calculus of the index SC. Salerno-Sapri-Nocera is the ranking obtained using both SMART and PROMETHEE for the index SC″. In the calculation of SC′, the project in Salerno always occupies the third position in the rankings, regardless of the used aggregation procedure, while the projects in Nocera and Sapri are reversed in the leadership.
This last evidence has strategic implications that deserve attention. The substantial stabilization of the results achieved using a more compensatory aggregation procedure (SMART) or a less compensatory one (PROMETHEE) leads to distrust of easy propaganda proclamations. In fact, it would be easy for decision-makers to convey the use of a non-compensatory aggregation procedure as a political choice of strong sustainability, when the same results are reached using a compensatory method. Therefore, in such cases, the prevalence of a project over another one does not arise from the application of stricter selective rules, but from the same nature of the projects that shows a very stable relative placement (obviously with respect to the introduced criteria).
11. Conclusions
As previously stated, the reconciliation of social, environmental and financial requirements places decision-makers in front of scenarios that are often complex, articulated or even conflicting. Multicriteria analysis techniques can support decision-makers in making aware and rational choices.
In comparison with the analysis carried out by the same authors in a previous work [
29] where the rankings of the considered investments for supplying swimming pools in the south of Italy were completely opposite when a sustainable approach from an exclusively socio-environmental point of view or a merely financial approach were alternatively considered, the analysis presented in this paper characterizes the use of a multicriteria technique and a more articulated pattern of evaluation with regards to the considered set of weights.
Unlike the previously mentioned experiences, the new pattern of valuation combines the financial profile with the socio-environmental one in the versions SC’ and SC”, and this integration destabilizes the previously obtained rankings.
In fact, if the overall effects are considered, the investment in Sapri, which according to the first analysis conducted neglecting the financial criterion ranks four times out of six in the bottom position, rises to a top position three times out of six when the financial criterion is taken into consideration. The investment in Nocera, which was the best one three times out of six, ranks in the bottom position four times out of six.
However, the main difference is recorded for the investment in Salerno. If only the criteria belonging to the social and environmental class are considered when calculating the synthetic index [
29], it ranks in an intermediate position, both attributing a greater importance to the socio- environmental aspects. In the new implementation, it has a better position in the rankings, whether the financial criterion is neglected or is taken into consideration.
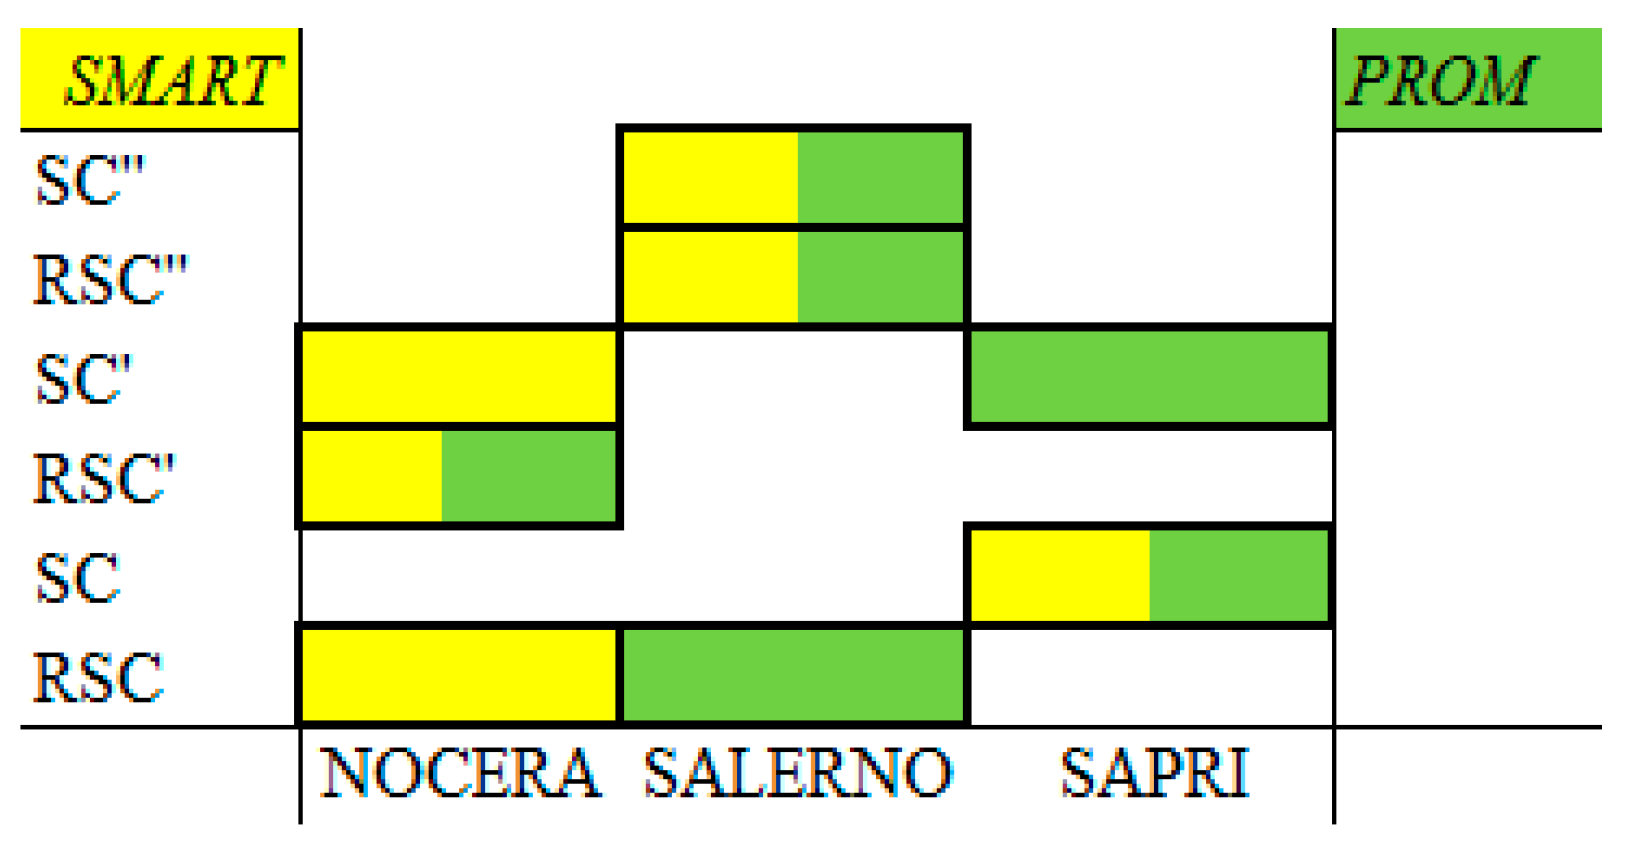
Figure 1 shows the prevailing projects according to the considered assessment procedures. Using SMART, the project in Nocera prevails three times over the others, while using PROMETHEE, the more balanced project in Salerno is preferred three times. This result confirms the less compensative effect of the used outranking method.
Figure 1.
Prevailing projects according to the considered aggregation methods
Figure 1.
Prevailing projects according to the considered aggregation methods
The present analysis, which deserves further investigation from the point of view of the stability of outcomes on the basis of statistical techniques, highlights the huge responsibility of decision-makers when choices are also based on social and environmental principles and not merely on monetary criteria, even if a multidimensional assessment is carried out. This consideration is confirmed by the strictness imposed by the European Commission on the management of public funds, but also poses limits that must be revised when funds are of a private nature, considering the levels of profitability that can be shared with the community.
Another interesting development of this work could be a comparison of the outcomes of the assessment methods used with those coming from the use of specific aggregation procedures able to include interaction effects among the criteria, such as the Choquet integral or the ELECTRE III method with interactions between the criteria [
69], in order to consider the different levels of strong and weak compensability.
Finally, it should be noted that the results of the implemented calculations seem to indicate that certain investment projects have performances on the criteria that make the rankings obtained robust through more or less compensatory aggregation procedures. This condition, where conveniently checked on a larger sample of study, leads to repudiation of the necessity of the adoption of a non-compensatory aggregation procedure in order to obtain a decision of strong sustainability. The adoption could instead simply hide manipulative intentions in the choices on the allocation of public resources.


