Article

The Dynamic Relationship between Growth and Profitability under Long-Term Recession: The Case of Korean Construction Companies

Department of Architectural Engineering, Hanynag University, 222, Wangsipri-ro, Sungdong-gu, Seoul 133-791, Korea
*
Author to whom correspondence should be addressed.
Sustainability 2015, 7(12), 15982-15998; https://doi.org/10.3390/su71215796
Submission received: 1 October 2015 / Revised: 15 November 2015 / Accepted: 24 November 2015 / Published: 2 December 2015
(This article belongs to the Special Issue Resilient Businesses: Assessment, Approaches and Technology)

Abstract

:
We conducted an empirical analysis of the dynamic relationship between growth and profitability for small- and medium-sized construction companies that faced long-term economic stagnation in Korea. The period of the analysis spanned 2000 to 2014, and the full period was divided into two halves: before the 2008 global financial crisis and after it. Our empirical model was based on the system generalized method of moments model, and 264 construction companies were used as the study sample. The results of the empirical analysis are as follows. (1) A profitability-driven management strategy limits company growth, thus prolonging the economic downturn; (2) When the macroeconomic environment is relatively stable, high growth in the previous period fosters profitability in the current period. This implies that the phenomenon of dynamic increasing returns is present in the Korean construction industry, and learning through growth enhances productivity and profitability. Consequentially, a strategy oriented towards short-term profitability (popular with small- and medium-sized Korean construction companies) makes the corporate management less resilient, causing them to select “de-growth” during the long-term stagnation by decreasing their scale of operations. Accordingly, it is important for companies to maintain the balance between growth and profitability.

Graphical Abstract

1. Introduction

Corporate executives generally face the dilemma between pursuing growth and profitability. If companies are obsessed with short-term profit-oriented performance, they will settle for past successes and thus be unable to respond to market conditions, thereby falling into a success trap. On the other hand, if they are devoted to innovation only in the long term, they will fall into a failure trap, jeopardizing corporate survival.
In this respect, corporate executives use a short-term profit-oriented management strategy rather than pursuing growth [1]. A profit-oriented management strategy can increase corporate resilience in a short-term recession. On the other hand, in a long-term recession, profitability is reduced due to the continued decline of market demand. Accordingly, executives attempt to reduce costs, sell assets, and downsize, ultimately reducing the firm size.
On the other hand, the growth-oriented corporate strategy focuses on innovation that can increase the growth potential in the long term. Such a strategy is known to have a positive effect not only on corporate profitability but also on the company’s survival in the long term. Although maintaining a high profit without growth is very difficult, growth is a crucial means for future value creation [2]. Additionally, the growth of the firm promotes the development and survival of not just the firm itself but also that of the national economy. Given the fact that the growth-oriented corporate strategy expands employment and income, it has become the main focus of policy-makers.
The 1997 Asian financial crisis caused the macroeconomic downturn in East Asia, which had an enormous impact on the construction industry of each country in that region. A number of construction companies faced a liquidity crisis and bankruptcy [3]. Prior to the 1997 Asian financial crisis, Korean construction companies focused on quantitative growth through debt and had grown exponentially. However, after the 1997 crisis, the relatively low profitability became a problem despite the so-called rapid growth. Consequentially, many construction companies went bankrupt on account of external growth-driven management, low profitability, and high debt-to-equity ratios. The then Korean government criticized the external growth strategy of the construction companies and implemented a system that artificially limited the debt-to-equity ratio to below 200%. As a result, external growth through debt was inhibited and helped the construction companies to recover from the macroeconomic shock. Thus, the financial crisis taught the Korean construction companies about the risk of external growth unaccompanied by profit, and to counteract the same, the companies started introducing a profit-oriented management strategy.
Ten years after the 1997 crisis, the global financial crisis of 2008, which was triggered in the United States, and the consecutive financial crises in European countries, put the market economy of each country in a serial and continuous recession [4]. Korea was no exception. Korean construction companies faced intense competition for winning a contract and/or lost money on account of the declined value of real assets, low consumer confidence, and the housing market downturn. They were exposed to a liquidity crisis resulting from reduced sales, falling margins, and depleting working capitals. Eventually, a number of companies faced bankruptcy [5]. The 2008 global financial crisis led to the collapse of large companies and a chain of bankruptcies among small- and medium-sized subcontractors [6]. The number of small- and medium-sized companies (i.e., companies with less than 300 people) comprise about 90% of the construction industry in Korea, while a mere handful of construction companies are large-scale companies (i.e., those that employ more than 300 employees). While large companies find it easier to survive in a long-term downturn, as they enjoy relatively high bargaining power, financing ability, and research and development (R&D) capability, their small- and medium-sized counterparts are vulnerable in all those respects. In other words, smaller companies respond more sensitively to economic fluctuations, and thus, are more likely to favor a profitability-oriented management strategy.
Consequently, the failure of Korean construction companies in today’s long-term economic downturn can be attributed to insufficient learning from the past experience of the 1997 Asian financial crisis. In other words, it can be likened to the success trap originating from the profitability-driven management strategy, which explains why construction companies are unable to cope with the long-term recession, as they tend to settle for present profits and avoid the uncertainty of growth. Companies that survived the crisis are experiencing extremely low growth or have chosen to “de-grow.” In such a situation, it is very difficult to make a normal investment for firm growth. This is a very important issue at the national level since it causes a downturn in the industry and reduces production as well as employment.
The construction industry typically responds very sensitively to the economic, demographic, and political environment [7]. Accordingly, for the long-term survival of a firm, growth through continuous innovation is very important. A profit-driven strategy in a relatively stable economic environment can help generate free cash flow and lower the probability of bankruptcy [8,9,10]. In addition, it can improve the growth potential of a company as investment activities, including the expansion of R&D and manufacturing facilities, foster high profitability. However, in a long-term macro-economic downturn, it is difficult to use a profitability-focused strategy as a means to improve business resilience. In such a context, the focus of the management strategy should switch from profitability to growth. However, the very poor level of R&D investment awareness among Korean construction companies is a considerable barrier (according to a report by the Ministry of Science, ICT & Future Planning (2013), the percentage of sales compared to the R&D cost is 0.95% for the construction industry; this ratio is lower than the overall industry average of 2.83% and is the lowest among industries). In the end, the relationship between profitability and growth can vary according to the economic environment the company faces, and the effects of growth determinants tend to differ. This implies that the management and growth pattern of a company may vary between relatively stable and unstable economic periods.
Thus, the present study aims to identify a mechanism of growth stagnation by examining the dynamic relationship between the growth and profitability of small- and medium-sized Korean construction companies in a long-term economic downturn. The effect of past profitability on current growth was empirically analyzed through the dynamic growth determination model, as was the effect of past growth on the current profitability. Additionally, changes in companies’ management patterns and growth determination patterns during a relatively stable economic time and during a long-term recession were identified by dividing the sample period into two halves: before and after the global financial crisis of 2008. The results of this study provide key implications for restoring growth in small- and medium-sized construction companies experiencing long-term recession in Korea.

2. Literature Review

2.1. Firm’s Growth

Theoretical studies on the dynamics of firm growth and profitability are based on the theory of the growth of the firm. This section reviews the previous literature on the theoretical and empirical approaches to the firm growth theory.
The firm growth theory is based on the U-shaped long-term cost function defined by Viner [11]. Fixed costs are reduced in accordance with an increased production scale, while average costs are reduced according to the U-shaped long-term cost function. Such a situation is referred to as “economies of scale” in economics. Economies of scale often originate with fixed costs, which are lowered per unit of production as design capacity increases. However, once the firm achieves a certain design capacity, it experiences a period of “unchangeable scale”, which increases in proportion to production depending on the increased scale. Moreover, when the firm’s size increases further, “diseconomies of scale” occur due to an increase in management costs (including communication costs) and bureaucratization; thus, the average cost increases accordingly. This cost curve suggests that a small-sized firm has more opportunities for growth, whereas a large-sized firm is associated with a lower possibility for growth due to diseconomies of scale.
The above theoretical approach was refuted by Gibrat [12]. According to Gibrat’s law of proportionate effect (LPE), the firm growth rate and firm size are independent of each other, the reason being that changes in the market demand and uncertain external factors have the same effect on the growth of all companies. Some researchers supported the LPE hypothesis [13,14]. Later, Mansfield [15], however, refuted the LPE hypothesis by arguing that there is a negative relationship between firm size and growth rate, using an empirical study based on companies in the U.S. His results can be attributed to smaller-sized companies pursuing fast growth to achieve the efficiency enjoyed by larger companies in the early phase.
In addition to the aforementioned studies on firm size, Jovanovic [16] argued that growth and survival rate may vary by firm size and history. Based on the profit maximization problem, he analyzed firm survival using the learning model. He concluded that growth decreases in accordance with the decreased learning efficiency after the firm’s entry into the market and argued that negative relationships exist among firm size, age, and growth. Later, Evans [17] conducted a comprehensive empirical analysis combining firm size and age into one model, and he reported that firm size and age are negatively related with growth, thus rejecting the LPE hypothesis.
Some argue that in addition to firm size and age, financial constraints can inhibit the growth of a company. Financial constraints are based on the pecking order theory proposed by Myers and Majluf [18]. This theory refers to the company’s preferences for internal financing, relatively lower costs, and external financing. Generally, small- and medium-sized companies have greater financial constraints compared to large companies because of the information imbalance that exists between the companies and financial institutions. Accordingly, they have limited external financing despite their growth potential [19]. Consequently, financial constraints have a negative effect on the growth of a company. Lang et al. [20] and Oliveira and Fortunato [21] conducted representative empirical studies in this regard. Lang et al. [20] conducted an empirical analysis on the relationship between financial constraints (cash flow), debt-to-equity ratio, and firm growth, focusing on manufacturing companies in the U.S. The result of the empirical analysis revealed that cash flow has a positive effect on growth while debt-to-equity ratio has a negative effect. Oliveira and Fortunato [21] also found that cash flow and growth are positively related with each other, and this effect is stronger for small- and medium-sized companies that have relatively large liquidity constraints. Meanwhile, Khurana et al. [22] concluded that the effect of financial constraints varies by the level of country-specific financial market development. They claimed that companies’ financial constraints increased in accordance with the rise in external financing costs, reflecting market imperfection and the lack of investor protection.
Empirical studies on firm innovation and firm growth continue to be conducted. However, the derived results on the relationship between innovation and growth are contradictory. This problem can be attributed to the quantitative measurement of the qualitative variables of innovation and the inherent uncertainty of innovation [23]. Common sense dictates that corporate R&D should have a positive effect on firm growth. Several representative empirical studies, such as those conducted by Roper [24] and Freel [25], have found R&D investment to have a positive effect on firm growth. On the other hand, other empirical studies show that R&D investment has a negative effect on firm growth [26,27]. Coad and Rao [23] found a negative relationship between R&D investment and firm growth for a group of relatively large companies. However, they found no relationship for average-sized firms. Furthermore, although innovation has a positive effect on the sales growth rate, it may have either a positive or a negative effect on the growth rate of employment [28]. Studies on the effects of productivity on firm growth, in general, do not show a significant relationship [26,29,30].
Empirical studies that target a variety of countries and industries have been rejecting the LPE hypothesis, and there are arguments that firm growth is determined by individual characteristic factors (e.g., firm size, age, performance, productivity, industrial sector-specific elements, and macroeconomic elements) rather than the stochastic process [31].
The above-mentioned factors are used as the key determinants of firm growth. Determinants relating to firm size, age, financial constraints, leverage, and innovation are usually used to explain firm growth. The present study focuses on the dynamic relationship between firm growth and profitability rather than an empirical analysis of the determinants for firm growth. Accordingly, by adding the above-mentioned determinants to the empirical model, we can draw more robust empirical results. The interpretation of the empirical results is accomplished alongside the testing of hypotheses concerning the relationship between firm growth and profitability.

2.2. Relationship between Firm Growth and Profitability and Our Hypotheses

This section presents a review of the theoretical and empirical studies on the relationship between firm growth and profitability. We also explain the expected signs of this relationship.
First, according to evolutionary economists, companies make an investment based on their current financial performance rather than the present value of the expected future profits at an infinite time, as they cannot accurately determine expected future profits. Some companies gain a competitive advantage and high profitability by reducing production costs or by practicing efficient business processes. On the other hand, companies that do neither, lose market share and are eliminated [32]. In other words, resources are redistributed, through selection pressure, among companies that have a high profitability, and companies performing poorly perish. According to this theory, current corporate performance can be regarded as a source for future growth [33].
On the other hand, there is the argument, from the resource-based perspective, that firm growth does not increase future profitability. Penrose [34] claimed that firm growth is achieved not because of the characteristics of the company itself, but because of the “economy of growth” inherent in the company’s growth process. Although “economy of growth” temporarily provides companies with an incentive to grow, companies that have grown rapidly are burdened with high operating costs compared to those that grow slowly. In this respect, Penrose argued that an inverse relationship exists between current firm growth and future profitability [35].
Moreover, an argument similar to that of Penrose arose in the form of the managerial theory proposed by Marris [36]. According to Marris, utility maximization by corporate executives maximizes the company’s growth rate under the condition that satisfies a certain level of profit. There is a quadratic relationship between firm profitability and the rate of increase in firm size. Since the expansion of firm size and rising profits contradict each other, corporate executives select a preferred position with regard to size expansion (reduction) and lowered (increased) profits. Meanwhile, Marris assumed that firm growth is achieved exclusively through product diversification, and the related empirical analysis indicated that product diversification that is not relevant to the core product of the company reduces its profitability. Consequently, increasing the firm size can decrease its profitability.
Empirical studies on the dynamic relationship between growth and profitability have been based on Mueller [37], which in turn is founded on the Structure, Conduct, and Performance (SCP) paradigm focusing on corporate growth theory and corporate performance. First, according to the SCP paradigm, new candidates will be tempted to enter the industry when existing corporates within the same industry produce excessive profits. Accordingly, competition within the industry progressively increases and the profit of the existing corporates gradually decreases. That is, if there is no entry barrier, new candidates will continue to flood the industry until no corporate makes a sufficient profit, and when all corporates eventually face equal competition, the number of entrants will decrease [38]. It also means that if such an adjustment process occurs slowly, a certain corporate will continue to maintain excess profits. Consequently, the inefficiency in resource distribution within the industry will continue. With this perspective, Mueller [37], in his empirical analysis, suggested that the firm’s profitability can converge to a certain level because of market competition. Mueller argued that market entry and exit are completely free, and accordingly, any excess profit will rapidly disappear and converge to a long-term average.
If several firms suppress imitation from competing firms and establish entry barriers by taking advantage of their respective rare tangible and intangible resources and capabilities, they will generate excess returns and the difference from the average yield could be sustained indefinitely. Note that, from the perspective of resource-based theory, a resource is defined as useable tangible and intangible assets at the firm’s disposal, which may be used to devise and execute strategies. Capability is defined as tangible and intangible assets that allow maximum utilization of resources even though it cannot be used as an independent strategy. A corporate’s resources and capabilities are grossly divided into financial resources, non-financial resources, human resources, and organizational resources [39]. Valuable and rare resources become the driving force for innovating corporate strategy. The corporation that has such resources can devise strategies that competing firms can neither recognize nor pursue (as the latter lack these resources). Notably, the competing firms have to accept cost disadvantages to acquire the resources mentioned above. Lippman and Rumelt [40] called such resources “imperfectly imitable resources”. Here, persistent excess profits (Persistence of Profits, POP) could act as a driver of business growth from the viewpoint of evolutionary economics, as mentioned above. In the meantime, researchers sharing a viewpoint similar to that of POP have discussed how efficiency may be sustained at the corporate level. Johnes and Johnes [41] relied on the resource-based theory and asserted that while the firm’s efficiency can be sustainable, it can be affected by imperfect imitations.
Goddard et al. [42] were the first to conduct empirical research on the dynamic relationship between firm’s growth and profitability. They conducted a thorough review of empirical studies on corporate growth and those related to POP. Applying the panel data of banks in five European countries to dynamic growth determination models, their research analyzed the relationships between the growth rates of bank sizes and profit rates. Each model captures the effect of the previous period’s profitability on current growth and the effect of the previous period’s growth on current profitability. The results of the empirical analysis proved that the current profit rate acts as a positive factor for the growth rate of a given corporate size in the next period, and the current growth rate for a given corporate size has a statistically significant negative effect on the profit rate in the next period. Accordingly, they concluded that the Penrose effect exists in the banking industry.
Coad [31] conducted an empirical analysis on the relationship between growth rate and profitability based on a panel data of manufacturing companies in France. He claimed that although the effect of current profitability on the growth rate of firm size in the next quarter was statistically significant, its effect is small enough to convey that they are independent of each other. On the contrary, he argued that current growth rate has a positive effect on the next quarter’s profit rate. This results from the phenomenon of dynamic increasing returns, which occurs through a kind of learning, in contrast to the aforementioned Penrose effect. The phenomenon of dynamic increasing returns means that production costs are reduced in accordance with the individual company’s product enhancement or improved production technology through experience. Thus, successful companies gain more profits and prosper, leaving behind the rest of the companies [43].
Coad et al. [30] performed an empirical analysis on the relationship among employment growth, sales growth, and profit growth, and growth rate of labor productivity, based on a panel data of manufacturing companies in Italy. They found no relationship between growth in profits and future firm growth; on the contrary, current employment growth was found to increase future growth in sales and profits. Moreover, growth in sales was found to have a very close relationship with future growth in profits. In general, there was a weak Penrose effect and a strong Kaldor–Verdoorn effect of dynamic increasing returns.
In an empirical analysis using the panel data of publicly traded manufacturing companies in Japan, Nakano and Kim [44] drew a result similar to that of Goddard et al. [42]. In other words, they identified the Penrose effect, which means that the current rate of returns acts as a positive factor for the future growth rate of firm size, while the current growth rate of firm size has a negative effect on future rate of returns.
Jang and Park [45] conducted an empirical study on the relationship between growth and profitability using a panel data of restaurants. Their findings showed that past profitability of restaurants has a positive effect on current growth, and past growth has a negative effect on the growth rate. This implies that although profits generate growth in the restaurant industry, growth inhibits profitability. Consequently, Jang and Park argued that it is important for restaurateurs to maintain an appropriate level of profits since profits can lead to growth.
Lee [46] conducted an empirical study on the relationship between growth and profitability using a panel data of companies spanning various industries in Korea. They found that past firm profitability has a negative effect on current growth, and past growth has a positive effect on future profitability. The salient finding of this study is that the institutional environment of a country may indirectly affect firm growth and profitability.
Table 1 illustrates a summary of the results of the above-mentioned empirical analyses. First, the relationship between firm growth and profitability varies by country and industry, and there is no generalized trend. Additionally, previous empirical studies usually applied an estimation method called the system generalized method of moments (GMM) to the traditional model to determine firm growth.
Table 1. Previous studies on the relationship between firm growth and profitability.
CategorySample Variable Effect of
CountryIndustryPeriodNGrowthProfitEstimation MethodsProfit on GrowthGrowth on Profit
Goddard et al. [42]UK, France, Germany, Italy, Spain, Bank1992–1998583Log growth of total assetsReturn on equityOLS, GMM (VAR)+0
Coad [31]FranceManufacturing1996–20048405Log growth of sales and employeesOperating surplus/Value addedOLS, Fixed Effect, SYSTEM-GMM0+
Coad et al. [30]ItalyManufacturing1989–199722,000Log growth of sales, employeeGross Operating SurplusOLS, LAD (VAR)0+
Nakano and Kim [44]JapanManufacturing1987–20071633Log growth of assetsReturn on assetsSystem-GMM+-
Jang and Park [45]USRestaurant1978–2007100Growth rate of SalesReturn on SalesSYSTEM-GMM (VAR)+-
Lee [46]South KoreaVarious1999–2008606Growth rate of industry-adjusted sales growth and employeeIndustry-adjusted ratio of net income to salesFixed Effect, GMM, LAD (GMM)-+
The above table was revised/supplemented after it was extracted from the paper by Lee [46]. OLS refer to ordinary least squares. LAD refers to least absolute deviation. 0 refers to insignificant (or very weak) effects, which may be either positive or negative.
As mentioned in Section 1, construction companies in Korea focus solely on the profitability-driven management strategy rather than growth. This implies an environment in which past profitability inhibits current growth, thus providing the basis for the formation of a negative relationship. On the other hand, past growth has a positive effect on current profits, based on the effect of dynamic increasing returns. In other words, growing companies will have accumulated experience of implementing construction projects and increasing productivity, and the gap in competitiveness between companies will thus result in increased profitability. Accordingly, the hypotheses of this study are as follows:
-
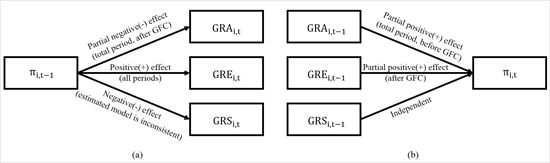
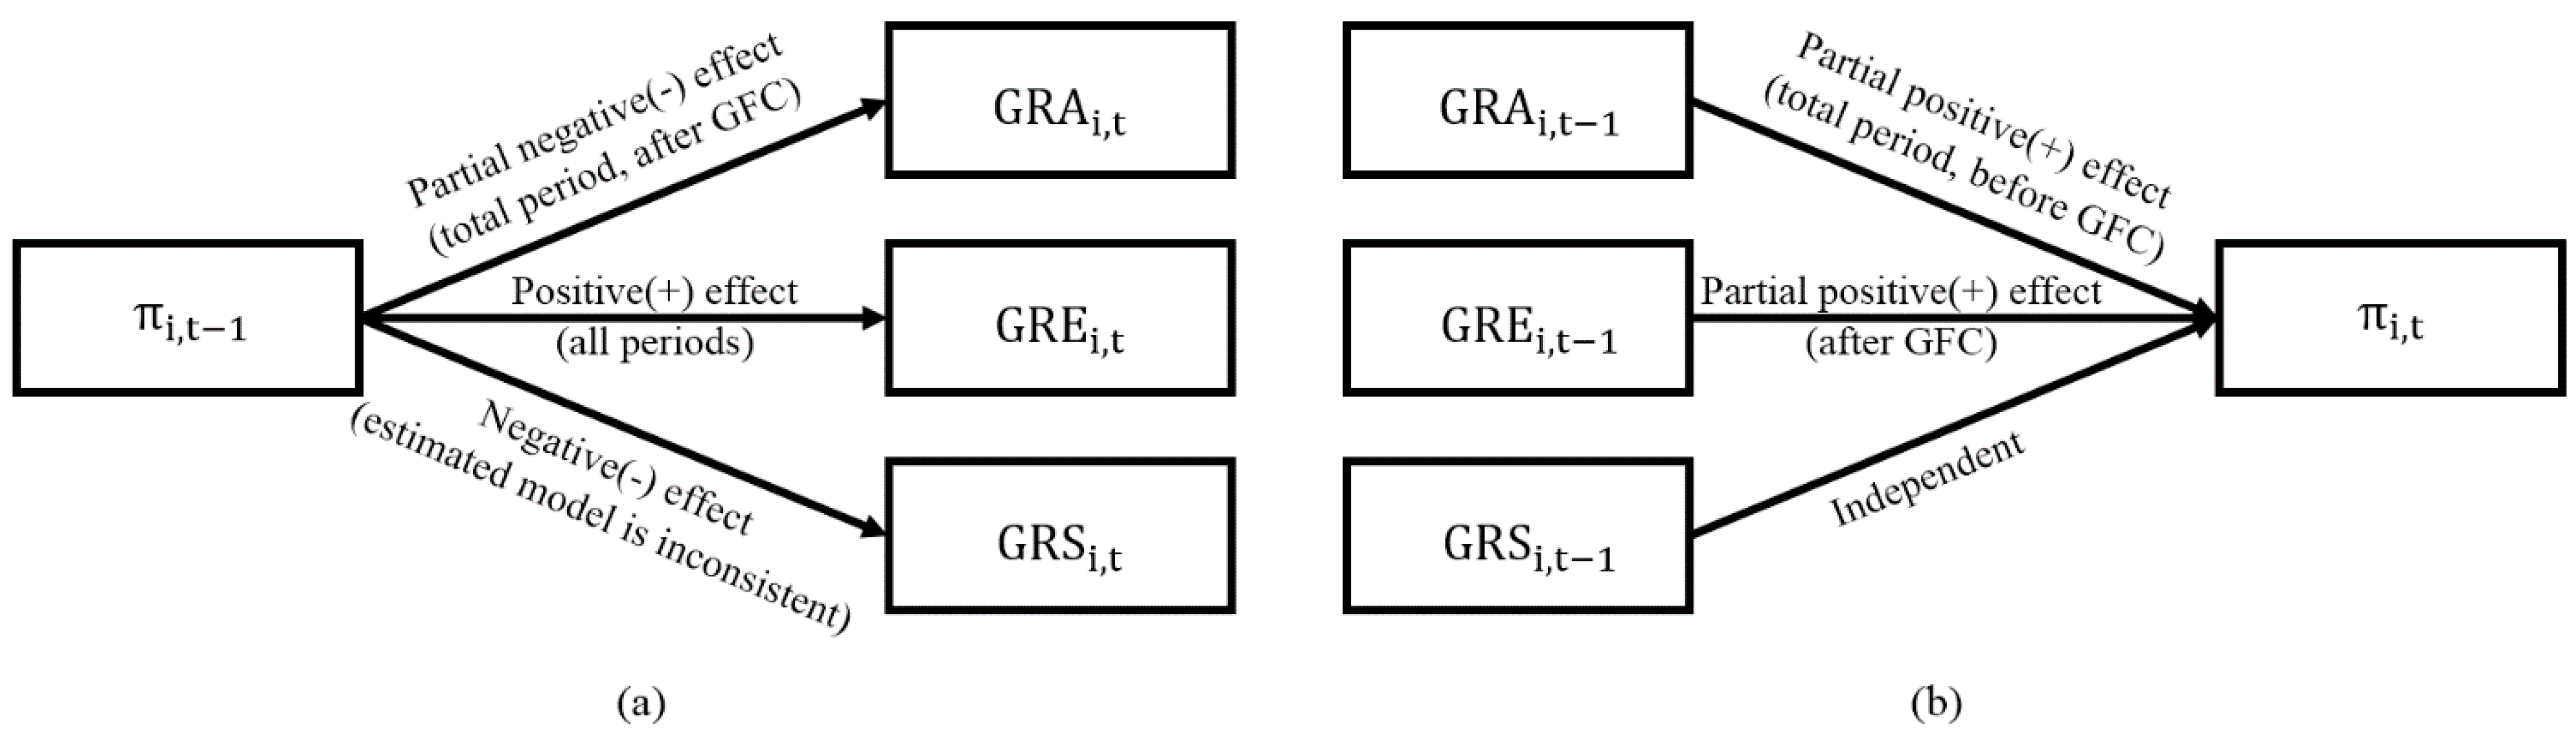
Hypothesis 1: Past profitability of small- and medium-sized Korean construction companies will have a negative effect on current growth.
-
Hypothesis 2: Past growth of small- and medium-sized Korean construction companies will have a positive effect on current profitability.
The hypotheses were verified against the results of the empirical analysis conducted in this study. Additionally, we identified whether firm growth and profitability continued as before or whether there were changes in the patterns of growth determinants before and after the global financial crisis in 2008.

3. Data and Variables

3.1. Data

The construction contractors identified by the Korean Standard Industry Classification were selected as the research subjects in this study. Companies that meet the following conditions were selected as data samples: (1) companies subject to external audit by a government agency; (2) small- and medium-sized companies with less than 300 employees; (3) companies that have been filing financial statements for the last 15 years (T) (from 2000 to 2014); (4) companies that did not experience impairment of capital (“impairment of capital” means that the total capital of the company is in a zero or negative state; companies in such a state will face disadvantages in bidding qualification evaluations for public or private construction projects, and they will ultimately be judged as incapable of implementing consecutive construction project orders smoothly and generating related sales) and change in business type from 2000 to 2014; and (5) companies for which all information required for the calculation of growth determinants is present. The total number of companies that met all the above conditions (N) is 263. The number of small-sized companies (with less than 50 employees) is 119, and the number of medium-sized companies (with more than 50 but less than 300 employees) is 112. Consequently, these small- and medium-sized companies survived continuously from 2000 to 2014, and a total of 3945 observed values constituted the panel data. The above data were divided into three periods: the total period (2000–2014), the period prior to the 2008 global financial crisis (2000 to 2007), and the period after the 2008 global financial crisis (2008 to 2014). Financial data for the study sample were extracted using the Korea Investors Service’s KISVALUE program and the Korea Listed Companies Association’s TS2000 program.

3.2. Variables

This section describes the dependent and independent variables drawn from a review of previous studies. The variables used herein are the key elements of this study and represent firm growth and profitability.
First, according to the survey by Sutton [47], the indicators used to calculate the growth potential of a company typically include total assets, employment, and sales. The growth variable tends to be selectively used by researchers depending on their purpose of analysis. Particularly, studies on the early phases of firm growth and firm profitability used total assets growth rate and sales growth rate as proxy variables for growth [48,49]. These variables can identify firm growth from a financial perspective, while total assets and sales respond sensitively to economic fluctuations [21]. Although these variables are relatively less affected by economic fluctuations should employment growth occur, they show limitations in capturing financial growth. Consequently, this study used the growth rate of total assets (GRA), growth rate of employment (GRE), and growth rate of sales (GRS) in order to comprehensively consider the linkage between the financial issues related to firm growth and employment. Equations (1)–(3) depict the manner of calculation for each growth variable. Each growth variable was also used as a control variable to construct a model for determining growth, thus representing the continuity of growth. The past value of the variable is used as an independent variable. More details can be found in Section 4.
GRA i ,   t = Ln ( Total Assets i , t ) Ln ( Total Assets i , t 1 )
GRE i ,   t = Ln ( Employees i , t ) Ln ( Employees i , t 1 )
GRS i ,   t = Ln ( Total Sales i , t ) Ln ( Total Sales i , t 1 )
where i and t represent the company and time, respectively.
According to our review of the literature, corporate profitability can be measured by various methods (return on sales (ROS), return on equity (ROE), and return on assets (ROA)). The present study measures it in terms of return on assets ( π i , t ), the reason being that it fits the characteristics of the construction industry and its management. First, compared to other industries, the construction industry’s product is characterized by its large size, long production period, and high risk due to uncertainties (climatic influences, natural disasters, and others) [7,50,51]. In addition, individual construction projects are highly dependent on external financing because of very high intermediate input costs for fundamental activities, such as acquiring land (small- and medium-sized construction companies that have relatively low accessibility to capital markets have higher debt dependency). Short-term debts are used to supply the working capital needed for operations over the long production period, and payments are received from the client depending on the progress of the construction project. Corporates running multiple construction projects simultaneously may undergo a liquidity crisis due to lack of cash flow, and they may resort to securing short-term debts to resolve such situations [5,52]. While ROA has the advantage of being able to discern how efficiently assets were managed to create profits, ROE and ROS cannot capture the overall perspective of corporate profitability.
Among the control variables of the model used for determining growth, firm size was measured by natural log-substituted total assets, number of employees, and sales. Firm age was calculated depending on the founding year and the number of years of measured data. Cash flow ratio, often used in previous studies, was used to measure the degree of a company’s financial constraints. A high value indicated relatively smooth internal financing with low financial constraints. In the present study, in addition to the financing constraints, the debt ratio of South Korean construction corporates was utilized to detect external growth funded by excessive debts. In general, construction companies receive payment after obtaining a work order for a project from a client and completing specific project milestones, or they utilize a funding pattern such as project financing. Self-owned projects with high profitability typically invest their own capital. Otherwise, the company generally borrows capital. Previous studies used R&D investment efficiency (R&D costs/sales) or the number of patents as a measure of firm innovation. However, as mentioned in Section 1, Korean construction companies make very small investments in R&D, and none of the companies in our sample invested in R&D in all periods. Accordingly, the variable was replaced by sales per employee and the ratio of sales cost to represent labor efficiency and cost competitiveness, respectively. The equations used to calculate the variables used in this study and the descriptive statistics are shown in Table 2. We referred to the companies’ financial statements, and the financing variables used to construct the empirical models were recorded in nominal currency units. We converted the financing variables using the GDP deflator (2010 = 100%) to eliminate any nominal increase due to an increase in prices.
Table 2. Descriptive statistics (sample period: 2000 to 2014).
VariableCalculationMeanStandard DeviationMinimumMaximum
GRA i ,   t = Ln ( Total Assets i , t ) Ln ( Total Assets i , t 1 ) 0.0980.258−0.7280.888
GRE i ,   t = Ln ( Employees i , t ) Ln ( Employees i , t 1 ) 0.0090.258−0.9340.886
GRS i ,   t = Ln ( Total Sales i , t ) Ln ( Total Sales i , t 1 ) 0.0660.545−1.7701.780
π i ,   t = Net Income i , t / Total Assets i , t × 100 3.9739.867−57.97125.682
SA i ,   t = Ln ( Total Assets i , t ) 24.1061.11821.67727.716
SE i ,   t = Ln ( Employees i , t ) 3.8600.8341.6097.286
SS i ,   t = Ln ( Total Sales i , t ) 24.0731.19720.10227.646
Age i ,   t = C u r r e n t   Y e a r E s t a b l i s h m e n t   Y e a r 22.42611.9911.00070.000
CASH i ,   t = ( Cash Flow form Operating Activities i , t + Cash Flow form Investing Activities i , t ) /   Total Assets i , t × 100 0.44816.921−48.05061.302
LEVER i ,   t = Total Liabilities i , t / Total Assets i , t × 100 44.34123.6756.415133.833
EFF i ,   t = Ln ( Total Sales i , t / Employees i , t ) 20.2120.83317.67122.453
COST i ,   t = Total Cost i , t / Total Sales i , t × 100 80.61812.26039.839119.538

4. Empirical Analysis

The aim of this study is to identify the dynamic relationship between firm profitability and growth. Accordingly, we used an empirical method devised by Goddard et al. [42], which has been frequently used in the literature. The empirical model is divided into two basic models. The first model identifies the relationship between past profitability and current growth. The second model establishes the relationship between past growth and current profitability. These basic models are categorized in three ways according to the dependent variables (GRA, GRE, and GRS). Our depiction of the analyses periods (total period, period before the 2008 global financial crisis, and period after the 2008 global financial crisis) provides a total of 18 empirical models. The basic model that identifies the relationship between past profitability and current growth is shown in Equation (4).
GR i ,   t = α 1 ,   i + β 1 , 1 GR i ,   t 1 + β 1 , 2 π i ,   t 1 + j = 1 3 β 1 , j χ i , t 1 + k = 1 2 β 1 , k ο i , t + D t + ϵ i , t
GR i ,   t is a variable of current corporate growth (GRA, GRE, and GRS), GR i ,   t 1 is the past firm growth rate, π i ,   t 1 denotes past return on assets, χ i , t 1 represents past control variables (age, cash flow ratio, and debt-to-asset ratio), and ο i , t represents the current control variables of companies (sales per employee and ratio of sales cost). D t is the year dummy variable that controls time effects, α 1 ,   i is an error term that represents the firm characteristics that do not vary with time, ϵ i , t is a pure error term that changes by time and company, β 1 , 1 is the regression coefficient indicating the persistence of growth, β 1 , 2 is the regression coefficient indicating the effect of past profitability on current growth rate, and β 1 , j and β 1 , k are the regression coefficients of each control variable.
Equation (5) presents the basic model that identifies the relationship between past firm growth and current profitability.
π i ,   t = α 2 ,   i + β 21 π i ,   t 1 + β 2 , 2 GR i ,   t 1 + j = 1 3 β 2 , j χ i , t 1 + k = 1 2 β 2 , k ο i , t + d t + μ i , t
π i ,   t is the variable denoting company i’s returns on assets at point t , π i ,   t 1 refers to past returns on assets, G R i ,   t 1 denotes past firm growth rate (GRA, GRE, and GRS), χ i , t 1 refers to past control variables (age, cash flow ratio, and debt-to-asset ratio), and ο i , t denotes the current control variables of a company (sales per employee and ratio of sales cost). d t is the year dummy variable that controls time effects, α 2 ,   i is an error term that represents the firm characteristics that do not vary with time, and μ i , t is the pure error term that changes by time and company   β 2 , 1 is the regression coefficient indicating the persistence of growth, β 2 , 2 is the regression coefficient indicating the effect of past growth rate (GRA, GRE, and GRS) on current profitability, and β 2 , j and β 2 , k are the regression coefficients of each control variable.
We tested the hypotheses by identifying the signs of β 1 , 2 and β 2 , 2 in Equations (4) and (5), respectively. If the regression coefficient of past profitability ( β 1 , 2 ) is negative, Hypothesis 1 (namely that the past profitability of small- and medium-sized construction companies will have a negative effect on current growth) was adopted. If the regression coefficient value of past growth ( β 2 , 2 ) is positive, Hypothesis 2 (namely that the past growth of small- and medium-sized construction companies will have a positive effect on current profitability) was adopted. Either hypothesis was adopted fully if there was consistency in the classification of the dependent variables for a given analysis period. If not, either hypothesis was adopted partially.
An endogenous problem occurred in the dynamic panel model that used the past values of dependent variables ( G R i ,   t 1 in Equation (4) and π i ,   t 1 in Equation (5)) as explanatory variables. The problem was caused by a reciprocal relationship between the error term indicating firm characteristics that do not vary with time ( α 1 ,   i , α 2 ,   i ) and the variable explaining the disparities among the dependent variables. Accordingly, the result estimated by the ordinary least squares (OLS) method was biased, and the bias would not disappear even when the number of companies was increased. As a result, the OLS estimate had a discrepancy. In order to solve this problem, previous studies used the system GMM method. This method is a quantitative analysis technique, which was developed by Blundell and Bond [53]. It can provide appropriate additional conditions for identification by targeting the level equation of the dynamic panel model. Accordingly, the system GMM technique provides more efficient estimates than methods that only consider the level equation as identification conditions (i.e., the difference GMM method), as the former combines moment conditions for the model in first differences with moment conditions for the model in levels. To ensure that the system GMM estimate is consistent, we needed to verify the autocorrelation of the error term, as presented by Arellano and Bond [54] ( Δ ϵ i , t ,   Δ μ i , t in this study) and to check whether additional use of instrumental variables is appropriate. Regarding the test of autocorrelation of the error term, a first-order autocorrelation is referred to as the AR (1) test, and the second-order autocorrelation, the AR (2) test. We used the null hypothesis that there is no autocorrelation in each order. The null hypothesis of first-order autocorrelation should be dismissed, while that of second-order autocorrelation should be adopted. Furthermore, we verified whether the use of instrumental variables is appropriate using Hansen’s over-identifying restrictions test, which showed that over-identification is appropriate for the null hypotheses. The results of the AR (1), AR (2), and over-identifying restrictions tests were presented after estimating each empirical model.

5. Estimation Results

Prior to the empirical estimations, we analyzed the correlation among the variables added to each model. The correlation results are shown in Table 3. The results indicate that the correlation coefficients among the variables added to each model were less than 0.5, thus ruling out multi-collinearity issues.
Table 3. Results of the Correlation Analysis.
Category G R A i ,   t G R E i ,   t G R S i ,   t π i ,   t S A i ,   t 1 S E i ,   t 1 S S i ,   t 1 A g e i ,   t 1 C A S H i ,   t 1 L E V E R i ,   t 1 E F F i ,   t
GRA i ,   t 1
GRE i ,   t 0.243 a1
GRS i ,   t 0.332 a0.218 a1
π i ,   t 0.375 a0.186 a0.278 a1
SA i ,   t 1 −0.188 a−0.058 a−0.047 a−0.253 a1
SE i ,   t 1 −0.032 c−0.102 a−0.024−0.121 a0.738 a1
SS i ,   t 1 −0.083 a−0.021−0.171 a−0.109 a0.836 a0.850 a1
Age i ,   t 1 −0.181 a−0.084 a−0.078 a−0.226 a0.430 a0.420 a0.384 a1
CASH i ,   t 1 −0.044 a−0.007−0.131 a0.079 a−0.058 a−0.036 b0.0210.0241
LEVER i ,   t 1 −0.226 a−0.114 a0.014−0.265 a0.435 a0.117 a0.219 a0.024−0.085 a1
EFF i ,   t 0.030 c−0.122 a0.307 a0.090 a0.472 a0.153 a0.401 a0.083 a0.0030.293 a1
COST i ,   t −0.229 a−0.100 a−0.080 a−0.409 a0.192 a0.214 a0.277 a0.284 a−0.0120.044 b0.233 a
a, b, and c denote coefficient significance from zero at the 1%, 5%, and 10% levels, respectively. Size variables are used in each model. Correlation coefficients in bold are significant at the 5% level.
The results of the estimation of the dynamic growth model, which tests Hypothesis 1, appear in Table 4. Model 1-1 and Model 1-2, which refer to the growth rate of total assets and the employment growth rate, respectively, passed the AR (1), AR (2), and the over-identifying restrictions tests and were found to be consistent estimators. On the other hand, Model 1-3, which denotes the growth rate of sales, was an inconsistent estimator in groups pertaining to the total period and was excluded from the analysis. It failed the AR (2) test for the total sample period and the periods before and after the 2008 global financial crisis.
Table 4. Results of the dynamic panel growth model.
CategoryModel 1-1: π i ,   t 1 G R A i ,   t Model 1-2: π i ,   t 1 G R E i ,   t Model 1-3: π i ,   t 1 G R S i , t
TotalBeforeAfterTotalBeforeAfterTotalBeforeAfter
GRA i ,  t 1 0.064 b−0.0390.094 b
(0.032)(0.060)(0.040)
SA i ,  t 1 −0.063 a−0.086 a−0.060 a
(0.009)(0.015)(0.010)
GRE i ,  t 1 −0.060 a−0.073 b−0.066 b
(0.021)(0.034)(0.032)
SE i ,  t 1 −0.105 a−0.116 a−0.103 a
(0.013)(0.016)(0.014)
GRS i ,  t 1 −0.047 a−0.044c−0.026
(0.017)(0.025)(0.021)
SS i ,  t 1 −0.395 a−0.407 a−0.400 a
(0.023)(0.024)(0.024)
π i ,  t 1 −0.004 a−0.001−0.004 a0.003 a0.002 a0.003 a−0.008 a−0.011 a−0.007 a
(0.001)(0.002)(0.001)(0.001)(0.001)(0.001)(0.002)(0.003)(0.002)
Age i ,  t 1 −0.002 a−0.002 c−0.002 a0.0000.0000.0000.004 b0.005 a0.005 b
(0.001)(0.001)(0.001)(0.001)(0.001)(0.001)(0.002)(0.002)(0.002)
CASH i ,  t 1 0.001 b0.0000.001 b−0.0000.000−0.000−0.002 a−0.001−0.002 a
(0.000)(0.001)(0.000)(0.000)(0.000)(0.000)(0.000)(0.001)(0.001)
LEVER i ,  t 1 −0.004 a−0.003 a−0.005 a−0.0000.000−0.000−0.004 a−0.004 a−0.005 a
(0.000)(0.001)(0.001)(0.000)(0.001)(0.000)(0.001)(0.001)(0.001)
EFF i ,  t 0.087 a0.105 a0.078 a−0.052 a−0.067 a−0.042 a0.657 a0.655 a0.673 a
(0.011)(0.017)(0.013)(0.011)(0.016)(0.013)(0.032)(0.040)(0.032)
COST i ,  t −0.005 a−0.005 a−0.005 a0.0010.002 b0.0000.004 b0.009 a0.002
(0.001)(0.002)(0.001)(0.001)(0.001)(0.001)(0.002)(0.003)(0.002)
Constant0.481 c0.6250.587 c1.332 a1.671 a1.217 a−3.678 a−3.782 a−3.931 a
(0.247)(0.416)(0.301)(0.235)(0.344)(0.267)(0.601)(0.729)(0.646)
Year DummyYYYYYYYYY
n 299213791613299213791613299213791613
Wald χ 2 502.212 a149.459 a319.973 a166.183 a108.381 a106.325 a897.959 a654.560 a738.474 a
(d.f.)(18)(11)(13)(19)(12)(13)(18)(11)(13)
AR (1)−7.734 a−5.489 a−7.739 a−8.847 a−7.425 a−6.935 a−6.804 a−5.749 a−5.917 a
AR (2)−0.303−0.229−0.8570.4111.211−0.473−4.250 a−2.057 b−2.585 a
Hansen Test73.1927.26769.65281.33515.23873.03098.737 b10.60184.503 c
(d.f.)(76)(13)(67)(89)(19)(75)(76)(13)(67)
a, b, and c denote coefficient significance from zero at the 1%, 5%, and 10% levels, respectively. n refers to the number of observations. d.f. denotes degree of freedom. Regression coefficients in bold are significant at the 5% level. Values in parentheses are standard errors.
The results for Model 1-1 show that the past return of assets ( π i ,   t 1 ) has a significant negative effect on growth ( GRA i ,   t ) . The effect of the coefficient was greater in the period after the crisis, which can be interpreted as the stronger tendency of small- and medium-sized construction companies to focus on profitability in a long-term recession. It can also be interpreted as a defensive posture adopted by the construction companies. Such results are consistent with the findings of Lee [46]. Moreover, the variable indicating persistence of growth ( GRA i ,   t 1 ) had a significant positive effect in the total period and the period after the financial crisis, implying that companies that have grown in the past continue to grow. This indicates that companies with higher profitability are likely to grow in the long term (i.e., despite the recession). In Model 1-2, past returns on assets ( π i ,   t 1 ) was found to have a consistent and significant positive effect on the growth rate of employment ( GRE i ,   t ) during the total period. Thus, companies with higher profitability have a positive effect on employment. This result differs from the results of Model 1-1 but agrees with the findings of previous studies [42,44,45]. Furthermore, the variable indicating employment sustainability ( GRE i ,   t 1 ) was shown to have a negative effect in all periods, and thus, the growth rate of employment was found to be unsustainable. Consequently, although the past profitability of the small- and medium-sized construction companies reduces current external corporate growth, it increases employment. Despite the difference being very small, the effect of reducing external growth is slightly larger. Accordingly, the presented Hypothesis 1 can be partially adopted. Additionally, past firm size ( SA i ,   t 1 , SE i ,   t 1 ) had a consistent and significant negative effect on current growth. This result caused us to reject Gibrat’s LPE hypothesis, which states that firm size and growth are independent of each other, and thus, our findings in this regard are in agreement to those of existing research [15,16,17]. In other words, smaller companies tend to grow rapidly. Firm age ( Age i ,   t 1 ) was identified as having a consistent negative effect in Model 1-1 only (except for the period before the financial crisis). This result is in agreement with those of the existing studies and indicates that younger companies have a higher growth rate. In Model 1-1, the variable indicating financial constraints ( CASH i ,   t 1 ) had a significant positive effect in the total period and the period after the financial crisis. This implies that higher cash flow is associated with sustainable firm growth in long-term recessions although the size of the estimated coefficient is not large. In other words, resilient firm growth is related to financial constraints. Although the variable representing labor efficiency ( EFF i ,   t ) is significant in both Models 1-1 and 1-2, it has different signs (strongly positive in Model 1-1 and strongly negative in Model 1-2). Although higher past labor efficiency becomes a base for external growth, it decreases the employment growth rate. Thus, this result reflects the phenomenon of job loss due to improved firm productivity, which in turn, reflects the employment practice at the small- and medium-sized construction companies in Korea. The cost competitiveness variable ( COST i ,   t ) has a significant negative effect in Model 1-1, which is natural in that companies with lower cost competitiveness have a negative effect on growth. On the other hand, in Model 1-2, the same variable has a significant positive effect in the period before the crisis. This reflects a tendency to offset a shortfall due to relatively low cost competitiveness by adding personnel. However, additional research is needed in this regard.
The results of the model used to determine dynamic profits and test Hypothesis 2 are shown in Table 5. The estimated model passed the AR (1), AR (2), and over-identifying restrictions tests and was a consistent estimator.
Table 5. Results of the dynamic panel profitability model.
CategoryModel (2-1): G R A i ,   t 1 π i ,   t Model (2-2): G R E i ,   t 1 π i ,   t Model (2-3): G R A i ,   t 1 π i ,   t
TotalBeforeAfterTotalBeforeAfterTotalBeforeAfter
π i ,   t 1 0.0530.079c0.0520.082 b0.101 b0.0720.086 b0.118 b0.085c
(0.036)(0.043)(0.043)(0.038)(0.040)(0.045)(0.041)(0.052)(0.048)
GRA i ,   t 1 1.561 b1.980 a1.226
(0.662)(0.697)(0.997)
SA i ,   t 1 −2.868 a−2.817 a−2.974 a
(0.388)(0.434)(0.499)
GRE i ,   t 1 1.032 c0.1211.975 b
(0.552)(0.505)(0.897)
SE i ,   t 1 0.2460.3010.342
(0.329)(0.370)(0.410)
GRS i ,   t 1 0.1520.0720.146
(0.366)(0.424)(0.472)
SS i ,   t 1 −0.702 a−0.956 a−0.568 c
(0.260)(0.369)(0.328)
. Age i ,   t 1 0.0280.042c0.028−0.037−0.062 a−0.023−0.020−0.025−0.010
(0.021)(0.023)(0.029)(0.025)(0.023)(0.032)(0.025)(0.024)(0.033)
CASH i ,   t 1 0.0080.0070.0130.0060.0030.0070.0090.0020.011
(0.010)(0.010)(0.013)(0.010)(0.010)(0.014)(0.011)(0.010)(0.015)
LEVER i ,   t 1 −0.052 a−0.034 b−0.047 a−0.083 a−0.071 a−0.080 a−0.083 a−0.068 a−0.078 a
(0.016)(0.020)(0.018)(0.013)(0.016)(0.016)(0.015)(0.020)(0.017)
EFF i ,   t 5.344 a4.957 a5.515 a4.186 a3.580 a4.459 a4.532 a4.053 a4.622 a
(0.431)(0.496)(0.533)(0.371)(0.367)(0.482)(0.403)(0.421)(0.542)
COST i ,   t −0.402 a−0.380 a−0.380 a−0.375 a−0.319 a−0.396 a−0.372 a−0.319 a−0.369 a
(0.042)(0.064)(0.037)(0.042)(0.052)(0.039)(0.046)(0.063)(0.047)
Constant−1.7242.086−4.080−47.334 a−40.263 a−51.971 a−36.074 a−25.325 b−42.840 a
(8.795)(10.217)(11.553)(7.291)(7.534)(8.594)(8.516)(9.937)(10.746)
Year DummyYYYYYYYYY
n299213791613299213791613299213791613
Wald χ 2 490.062 a231.213 a327.011 a436.333 a298.772 a279.197 a427.555 a251.053 a281.078 a
(d.f.) (18)(11)(13)(19)(12)(13)(18)(11)(13)
AR (1)−5.397 a−2.588 a−4.935 a−5.636 a−3.318 a−4.989 a−5.363 a−2.568 a−4.889 a
AR (2)0.888−1.4331.6130.630−1.5701.742 c1.033−1.3541.770c
Hansen Test80.22321.42570.57687.22122.00574.79386.59021.49476.108
(d.f.) (88)(18)(75)(89)(19)(75)(88)(18)(75)
a, b, and c denote coefficient significance from zero at the 1%, 5%, and 10% levels, respectively. n refers to the number of observations. d.f. denotes the degree of freedom. Regression coefficients in bold are significant at the 5% level. Values in parentheses are standard errors.
We used the regression coefficients of the variables describing past firm growth ( GRA i ,   t 1 ,  GRE i ,   t 1 , GRS i ,   t 1 ) to test Hypothesis 2. First, past firm growth ( GRA i ,   t 1 ) has a significant positive effect on current profitability in the total period and the period before the crisis in Model 2-1. In addition, Model 2-2 also shows a significant positive relationship between past growth potential ( GRE i ,   t 1 ) during the period after the global financial crisis and current profitability. This empirical result, which is rarely found in previous studies, could be explained by the phenomenon of dynamic increasing returns. In other words, companies reduce production costs and improve productivity based on the experience gained through high growth. Thus, they increase the gap between themselves and their competitors and boost their profitability. This result can be also be interpreted in that when the economic situation is relatively stable, aggressive growth strategy has a positive effect on firm profitability. These results follow a concept contrary to the Penrose effect, which states that future profitability decreases with high operating costs resulting from rapid firm growth. These findings are in agreement with those of Coad [31] and Coad et al. [30], and the coefficients have the same sign as those in the study conducted by Lee [46].
The variable representing persistence of corporate profits ( π i ,   t 1 ) has a partial negative effect in Models 2-2 and 2-3. Particularly, during the period before the crisis, past profitability has a positive effect on current profitability. This implies that it is possible to sustain excessive corporate profits. Companies that have relatively high profitability are likely to have a differentiated strategy compared to other companies. Therefore, they continue with their tried and tested operations and rely on their exclusive market position to generate sustainable profits. On the other hand, in the period after the crisis, the regression coefficients of both Models 2-2 and 2-3 lost statistical significance. The difference in competitiveness among companies may have shrunk because of the reduced profitability caused by the economic downturn and the market’s transformation into an intensely competitive environment.
Past firm size and current profitability show a significant negative relationship in Models 2-1 and 2-3. This implies that larger firm size is associated with decreasing profitability. In Model 2-2, past firm age and current profitability have a negative effect only in the period before the financial crisis. Past financial constraints are found to be independent of current profitability. On the other hand, past leverage ratio has a strong negative effect in Models 2-1, 2-2, and 2-3. This indicates that the high past debt-to-equity ratio of a company increases financial costs and thus acts as an element inhibiting profitability. In addition, past labor efficiency has a strong positive effect in all models. This can be interpreted as a natural result in that increasing efficiency generates profits. Similarly, the cost competitiveness variable has a strong negative effect in all models.
Figure 1. (a) The relationship between past profitability and current growth and (b) the relationship between past growth and current profitability. GFC stands for global financial crisis. GRA, GRE, and GRS stand for growth rate of total assets, growth rate of employment, and growth rate of sales, respectively.
Sustainability 07 15796 g001
Comparing the results of the empirical analyses and the aforementioned hypotheses indicates that Hypothesis 1 can partially explain only the growth rate of total assets in the total period and the period after the financial crisis. Hypothesis 2 can partially explain the total asset growth rates of the total period and the period before the crisis, as well as the growth rate of the number of employees in the post-crisis period (see Figure 1 for a diagrammatic illustration of the results of the hypotheses testing).

6. Conclusions

The present study was conducted to verify that the negative effect of the profitability-driven management strategy of Korean construction companies reduces growth and resilience. We selected a total of 263 small- and medium-sized Korean construction companies as the sample for our empirical analysis and constructed a panel data set spanning 15 years (2000 to 2014). The key objective of the study was to identify a dynamic relationship between firm growth and profitability. Particularly, by using all the relevant growth variables (growth rate of total assets (GRA), growth rate of employment (GRE), and growth rate of sales (GRS)), our study extended the interpretation of firm growth from a merely financial perspective to employment. Moreover, it identified corporate behavioral patterns followed by the companies in a relatively stable period as well as during a long-term recession, which was classified by the period following the 2008 global financial crisis.
The results of our empirical analyses can be largely divided into two parts. First, Korean construction companies have been using a profit-oriented management strategy on account of repetitive macroeconomic shocks and institutional adjustments, thus inhibiting firm growth. This implies that the executives of small- and medium-sized construction companies settle for short-term profitability and have a strong tendency to avoid investing in growth. Such a management strategy can be effective in periods of short-term economic downturn. However, with a continuing recession, corporate survival is at stake, and it is difficult to expect sustained profitability. In order to overcome this, companies need to make a gradual change in the profitability-driven management paradigm. In particular, low or nil investment in R&D, which has become entrenched in the South Korean construction industry (particularly among SMEs), and passive investment by these companies are factors that reduce their growth potential. On the contrary, a long-term recession can be considered as an opportunity to improve corporate potential growth. Accordingly, the government should promote R&D by (1) developing generic policies that alleviate the cost burden associated with the activity and (2) taking initiatives targeting small- and medium-sized construction businesses whose access to and ability in R&D are relatively limited.
Second, past growth can lead to increased current profitability. This phenomenon is akin to dynamic increasing returns and is a concept contrary to the Penrose effect. The notion of dynamic increasing returns states that reduced production costs and improved productivity are based on the experience gained through rapid growth, which helps the company boost its profitability by increasing the gap between itself and its competitors. Moreover, an aggressive growth strategy can have a very positive effect on firm profitability when the economic situation is relatively stable. It is possible to inhibit administrative inefficiencies by diversifying the business beyond core business areas and increasing productivity and labor efficiency by allowing employees to experience a variety of projects. Consequently, it is desirable to follow both strategies depending on market conditions rather than adhering to the traditionally accepted path of achieving growth and profitability.

Author Contributions

Seungkyu Yoo designed the research project, collected the data, conducted the empirical analysis, and wrote the paper. Jaejun Kim coordinated the whole research project.

Conflicts of Interest

The authors declare no conflict of interest.

References

  1. Mass, N.J. The relative value of growth. Harv. Bus. Rev. 2005, 83, 102–112. [Google Scholar] [PubMed]
  2. Viguerie, P.; Smit, S.; Baghai, M. The Granularity of Growth: How to Identify the Sources of Growth and Drive Enduring Company Performance; John Wiley & Sons: Hoboken, NJ, USA, 2011. [Google Scholar]
  3. Ng, S.T.; Fan, R.Y.C.; Wong, J.M.W.; Chan, A.P.C.; Chiang, Y.H.; Lam, P.T.I.; Kumaraswamy, M. Coping with structural change in construction: Experiences gained from advanced economies. Construct. Manag. Econ. 2009, 27, 165–180. [Google Scholar] [CrossRef]
  4. Berkmen, P.; Gelos, G.; Rennhack, R.K.; Walsh, J.P. The global financial crisis: Explaining cross-country differences in the output impact. J. Int. Money Financ. 2012, 31, 42–59. [Google Scholar] [CrossRef]
  5. Choi, J.K.; Yoo, S.K.; Kim, J.H.; Kim, J.J. Capital structure determinants among construction companies in south korea: A quantile regression approach. J. Asian Archit. Build. Eng. 2014, 13, 93–100. [Google Scholar] [CrossRef]
  6. Jang, S.W.; Lee, S.H.; Kim, J.H.; Kim, J.J. Relationship between demand-supply in the housing market and unsold new housing stocks. J. Asian Archit. Build. Eng. 2010, 9, 387–394. [Google Scholar] [CrossRef]
  7. Kangari, R. Business failure in construction industry. J. Construct. Eng. Manag. 1988, 114, 172–190. [Google Scholar] [CrossRef]
  8. Altman, E.I. Financial ratios, discriminant analysis and the prediction of corporate bankruptcy. J. Financ. 1968, 23, 589–609. [Google Scholar] [CrossRef]
  9. Beaver, W.H. Financial ratios as predictors of failure. J. Account. Res. 1966, 4, 71–111. [Google Scholar] [CrossRef]
  10. Ohlson, J.A. Financial ratios and the probabilistic prediction of bankruptcy. J. Account. Res. 1980, 18, 109–131. [Google Scholar] [CrossRef]
  11. Viner, J. Cost Curves and Supply Curves. In Cost Curves and Supply Curves; Springer: Berlin, Germany, 1932; pp. 23–46. [Google Scholar]
  12. Gibrat, R. Les Inégalités Économiques; Librairie du Recueil Sirey: Paris, France, 1931. [Google Scholar]
  13. Hart, P.E.; Prais, S.J. The analysis of business concentration: A statistical approach. J. R. Stat. Soc. Ser. A 1956, 119, 150–191. [Google Scholar] [CrossRef]
  14. Simon, H.A.; Bonini, C.P. The size distribution of business firms. Am. Econ. Rev. 1958, 48, 607–617. [Google Scholar]
  15. Mansfield, E. Entry, gibrat’s law, innovation, and the growth of firms. Am. Econ. Rev. 1962, 52, 1023–1051. [Google Scholar]
  16. Jovanovic, B. Selection and the evolution of industry. Econometrica 1982, 50, 649–670. [Google Scholar] [CrossRef]
  17. Evans, D.S. The relationship between firm growth, size, and age: Estimates for 100 manufacturing industries. J. Ind. Econ. 1987, 35, 567–581. [Google Scholar] [CrossRef]
  18. Myers, S.C.; Majluf, N.S. Corporate financing and investment decisions when firms have information that investors do not have. J. Financ. Econ. 1984, 13, 187–221. [Google Scholar] [CrossRef]
  19. Fazzari, S.M.; Hubbard, R.G.; Petersen, B.C.; Blinder, A.S.; Poterba, J.M. Financing constraints and corporate investment. Brook. Pap. Econ. Act. 1988, 1988, 141–206. [Google Scholar] [CrossRef]
  20. Lang, L.; Ofek, E.; Stulz, R. Leverage, investment, and firm growth. J. Financ. Econ. 1996, 40, 3–29. [Google Scholar] [CrossRef]
  21. Oliveira, B.; Fortunato, A. Firm growth and liquidity constraints: A dynamic analysis. Small Bus. Econ. 2006, 27, 139–156. [Google Scholar] [CrossRef]
  22. Khurana, I.K.; Martin, X.; Pereira, R. Financial development and the cash flow sensitivity of cash. J. Financ. Quant. Anal. 2006, 41, 787–807. [Google Scholar] [CrossRef]
  23. Coad, A.; Rao, R. Innovation and firm growth in high-tech sectors: A quantile regression approach. Res. Policy 2008, 37, 633–648. [Google Scholar] [CrossRef]
  24. Roper, S. Product innovation and small business growth: A comparison of the strategies of German, UK, and irish companies. Small Bus. Econ. 1997, 9, 523–537. [Google Scholar] [CrossRef]
  25. Freel, M. Do small innovating firms outperform non-innovators? Small Bus. Econ. 2000, 14, 195–210. [Google Scholar] [CrossRef]
  26. Bottazzi, G.; Dosi, G.; Lippi, M.; Pammolli, F.; Riccaboni, M. Innovation and corporate growth in the evolution of the drug industry. Int. J. Ind. Organ. 2001, 19, 1161–1187. [Google Scholar] [CrossRef]
  27. Geroski, P.A.; Machin, S.J.; Walters, C.F. Corporate growth and profitability. J. Ind. Econ. 1997, 45, 171–189. [Google Scholar] [CrossRef]
  28. Robson, P.A.; Bennett, R. Sme growth: The relationship with business advice and external collaboration. Small Bus. Econ. 2000, 15, 193–208. [Google Scholar] [CrossRef]
  29. Baily, M.; Bartelsman, E.; Haltiwanger, J. Downsizing and productivity growth: Myth or reality? Small Bus. Econ. 1996, 8, 259–278. [Google Scholar] [CrossRef]
  30. Coad, A.; Rao, R.; Tamagni, F. Growth processes of italian manufacturing firms. Struct. Change Econ. Dyn. 2011, 22, 54–70. [Google Scholar] [CrossRef]
  31. Coad, A. Testing the principle of “growth of the fitter”: The relationship between profits and firm growth. Struct. Change Econ. Dyn. 2007, 18, 370–386. [Google Scholar] [CrossRef]
  32. Alchian, A.A. Uncertainty, evolution, and economic theory. J. Polit. Econ. 1950, 58, 211–221. [Google Scholar] [CrossRef]
  33. Coad, A. The Growth of Firms: A Survey of Theories and Empirical Evidence; Edward Elgar Publishing Limited: Northhampton, MA, USA, 2009. [Google Scholar]
  34. Penrose, E.T. The Theory of the Growth of the Firm; Oxford University Press: New York, NY, USA, 1995. [Google Scholar]
  35. Kor, Y.Y.; Mahoney, J.T. Edith penrose’s (1959) contributions to the resource-based view of strategic management. J. Manag. Stud. 2004, 41, 183–191. [Google Scholar] [CrossRef]
  36. Marris, R. The Economic Theory of Managerial Capitalism; Macmillan: London, UK, 1964; Volume 258. [Google Scholar]
  37. Mueller, D.C. The persistence of profits above the norm. Economica 1977, 44, 369–380. [Google Scholar] [CrossRef]
  38. Porter, M.E. How competitive forces shape strategy. Harv. Bus. Rev. 1979, 21, 137–145. [Google Scholar]
  39. Barney, J.B.; Hesterly, W.S. Strategic Management and Competitive Advantage: Concepts and Cases; Pearson Education International: Upper Saddle River, NJ, USA, 2008. [Google Scholar]
  40. Lippman, S.A.; Rumelt, R.P. Uncertain imitability: An analysis of interfirm differences in efficiency under competition. Bell J. Econ. 1982, 13, 418–438. [Google Scholar] [CrossRef]
  41. Johnes, G.; Johnes, J. The persistence of efficiency. Expert Syst. Appl. 2013, 40, 5661–5672. [Google Scholar] [CrossRef]
  42. Goddard, J.; Molyneux, P.; Wilson, J.O.S. Dynamics of growth and profitability in banking. J. Money Credit Bank. 2004, 36, 1069–1090. [Google Scholar] [CrossRef]
  43. Arthur, W.B. Increasing returns and the new world of business. Harv. Bus. Rev. 1996, 74, 100–109. [Google Scholar] [PubMed]
  44. Nakano, A.; Kim, D. Dynamics of growth and profitability: The case of japanese manufacturing firms. Glob. Econ. Rev. 2011, 40, 67–81. [Google Scholar] [CrossRef]
  45. Jang, S.; Park, K. Inter-relationship between firm growth and profitability. Int. J. Hosp. Manag. 2011, 30, 1027–1035. [Google Scholar] [CrossRef]
  46. Lee, S. The relationship between growth and profit: Evidence from firm-level panel data. Struct. Chang. Econ. Dyn. 2014, 28, 1–11. [Google Scholar] [CrossRef]
  47. Sutton, J. Gibrat’s legacy. J. Econ. Lit. 1997, 35, 40–59. [Google Scholar]
  48. Cowling, M. The growth—Profit nexus. Small Bus. Econ. 2004, 22, 1–9. [Google Scholar] [CrossRef]
  49. Goddard, J.; Wilson, J.; Blandon, P. Panel tests of gibrat’s law for japanese manufacturing. Int. J. Ind. Organ. 2002, 20, 415–433. [Google Scholar] [CrossRef]
  50. Edum-Fotwe, F.; Price, A.; Thorpe, A. A review of financial ratio tools for predicting contractor insolvency. Construct. Manag. Econ. 1996, 14, 189–198. [Google Scholar] [CrossRef]
  51. Kale, S.; Arditi, D. Age-dependent business failures in the us construction industry. Construct. Manag. Econ. 1999, 17, 493–503. [Google Scholar] [CrossRef]
  52. Mason, R.J.; Harris, F.C. Predicting company failure in the construction industry. ICE Proc. 1979, 66, 301–307. [Google Scholar]
  53. Blundell, R.; Bond, S. Gmm estimation with persistent panel data: An application to production functions. Econom. Rev. 2000, 19, 321–340. [Google Scholar] [CrossRef]
  54. Arellano, M.; Bond, S. Some tests of specification for panel data: Monte carlo evidence and an application to employment equations. Rev. Econ. Stud. 1991, 58, 277–297. [Google Scholar] [CrossRef]

