Article

Costs and Benefits in the Recovery of Historic Buildings: The Application of an Economic Model

by
Antonio Nesticò
*,†,
Maria Macchiaroli
and
Ornella Pipolo
Department of Civil Engineering, University of Salerno, Via Giovanni Paolo II, 132, 84084 Fisciano (SA), Italy
*
Author to whom correspondence should be addressed.
These authors contributed equally to this work.
Sustainability 2015, 7(11), 14661-14676; https://doi.org/10.3390/su71114661
Submission received: 4 August 2015 / Revised: 29 September 2015 / Accepted: 14 October 2015 / Published: 3 November 2015

Abstract

:
Until now, the policies on sustainability relating to regeneration interventions on historic buildings have dealt with the casing of the buildings in order to regulate and control the flow of air, light and energy from outside to inside and vice versa. However, recent technological developments in home comfort and energy savings highlight the efficiency of the plants and the proper management of the building-plant system, while respecting the criteria of integrated conservation and the multiple constraints that characterize historic buildings. This study proposes a methodological process that identifies the optimal steps from a technical and economical point of view, by providing a combination of traditional architectural conservation interventions with innovative technology systems. The calculation algorithms are developed with a specific software based on UNI TS 11300 regulations, which allows for the thermodynamic modelling of the structure. The preparation of the feasibility plan allows testing the cost-effectiveness of the work proposed, considering the environmental benefits resulting from the reduced CO2 emissions. The impact of the financial results of the evaluation is also analyzed. This protocol provides industry operators a useful instrument for selecting the least expensive initiatives among those compatible with the multiple constraints that affect the design choices.

1. Conservation and Sustainability in Historic Buildings

Since the Kyoto Protocol was signed with the intention of combating climate change and promoting an energy-efficient economy in 1997, the sustainability issue has influenced the construction world. Regarding energy efficiency in buildings, the European Union has issued regulations that are intended to create more detailed requirements and guidelines, often designed for new constructions rather than existing ones, promoting interventions that sometimes have a significant impact on the buildings. For buildings of historical and architectural interest, this is far removed from a conservation logic.
Restoration, recovery and conservative renewal have marginally dealt with energy efficiency in the protection of historic buildings, but not furthering the relationship between conservation and sustainability. By placing these two aspects in the system, not only is a lower consumption of energy required, but the use of appropriate materials and the knowledge of the building fabric and the peculiar characteristics of the building are also necessary [1]. In this perspective, sustainability means designing interventions that either reduce heat loss or improve energy efficiency; conservation means preventing any principles not related to the value from intervening in historical heritage [2,3,4,5,6,7]. This is followed by an orientation to improve rather than to adapt, satisfying the performance that the property in question is able to offer, rather than compromising its structure, while also involving the historic building in the process of energy improvement without setting the objective of arriving at meeting the standards considered as optimal for new buildings, but unattainable for old ones.
The question is to understand what level of performance historic buildings can reach, since it is difficult to model their thermodynamic behavior. While in the case of new designs, the technical and energy data of materials and technological systems are declared by the producers, for existing buildings, these data are not known. Generally, we either resort to the help of tables and schedules or refer to calculations based on the stratigraphy of the components that provide approximate data and are poorly effective when compared to the variety of real cases [8]. This requires not only the knowledge of the built heritage and traditional construction techniques, but also the recognition of historic architecture as a complex system having not only performance, but also values and relationships with the context in which it is inserted and, especially, with respect to its use.
The issue of energy savings, therefore, interfaces not only with sustainable development principles, for which the economical use of resources is essential, but also with the concept of maintenance and preventive conservation, which involves the recognition of heritage as a non-renewable resource and requires more user involvement [9].

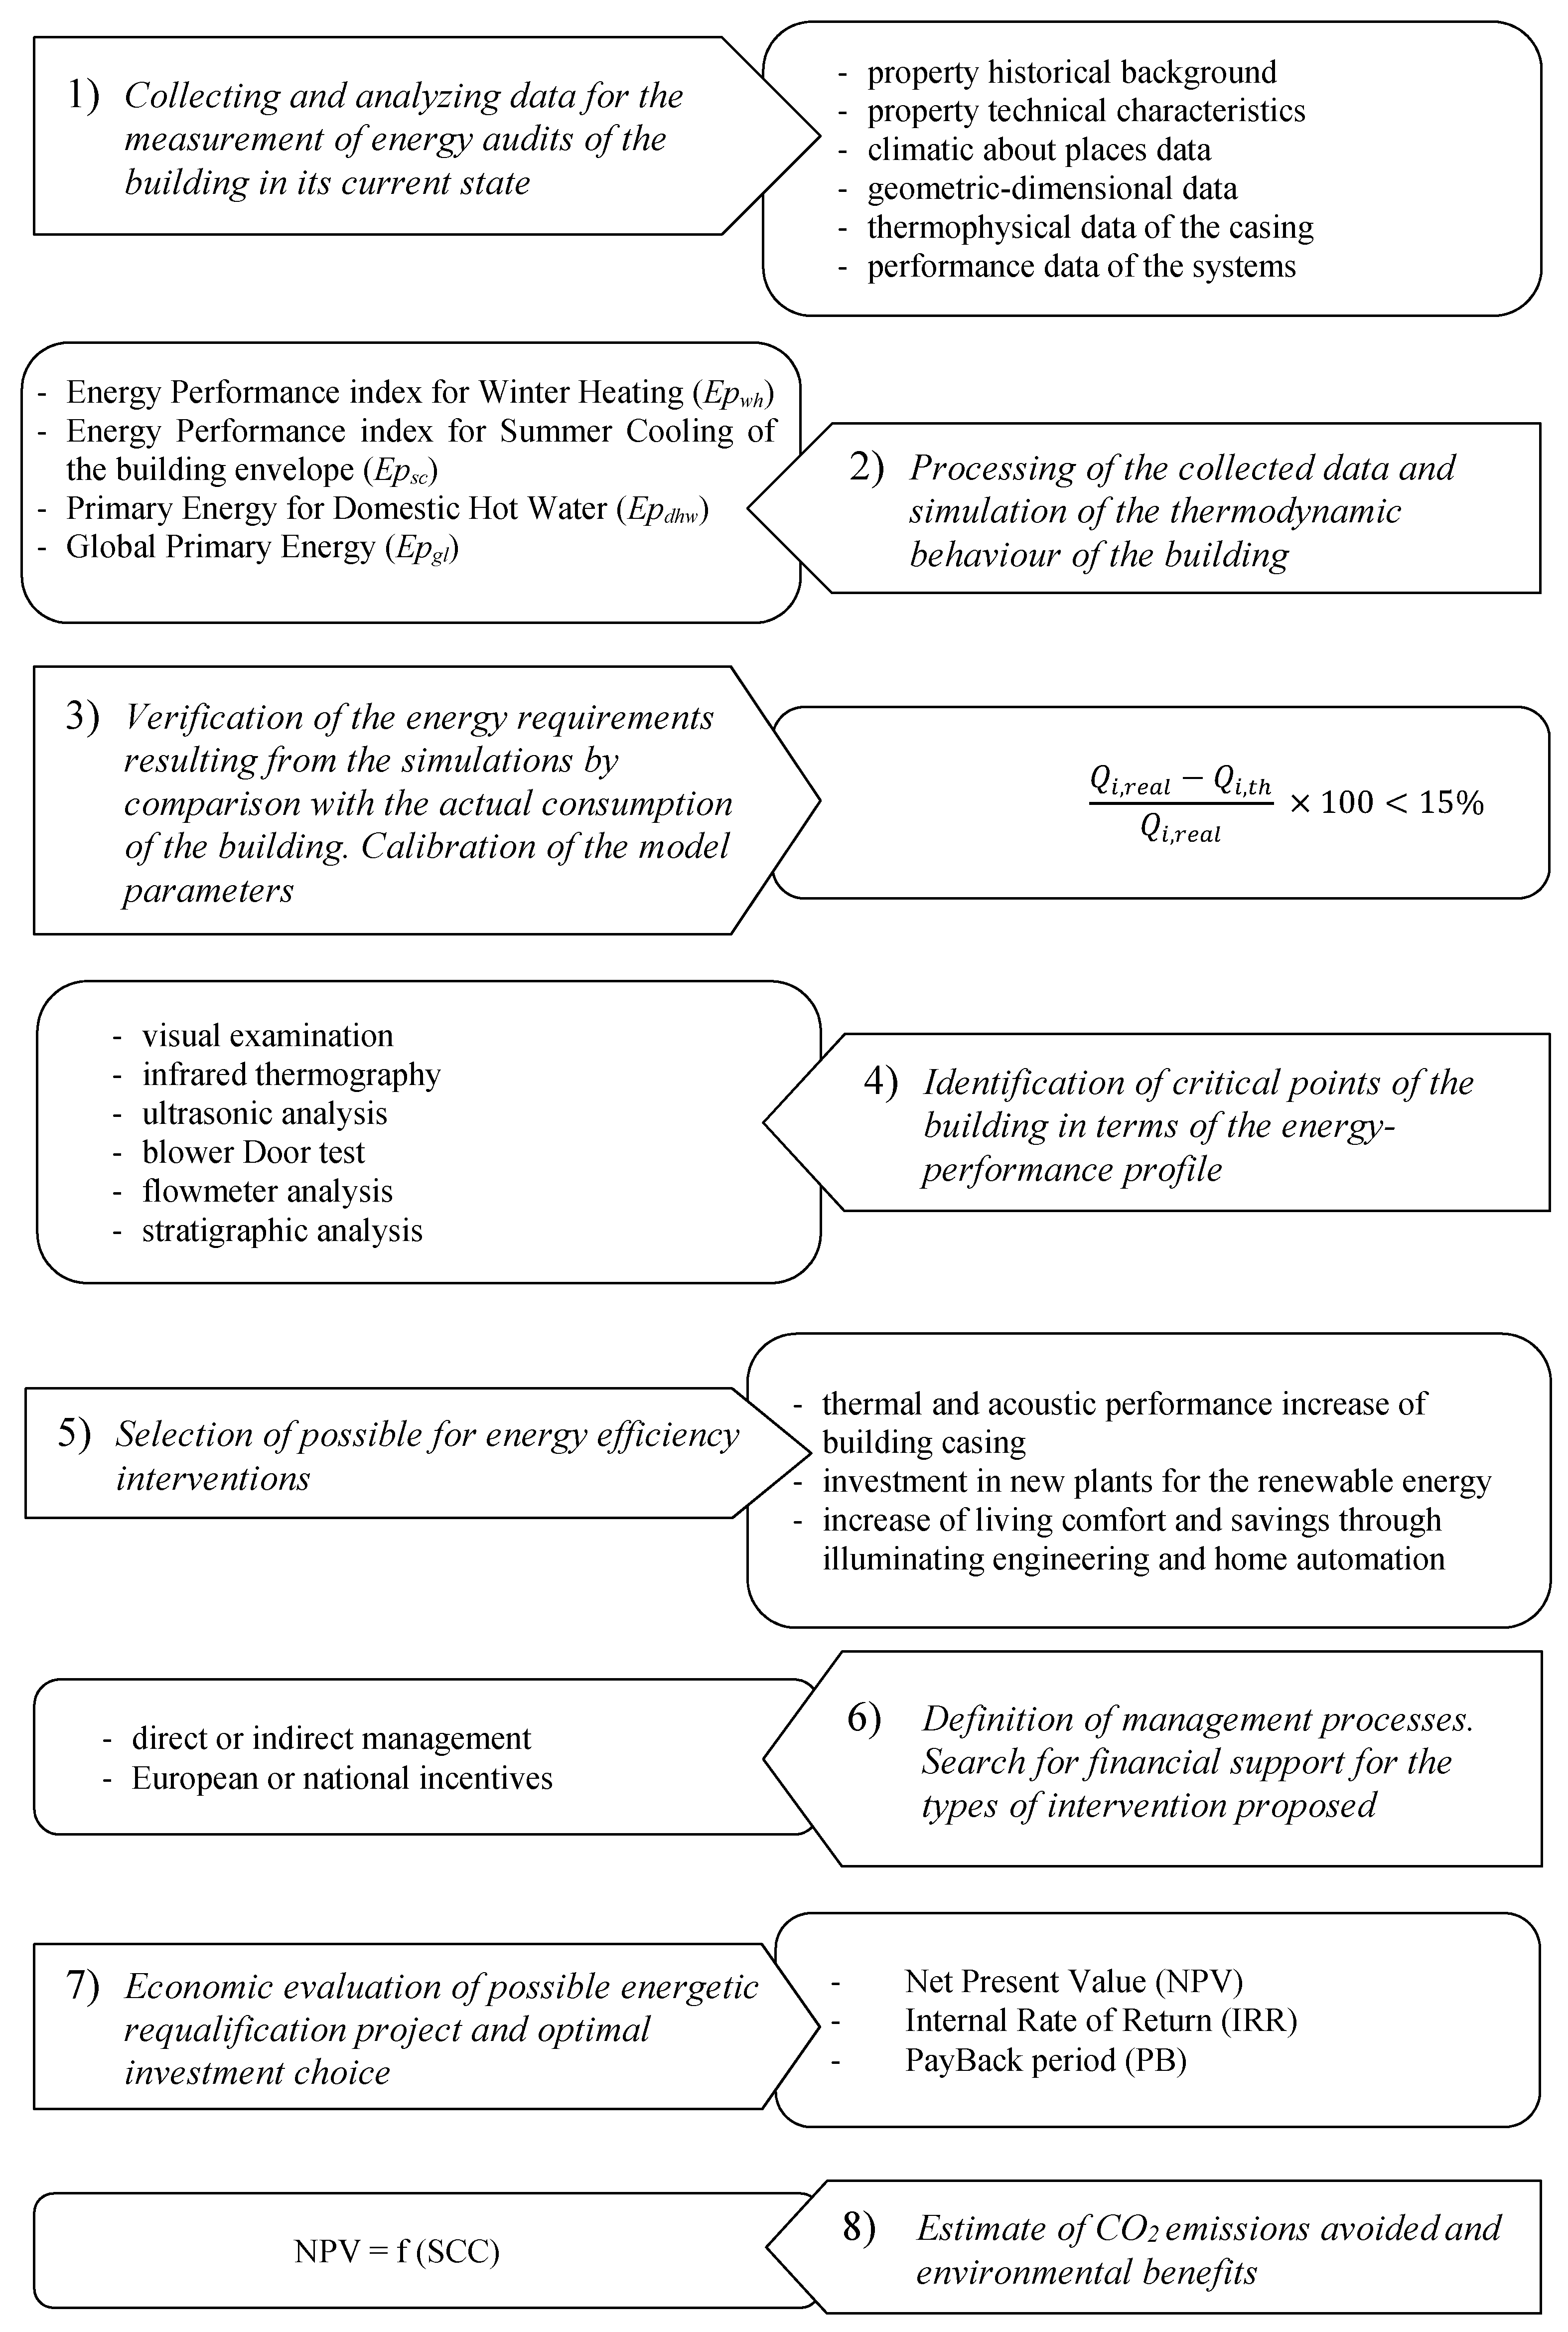
2. A Protocol for the Selection of Compatible Interventions

Research has focused on defining a model for the thermodynamic characterization of buildings, the economic analysis and selection of projects aimed at upgrading the energy efficiency of the building, as well as the measurement of the environmental benefits that are generated over time by virtue of such interventions [10,11].
As widely recognized in the current literature [12,13,14,15,16] the general model requires further specifications if it refers to historical buildings. In this sense, a protocol is structured following the steps in Figure 1.
Figure 1. Protocol phases.
Sustainability 07 14661 g001
The selection of technologically-advanced interventions, compatible with buildings of historical and architectural interest, is planned through a protocol that takes into account the historical background and technical specifications of the property, in addition to the climatic data of the places, geometric-dimensional, thermo-physical properties of the casing and the performance of the systems (Phase I). This information, implemented in software according to UNI TS 11300 regulations, allows for the thermodynamic modelling and its calibration (Phases II–III). Subsequently, the critical points are identified through non-destructive testing or slightly destructive testing, so as to select the possible actions to be realized (Phases IV–V). The decision on the investments takes into account the results of the cost-benefit analysis, which reflects the positive effects related to the financial benefits in energy efficiency and building renovation (Phases VI–VII). Finally, it is possible to monetarily quantify the reduction of equivalent CO2 emissions through the social cost of carbon (SCC; Phase VIII) and, through multi-criteria logic, other specific effects of a social, cultural or environmental order.

3. Verification of the Model through a Case Study

The application of the model aims to select technologically-advanced interventions in order to improve the energy behavior of an ancient religious structure. It is a former convent dating from the XV–XVI century, in the province of Salerno (Italy), currently owned by the local council and turned into a museum complex (Figure 2).
Figure 2. Ground floor plan.
Sustainability 07 14661 g002
The elaborations are organized by following the steps of the protocol schematically represented in Figure 1.

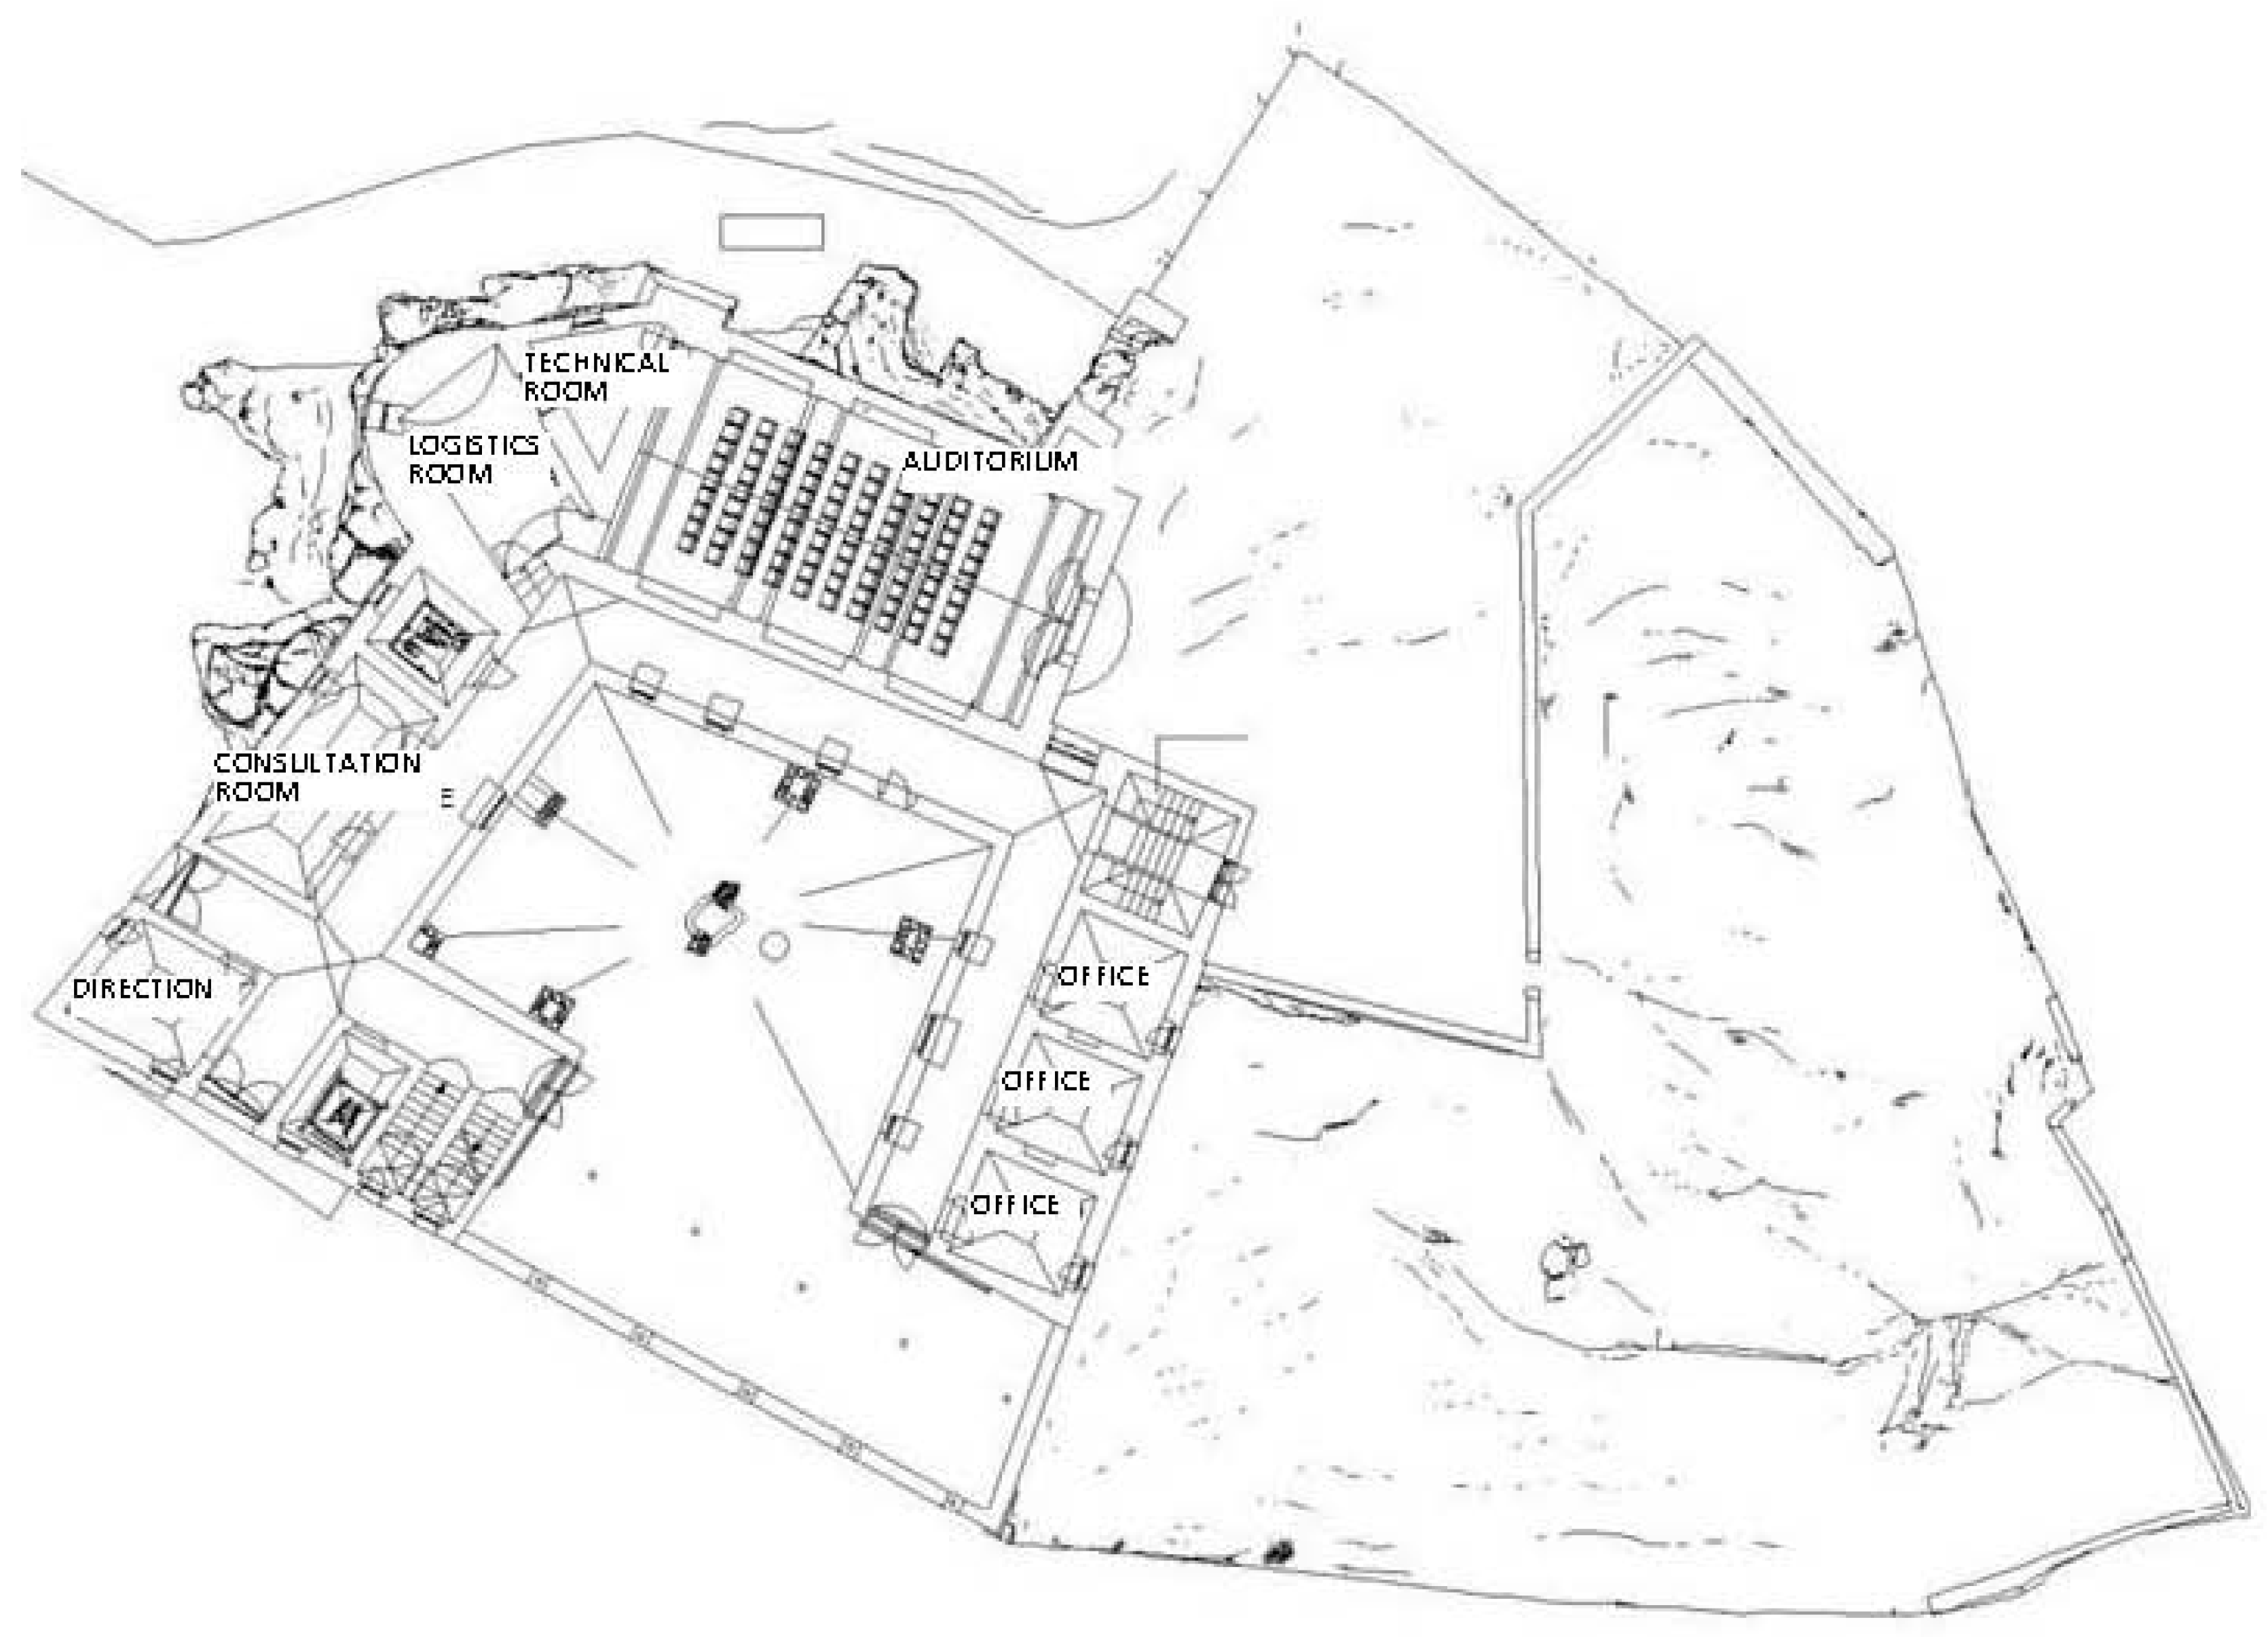
3.1. Collecting and Analyzing Data for the Measurement of Energy Audits of the Building in its Current State

The historic building is on three levels: basement, ground floor and first floor. It consists of 20 rooms including an auditorium, exhibition hall, conference room and offices. The plans have an average height of 3 m, while the auditorium and conference room are double the height. The building has toilets and a lift to reach the various levels. It can be entered from both the basement and ground floor. The first floor gives access to a large outdoor courtyard. The heating is now guaranteed by a floor system with two methane gas boilers. Additional parameters are contained in Table 1.
Table 1. Building data.
Climatic ZoneData
Degrees Days DD1518
dispensing Surface S2646 m2
gross heated Volume V4400 m3
shape ratio S/V0.6
usable area751.1 m2
Power heating system P35 kW

3.2. Processing of the Collected Data and Simulation of the Thermodynamic Behavior of the Building

The data in Table 1 are processed in order to draw up an energy balance inherent to the end use for winter heating. The program for the calculation used to evaluate the theoretical consumption of the building is the TERMUS software distributed by Acca. As the technical standard UNI TS 11300 indicates, the performance indicators proposed are:
E p w h = [ ( Q h , t r + Q h , v e ) η s × ( Q i n t + Q s o l ) A f l o o r ] η g
E p s c = ( Q i n t + Q s o l ) η s × ( Q h , t r + Q h , v e ) A c o o l
E p d h w =   ρ w   .   c w   . [ V w .   ( θ s θ o ) ]   . D A f l o o r η r
E p g l = E p w h + E p s c + E p d h w + E p l
where: Epwh = energy performance index for winter heating (kWh/m2K), Qh = thermal energy demand of the building (kWh), Afloor = useful floor area (m2), ηg = average global seasonal performance coefficient, Qh,tr = transmission losses (W/K), Qh,ve = dispersions due to ventilation (W/K), ηs = coefficient of use of free inputs, generally assumed to be equal to 0.95, Qint = free internal inputs (MJ), Qsol = solar inputs (MJ), Epsc = energy performance index for summer cooling of the building envelope (kWh/m2K), Acool = useful cooled surface (m2), Epdhw = primary energy for domestic hot water (kWh/m2K), Qw = energy demand for domestic hot water (kWh), ρw = volumetric mass density of water (1000 kg/m3), cw = specific heat of water (1.162 × 10⁻³ kWh/(kg K)), Vw = daily volume of water required by activity or service (m3/day), θs = water supply temperature (40 °C), θ0 = entry temperature of cold water (15 °C), D = number of days in the calculation period, ηg = global seasonal average performance coefficient, Epgl = global primary energy (kWh/m2K), Epl = energy performance index for artificial lighting (kWh/m2K).
The simulation of the thermodynamic behavior of the building provides the following requirements, which place it in energy class G:
-
EPwh = 77 kWh/m3;
-
EPsc = 56.72 kWh/m3;
-
EPgl = 77 kWh/m3.

3.3. Verification of the Energy Requirements and Calibration of the Model Parameters

To calibrate the model, the real uses must be compared to the theoretical ones. It is necessary that the percentage difference is less than 15%. The actual need for methane, obtained from the bills, is 37,461.25 m3/year. The theoretical consumption for heating is 77.0 kWh/m3 year (equal to 39,721.55 m3/year of natural gas), that is:
Q h , t h Q h , r e a l Q h , t h × 100 = 5.69 <   15 %   model validated

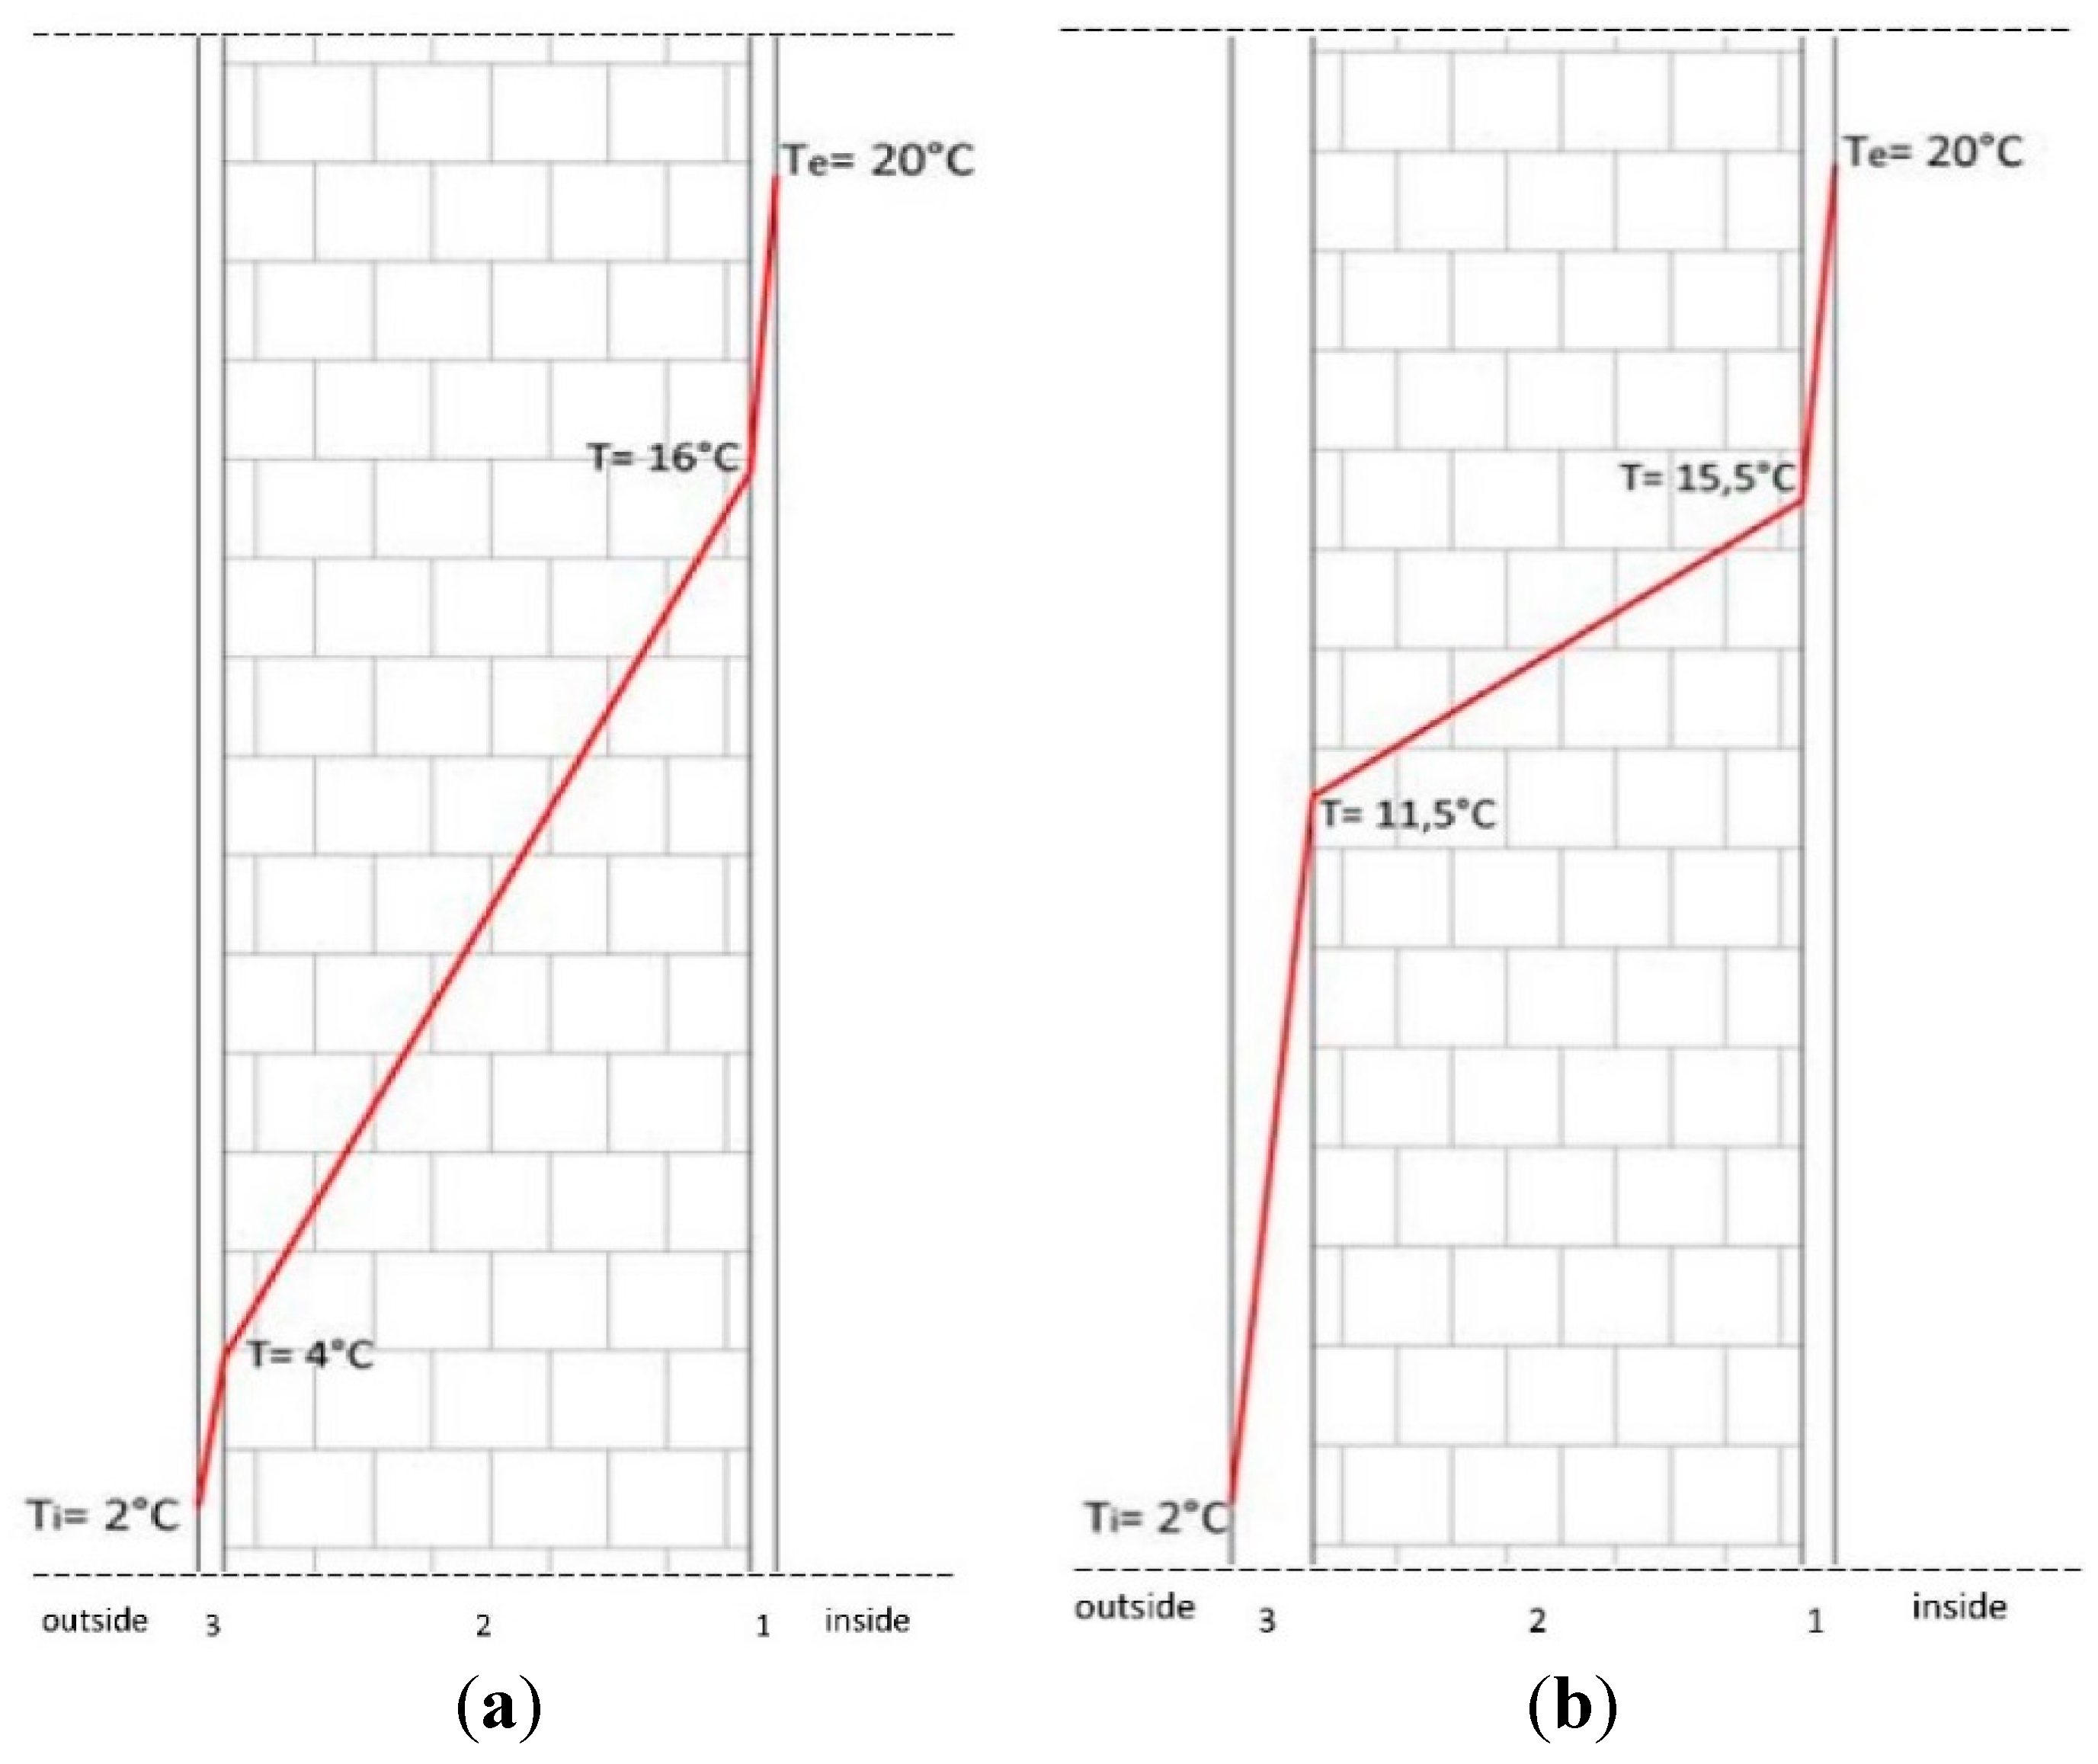
3.4. Identification of Critical Points of the Building in Terms of the Energy-Performance Profile

From the analysis of the building-plant system in its present state, it is clear that the performance can be improved. The larger needs are tied to the consumption of electricity related to the costs for the heating and lighting systems. It follows that the critical points are the excessive power used by the neon light fixtures and the dispersion of the building casing. In particular, if the building is of a low energy class, the transparent and opaque components may not be thermally adequate and induce the consumption of high energy amounts for air conditioning.

3.5. Selection of Possible Energy Efficiency Interventions

Knowing the architectural and construction constraints of the former convent and taking into account the existing museum functions of the structure, four lines of action are proposed:
(a)
increasing the energy casing performance, through insulation works on the bearing walls, insulation and waterproofing of roofs and replacement of fixtures;
(b)
replacement of incandescent lamps with LED installations;
(c)
replacement of tiles of pitched roofs with new-generation photovoltaic tiles;
(d)
replacement of the current heating system with a high efficiency tri-generation plant.
(a) Increasing the energy casing performance: The intervention affects primarily the bearing walls, with a stratigraphy composed of plaster-solid brick-plaster; only at the basement floor is there plaster-stone material (limestone clasts)-plaster (Figure 3). The thicknesses are between 30 and 60 cm. The casing currently causes considerable heat losses, which is expected to be reduced by creating a new ecological thermal, acoustic and breathable plaster. The results are a function of the thickness of the coating: 5 cm for the outer walls and 2 cm for the inner ones (Figure 4).
The plaster, with hydraulic lime, is best suited to the insulation of historic buildings without altering the appearance. For the study of the thicknesses, the thermal flow analysis of the walls is used, which, as a result of new works, decreases, going from 26.66 W/m2 (Table 2) down to 8.21 W/m2 (Table 3). The surfaces to be plastered are the walls of each room, the ceilings and the four exterior elevations. The realization of a coat-like thermal layer, of expanded polystyrene, is also included, stirred with mineral wool, for the 409 m2 of pitched roofs. With this intervention, the coverage thermal flow is reduced from 21.06 W/m2 down to 4.68 W/m2. The coverage horizontal plans will be affected by insulation treatment with hydrophobic, transparent, invisible impregnation.
Figure 3. (a) Thermal flow (current state); (b) thermal flow (project).
Sustainability 07 14661 g003
Figure 4. Trend of net tax cash flows.
Sustainability 07 14661 g004
Table 2. Thermal flow analysis inside the wall in the current state.
MaterialThickness (m)Mass (kg/m2)Resistance (m2K/W)Conductance (W/mK)
Outer surface 0.043
1Lime mortar or lime or cement0.015270.0160.09
2Solid bricks0.306750.4700.80
3Lime plaster and gypsum0.015210.0210.07
Inner surface 0.125
Thermal flow q = DT/R = 18/0.675 = 26.66 W/m2.
Table 3. Thermal flow analysis inside the wall of the project.
MaterialThickness (m)Mass (kg/m2)Resistance (m2K/W)Conductance (W/mK)
Outer surface 0.043
1Thermal plaster0.053601.1110.045
2Solid bricks0.306750.4700.800
3Thermal plaster0.023600.4440.045
Inner surface 0.125
Thermal Flow q = DT/R = 18/2.19 = 8.21 W/m2.
Subsequently, the existing windows are replaced with low emissivity double-glazed windows. Sealed windows are also provided to seal the mouths of old cisterns, which cause infiltration.
(b) Replacement of incandescent lamps with LED installations: The electrical system is developed in order to illuminate both the internal and external spaces, so as to enhance and make visible the historic complex during the night from the valley below. The lamps’ operation is designed for 10 h a day throughout the year. Currently, the building is equipped with incandescent lamps, with a total consumption of 29.0 kWh. In quantitative terms, the new LED lamps allow for a consumption of 4.50 kWh (Table 4), better light output (+40%) and a significant reduction of CO2 emissions.
Table 4. Consumption of the lighting system (current state vs. the project).
IncandescenceLED
Interventionn.Power EachTotal PowerPower EachTotal Power
Interior lamps: wall sconce cylindrical1660 W960 W10 W160 W
Interior lamps: wall sconce in adjustable support8160 W4860 W10 W810 W
Outdoor lamps: markers for the terraces15100 W1500 W20 W300 W
Outdoor lamps: markers for the walls31100 W3100 W20 W620 W
Outdoor lamps: recessed, flush with the ground15100 W1500 W20 W300 W
Floodlight for architectural exterior lighting27600 W16,200 W100 W2700 W
Floodlight for lighting of the conference room at the ground floor1800 W800 W120 W120 W
Consumption29,000 W5010 W
(c) Replacement of tiles of pitched roofs with new generation photovoltaic tiles: The building is rendered energetically self-sufficient with the installation of photovoltaic roof tiles. The plant consists of a base composed of complete panels of insulation, upon which the tiles rest. The surfaces of pitched roofs upon which the installation is placed are oriented to the south, southwest and southeast. The objective is to have a yield of 6.00 kWh, so as to always satisfy the energy needs of the building. The annual requirement are 16,425 kWh year.
The productivity of the photovoltaic plant is expressed in kW peak (kWp). In the area, the radiation is 1350 kWh/kWp. Consequently, the plant must be calibrated to a yield equal to 12.17 kWp.
The plant is dimensioned for 15 kWp, since this technology has an efficiency loss of about 10% after 12 years, 20% after 25 years, with a reduction up to 30% after age 35.
As for the plant, 1 kWp = 18 m2, then: 15 kWp = 270 m2 = 3750 tiles.
(d) Replacement of the current heating system with a high efficiency tri-generation plant: The project involves the installation of a high efficiency tri-generation plant, which simultaneously produces electric, thermal and cooling energy. The transformation of the thermal energy, recovered from the cogenerator, in cooling energy is possible thanks to the combination with an absorption chiller. The absorption refrigeration units are designed for the use of warm or hot water as the primary source of energy. The units do not produce emissions of greenhouse gases and have zero impact, with many positive effects: lower consumption of natural gas and greater thermal efficiency and production of hot air, cold air, hot water and electricity.
Since 30% of this production is electricity, this is sufficient to power the 52 fans provided to spread the warm air throughout the rooms:
-
Twenty two upright, with potentiality total cooling (PC) ≥ 4.54 kW, air flow max (AF) = 800 m3/h, thermal capacity (TC) = 9.13 kW;
-
Thirty upright, with PC ≥ 7.27 kW, AF = 1250 m3/h, TC = 14.18 kW.

3.6. Definition of the Management Processes and the Search for Financial Support

The local council will ensure the implementation of the interventions and the direct management of the museum activities. The financial structure makes it possible to use both public and European funds for regional development (in Italy FESR).
In the field of energy efficiency, incentives, such as tax breaks and white certificates, are provided. The first allows one to recover the investment cost through deductions up to an amount of: € 60,000 for work on the building envelope; € 96,000 for the installation of photovoltaic systems; € 30,000 for fixture replacement; € 30,000 for winter heating systems. These deductions are applied on corporate income tax (IRES), distributed in equal annual amounts over ten years.
As an alternative, it is possible to obtain white certificates, i.e., marketable securities for five years for each Tonne of Oil Equivalent (TOE) of saved energy. They can be obtained through the performance certificate of the building and sold to distributors of energy (electricity and natural gas). Their value is 100.00 €/TOE. In the case study, the administration gets the white certificates for the first five years of operation, with a value of:
52 TOE (methane) + 20 TOE (electricity) = 72 TOE × 100 €/TOE = 7179 €/year

3.7. Economic Evaluation of Possible Energetic Requalification Projects and Optimal Investment Choice

This is carried out with the cost-benefit analysis (CBA), which requires an estimate of the costs (investment and management) and revenue (fuel economy). The time of the completion of the works is estimated at one year: 3–6 months for the structure, including the installation of the photovoltaic system, which will be carried out simultaneously as the work on the roof insulation; three months for the electrical system; 6–9 months for the tri-generation plant. The entry phase of the scheme is relatively short, and the energy efficiency results are tangible immediately with the operation of the plant.
Since this is a public building, the analysis period is extended up to 35 years. Periodic maintenance is also considered. The feasibility of the interventions requires measuring the financial profitability through indicators, such the net present value (NPV), the internal rate of return (IRR) and the payback period (PB):
N P V = i = 0 n C F i ( 1 + r ) i I 0
I R R = r i = 0 n C F i ( 1 + r ) i I 0 = 0
P B = I 0 A f R
with CFi the cash flow to the i-th year, r the discount rate and I0 the initial investment cost. For the IRR and payback period, the following relations are applied, where Af indicates any tax breaks and R the annual recovery.
Investment costs: From price lists and information obtained from the industry, costs for the plaster and thermal insulation of the pitched roof, for the fixtures, for the LED and for the photovoltaic and tri-generation are estimated. These costs do not include Value Added Tax (VAT), manpower and safety costs (Table 5).
Table 5. Intervention costs.
InterventionCost [€]
a)
Insulation of the bearing walls
Insulation and waterproofing of roofs
Replacement of windows
140,531.72
47,397.20
52,530.20
b)
Replacing incandescent lamps with plant LED
57,540.37
c)
Replacement of the roof tiles of the pitched roofs with photovoltaic roof tiles
196,400.00
d)
Replacing the current thermal plant with a tri-generation plant
406,271.88
Total900,671.39
Technical costs90,067.14
Administrative costs45,033.57
Insurance costs27,020.14
Freight and transport5908.60
Total Works1,068,700.82
The costs must be reduced to the extent of the FESR. There are three possible scenarios. The first concerns the case in which the project is to benefit from the greatest possible contribution (€ 1,043,000); then the investment cost is almost entirely covered by external resources and has extremely high profitability. The second scenario is based on not obtaining FESR, which corresponds to the non-financial sustainability of the work. The third case refers to an external contribution less than the maximum possible. In the study, the rate of FESR funds to guarantee a return of 14.1% (before tax) equal to the average of the renewable energy sector in which the project falls is used [17].
Management costs: From the rate plan for electricity low voltage public illumination, the current cost incurred is 0.2348 €/kWh. Assuming an average use of 10 h a day throughout the year, the annual pre-intervention costs are:
29.00 kWh × 10 h × 365 D × 0.2348 €/kWh = 24,853.58 € year
After the intervention, the electricity does not constitute an expenditure for the public administration, since the overall need for electricity will be covered by the photovoltaic system.
At the price of € 0.98/m3, the current consumptions of natural gas are:
37,461.25 m3/year × 0.98 €/m3= 36,712.03 €/year
With the planned interventions, the building falls into energy class C, with a reduced consumption of natural gas up to 12.656 kWh/m3 year (equivalent to 6528.77 m3/year). Taking advantage of a high efficiency tri-generation plant, the local council benefits from a tax advantage or may buy natural gas at the lowest cost of € 0.76/m3. The estimated annual consumption amounted to:
6528.77 m3/year × 0.76 €/m3 = 4961.86 €/year
with a saving of 31,750 €/year.
Among the management costs, in Table 6, the servicing costs are estimated at:
-
150 €/year for the cleaning of the photovoltaic system;
-
1000 € every 10 years to replace the inverter of the photovoltaic panels;
-
€ 60,000 every 15 years to replace the tri-generation engine plant;
-
€ 54,000 every 20 years to maintain the insulating plaster;
-
€ 4000 every 15 years for the replacement of the LED lamps.
Revenues: The lower operating costs, as explained in the previous point, are revenues for the investment to the extent of:
-
€ 24,854/year, since the photovoltaic system covers the entire electricity production that amounts to 6000 W. The beginning of the 12th year for yield drops to 90% (5400 W), for 25 years down to 8% (4800 W), which also provides the building’s energy needs, while the 37th year, the performance becomes 70%, producing 4200 W, which results from the electricity supply with respect to the rate not covered by the photovoltaics;
-
€ 31,750/year for the lower consumption of natural gas by the use of the tri-generation plant;
-
€ 1750/year due to the lack of the routine maintenance costs of incandescent bulbs.
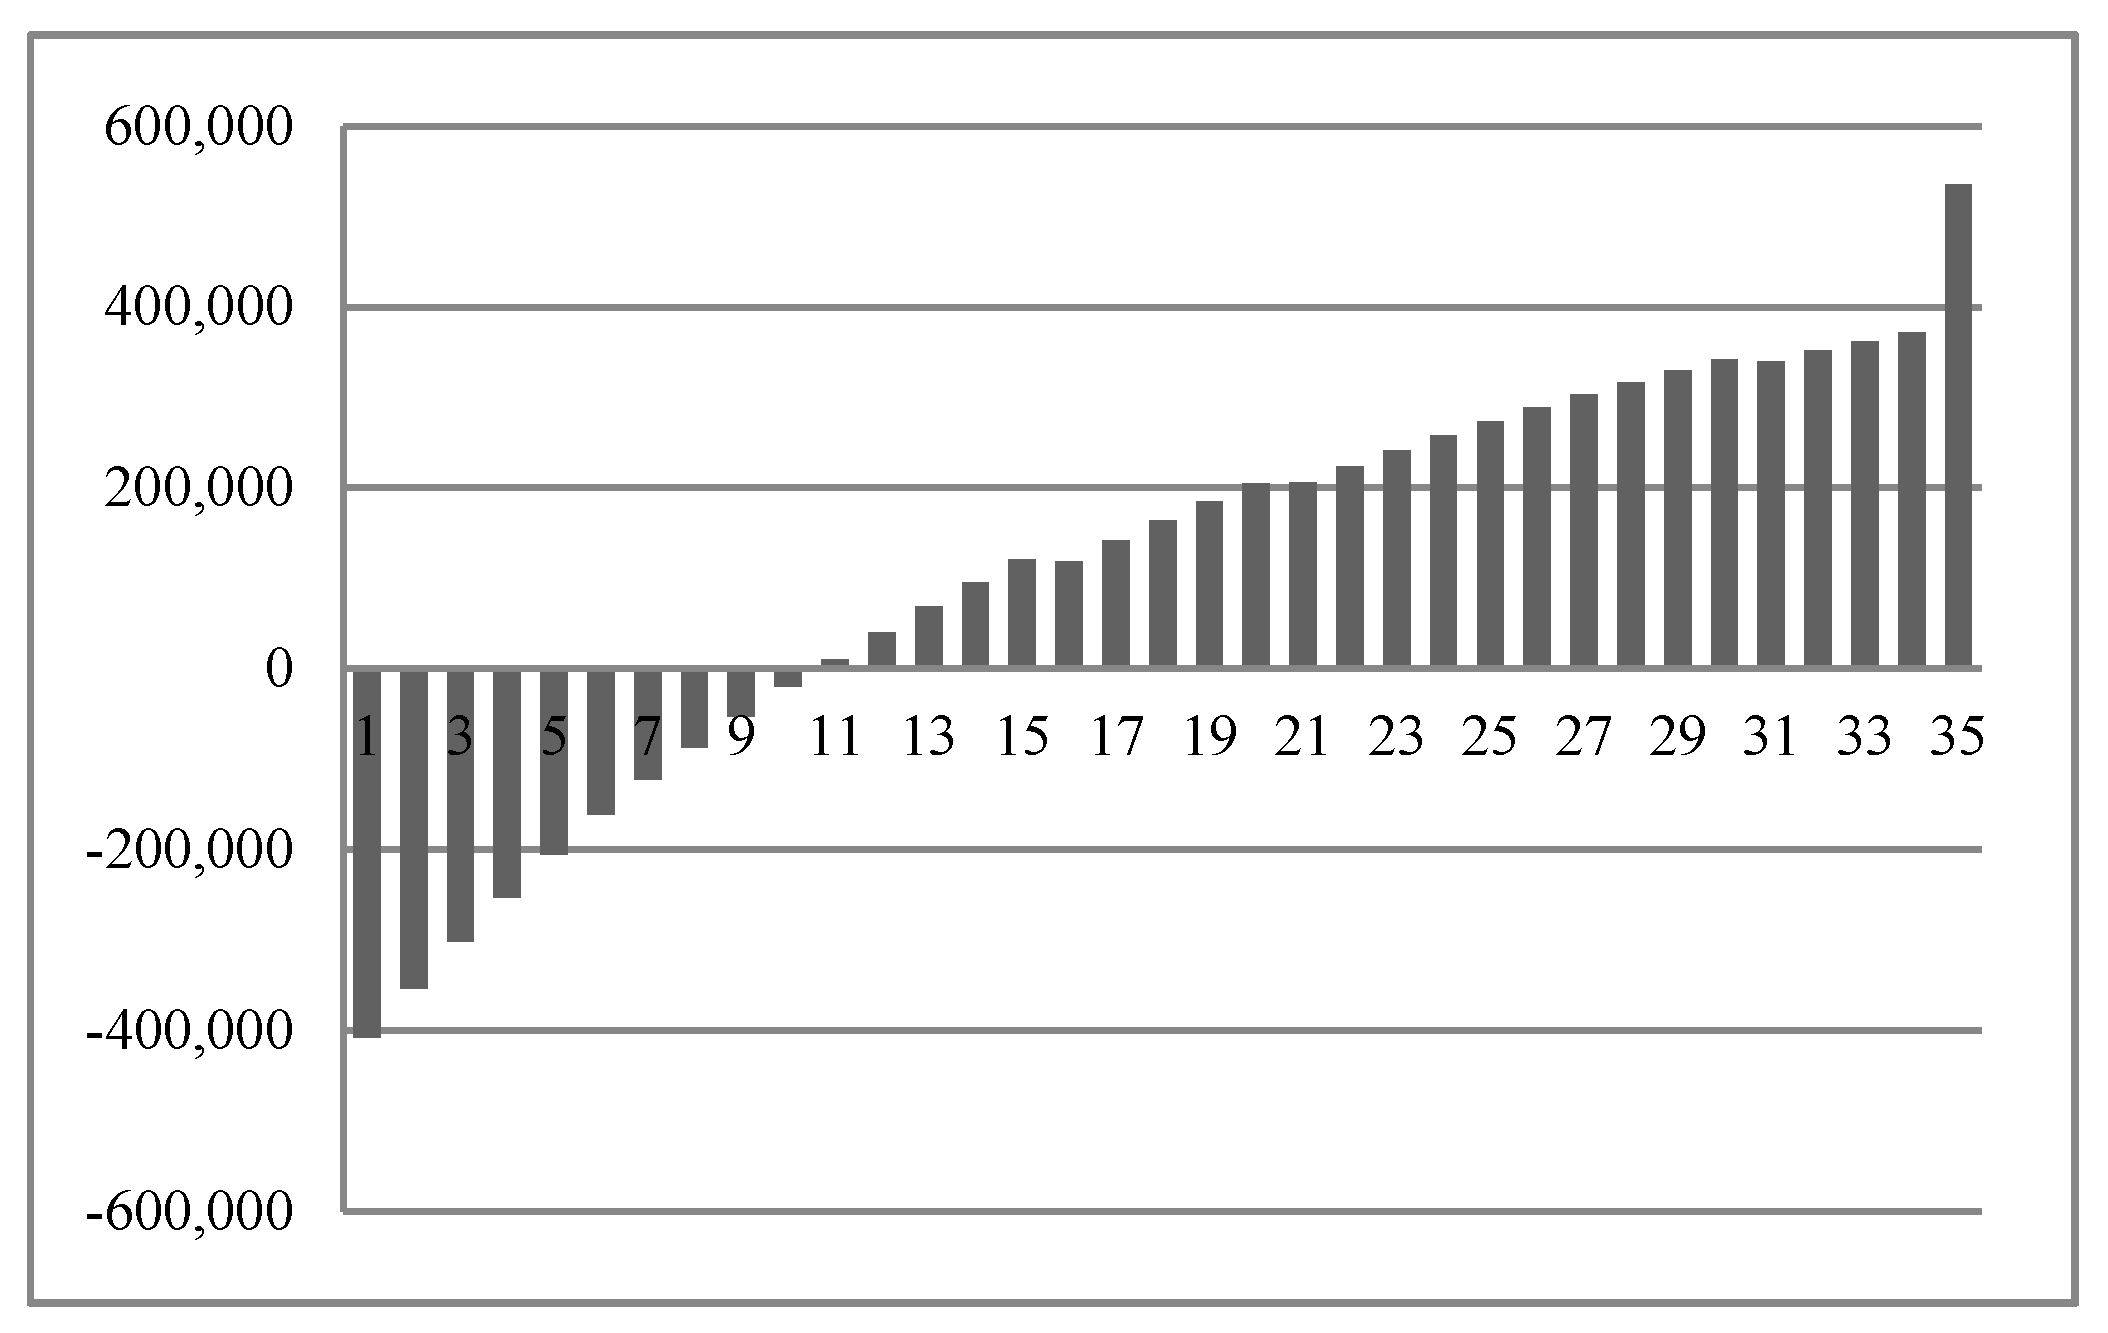
Among the revenues, the value of the white certificates (€ 7179/year) for the first five years of management should also be considered. This amount is included in the column of the total revenues of the financial plan (Table 6). In view of the scheduled maintenance on a periodic basis, the residual value of the project at 35 years is equal to the sum of 70% of the investment cost of the photovoltaic system and 90% of the cost for other plants, for a total of 848,457 €.
Financial plan: The results of the cost-benefit analysis are expressed through the criteria of NPV and IRR. The estimate of the indicators of affordability is made both from the gross and net tax, assuming a discount rate of 5% and a tax rate of 8.5% (IRAP) on production activities income. As written at the beginning of this paragraph, the financial plan (Table 6) has assessed the amount of the FESR contribution (€ 640,800) that makes the IRR = 14.10% gross taxes, so as to achieve an IRR = 12.88% net taxes. The break-even point occurs in the tenth year of operation (Figure 4).
Table 6. Revenues and taxes; cash flows, NPV and IRR net and gross tax.
YearCOST (€)Electricity Savings (€)Methan Savings (€)Maintenance Lamps Savings (€)REVENUE (€)Gross Tax Cash Flows (€)IRAP (€)Net Tax Cash Flows (€)Discounted And Cumulative Cash Flows (€)
1−427,901 −427,901 −427,901−407,525
2−15024,85431,750175065,53365,383555859,825−353,261
3−15024,85431,750175065,53365,383555859,825−301,582
4−15024,85431,750175065,53365,383555859,825−252,364
5−15024,85431,750175065,53365,383555859,825−205,489
6−15024,85431,750175065,53365,383555859,825−160,847
7−15024,85431,750175058,35458,204494753,256−122,998
8−15024,85431,750175058,35458,204494753,256−86,952
9−15024,85431,750175058,35458,204494753,256−52,623
10−15024,85431,750175058,35458,204494753,256−19,928
11−115024,85431,750175058,35457,204486252,34110,675
12−15024,85431,750175058,35458,204494753,25640,330
13−15024,85431,750175058,35458,204494753,25668,573
14−15024,85431,750175058,35458,204494753,25695,471
15−15024,85431,750175058,35458,204494753,256121,089
16−64,15024,85431,750175058,354−5,796 −5796118,433
17−15024,85431,750175058,35458,204494753,256141,669
18−15024,85431,750175058,35458,204494753,256163,798
19−15024,85431,750175058,35458,204494753,256184,873
20−15024,85431,750175058,35458,204494753,256204,945
21−55,15024,85431,750175058,35432042722931205,997
22−15024,85431,750175058,35458,204494753,256224,203
23−15024,85431,750175058,35458,204494753,256241,542
24−15024,85431,750175058,35458,204494753,256258,055
25−15024,85431,750175058,35458,204494753,256273,782
26−15024,85431,750175058,35458,204494753,256288,760
27−15024,85431,750175058,35458,204494753,256303,024
28−15024,85431,750175058,35458,204494753,256316,610
29−15024,85431,750175058,35458,204494753,256329,548
30−15024,85431,750175058,35458,204494753,256341,870
31−65.15024,85431,750175058,354-6796 −6796340,373
32−15024,85431,750175058,35458,204494753,256351,549
33−15024,85431,750175058,35458,204494753,256362,194
34−15024,85431,750175058,35458,204494753,256372,332
35−15024,85431,7501750906,811906,6614947901,713535,803

3.8. Estimate of Avoided CO2 Emissions and Environmental Benefits

The annual carbon dioxide CO2eq emissions before and after the intervention amount to:
-
CO2eq (before-intervention) = 15.50 kg/m3year,
-
CO2eq (after-intervention) = 2.76 kg/m3year.
Resulting in a reduction of emissions to the extent of:
reduction CO2eq = 0.01274 ton/m3year × 4400 m3 = 56.08 ton/year
The social cost of carbon (SCC) for each tonne produced varies from 61.00 2011 $/ton in the first year of the analysis period, up to almost 104.00 2011 $/ton in the 35th year [18,19]. The dollar values in 2011 are discounted at the average inflation rate for the period. The exchange rate dollar/€ is 0.9472. Table 7 summarizes the terms of the CBA, including the benefits arising from lower CO2 emissions. This gives an NPV of € 676,242 and an IRR of 15.07%. A comparison with the results in Section 3.7 shows a profitability increase of 0.96 percentage points in terms of IRR.
Table 7. Estimating the benefits from reduced emissions of CO2 and total cash flows. SCC, social cost of carbon.
YearCash Flow Gross Tax (€)SCC (2011$/ton)SCC (2015$/ton)Total Saving SCC ($)Total Saving SCC (€)Cash Flows (€)Discounted and Cumulative Cash Flows (€)
1−427,90161.0064.20 −427,901−407,525
265,38362.4065.673683348868,871−345,056
365,38363.8067.153765356768,949−285,495
465,38365.2068.623848364569,028−228,706
565,38366.6070.093931372369,106−174,560
665,38368.0071.574013380169,184−122,934
758,20469.2072.834084386862,072−788,20
858,20470.4074.094155393662,139−367,62
958,20471.6075.364226400362,2063337
1058,20472.8076.624297407062,27341,567
1157,20474.0077.884367413761,34177,432
1258,20475.2079.144438420462,408112,183
1358,20476.4080.414509427162,475145,314
1458,20477.6081.674580433862,542176,902
1558,20478.8082.934651440562,609207,018
16−579680.0084.2047224472−1324206,412
1758,20481.0085.254781452862,732233,781
1858,20482.0086.304840458462,788259,871
1958,20483.0087.354899464062,844284,740
2058,20484.0088.414958469662,900308,447
21320485.0089.46501747527955311,302
2258,20486.4090.935099483063,034332,850
2358,20487.8092.405182490863,112353,398
2458,20489.2093.885264498763,190372,991
2558,20490.6095.355347506563,269391,674
2658,20492.0096.825430514363,347409,490
2758,20493.2098.095501521063,414426,475
2858,20494.4099.355571527763,481442,669
2958,20495.60100.615642534463,548458,108
3058,20496.80101.885713541163,615472,827
31−6,79698.00103.1457845478−1318472,536
3258,20499.20104.405855554663,749485,915
3358,204100.40105.675926561363,816498,670
3458,204101.60106.935996568063,883510,831
35906,661102.80108.1960675747912,408676,242

4. Conclusions

In order to avoid further soil consumption, there is a pressing need to requalify existing buildings rather than constructing new ones. Disentangling the attainment of the standards required by the regulations, the structural constraints and the cost-effectiveness of the intervention solutions becomes difficult unless there is a valuable tool for the analysis of a technical and financial project.
Through the application of a real case, this article aimed to test the protocol defined by sequential evaluation algorithms that could be useful in selecting feasible engineering, economic and environmentally-sustainable works.
When the designer is working on historic buildings, the purpose of a full or partial recovery should reconcile the existence of particular constraints, the specific operating requirements, as well as the aim of reducing consumption through technologically-advanced plant equipment.
The application concerns a former convent now used as a museum complex. The project involves the use of innovative integrated systems with the architectural structures that ensure conditions not only for its protection and conservation, but also sustainability in terms of less impact on the structure and the use of energy to ensure that it works with the least possible consumption.
The analysis carried out shows how the system solutions do not reach economic convenience due to the high initial cost of the interventions, which are much more expensive due to the presence of constraints. In fact, the NPV has a value next to zero. The initiative is, however, to be taken when evaluating the positive social and cultural effects. Conversely, the investment is extremely convenient if it benefits from the entire amount of the FESR allocated amount of € 1,043,000.
Intermediate case studies are also considered in which the project is partially funded. In this case, the rate of found FESR returns IRR gross taxes of 14.10%, equal to the average profitability in the field of the rehabilitation of buildings. This contribution should cover almost 60% of the investment cost. If the improvement of the environmental quality caused by the decrease of emissions of carbon dioxide resulting in the above solutions is also considered, the rate rises to 15.07% IRR.

Author Contributions

The authors contributed equally to the reported research and writing of the paper. All authors read and approved the final manuscript.

Conflicts of Interest

The authors declare no conflict of interest.

References

  1. Fusco Girard, L. Verso una nuova economia della conservazione del patrimonio artistico edificato. In Economia del Patrimonio Monumentale; Mossetto, G., Vecco, M., Eds.; FrancoAngeli: Milano, Italy, 2001. (In Italian) [Google Scholar]
  2. Khasreen, M.M.; Banfill, P.F.G.; Menzies, G.F. Life-Cycle Assessment and the Environmental Impact of Buildings: A Review. Sustainability 2009, 1, 674–701. [Google Scholar] [CrossRef]
  3. Ronchi, A. Edificato storico e comunità locali: La partecipazione come strategia di conservazione preventiva. In Pensare la Prevenzione: Manufatti, Usi, Ambienti. Atti del Convegno di Bressanone “Scienza e Beni culturali”; Arcadia Ricerche: Venezia, Italy, 2010. (In Italian) [Google Scholar]
  4. Della Torre, S. La Conservazione Programmata: Una Strategia per il Patrimonio Storico Architettonico; Guerini: Milano, Italy, 2003. (In Italian) [Google Scholar]
  5. Pisello, A.L.; Petrozzi, A.; Castaldo, V.L.; Cotana, F. Energy Refurbishment of Historical Buildings with Public Function: Pilot Case Study; Elsevier: Amsterdam, The Netherlands, 2014. [Google Scholar]
  6. De Lieto Vollaro, R.; Guattari, C.; Evangelisti, L.; Battista, G.; Carnielo, E.; Gori, P. Building Energy Performance Analysis: A Case Study. In Energy and Buildings; Elsevier: Amsterdam, The Netherlands, 2015. [Google Scholar]
  7. Paoletti, D.; Ambrosini, D.; Sfarra, S.; Bisegna, F. Preventive thermographic diagnosis of historical buildings for consolidation. J. Cult. Herit. 2013, 14, 116–121. [Google Scholar] [CrossRef]
  8. Adhikari, R.S.; Longo, E.; Pracchi, V.; Rogora, A.; Rosina, E.; Schippa, G. Energy behaviour in historical buildings: Limits and potentials for the project evaluation. In Proceedings of the PLEA 2011—27th Conference on Passive and Low Energy Architecture, Louvain-la-Neuve, Belgium, 13–15 July 2011; pp. 515–520.
  9. Cecchi, R.; Gasparoli, P. Prevenzione e Manutenzione per i Beni Culturali Edificati: Procedimenti Scientifici per lo Sviluppo Delle Attività Ispettive. Il Caso Studio Delle Aree Archeologiche di Roma e Ostia Antica; Alinea: Firenze, Italy, 2010. (In Italian) [Google Scholar]
  10. De Mare, G.; Granata, M.F.; Nesticò, A. Complex efficiency of sports facilities. Multicriteria and financial analysis for swimming pools. In Advances in Environmental and Geological Science and Engineering, Proceedings of the 8th International Conference on Environmental and Geological Science and Engineering (EG’15), Salerno, Italy, 27–29 June 2015; WSEAS Press: Athens, Greece, 2015; pp. 96–103. [Google Scholar]
  11. Nesticò, A.; De Mare, G.; Fiore, P.; Pipolo, O. A Model for the Economic Evaluation of Energetic Requalification Projects in Building. A real case application. In Computational Science and Its Applications—ICCSA 2014, Part II; Murgante, B., Misra, S., Rocha, A.M., Torre, C., Rocha, J.G., Falcão, M.I., Taniar, D., Apduhan, B.O., Gervasi, O., Eds.; Springer: Berlin, Germany; Heidelberg, Germany; Volume 8580, pp. 563–578.
  12. Rodwell, D. Conservation and Sustainability in Historic Cities; Blackwell Publishing: Oxford, UK, 2007. [Google Scholar]
  13. Syed, A. Advanced Building Technologies for Sustainability; John Wiley & Sons, Inc.: Hoboken, NJ, USA, 2012. [Google Scholar]
  14. De Vita, M. Historic Cities and Sustainability; Firenze University Press: Florence, Italy, 2012. [Google Scholar]
  15. Mjörnell, K.; Boss, A.; Lindahl, M.; Molnar, S. A Tool to Evaluate Different Renovation Alternatives with Regard to Sustainability. Sustainability 2014, 6, 4227–4245. [Google Scholar] [CrossRef]
  16. Nesticò, A.; Macchiaroli, M.; Pipolo, O. Historic buildings and energetic requalification. A model for the selection of technologically advanced interventions. In Computational Science and Its Applications—ICCSA 2015, Part III; Gervasi, O., Murgante, B., Misra, S., Gavrilova, M.L., Rocha, A.M., Torre, C., Taniar, D., Apduhan, B.O., Eds.; Springer: Berlin, Germany; Heidelberg, Germany, 2015; Volume 9157, pp. 61–76. [Google Scholar]
  17. Narita, D.; Tol, R.S.J.; Anthoff, D. Economic costs of extratropical storms under climate change: An application of FUND. J. Environ. Plan. Manag. 2010, 53, 371–384. [Google Scholar] [CrossRef]
  18. Clarkson, R.; Deyes, K. Estimating the Social Cost of Carbon Emissions; The Public Enquiry Unit: London, UK, 2002. [Google Scholar]
  19. UBI Banca. Investire in Energie Rinnovabili. Convenienza Finanziaria e Opportunità per le Imprese; Unindustria Bologna: Bologna, Italy, 2010. (In Italian) [Google Scholar]

