
From Indicators to Policies: Open Sustainability Assessment in the Water and Sanitation Sector

Abstract
:1. Introduction
2. Materials and Methods
2.1. The Water and Sanitation Sustainability Index

| Descriptor | Indicator | Short Description | Variable | Short Description |
|---|---|---|---|---|
| Availability | DW Quantity | Quantity of drinking water | Water Provision | Water from surface, sub-surface, and groundwater sources (L/p.d) |
| Trends | Quantity or quality trends | Aquifer Depth | Yearly average increase in the depth of water wells (m/year) | |
| DW Quality | Quality of drinking water | Residual Chlorine | Percentage of Residual Chlorine out of range in water samples (%) | |
| Arsenic Concentration | Percentage of arsenic out of range in water samples (%) | |||
| Infrastructure | Risks | Water safety | Water Safety | Relative risks identified by the Water Safety Plan (WSP) |
| Lifetime | Lifetime of water infrastructure | Infrastructure Age | Age of water and sanitation infrastructure (year) | |
| Diseases | Effects on human health | Water Related Diseases | Occurrence of diarrheas in children under five in critical areas | |
| Equity | Coverage | Spatial differences of services | Lack of Sewage Services | Population without sanitation services (critical areas/control) (%) |
| Access | Costs | Economic accessibility | Relative Water Costs | Proportion of minimum wage for water and sanitation services (%) |
| Information | Information accessibility | Web Sites | Assessment of the information contained in institutional web sites | |
| Rights | Access to basic water needs | Basic Water Allowance | Guaranteed amount of water for basic needs (L/p.d) | |
| Planning | Institutional Quality | Institutional capacity | Institutional Assessment | Assessment in terms of funds, planning, and personnel |
| Participation | Interactions | Participation instances | Participation Events | Number of significant participation events per year (Events/year) |
| Use | Consumption | Water consumption | Excess Consumption | Relative water consumption above a given target value (%) |
| Impact | Pollution | Environmental pollution | Untreated Sewage | Untreated/poorly treated sewage discharged into environment (%) |
| Satisfaction | Perception | Public perception | Complaints | Number of technical servicerelated complaints (No./1000 p) |
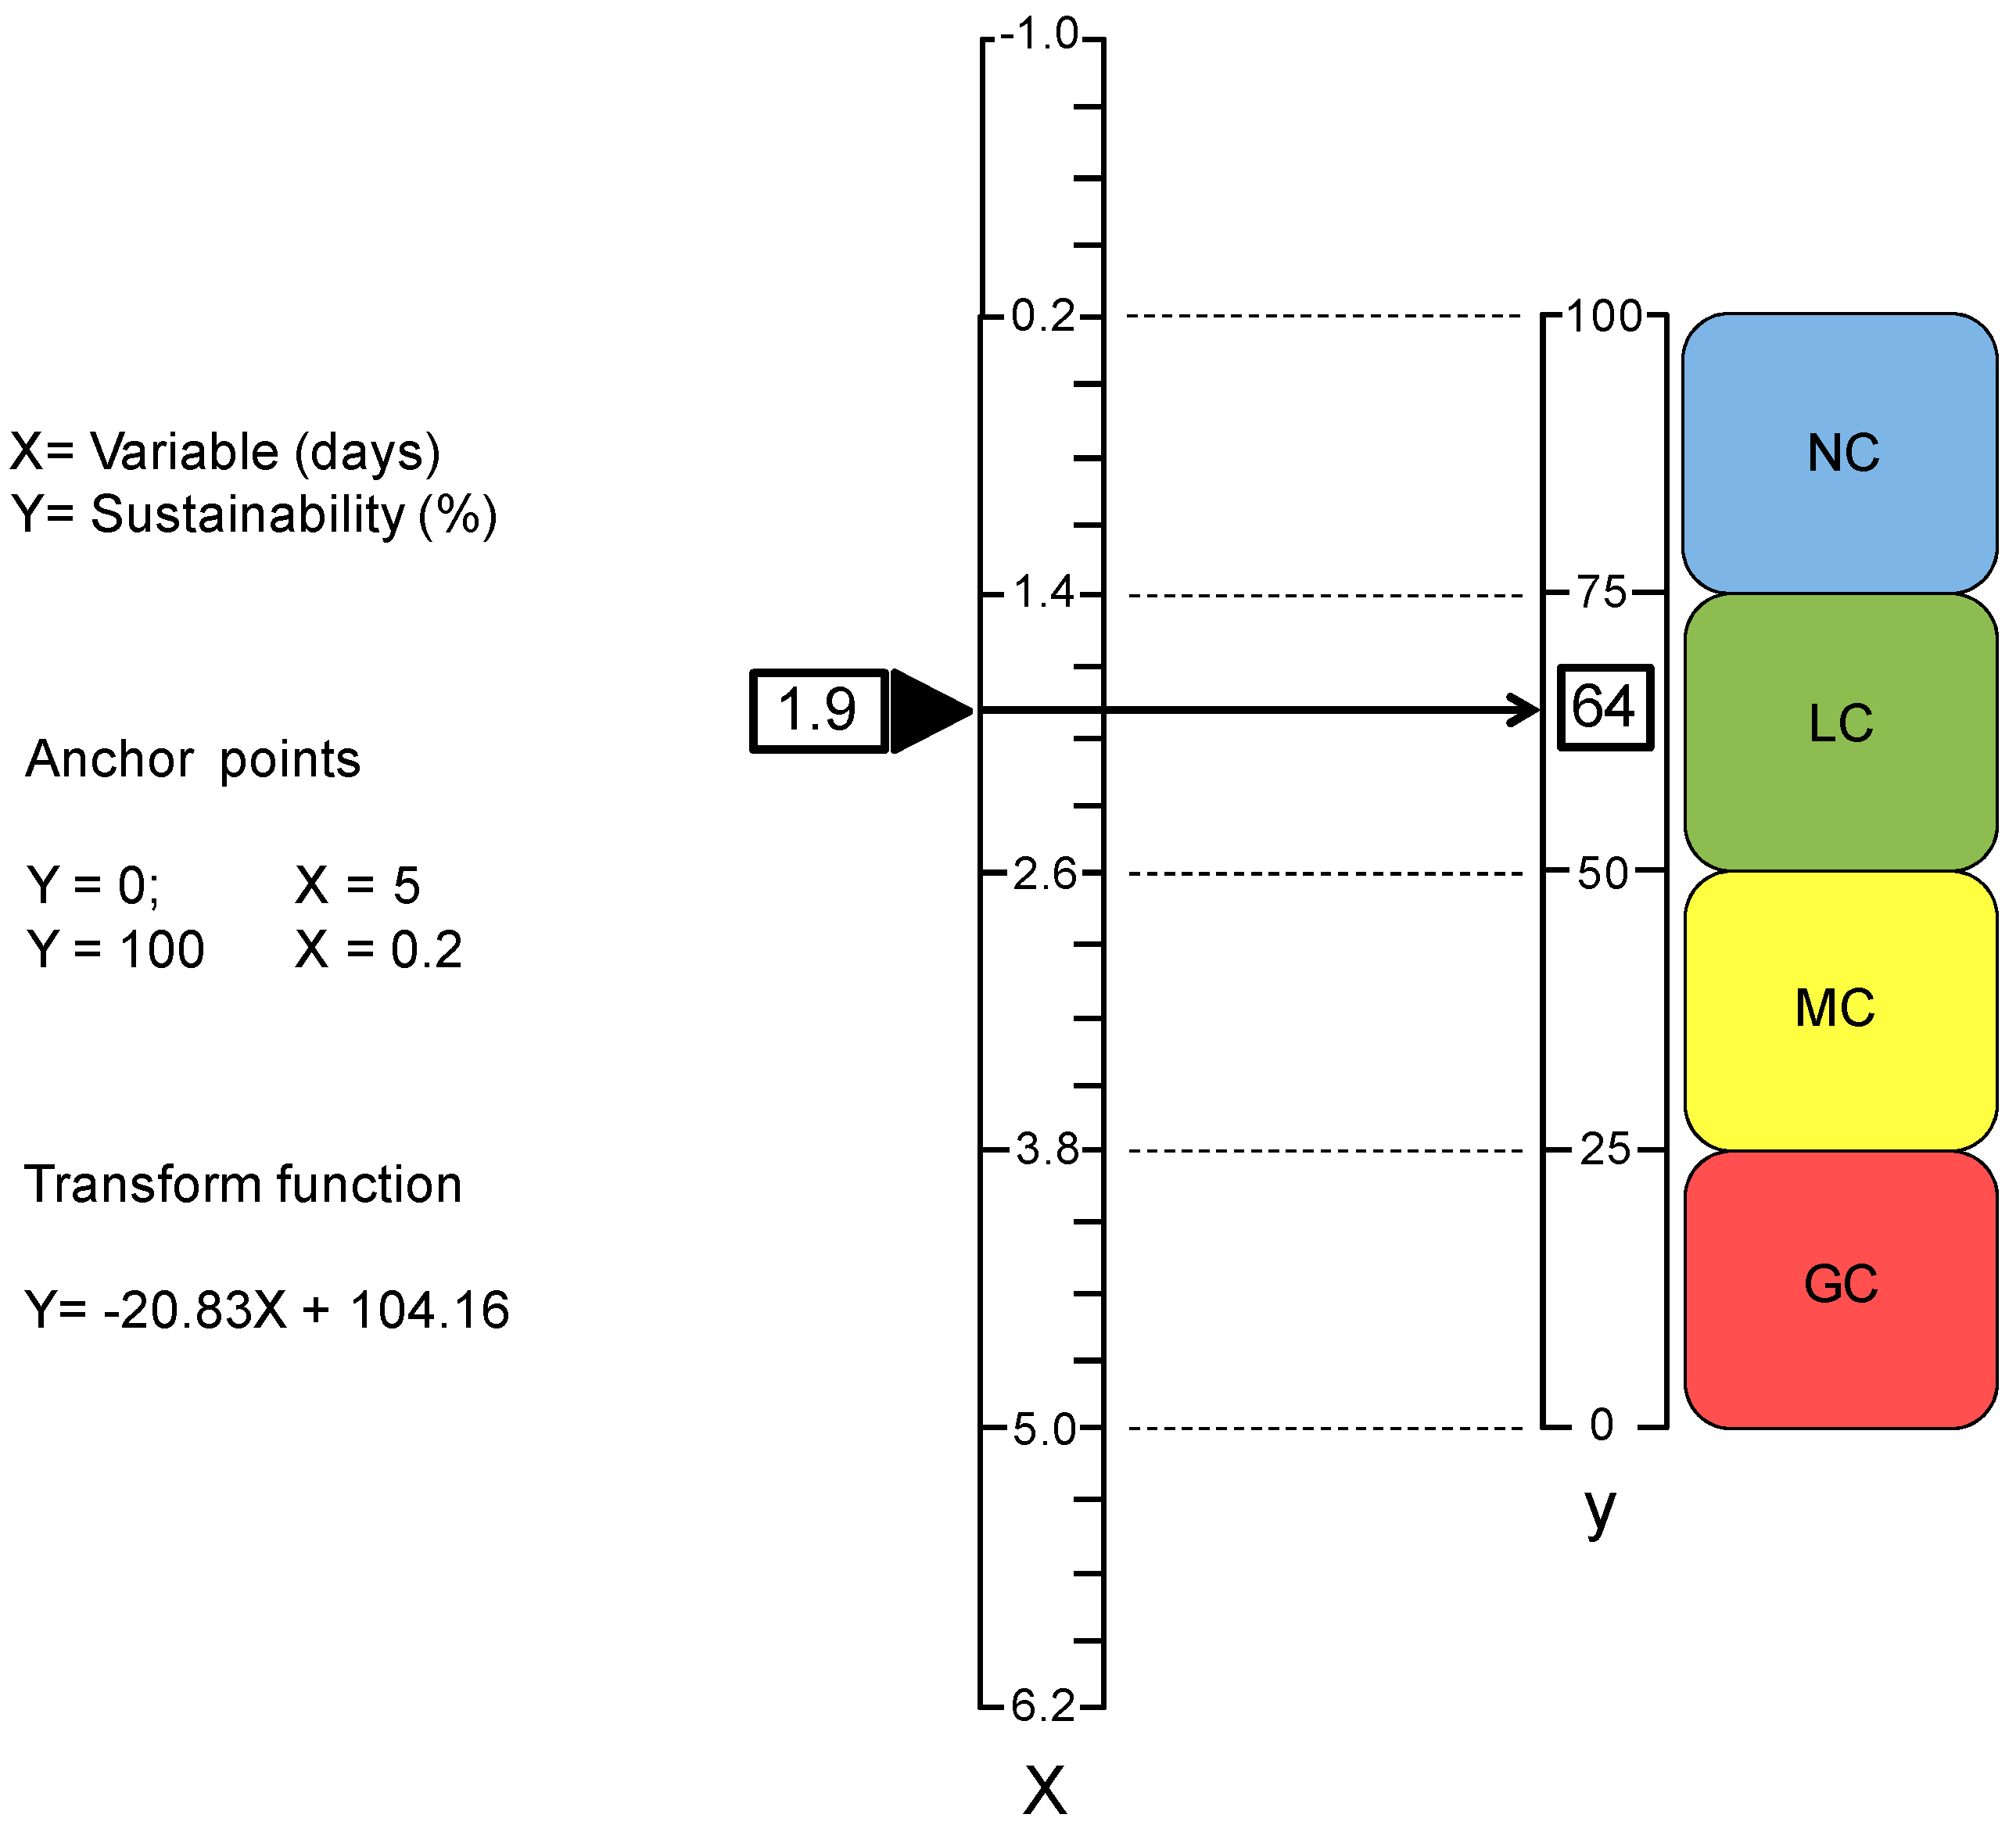
2.2. Index Calculation
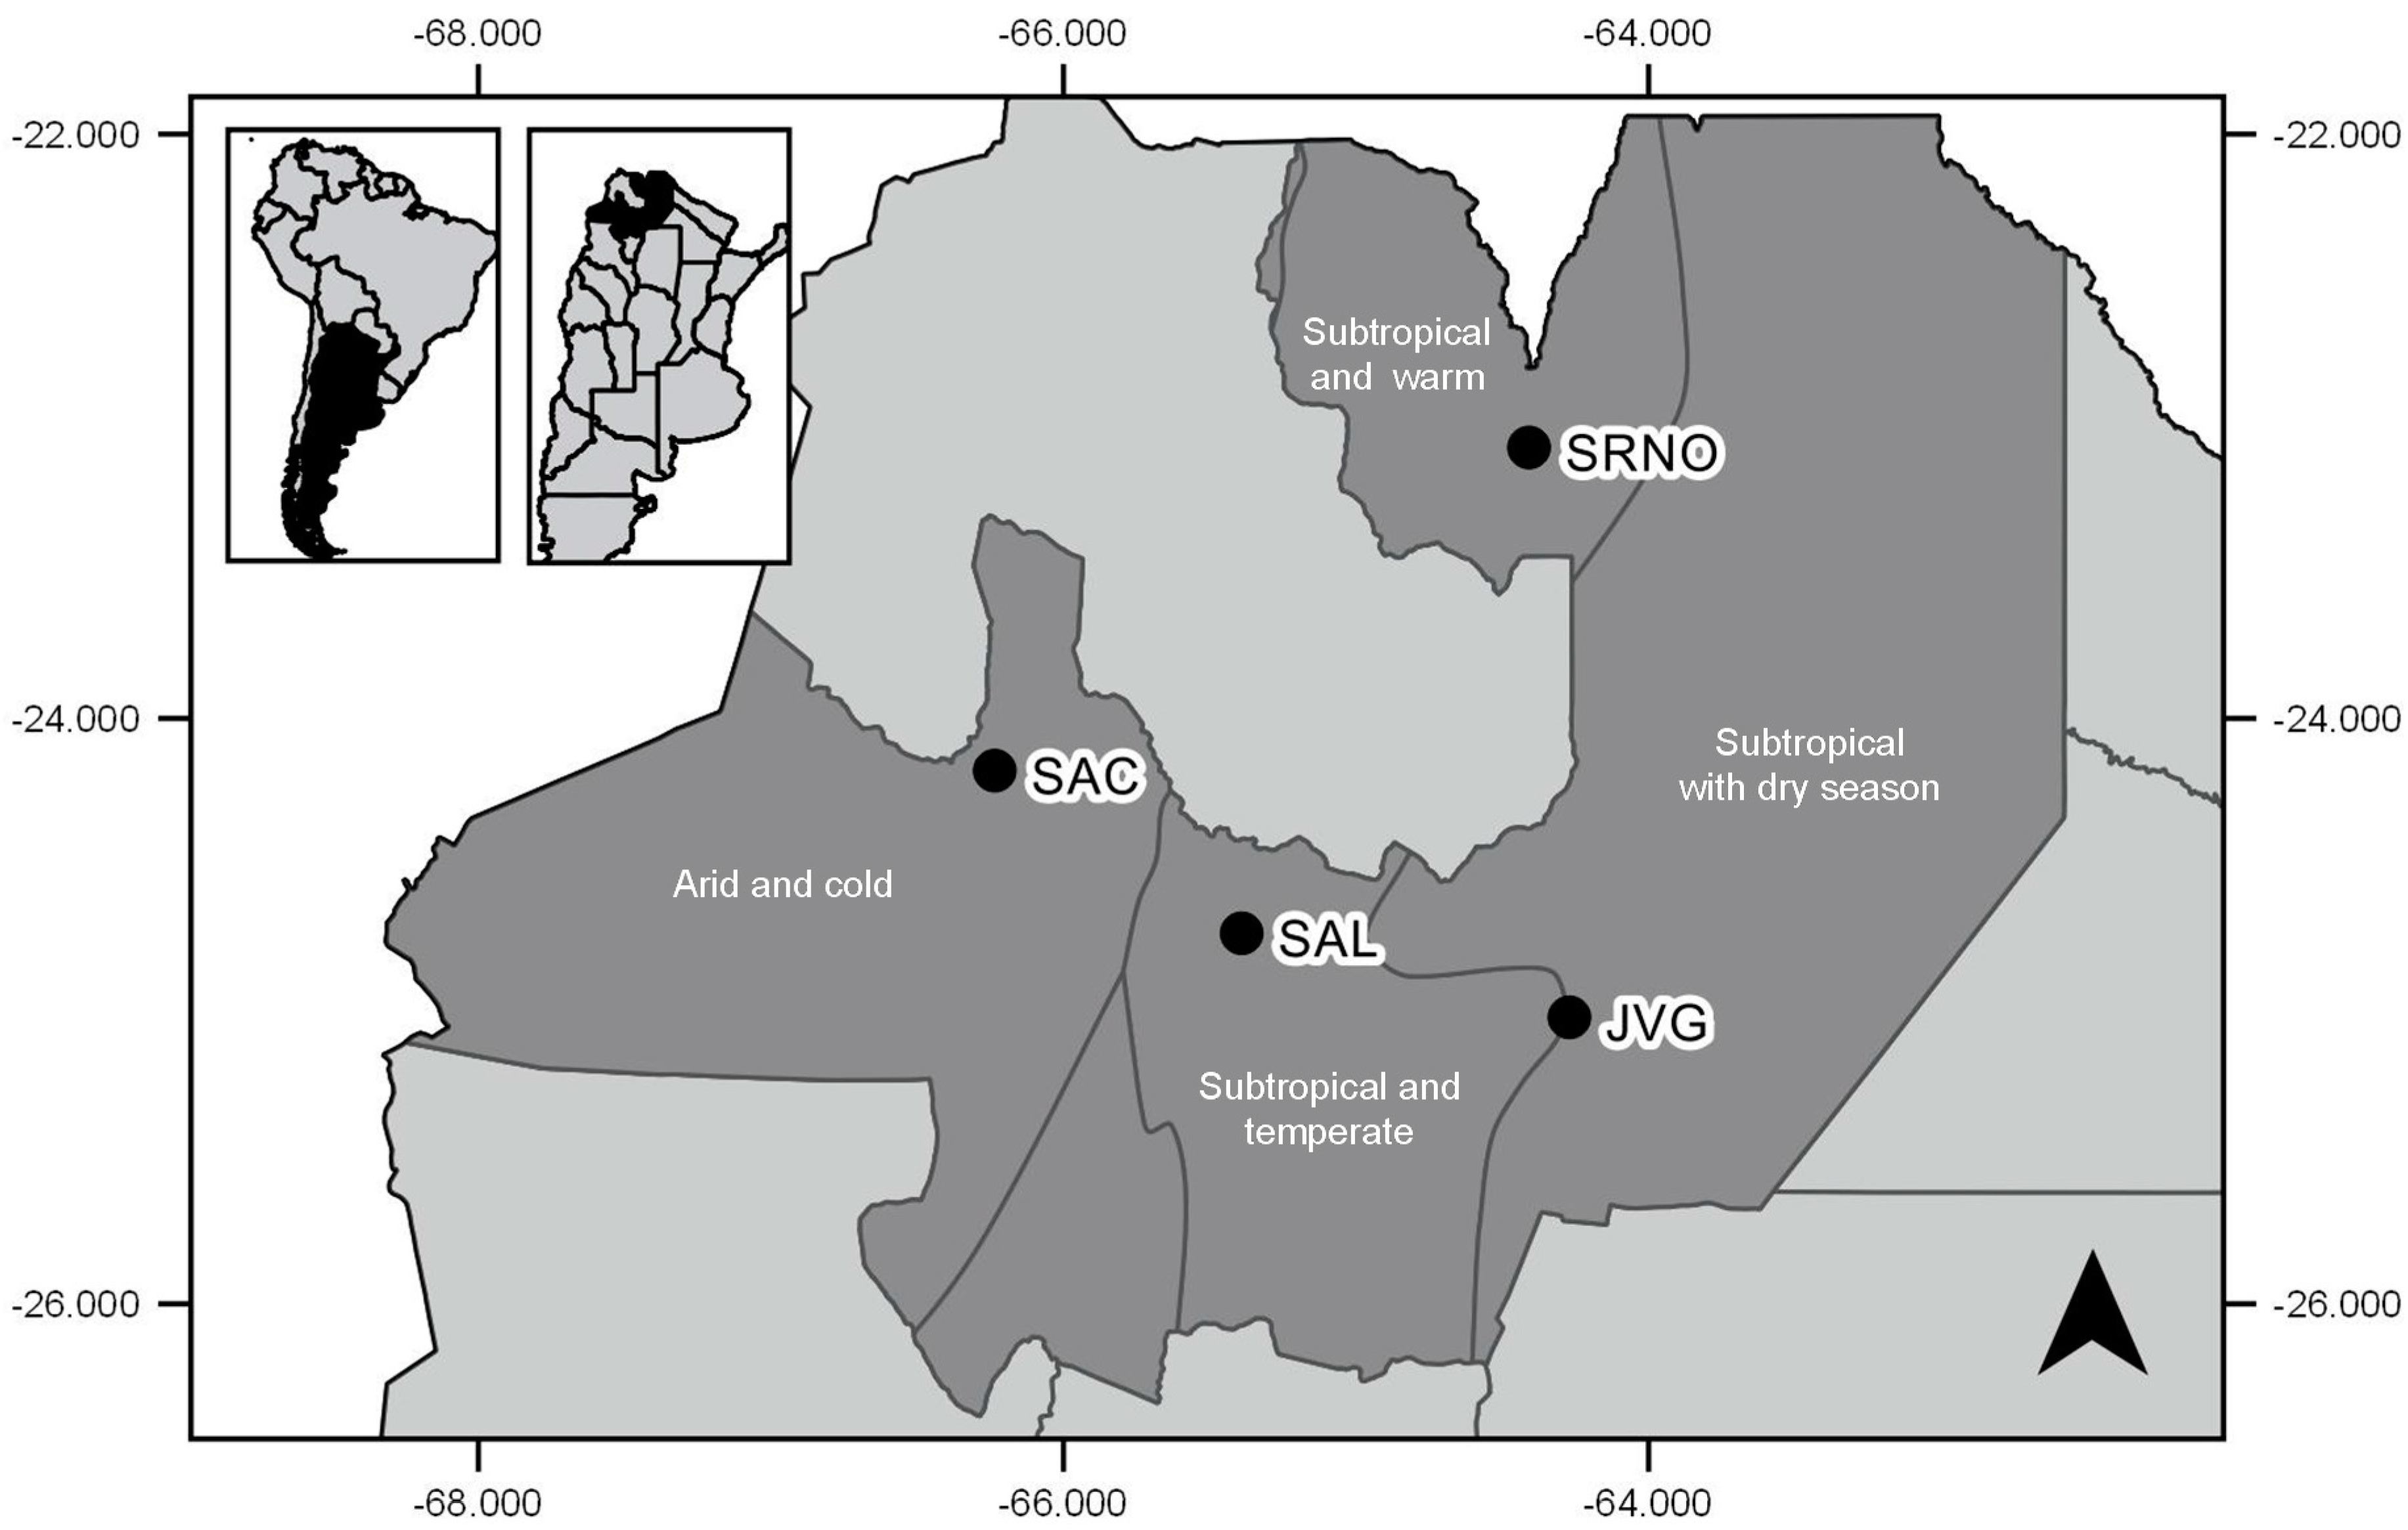
2.3. Case Studies
| Characteristic | City | |||
|---|---|---|---|---|
| SAL | SRNO | JVG | SAC | |
| Population | 535,300 | 84,000 | 13,300 | 6100 |
| Altitude (m.a.s.l.) | 1187 | 336 | 366 | 3775 |
| Type of climate | Subtropical and temperate | Subtropical and warm | Subtropical with a dry season | Arid and cold |
| Temperature (°C) | 16.9 | 22.3 | 21.5 | 7.7 |
| Rainfall (mm) | 689 | 945 | 578 | 117 |
| Water sources | Deep wells, surface and sub-surface water | Deep wells and sub-surface water | Deep wells | Small creek |
| Water coverage (%) | 94 | 82 | 80 | 78 |
| Sewerage (%) | 88 | 75 | 50 | 50 |
| Main problems | Population growth; aging infrastructure | Informal settlements; outbreaks of water-borne diseases | Water leakages; lack of local institutional capacity | Source water contains arsenic; understaffed water office |
| Others | Headquarters of CoSAySa, the provincial water company | Population with many basic needs despite intensive agro-industrial activities | Located at the center of the soybean region, in the flatland known as the “Chaco” region | Strong temperature fluctuations during the day (down to −20 °C in winter) |

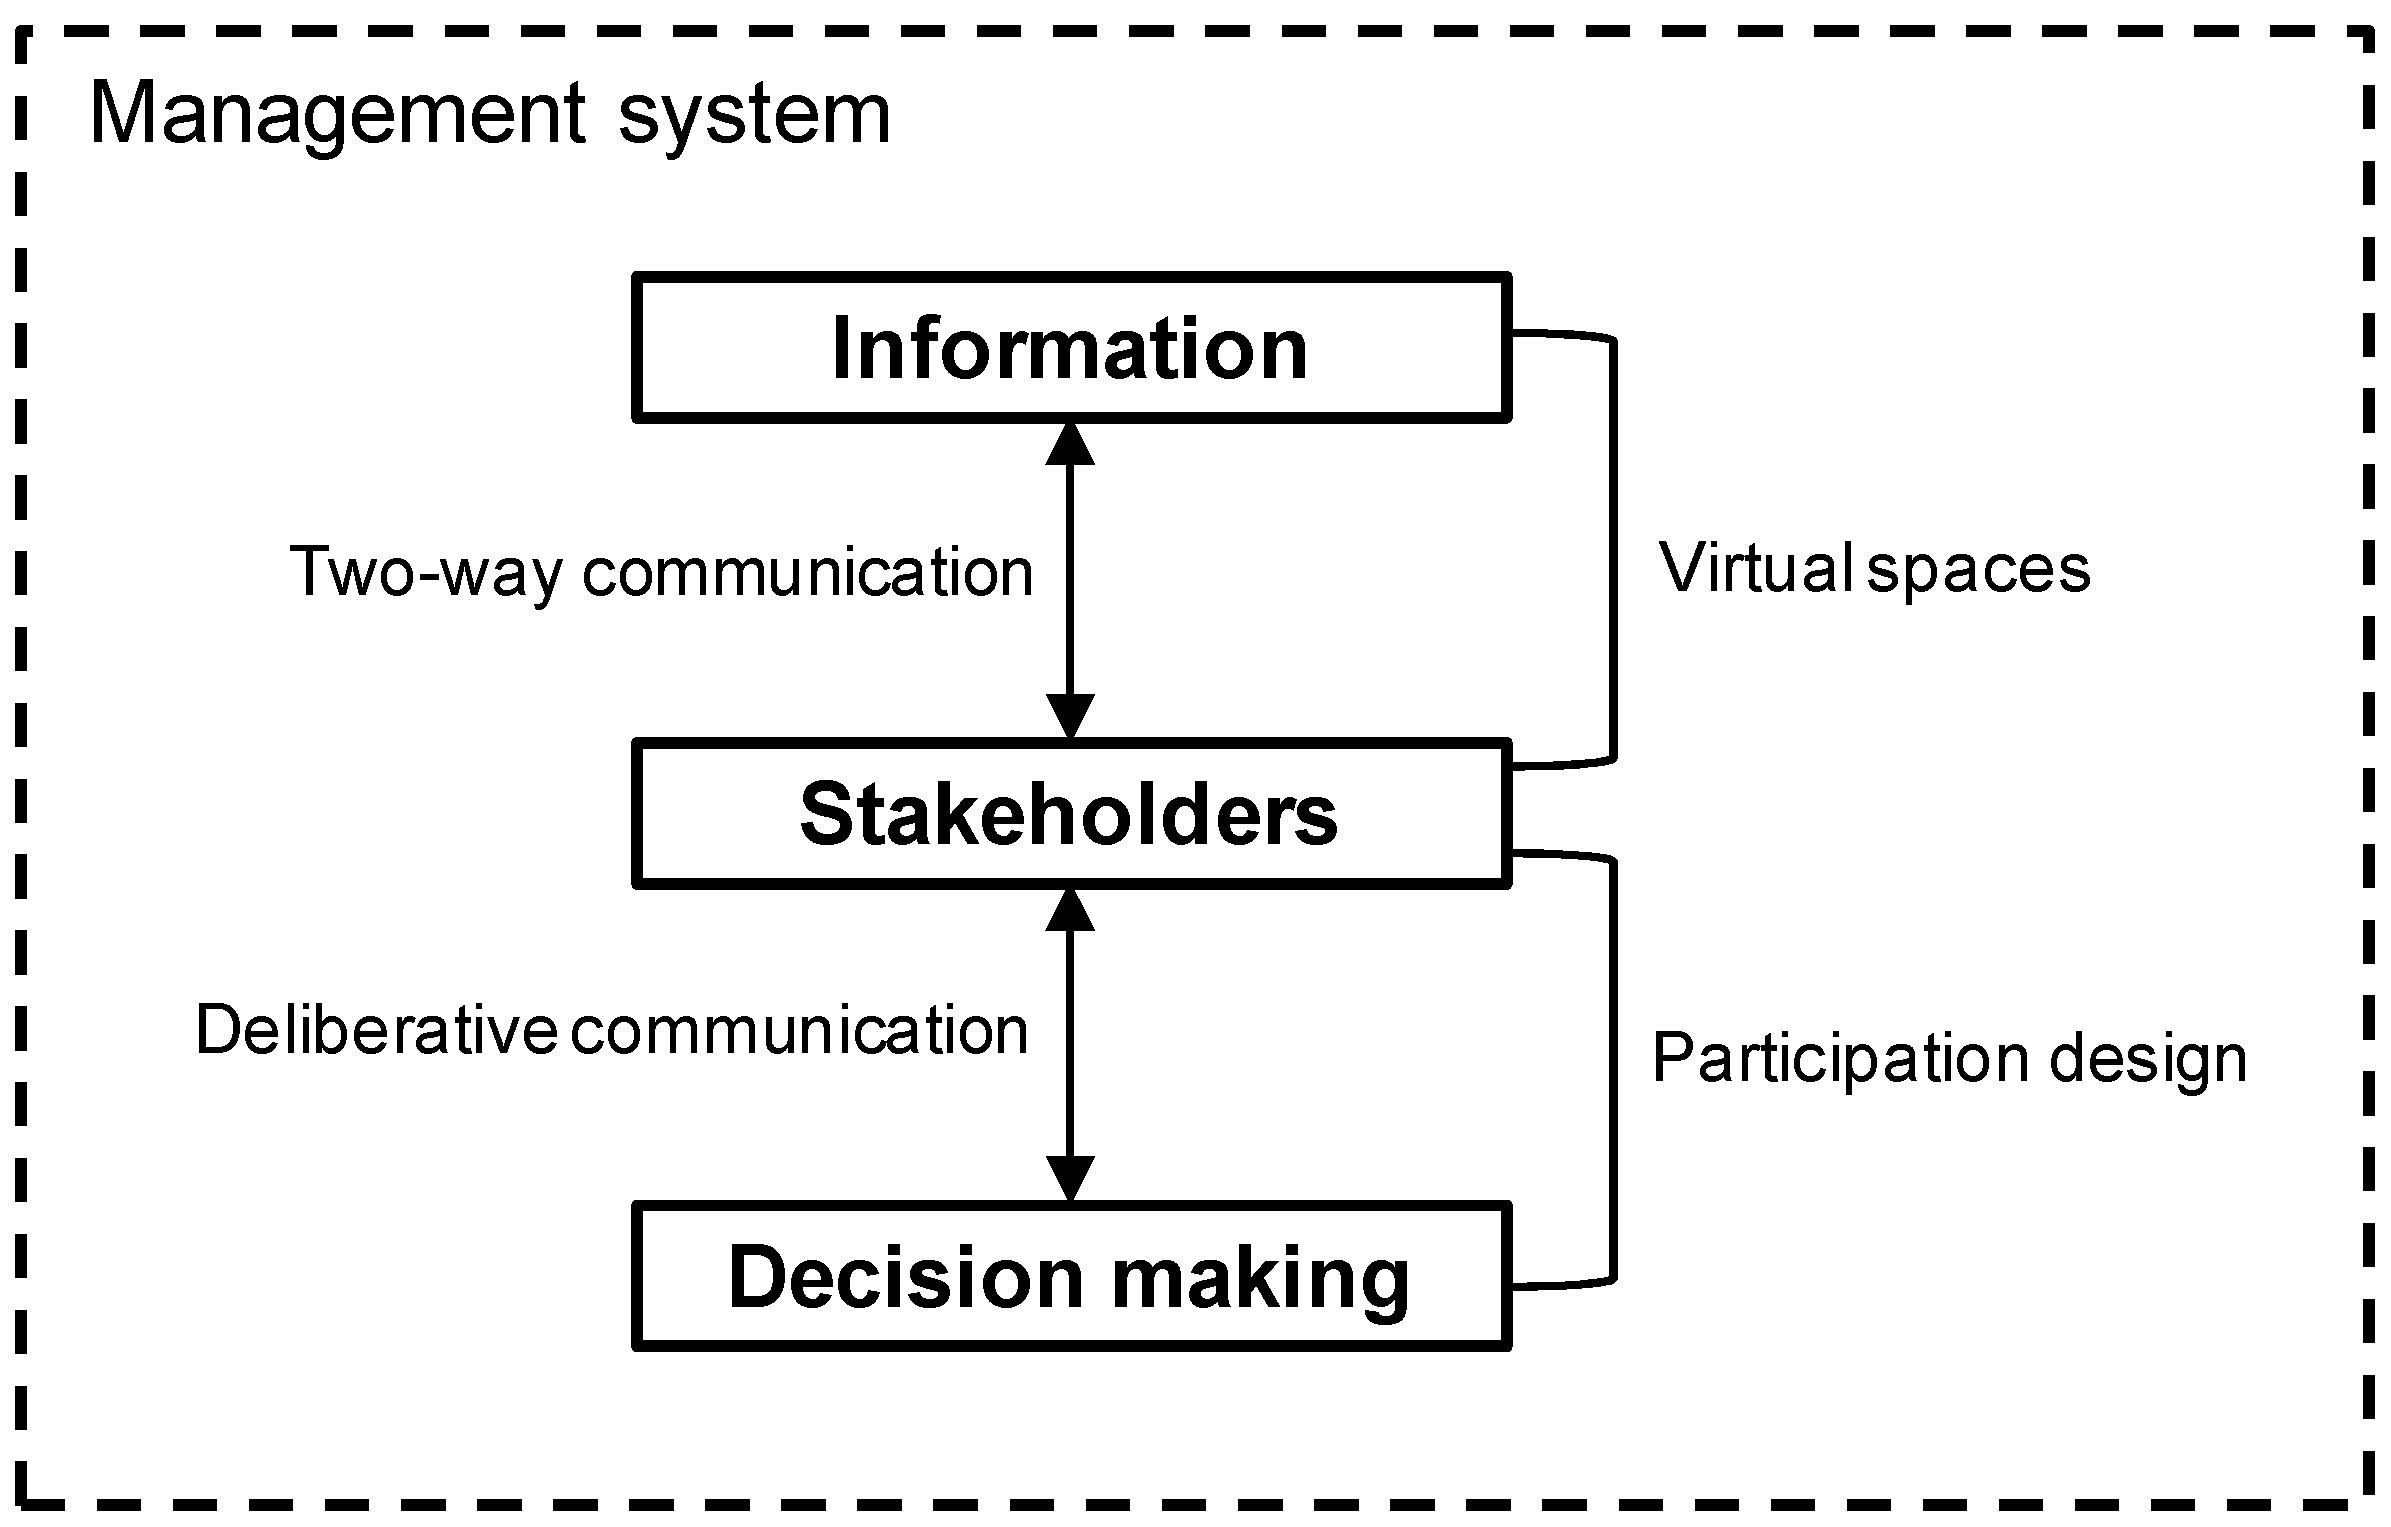
2.4. Virtual Interaction and Monitoring Spaces
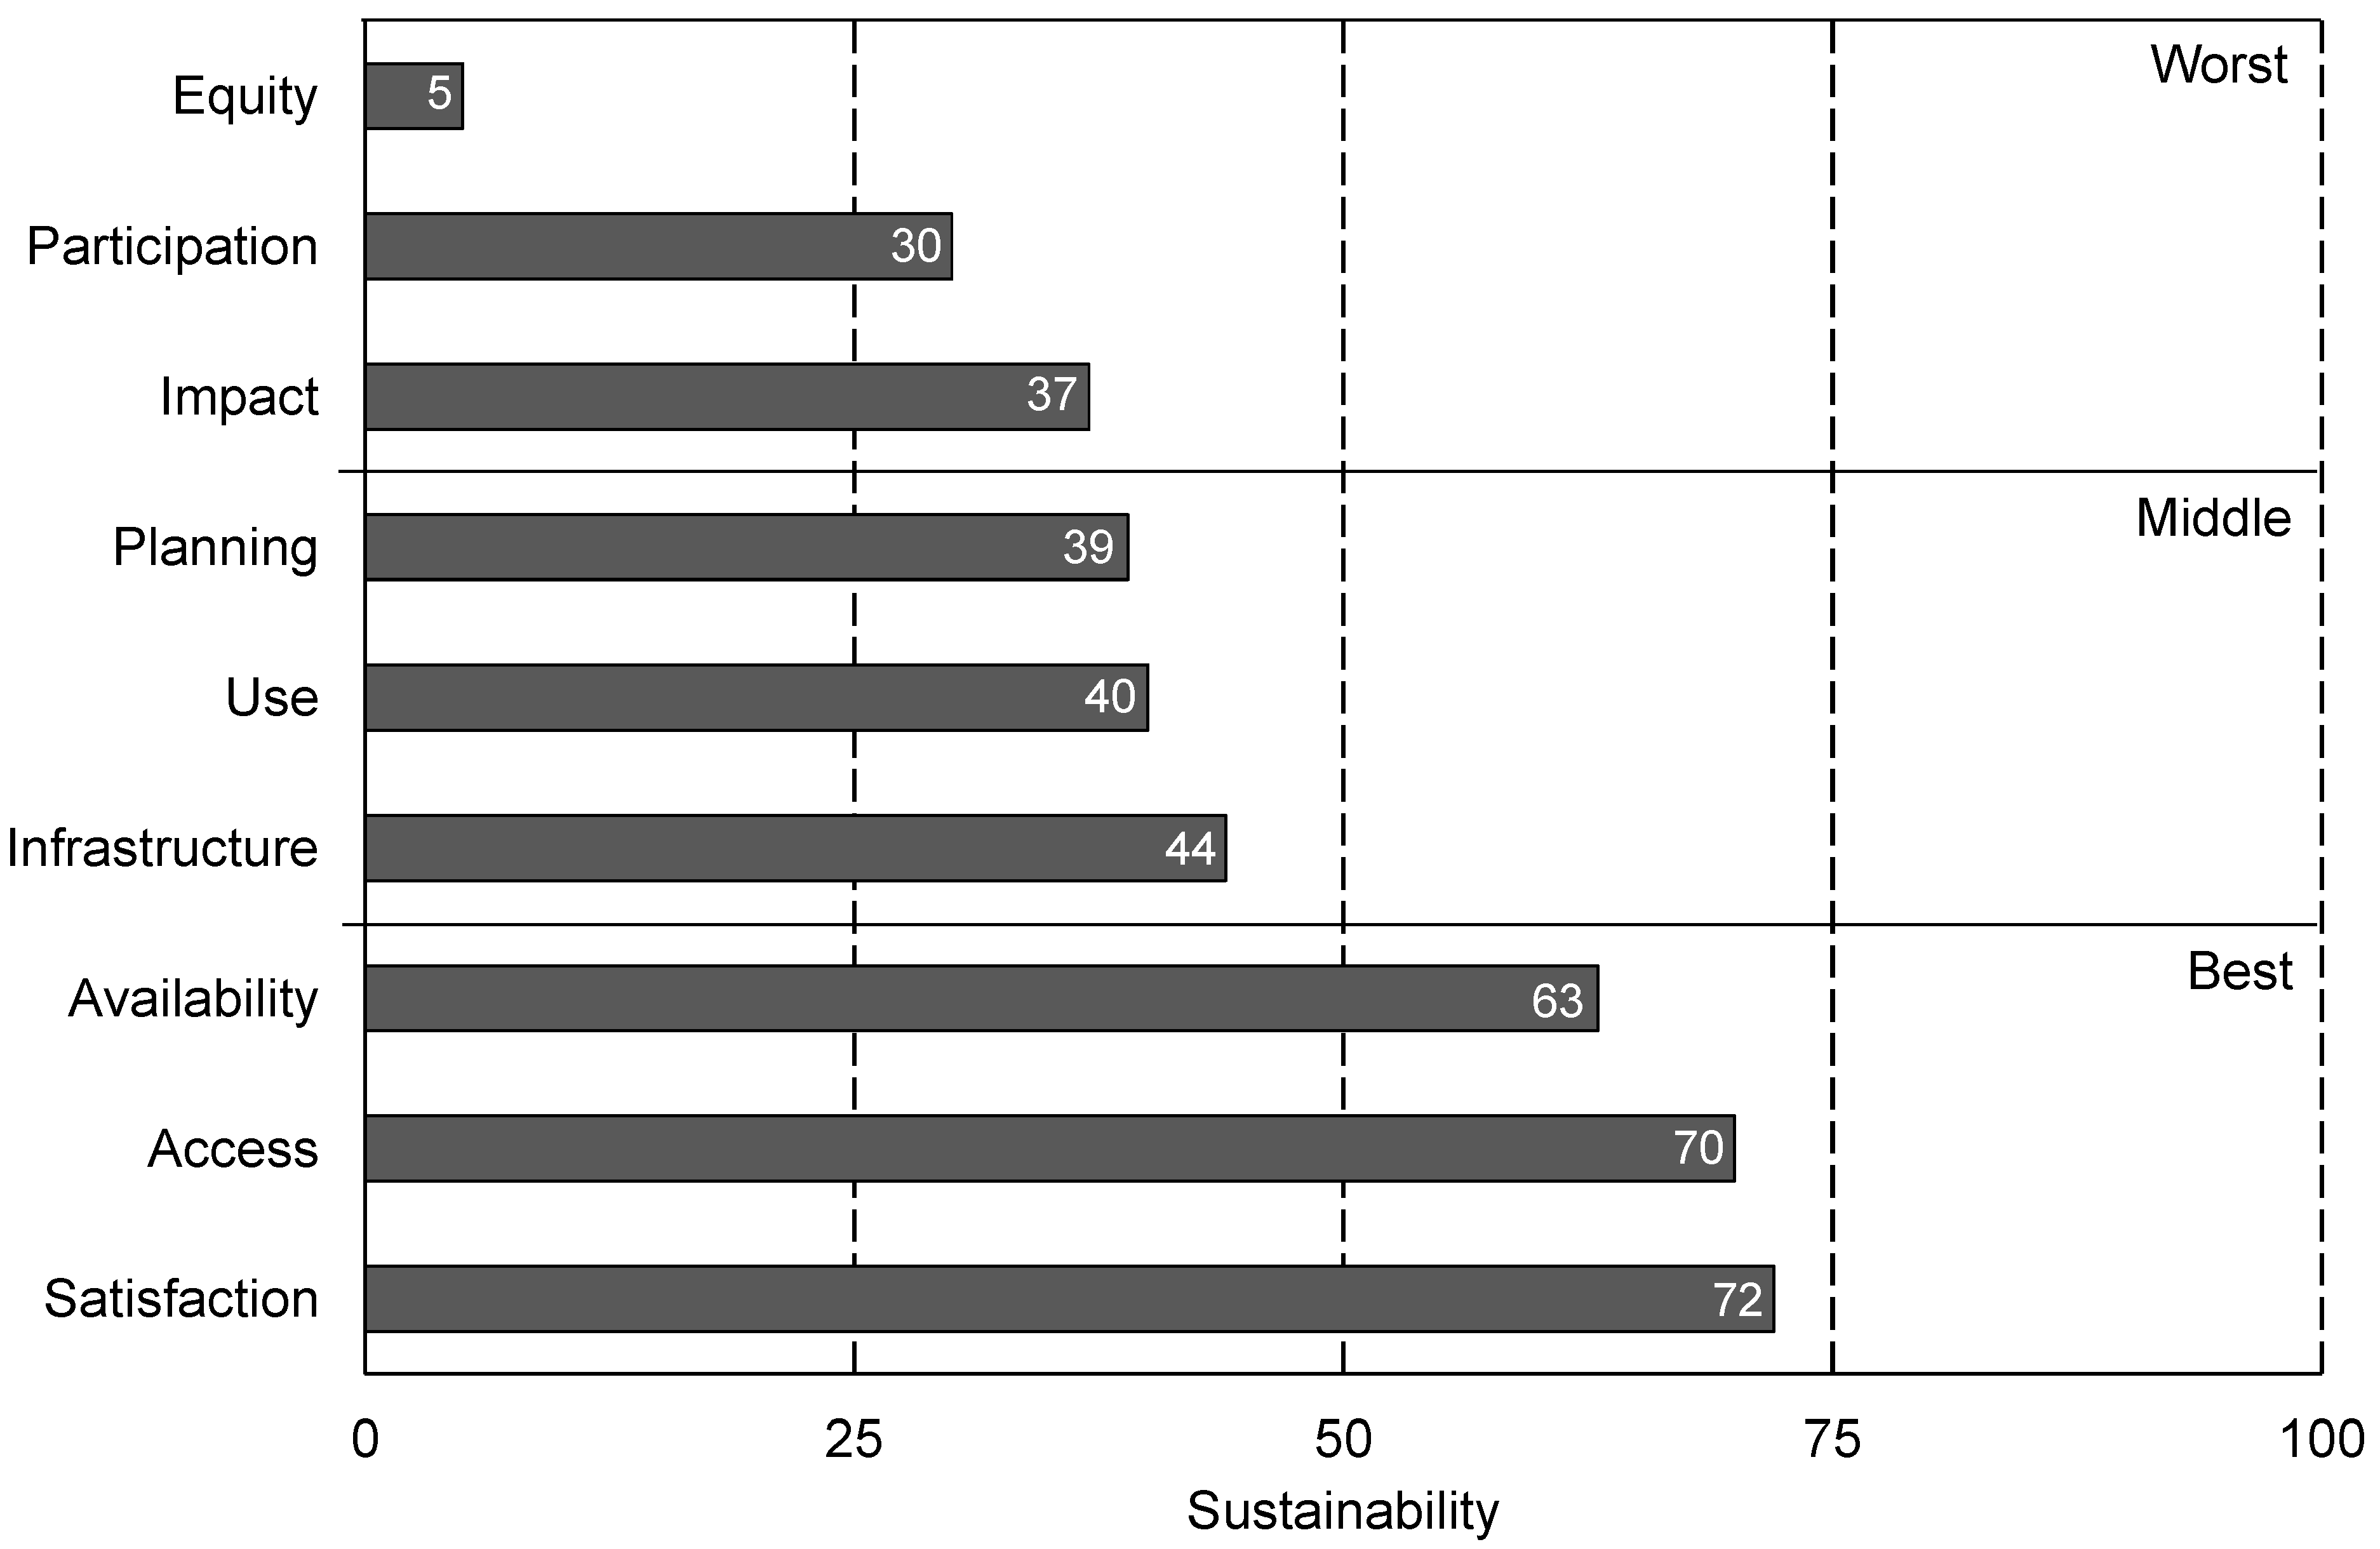
3. Results
| A | B | C | D | E | F | G | H | I | J | K | L | M | N | O | P | Q | R | |
|---|---|---|---|---|---|---|---|---|---|---|---|---|---|---|---|---|---|---|
| Indicators | Variables | Values | Units | Anchor Points | Sustainability | |||||||||||||
| Indicators | Descriptors | |||||||||||||||||
| SAL | SRNO | JVG | SAC | 0 | 100 | SAL | SRNO | JVG | SAC | SAL | SRNO | JVG | SAC | |||||
| 1 | DW Quantity | Water Provision | 489.3 | 805.5 | 386.0 | 157.0 | L/p.d | 50 | 250 | 100 | 100 | 100 | 43 | Availability | 59 | 73 | 100 | 21 |
| 2 | Trends | Aquifer Depth | 1.0 | 0.0 | m/y | 2 | 0 | 48 | 100 | |||||||||
| 3 | DW Quality | Residual Chlorine | 3.8 | 4.3 | 0.0 | % samples | 5 | 1 | 29 | 18 | 100 | |||||||
| 4 | Arsenic Concentration | 100.0 | % samples | 50 | 0 | 0 | ||||||||||||
| 5 | Risks | Water Safety | 30.7 | 42.2 | 46.4 | 42.7 | - | 100 | 0 | 69 | 58 | 54 | 57 | Infrastructure | 56 | 40 | 52 | 29 |
| 6 | Lifetime | Infrastructure Age | 28.8 | 40.0 | 35.0 | 50.0 | year | 50 | 20 | 71 | 33 | 50 | 0 | |||||
| 7 | Diseases | Water Related Diseases | 0.3 | 0.3 | - | 0 | 1 | 27 | 28 | |||||||||
| 8 | Coverage | Lack of Sewage Services | 84.0 | 100.0 | 100.0 | 100.0 | % | 100 | 15 | 19 | 0 | 0 | 0 | Equity | 19 | 0 | 0 | 0 |
| 9 | Costs | Relative Water Costs | 1.8 | 1.5 | 1.5 | 1.5 | % | 5 | 0.2 | 68 | 74 | 74 | 74 | Access | 68 | 70 | 70 | 70 |
| 10 | Information | Web Sites | 36.7 | 36.7 | 36.7 | 36.7 | - | 0 | 100 | 37 | 37 | 37 | 37 | |||||
| 11 | Rights | Basic Water Allowance | 87.7 | 79.3 | 79.3 | 79.3 | L/p.d | 5 | 50 | 100 | 100 | 100 | 100 | |||||
| 12 | Institutional Quality | Institutional Assessment | 62.6 | 23.3 | 36.0 | 31.8 | - | 0 | 100 | 63 | 23 | 36 | 32 | Planning | 63 | 23 | 36 | 32 |
| 13 | Interactions | Participation Events | 0.2 | 0.4 | 0.6 | 0.0 | Events/year | 0 | 1 | 20 | 40 | 60 | 0 | Participation | 20 | 40 | 60 | 0 |
| 14 | Consumption | Excess Consumption | 82.8 | 53.5 | 19.4 | −78.3 | % | 50 | 0 | 0 | 0 | 61 | 100 | Use | 0 | 0 | 61 | 100 |
| 15 | Pollution | Untreated Sewage | 41.4 | 28.2 | 31.4 | 26.0 | % | 50 | 0 | 17 | 44 | 37 | 48 | Impact | 17 | 44 | 37 | 48 |
| 16 | Perception | Complaints | 190.0 | 38.8 | 56.7 | 4.2 | No./1000 p | 250 | 4 | 24 | 86 | 79 | 100 | Satisfaction | 24 | 86 | 79 | 100 |
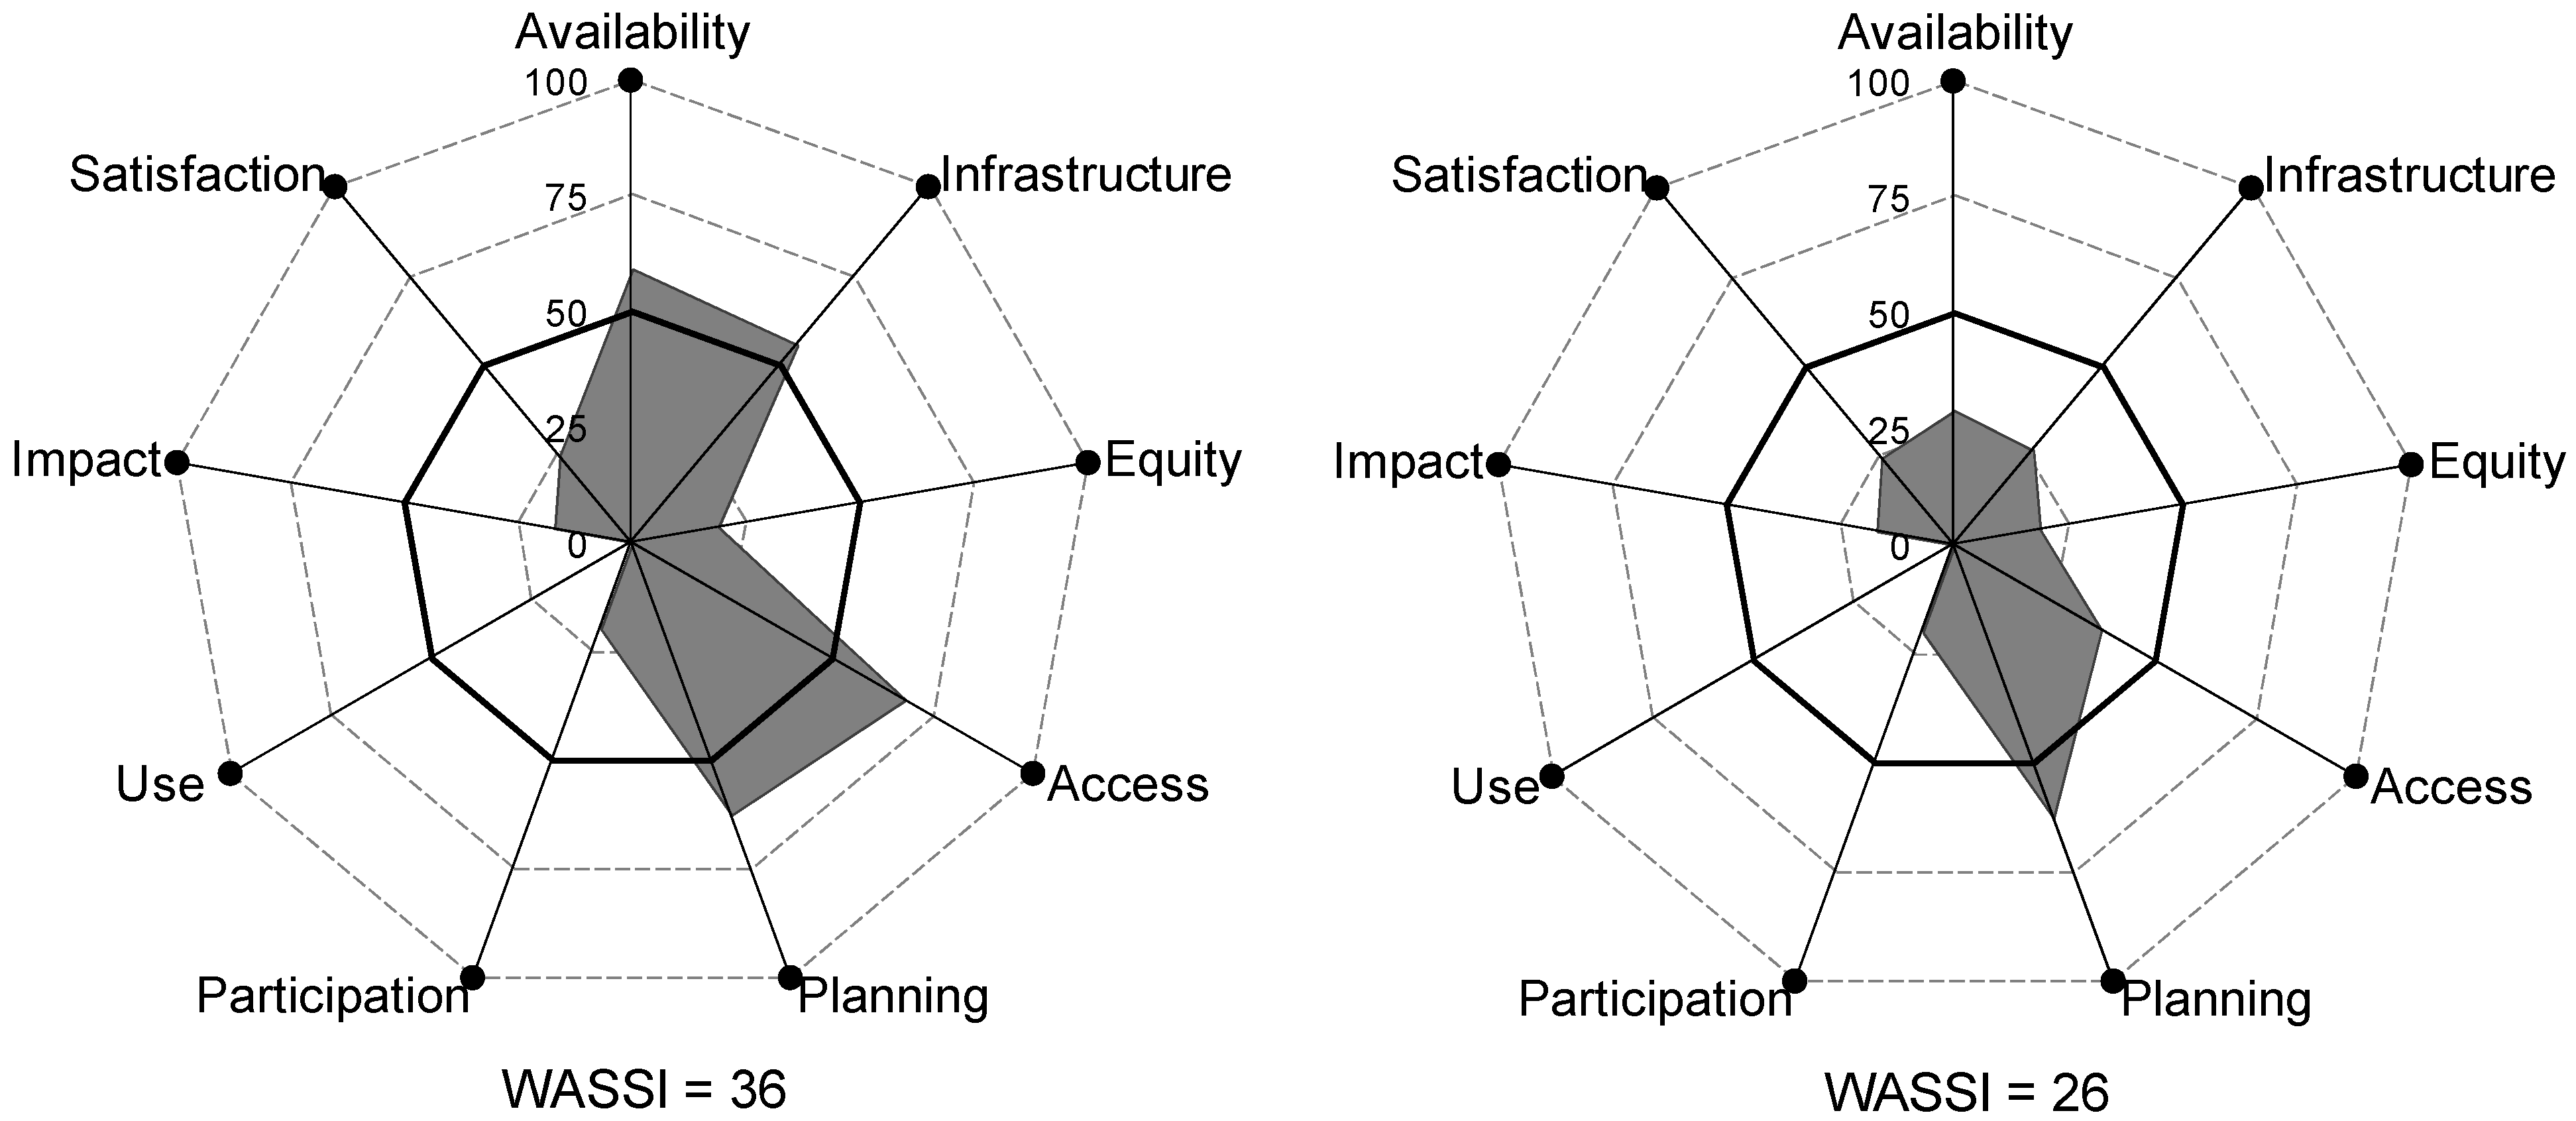
| WASSI = | 36 | 42 | 55 | 37 | ||||||||||||||
| Sustainability range = | MC | MC | LC | MC | ||||||||||||||
4. Discussion
4.1. Scope and Limitations of the WASSI
4.2. Sustainability or Un-Sustainability?
4.3. From Indicators to Policies

| Stakeholders (Perspectives) | Information on the Water System | Government Proficiency | Participation Processes | Stakeholders Commitment | Relevance of Virtual Spaces |
|---|---|---|---|---|---|
| A | Low | Low technical expertise; little decision power | Poor; should be improved | Low; little knowledge on the water system | High; virtual spaces useful and feasible |
| B | Sufficient | Enough technical expertise; little decision power | Adequate | Low; little knowledge on the water system | High; virtual spaces useful and feasible |
| C | Low | Low technical expertise; little decision power | Poor; should be improved | Very low; unaware of the problems | High; virtual spaces useful and feasible |
| D | Low | Low technical expertise; little decision power | None; Water Company not interested | High; very aware of the problems in the water system | High; virtual spaces useful and feasible |
5. Conclusions
Acknowledgments
Author Contributions
Conflicts of Interest
References
- Bossel, H. Indicators for Sustainable Development: Theory, Method, Applications. A Report to the Balaton Group; International Institute for Sustainable Development (IISD): Winnipeg, MB, Canada, 1999. [Google Scholar]
- Bell, B.; Morse, S. Sustainability Indicators: Measuring the Immeasurable? Earthscan Publications Ltd.: London, UK, 2008. [Google Scholar]
- Valentin, A.; Spangenberg, J.H. A guide to community sustainability indicators. Environ. Impact Assess. Rev. 2000, 20, 381–392. [Google Scholar] [CrossRef]
- López Ridaura, S. Multi-Scale Sustainability Evaluation. A Framework for the Derivation and Quantification of Indicators for Natural Resource Management Systems. Ph.D. Thesis, Wageningen University, Wageningen, The Netherlands, 2005. [Google Scholar]
- Ness, B.; Urbel-Piirsalu, E.; Anderberg, S.; Olsson, L. Categorizing tools for sustainability assessment. Ecol. Econ. 2007, 60, 498–508. [Google Scholar] [CrossRef]
- Van de Kerk, G.; Manuel, A. A Comprehensive index for a sustainable society: The SSI—The Sustainable Society Index. Ecol. Econ. 2008, 66, 228–242. [Google Scholar] [CrossRef]
- Walter, C.; Stützel, H. A new method for assessing the sustainability of land-use systems: Identifying the relevant issues. Ecol. Econ. 2009, 68, 1275–1287. [Google Scholar] [CrossRef]
- Stringer, L.C.; Dougill, A.J.; Fraser, E.; Hubacek, K.; Prell, C.; Reed, M.S. Unpacking “participation” in the adaptive management of social-ecological systems: A Critical review. Ecol. Soc. 2006, 11. Article 39. Available online: http://www.ecologyandsociety.org/vol11/iss2/art39/ (accessed on 12 April 2015). [Google Scholar]
- Becker, J. Measuring progress towards sustainable development: An ecological framework for selecting indicators. Local Environ. 2005, 10, 87–101. [Google Scholar] [CrossRef]
- Mineur, E. Towards Sustainable Development Indicators as a Tool of Local Governance; Department of Political Science, Umea University: Umea, Sweden, 2007. [Google Scholar]
- Seghezzo, L. The five dimensions of sustainability. Environ. Polit. 2009, 18, 539–556. [Google Scholar] [CrossRef]
- McCool, S.; Stankey, G. Indicators of sustainability: Challenges and opportunities at the interface of science and policy. Environ. Manag. 2004, 33, 294–305. [Google Scholar] [CrossRef] [PubMed]
- Gibson, R.B. Beyond the pillars: Sustainability assessment as a framework for effective integration of social, economic and ecological considerations in significant decision-making. JEAPM 2006, 8, 259–280. [Google Scholar] [CrossRef]
- Blühdorn, I.; Welsh, I. Eco-politics beyond the paradigm of sustainability: A conceptual framework and research agenda. Environ. Polit. 2007, 16, 185–205. [Google Scholar] [CrossRef]
- Rametsteiner, E.; Pülzl, H.; Alkan-Olsson, J.; Frederiksen, P. Sustainability indicator development—Science or political negotiation? Ecol. Indic. 2011, 11, 61–70. [Google Scholar] [CrossRef]
- Garnåsjordet, P.A.; Aslaksen, I.; Giampietro, M.; Funtowicz, S.; Ericson, T. Sustainable development indicators: From statistics to policy. Environ. Policy Gov. 2012, 22, 322–336. [Google Scholar] [CrossRef]
- Reed, M.; Kenter, J.; Bonn, A.; Broad, K.; Burt, T.P.; Fazey, I.R.; Hubacek, K.; Nainggolan, D.; Quinn, C.H.; Stringer, L.C.; et al. Participatory scenario development for environmental management: A methodological framework illustrated with experience from the UK uplands. J. Environ. Manag. 2013, 128, 345–362. [Google Scholar] [CrossRef] [PubMed]
- Shen, L.-Y.; Ochoa, J.J.; Shah, M.N.; Zhang, X. The application of urban sustainability indicators—A comparison between various practices. Habitat Int. 2011, 35, 17–29. [Google Scholar] [CrossRef]
- Iribarnegaray, M.A.; de la Zerda, F.; Hutton, C.M.; Brannstrom, C.; Liberal, V.; Tejerina, W.; Seghezzo, L. Water-conservation policies in perspective: Insights from a Q-method study in Salta, Argentina. Water Policy 2014, 16, 897–916. [Google Scholar] [CrossRef]
- Hellström, D.; Jeppsson, U.; Kärrman, E. A framework for systems analysis of sustainable urban water management. Environ. Impact Assess. Rev. 2000, 20, 311–321. [Google Scholar] [CrossRef]
- Molle, F.; Mollinga, P. Water poverty indicators: Conceptual problems and policy issues. Water Policy 2003, 5, 529–544. [Google Scholar]
- Dinar, A.; Saleth, R.M. Can water institutions be cured? A water institutions health index. Water Supply 2005, 5, 17–40. [Google Scholar]
- Iribarnegaray, M.A.; Copa, F.R.; Gatto D’Andrea, M.L.; Arredondo, M.F.; Cabral, J.D.; Correa, J.J.; Liberal, V.I.; Seghezzo, L. A comprehensive index to assess the sustainability of water and sanitation management systems. J. Water Sanit. Hyg. Dev. 2012, 2, 205–222. [Google Scholar] [CrossRef]
- Lemos, D.; Cláudia Dias, A.; Gabarrell, X.; Arroja, L. Environmental assessment of an urban water system. J. Clean. Prod. 2013, 54, 157–165. [Google Scholar] [CrossRef]
- Kayser, G.L.; Moriarty, P.; Fonseca, C.; Bartram, J. Domestic water service delivery indicators and frameworks for monitoring, evaluation, policy and planning: A review. Int. J. Environ. Res. Public Health. 2013, 10, 4812–4835. [Google Scholar] [CrossRef] [PubMed]
- UN (United Nations). The Road to Dignity by 2030: Ending Poverty, Transforming all Lives and Protecting the Planet. Available online: http://www.un.org/ga/search/view_doc.asp?symbol=A/69/700&Lang=E (accessed on 20 May 2015).
- Bond, A.J.; Morrison-Saunders, A. Re-evaluating sustainability assessment: Aligning the vision and the practice. Environ. Impact Assess. Rev. 2011, 31, 1–7. [Google Scholar] [CrossRef]
- Boyko, C.; Gaterell, M.R.; Barber, A.R.; Brown, J.; Bryson, J.R.; Butler, D.; Caputo, S.; Caserio, M.; Coles, R.; Cooper, R.; et al. Benchmarking sustainability in cities: The role of indicators and future scenarios. Glob. Environ. Change 2012, 22, 245–254. [Google Scholar] [CrossRef]
- Dahl, A.L. Achievements and gaps in indicators for sustainability. Ecol. Indic. 2012, 17, 14–19. [Google Scholar] [CrossRef]
- Griggs, D.; Stafford-Smith, M.; Gaffney, O.; Rockström, J.; Öhman, M.; Shyamsundar, P.; Steffen, W.; Glaser, G.; Kanie, N.; Noble, I. Sustainable development goals for people and planet. Nature 2013, 495, 305–307. [Google Scholar] [CrossRef] [PubMed]
- Plumecocq, G. Rhetoric as a means for sustainable development policy. Environ. Values 2014, 23, 529–549. [Google Scholar] [CrossRef]
- Bell, S. Renegotiating urban water. Prog. Plan. 2015, 96, 1–28. [Google Scholar] [CrossRef]
- Thomson, P.; Hope, R.A.; Foster, T. Is silence golden? Of mobiles, monitoring, and rural water supplies. Waterlines 2012, 31, 280–292. [Google Scholar] [CrossRef]
- Ball, M.; Rahman, Z.; Champanis, M.; Rivett, U.; Khush, R. Mobile data tools for improving information flow in WASH: Lessons from three field pilots. In Proceedings of the IRC Symposium on Monitoring Sustainable WASH Service Delivery, Addis Ababa, Ethiopia, 9–11 April 2013; pp. 1–13.
- Estevez, E.; Janowski, T. Electronic governance for sustainable development. Conceptual framework and state of research. Gov. Inform. Q. 2013, 30, S94–S109. [Google Scholar] [CrossRef]
- Nel, P.J.C.; Booysen, M.J.; van der Merwe, B. ICT-enabled solutions for smart management of water supply in Africa. In Proceedings of the First International Conference on the Use of Mobile Informations and Communication Technology (ICT) in Africa, Stellenbosch, South Africa, 9–10 December 2014; pp. 40–44.
- Bakker, K.; Morinville, C. The governance dimensions of water security: A review. Philos. Trans. R. Soc. Lond. A 2013, 371. [Google Scholar] [CrossRef] [PubMed]
- Biggs, E.M.; Duncan, J.; Atkinson, P.M.; Dash, J. Plenty of water, not enough strategy. How inadequate accessibility, poor governance and a volatile government can tip the balance against ensuring water security: The case of Nepal. Environ. Sci. Policy 2013, 33, 388–394. [Google Scholar] [CrossRef]
- Organization for Economic Co-operation and Development (OECD). Water Governance in Latin America and the Caribbean. A Multi-level Approach; OECD Publishing: Paris, France, 2012. [Google Scholar]
- Iribarnegaray, M.A.; Seghezzo, L. Governance, sustainability and decision making in water and sanitation management systems. Sustainability 2012, 4, 2922–2945. [Google Scholar] [CrossRef]
- Torquebiau, E. Are tropical agroforestry home gardens sustainable? Agric. Ecosyst. Environ. 1992, 41, 189–207. [Google Scholar] [CrossRef]
- Belton, V.; Bell, A. Comparison of the analytic hierarchy process and a simple multi-attribute value function. Eur. J. Oper. Res. 1986, 26, 7–21. [Google Scholar] [CrossRef]
- Singh, R.K.; Murty, H.R.; Guptac, S.K.; Dikshit, A.K. An overview of sustainability assessment methodologies. Ecol. Ind. 2012, 15, 281–299. [Google Scholar] [CrossRef]
- Saaty, T.L. Relative Measurement and its generalization in decision making. Why pairwise comparisons are central in mathematics for the measurement of intangible factors: The Analytic Hierarchy/Network Process. RACSAM 2008, 102, 251–318. [Google Scholar] [CrossRef]
- Seghezzo, L.; Gatto D’Andrea, M.L.; Iribarnegaray, M.; Liberal, V.; Fleitas, A.; Bonifacio, J.L. Improved risk assessment and risk reduction strategies in the Water Safety Plan (WSP) of Salta, Argentina. Water Supply 2013, 13, 1080–1089. [Google Scholar] [CrossRef]
- Calheiros, D.F.; Seidl, A.F.; Ferreira, C.J.A. Participatory research methods in environmental science: Local and scientific knowledge of a limnological phenomenon in the Pantanal wetland of Brazil. J. Appl. Ecol. 2000, 37, 684–696. [Google Scholar] [CrossRef]
- Rapley, T.J. The art (fulness) of open-ended interviewing: Some considerations on analyzing interviews. Qual. Res. 2001, 1, 303–323. [Google Scholar] [CrossRef]
- May, T. Social Research: Issues, Methods and Process, 4th ed.; Open University Press: Berkshire, UK, 2011. [Google Scholar]
- Pintér, L.; Hardi, P.; Martinuzzi, A.; Hall, J. Bellagio STAMP: Principles for sustainability assessment and measurement. Ecol. Indic. 2012, 17, 20–28. [Google Scholar] [CrossRef]
- Kemp, R.; Parto, S.; Gibson, R.B. Governance for sustainable development: Moving from theory to practice. Int. J. Sustain. Dev. 2005, 8, 12–30. [Google Scholar] [CrossRef]
- Elgert, L. Hard facts and software: The co-production of indicators in a land-use planning model. Environ. Values 2013, 22, 765–786. [Google Scholar] [CrossRef]
- Arias-Maldonado, M. Rethinking Sustainability in the Anthropocene. Environ. Polit. 2013, 22, 428–446. [Google Scholar] [CrossRef]
- Moreno-Pires, S.; Fidélis, T. A proposal to explore the role of sustainability indicators in local governance contexts: The case of Palmela, Portugal. Ecol. Indic. 2012, 23, 608–615. [Google Scholar] [CrossRef]
- Binder, C.; Feola, G.; Steinberger, J. Considering the normative, systemic and procedural dimensions in indicator-based sustainability assessments in agriculture. Environ. Impact Assess. Rev. 2010, 30, 71–81. [Google Scholar] [CrossRef]
- Mukherjee, R.; Sengupta, D.; Sikdar, S. Parsimonious use of indicators for evaluating sustainability systems with multivariate statistical analyses. Clean. Technol. Environ. 2013, 15, 699–706. [Google Scholar] [CrossRef]
- Hering, J.G.; Sedlak, D.L.; Tortajada, C.; Biswas, A.K.; Niwagaba, C.; Breu, T. Local perspectives on water. Science 2015, 349, 479–480. [Google Scholar] [CrossRef] [PubMed]
- WHO (World Health Organization). Sanitation Safety Planning: Manual for Safe Use and Disposal of Wastewater, Greywater and Excreta; World Health Organization: Geneva, Switzerland, 2015. [Google Scholar]
- Vörösmarty, C.J.; Hoekstra, A.Y.; Bunn, S.E.; Conway, D.; Gupta, J. What scale for water governance? Science 2015, 349, 478–479. [Google Scholar] [PubMed]
- EBC (European Benchmarking Co-operation). Learning from International Best Practices; EBC Foundation: The Hague, The Netherlands, 2014. [Google Scholar]
- Van Leeuwen, C.J.; Koop, S.H.A.; Sjerps, R.M.A. City Blueprints: Baseline assessments of water management and climate change in 45 cities. Environ. Dev. Sustain. 2015. [Google Scholar] [CrossRef]
- Hezri, H.; Dovers, S. Sustainability indicators, policy and governance: Issues for ecological economics. Ecol. Econ. 2006, 60, 86–99. [Google Scholar] [CrossRef]
- Newig, J.; Fritsch, O. Environmental governance: Participatory, multi-Level-and effective? Environ. Policy Gov. 2009, 19, 197–214. [Google Scholar] [CrossRef]
- Bosselmann, K.; Engel, R.; Taylor, P. Governance for Sustainability. Issues, Challenges, Successes; The International Union for Conservation of Nature (IUCN): Bonn, Germany, 2008. [Google Scholar]
- Organization for Economic Co-operation and Development (OECD). Stakeholder Engagement for Inclusive Water Governance; OECD Publishing: Paris, France, 2015. [Google Scholar]
- Bell, B.; Morse, S. Groups and indicators in post-industrial society. Sustain. Dev. 2011, 22, 145–159. [Google Scholar] [CrossRef]
- Reed, M.S.; Fraser, E.D.G.; Dougill, A.J. An adaptive learning process for developing and applying sustainability indicators with local communities. Ecol. Econ. 2006, 59, 406–418. [Google Scholar] [CrossRef]
- Newig, J.; Schulz, D.; Fischer, D.; Hetze, K.; Laws, N.; Lüdecke, G.; Rieckmann, M. Communication regarding sustainability: Conceptual perspectives and exploration of societal subsystems. Sustainability 2013, 5, 2976–2990. [Google Scholar] [CrossRef]
- Ramos, T.B.; Caeiro, S. Meta-performance evaluation of sustainability indicators. Ecol. Indic. 2010, 10, 157–166. [Google Scholar] [CrossRef]
- Nabatchi, T. Putting the “public” back in public values research: Designing participation to identify and respond to values. Public. Admin. Rev. 2012, 72, 699–708. [Google Scholar] [CrossRef]
- Isenmann, R.; Bey, C.; Welter, M. Online reporting for sustainability issues. BSE 2007, 16, 487–501. [Google Scholar] [CrossRef]
- Myeong, S.; Kwon, Y.; Seo, H. Sustainable e-governance: The relationship among trust, digital divide, and e-government. Sustainability 2014, 6, 6049–6069. [Google Scholar] [CrossRef]
- Von Korff, Y.; d’Aquino, P.; Daniell, K.; Bijlsma, R. Designing participation processes for water management and beyond. Ecol. Soc. 2010, 15. Article 29. Available online: http://www.ecologyandsociety.org/vol15/iss3/art1/ (accessed on 22 June 2015). [Google Scholar]
- Bryson, J.M.; Quick, K.S.; Schively Slotterback, C.; Crosby, B.C. Designing public participation processes. Public Admin. Rev. 2012, 73, 23–34. [Google Scholar] [CrossRef]
- Schulz, D.; Newig, J. Assessing online consultation in participatory governance: Conceptual framework and a case study of a national sustainability-related consultation platform in Germany. Environ. Policy Gov. 2015, 25, 55–69. [Google Scholar] [CrossRef]
- Mitchell, R.K.; Agle, B.R.; Wood, D.J. Toward a theory of stakeholder identification and salience: Defining the principle of what and who really counts. Acad. Manag. Rev. 1997, 22, 853–886. [Google Scholar]
- Rodela, R. Advancing the deliberative turn in natural resource management: An analysis of discourses on the use of local resources. J. Environ. Manag. 2012, 96, 26–34. [Google Scholar] [CrossRef] [PubMed]
© 2015 by the authors; licensee MDPI, Basel, Switzerland. This article is an open access article distributed under the terms and conditions of the Creative Commons Attribution license (http://creativecommons.org/licenses/by/4.0/).
Share and Cite
Iribarnegaray, M.A.; D’Andrea, M.L.G.; Rodriguez-Alvarez, M.S.; Hernández, M.E.; Brannstrom, C.; Seghezzo, L. From Indicators to Policies: Open Sustainability Assessment in the Water and Sanitation Sector. Sustainability 2015, 7, 14537-14557. https://doi.org/10.3390/su71114537
Iribarnegaray MA, D’Andrea MLG, Rodriguez-Alvarez MS, Hernández ME, Brannstrom C, Seghezzo L. From Indicators to Policies: Open Sustainability Assessment in the Water and Sanitation Sector. Sustainability. 2015; 7(11):14537-14557. https://doi.org/10.3390/su71114537
Chicago/Turabian StyleIribarnegaray, Martín Alejandro, María Laura Gatto D’Andrea, María Soledad Rodriguez-Alvarez, María Eugenia Hernández, Christian Brannstrom, and Lucas Seghezzo. 2015. "From Indicators to Policies: Open Sustainability Assessment in the Water and Sanitation Sector" Sustainability 7, no. 11: 14537-14557. https://doi.org/10.3390/su71114537