1. Introduction: Measuring Sustainable Development
Sustainable development can be defined in several different ways, but normally the term refers to the definition given by the Brundtland Commission in the publication Our Common Future [
1]: “
Sustainable development is development that meets the needs of the present without compromising the ability of future generations to meet their own needs”.
The definition contains two key concepts [
2]: (i) the concept of needs, in particular the essential needs of the world’s poor, to which overriding priority should be given; and (ii) the idea of limitations imposed by the state of technology and social organization on the environment’s ability to meet present and future needs.
Sustainable development is often understood of relying on three pillars; environmental, economic, and social. These define the three dimensions, which are often seen as independent, but sometimes not totally de-linked from each other. The measurement of the different dimensions of sustainability is not straightforward since no generally agreed method has been developed for the purpose. For policy purposes, sustainable development indicator (SDI) sets have been developed and related data collected in many countries and in international organizations. For example, the SDI set developed in the European Union includes 155 individual indicators grouped in ten different themes [
3]. The United Nations and the OECD have also developed SDIs.
The most common SDI themes in policy-based SDI sets are [
4]: management of natural resources, climate change and energy, sustainable consumption and production, public health, social inclusion, education, socio-economic development, transport, good governance, global dimension of sustainable development, research and development, and innovation. The most common individual indicators in the SDI sets include greenhouse gas emissions, education attainment, GDP per capita, collection and disposal of waste, biodiversity, official development assistance, unemployment rate, life expectancy (or healthy life years), share of energy from renewable sources, risk of poverty, air pollution, energy use and intensity, water quality, general government net debt, research and development expenditure, organic farming, area of protected land, mortality due to selected key illnesses, energy consumption, employment rate, emission of ozone precursors, fishing stock within safe biological limits, use of fertilizers and pesticides, freight transport by mode, passenger transport by mode, intensity of water use, and forest area and its utilization [
4]. Despite the fact that a lot of work has been carried out in developing SDI sets, their usage in policy planning seems to be very limited [
5].
The United Nations Economic Commission for Europe (UNECE) [
6] lists the most important composite indicators developed by economists: Index of Sustainable Economic Welfare (ISEW) has been used widely for analysis, others include the Genuine Progress Indicator (GPI) (see [
7,
8]); the Index of Economic Wellbeing [
9]; the Genuine Savings [
10]; and the Sustainable Net Benefit Indicator [
11].
The insights of work on economic indicators are starting to impact on statistical work [
6]. For example, the UN System of Environmental Economic Accounting (SEEA) includes macroeconomic aggregates corrected for the depletion of natural resources [
12].
There are also other types of composite indicators which do not relate to the System of National Accounts (SNA). According to UNECE [
6], the best known examples include the Human Development Index (HDI) and Ecological Footprint (EF). HDI is published annually by the UNDP and is a weighted average of indicators covering economy, education, and health [
6]. Ecological Footprint represents the amount of land and sea area necessary to supply the resources a human population consumes and to assimilate the associated waste [
6,
13]. UNECE [
6] also lists other composite indicators such as Happy Planet Index (HPI), Sustainable Society Index (SSI), and Living Planet Index (LPI). A specific type of indicator is based on the measurement of people’s subjective well-being [
6]. These indicators are calculated based on surveys where individuals assess their life satisfaction, or their feelings about recent episodes in their life [
14].
Kuznets Curve Hypothesis and Environmental Kuznets Curve (EKC) hypothesis postulate an inverted-U-shaped relationship between developments, on the one hand, in social inequality, economy, and development, on the other hand, in environmental pollution and economic development dimensions. They have been used as a starting point for empirical testing of the development in two dimensions of sustainability (social-economic or environmental-economic). The Sustainability Window (SuWi) approach, introduced here, differs considerably from the Kuznets Curve approaches. The SuWi approach does not postulate any type of relationship between the developments in different dimensions of sustainability to be tested with empirical data. The SuWi target is to analyze developments in three dimensions in a case study area and to see whether they simultaneously fulfill the Brundtland type of sustainability criteria.
This article describes a new method to analyze the sustainability of development in the different dimensions. The Sustainability Window approach of this article is an extension of the Advanced Sustainability Analysis (ASA) developed by the research team. The major platform model of ASA was presented in the Encyclopedia of Life Support Systems and Sustainable Development and in the journal article of Population and Environment [
15,
16]. Additionally, rebound analysis [
17], de-linking and re-linking analyses [
18], synergy and trade-off analysis methodology packages [
19,
20], and de-growth and sustainable growth analysis [
21] have been included in the ASA framework. Thus, the Sustainability Window methodology can be seen as a new useful module of a broader ASA analysis framework. The SuWi approach is not planned to replace the existing analysis tools but to complement them.
2. Methodology: Sustainability Window Approach
Advanced Sustainability Analysis (ASA) is one approach which has been developed to analyze the different dimensions of sustainability in a coherent framework [
15,
16]. In the ASA analysis the different dimensions of sustainability are measured using different indicators.
Simultaneous analysis of the three dimensions of sustainability can be carried out using the Sustainability Window (SuWi) analysis [
22,
23]. The Sustainability Window analysis assesses the lower and upper boundary of economic development so that the social and environmental development remains within the sustainability limits. The method does not refer to measures of absolute sustainability but analyzes whether the development is towards a more sustainable state or not.
For the Sustainability Window analysis three different indicators have to be chosen; one for environmental, one for economic, and one for the social dimension. The indicators can be composite indicators. The indicators have to be of similar type. Since the economic dimension in this analysis is measured with GDP the other dimensions of development have to be estimated with a similar type of indicator. That is why e.g., the Human Development Indicator cannot be chosen to describe the social dimension, because it cannot grow beyond 1. Indicators describing annual changes (e.g., annual percentage change) cannot be used in the analysis, but an indicator of the cumulative development has to be utilized.
The Sustainability Window analysis assesses the maximum sustainable economic growth in relation to the change in the environmental indicator. This means that the maximum economic development (GDP) is determined so that the related environmental change is towards a more sustainable state. In practice this means that e.g., the emissions should not increase.
The Sustainability Window analysis also assesses the minimum sustainable economic growth in relation to the change in the social indicator. This means that the minimum economic development is determined so that the related well-being, measured with a social indicator, does not decrease. The difference between the maximum and minimum economic development defines the width of the Sustainability Window. Using SuWi analysis it is possible to determine whether the development in the selected nation is within or outside the sustainability window determined by the selected indicators.
The Sustainability Window analysis is described with the following example and explained later with an example of the Chinese development. In this case example the environmental dimension is measured with the CO2 emissions, the social dimension is measured with the amount of non-poor people (using the poverty rate of $2 USD per capita), and the economic dimension with GDP. The social indicator has to increase when the welfare is increasing and that is why we have to use the number of non-poor people instead of the number of poor people.
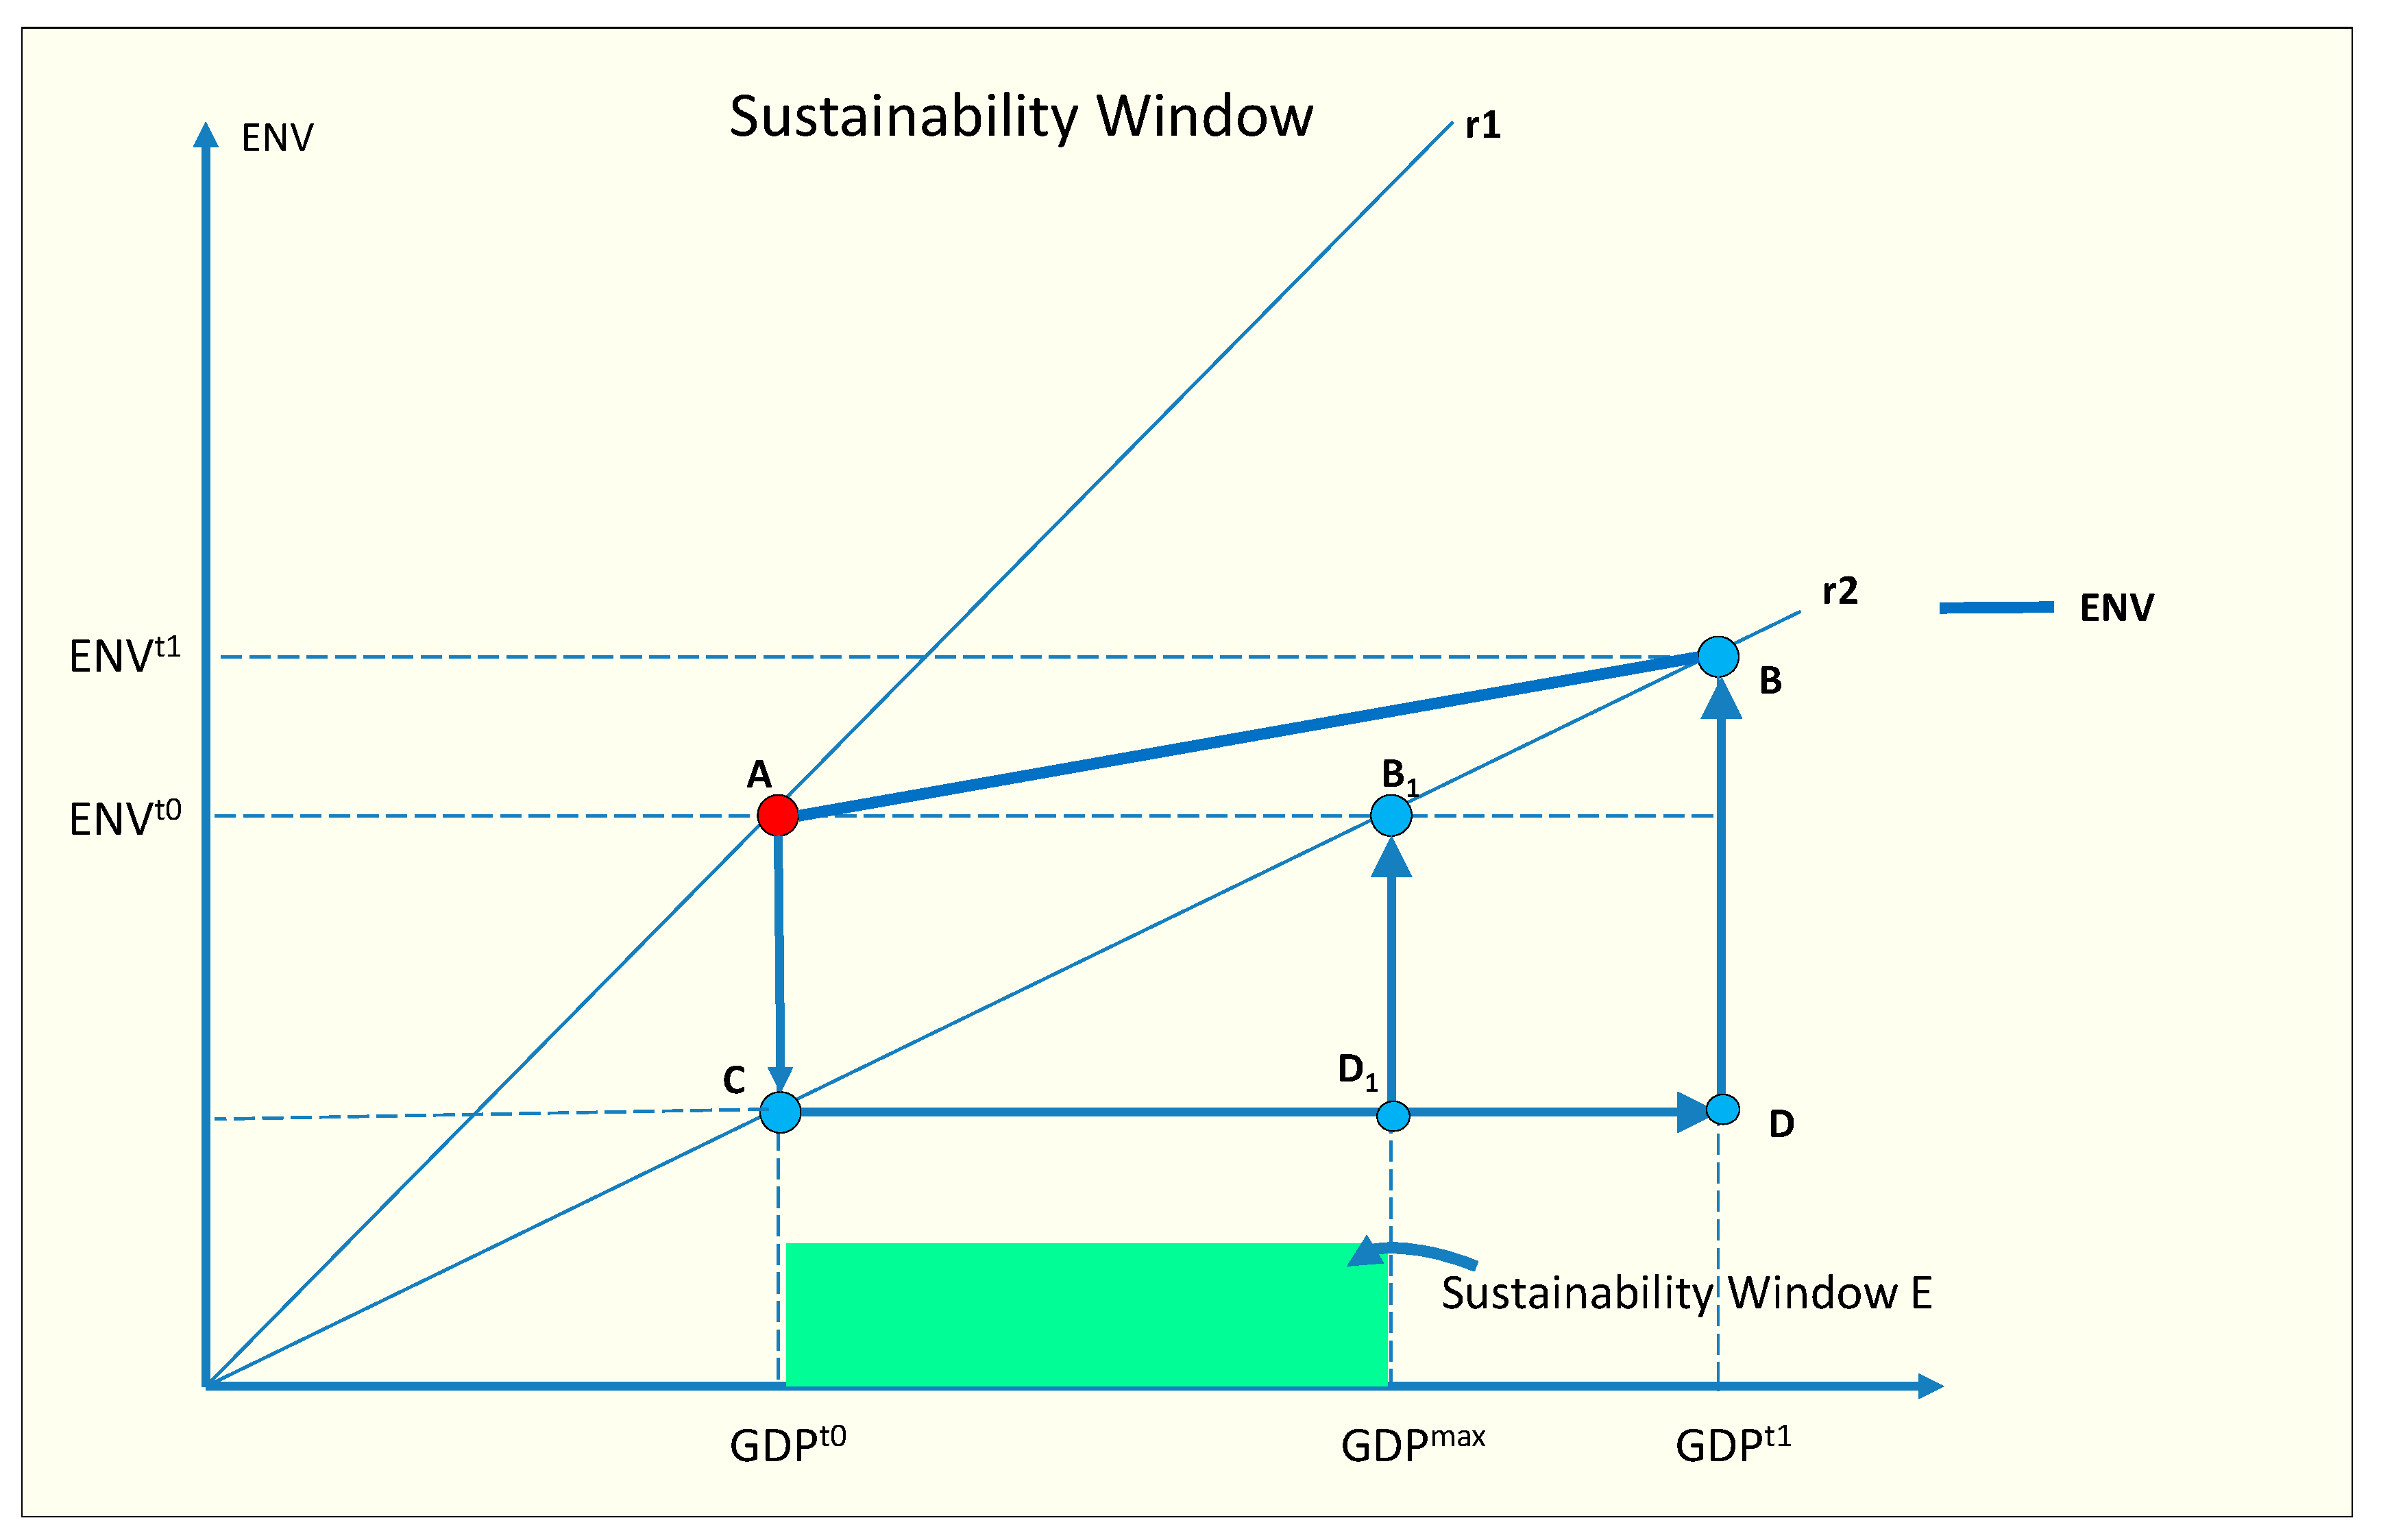
In
Figure 1 the development of an environmental indicator is indicated as a function of GDP. The starting point is year t
0 and the development is described in an index series up to t
1 starting from point A and reaching point B.
In the base year t
0 the value of the environmental indicator is Env
t0 and the Gross Domestic Product is GDP
t0. The starting point is indicated with A. In the end year the level of the environmental indicator is Env
t1 and the GDP is GDP
t1. This is indicated with point B in the
Figure 1.
Figure 1.
Sustainability Window in relation to environmental sustainability.
Figure 1.
Sustainability Window in relation to environmental sustainability.
The change in the environmental indicator and the GDP can be decomposed in different factors. In the base year the line r1 describes the socio-techno-economic production system that has produced the environmental and economic indicators (Envt0, GDPt0). If nothing would change in the system structure and function then, ceteris paribus, the increase in GDP would shift the point A along the line r1 increasing the environmental indicator accordingly. The structure of the system has, however, changed and the line r2 describes the production system in year t1 in relation to environmental-GDP production. The SuWi approach does not assume a linear relationship between the variables and the non-linear relationship is not postulated to follow a certain pattern, but the relationship is determined in each point of operation by the empirical variable Env/GDP.
The shift from A to B can be described as a shift from line r1 to line r2, which means improvement in efficiency in relation to environmental performance. The change can be decomposed in components as a decrease from A to C (as a result from improved environment-GDP performance), then shift to D as a result of increased GDP and finally the shift to B. The change in the environmental indicator from Envt0 to Envt1 is the sum of shifts A–C and D–B.
In order for the development to be environmentally sustainable the environmental indicator should not increase. With the shift from line r1 to r2 (change in the environmental harm productivity of GDP, indicating how much environmental pressure, like emissions, is produced per unit of GDP) the GDP should maximally grow to GDPmax (shift to point B1 in the diagram) in order not to increase the environmental impact. This indicates the maximum environmentally sustainable growth of GDP.
The decomposition of the change in the environmental indicator can be described with the following equation:
where the first component describes the change in environmental harm productivity of GDP (shift from A to D, from line r
1 to r
2) and the second component describes the impact of GDP growth (shift from D to B).
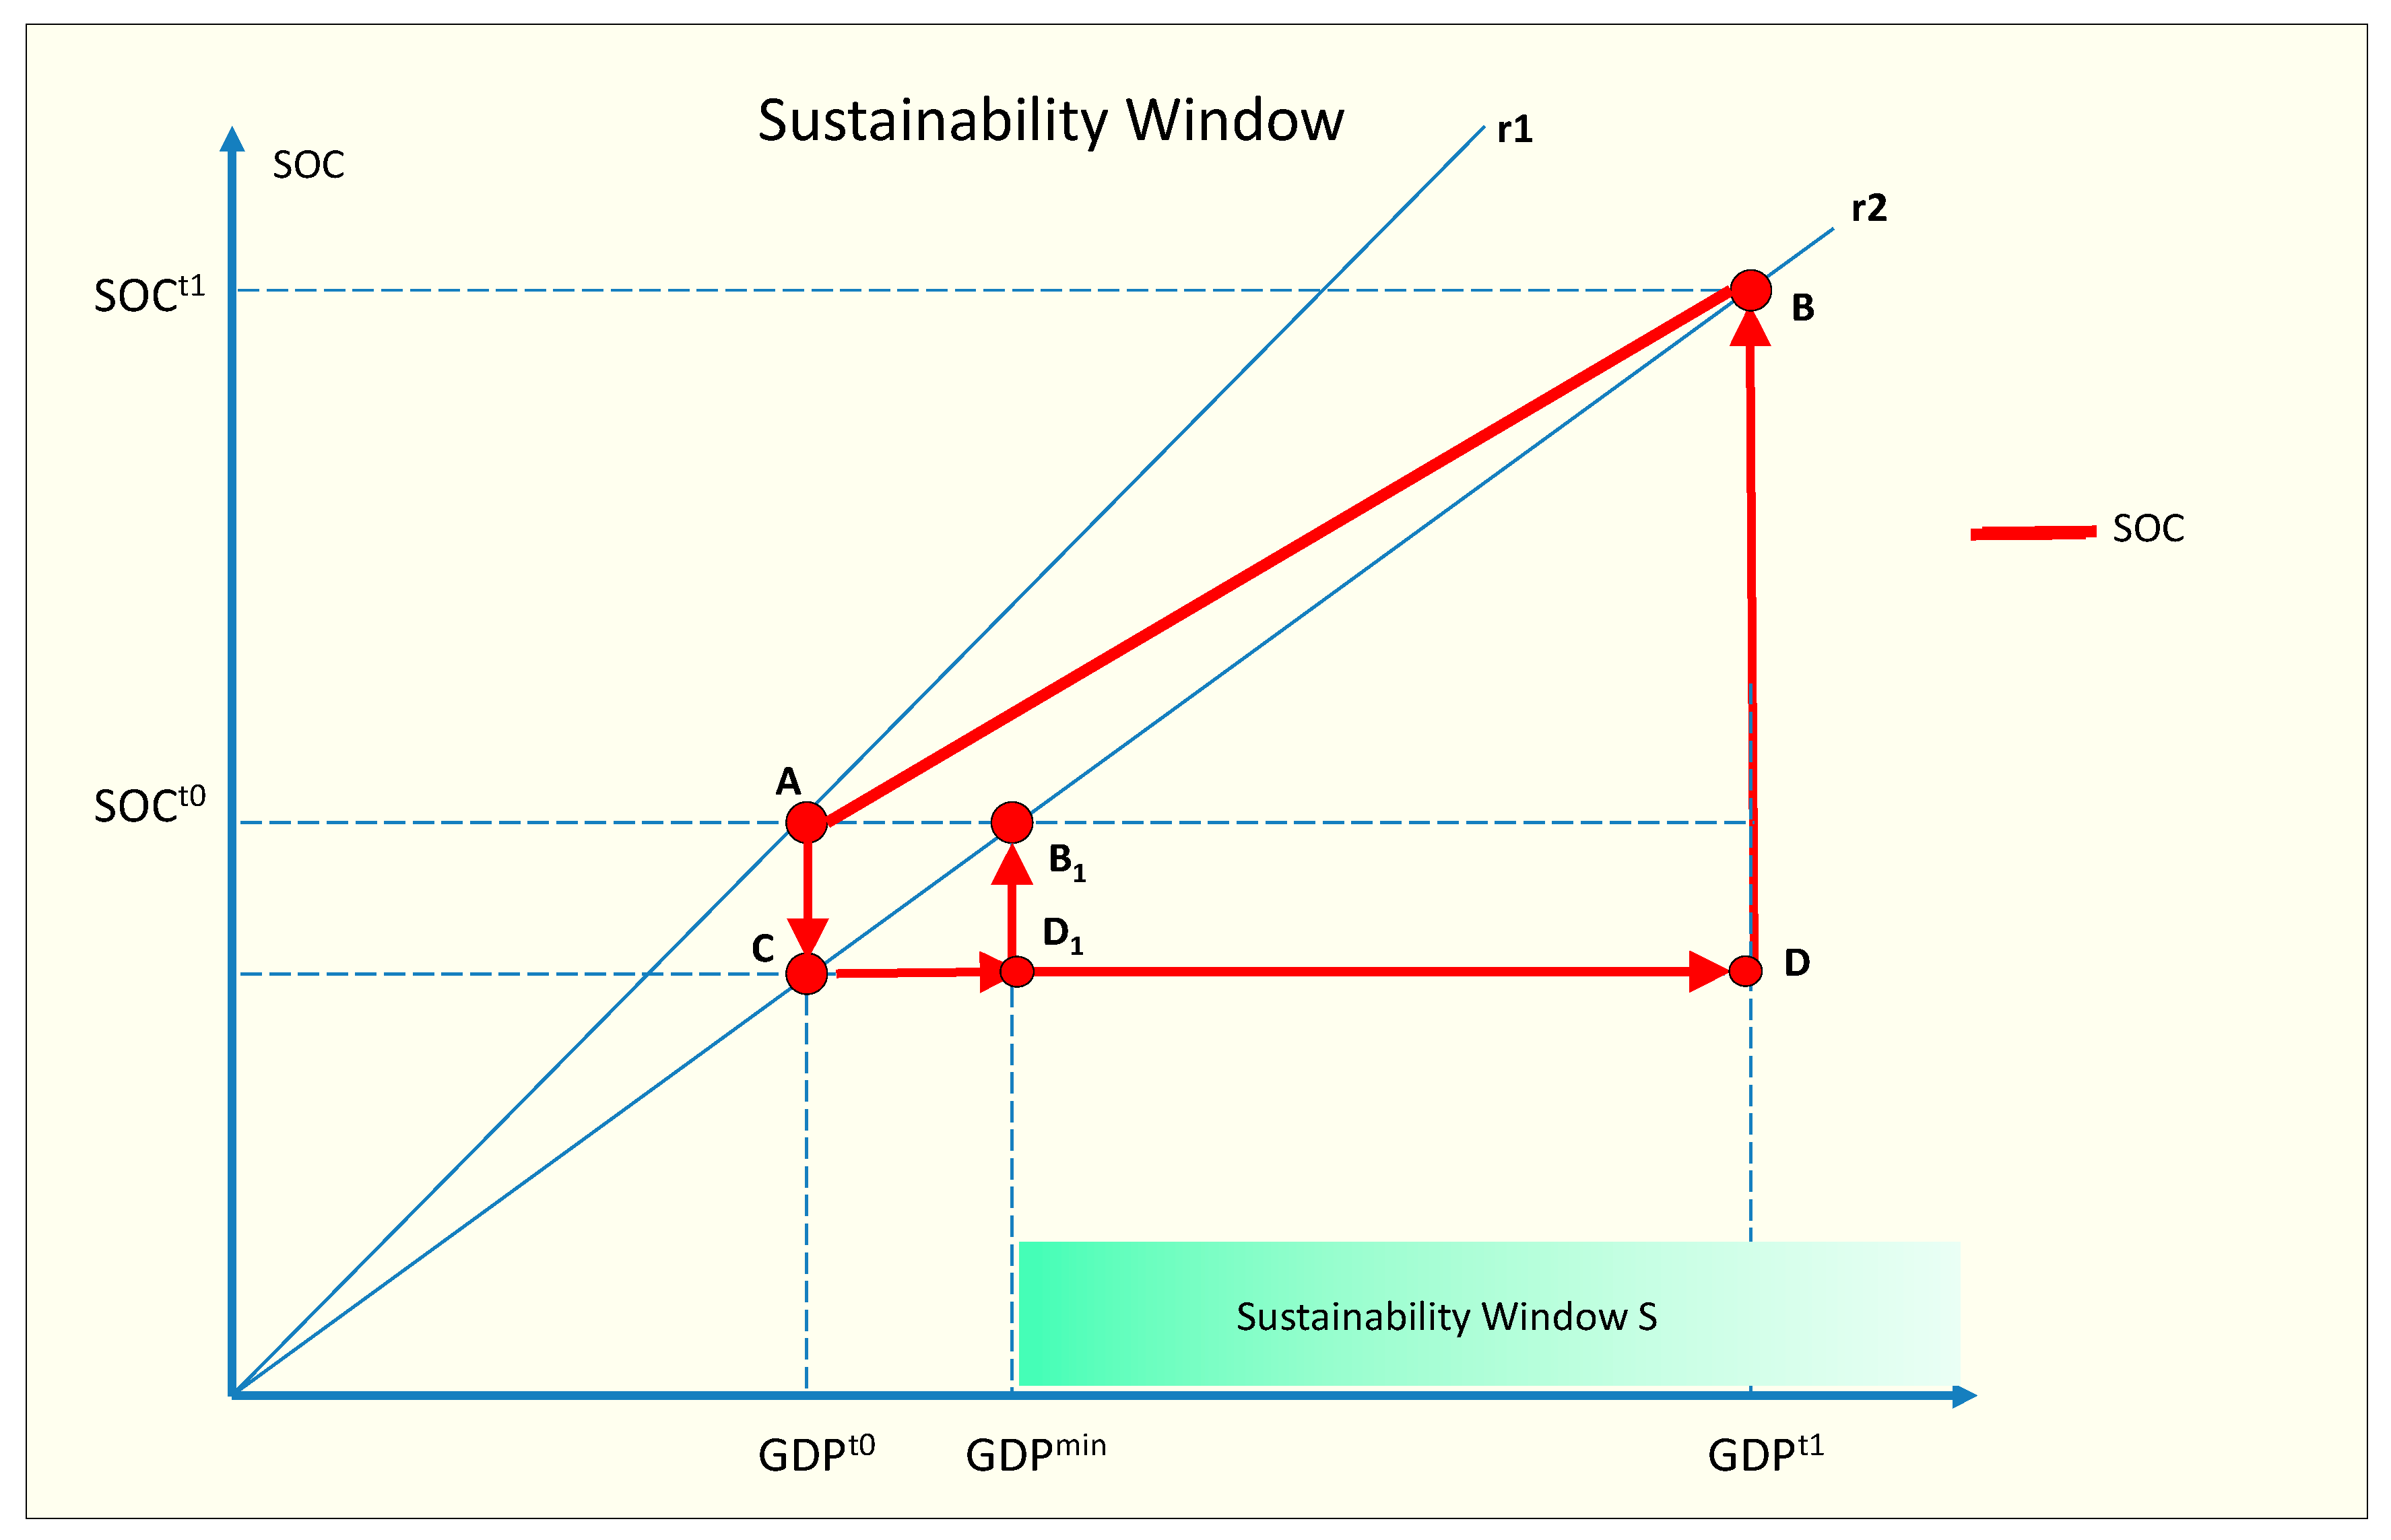
In relation to the social dimension of the sustainability criterion is that the wellbeing should increase. In
Figure 2 the change in social-economic dimension is illustrated. The shift from A to B can be decomposed in two components in relation to changes in the social indicator. The shift from production line r
1 to r
2 indicates decrease in social productivity of GDP. The increase in social indicator from Soc
t0 to Soc
t1 is the sum of the changes A–C and D–B.
The decomposition of the change in the social indicator can be indicated with the following equation:
where the first component describes the change in social productivity of GDP (shift from line r
1 to r
2 or from A to C) and the second component describes the impact of GDP growth (shift from C to D).
In order for the development to be socially sustainable (or the change to be towards a more sustainable direction) the social indicator measuring well-being should not decrease. With the shift to production line r2 the minimum socially sustainable level of economic production would be GDPmin which would mean a shift to point B1 in the diagram. The economic growth should reach at least the level GDPmin in order to guarantee that the social well-being does not reduce.
Figure 2.
Sustainability Window in relation to social dimension.
Figure 2.
Sustainability Window in relation to social dimension.
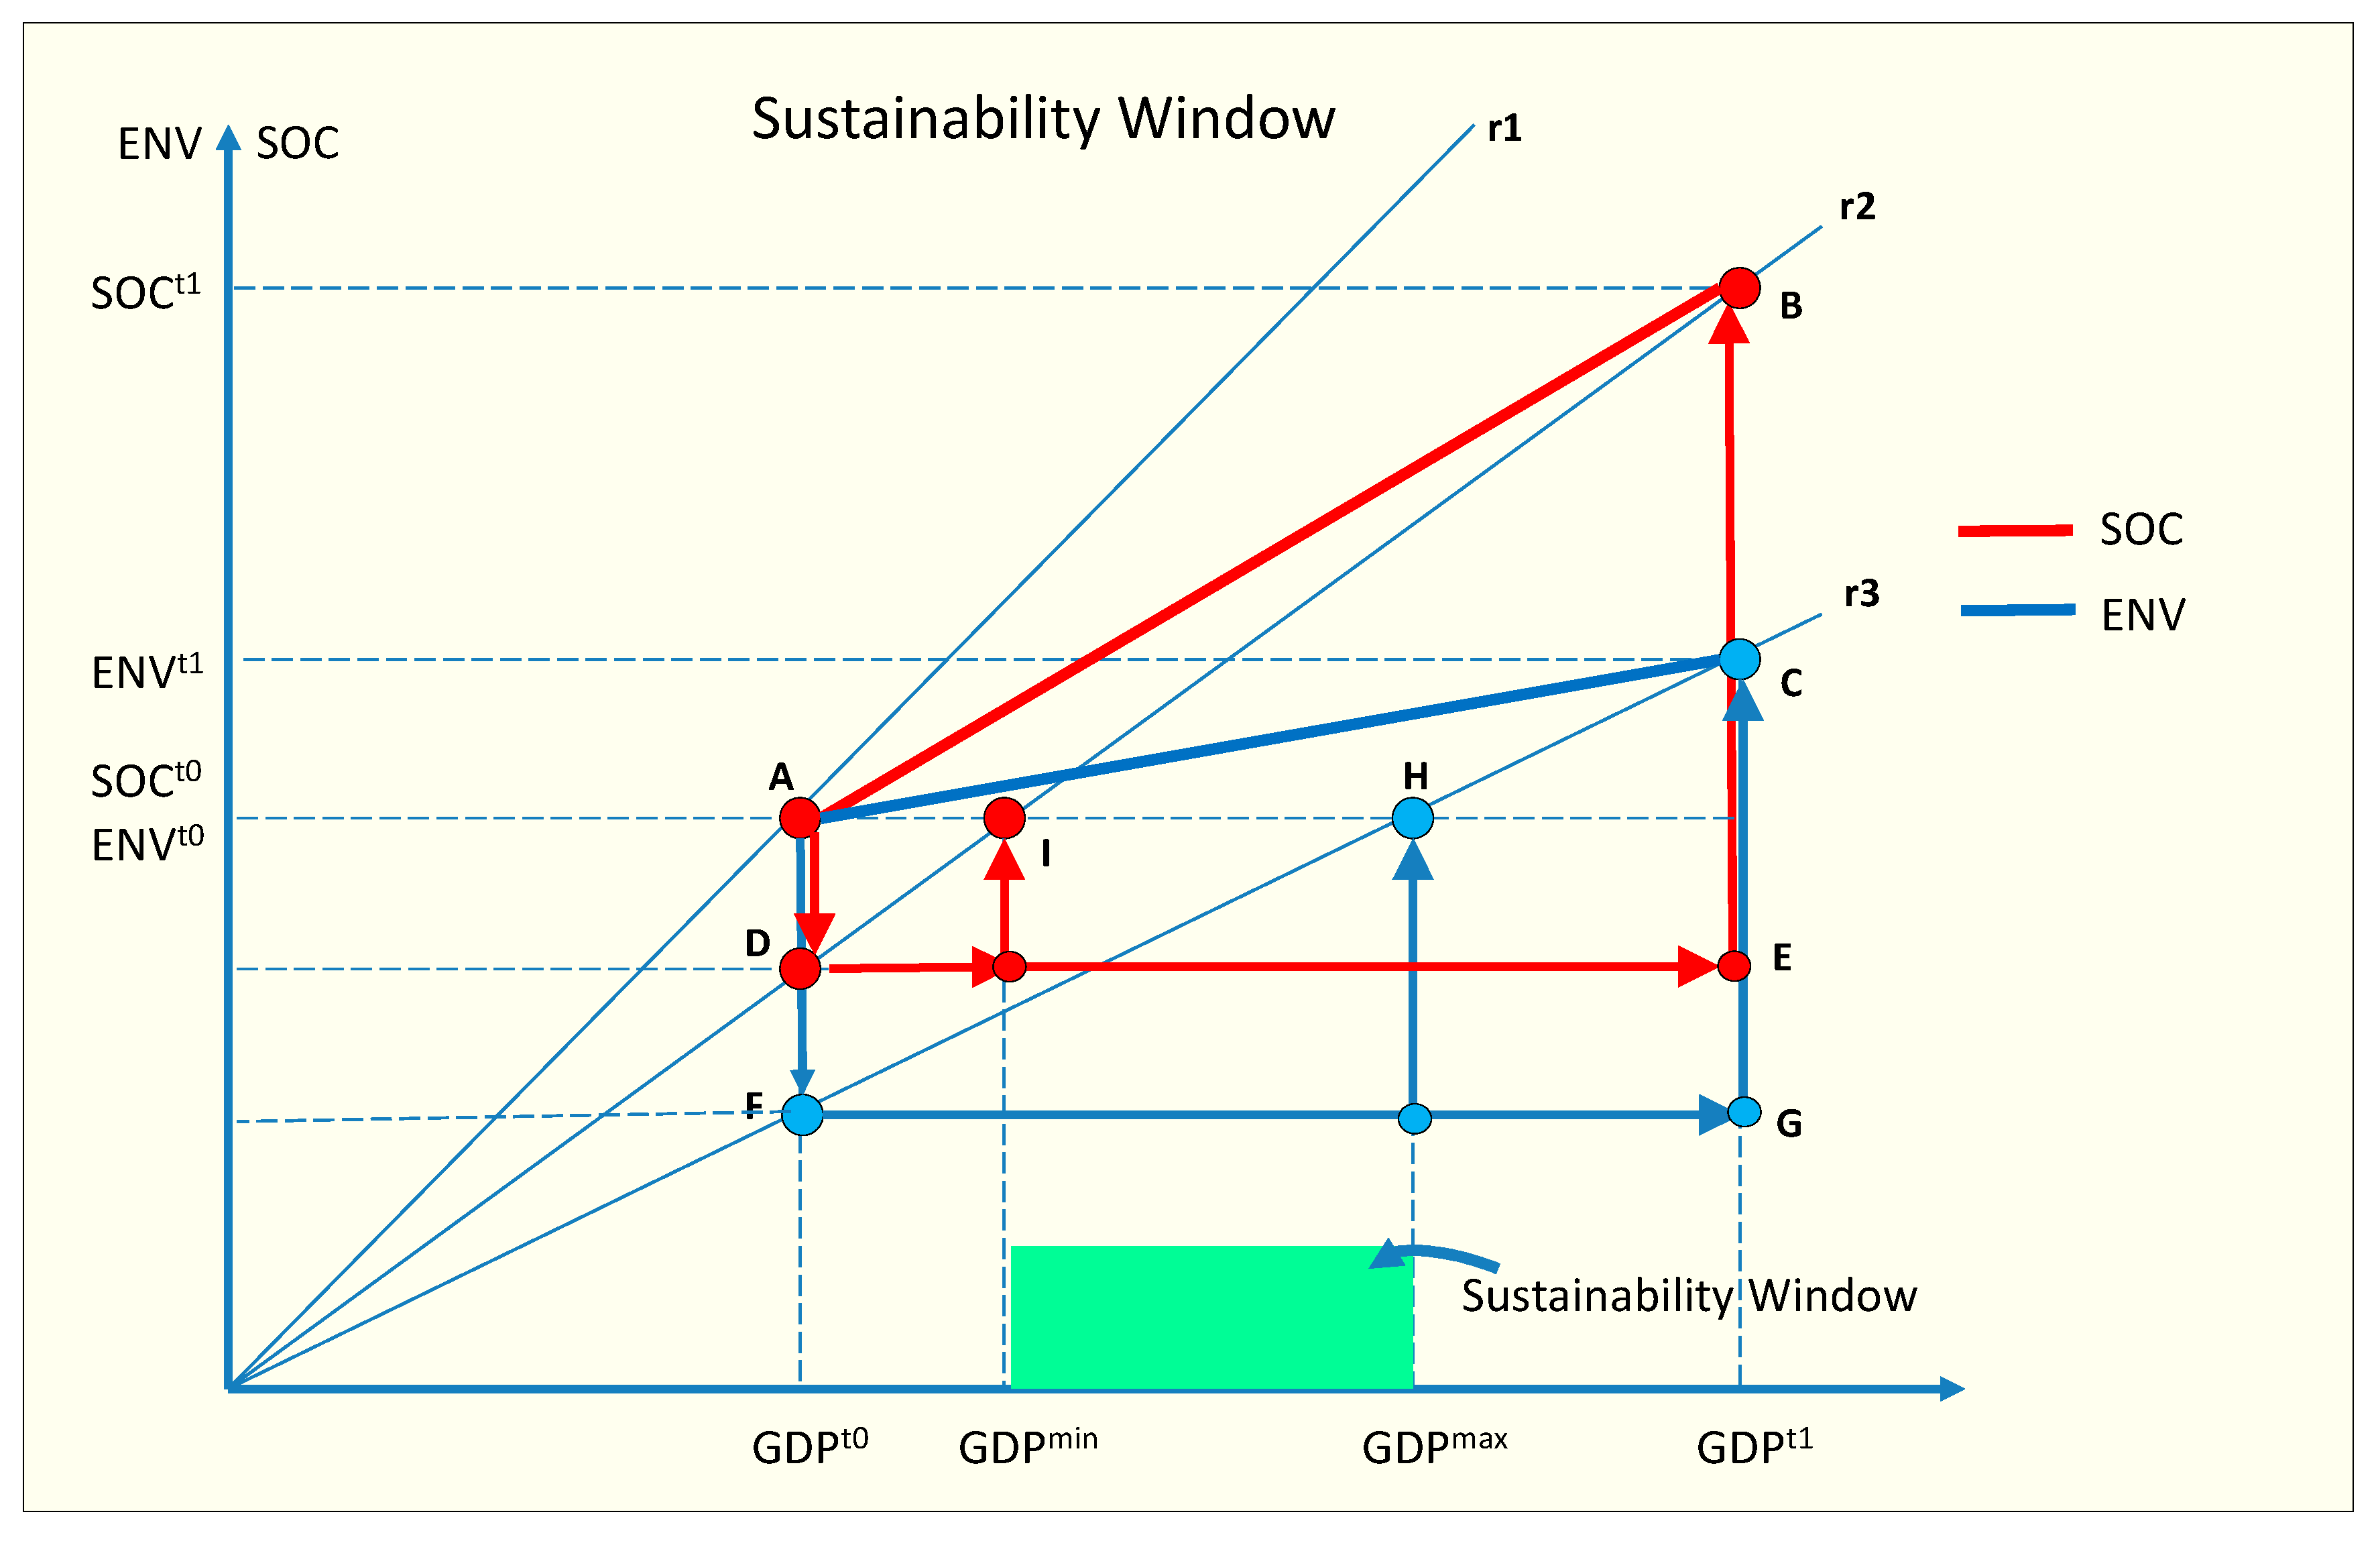
When we combine both the environmental-economic and social-economic sustainability analyses (above) we will get the framework illustrated in
Figure 3.
Figure 3.
Sustainability Window framework.
Figure 3.
Sustainability Window framework.
The minimum socially sustainable level of economic production GDPmin and the maximum environmentally sustainable level of economic production GDPmax determine the Sustainability Window within which the economic development should take place in order for the development to be both socially and environmentally sustainable.
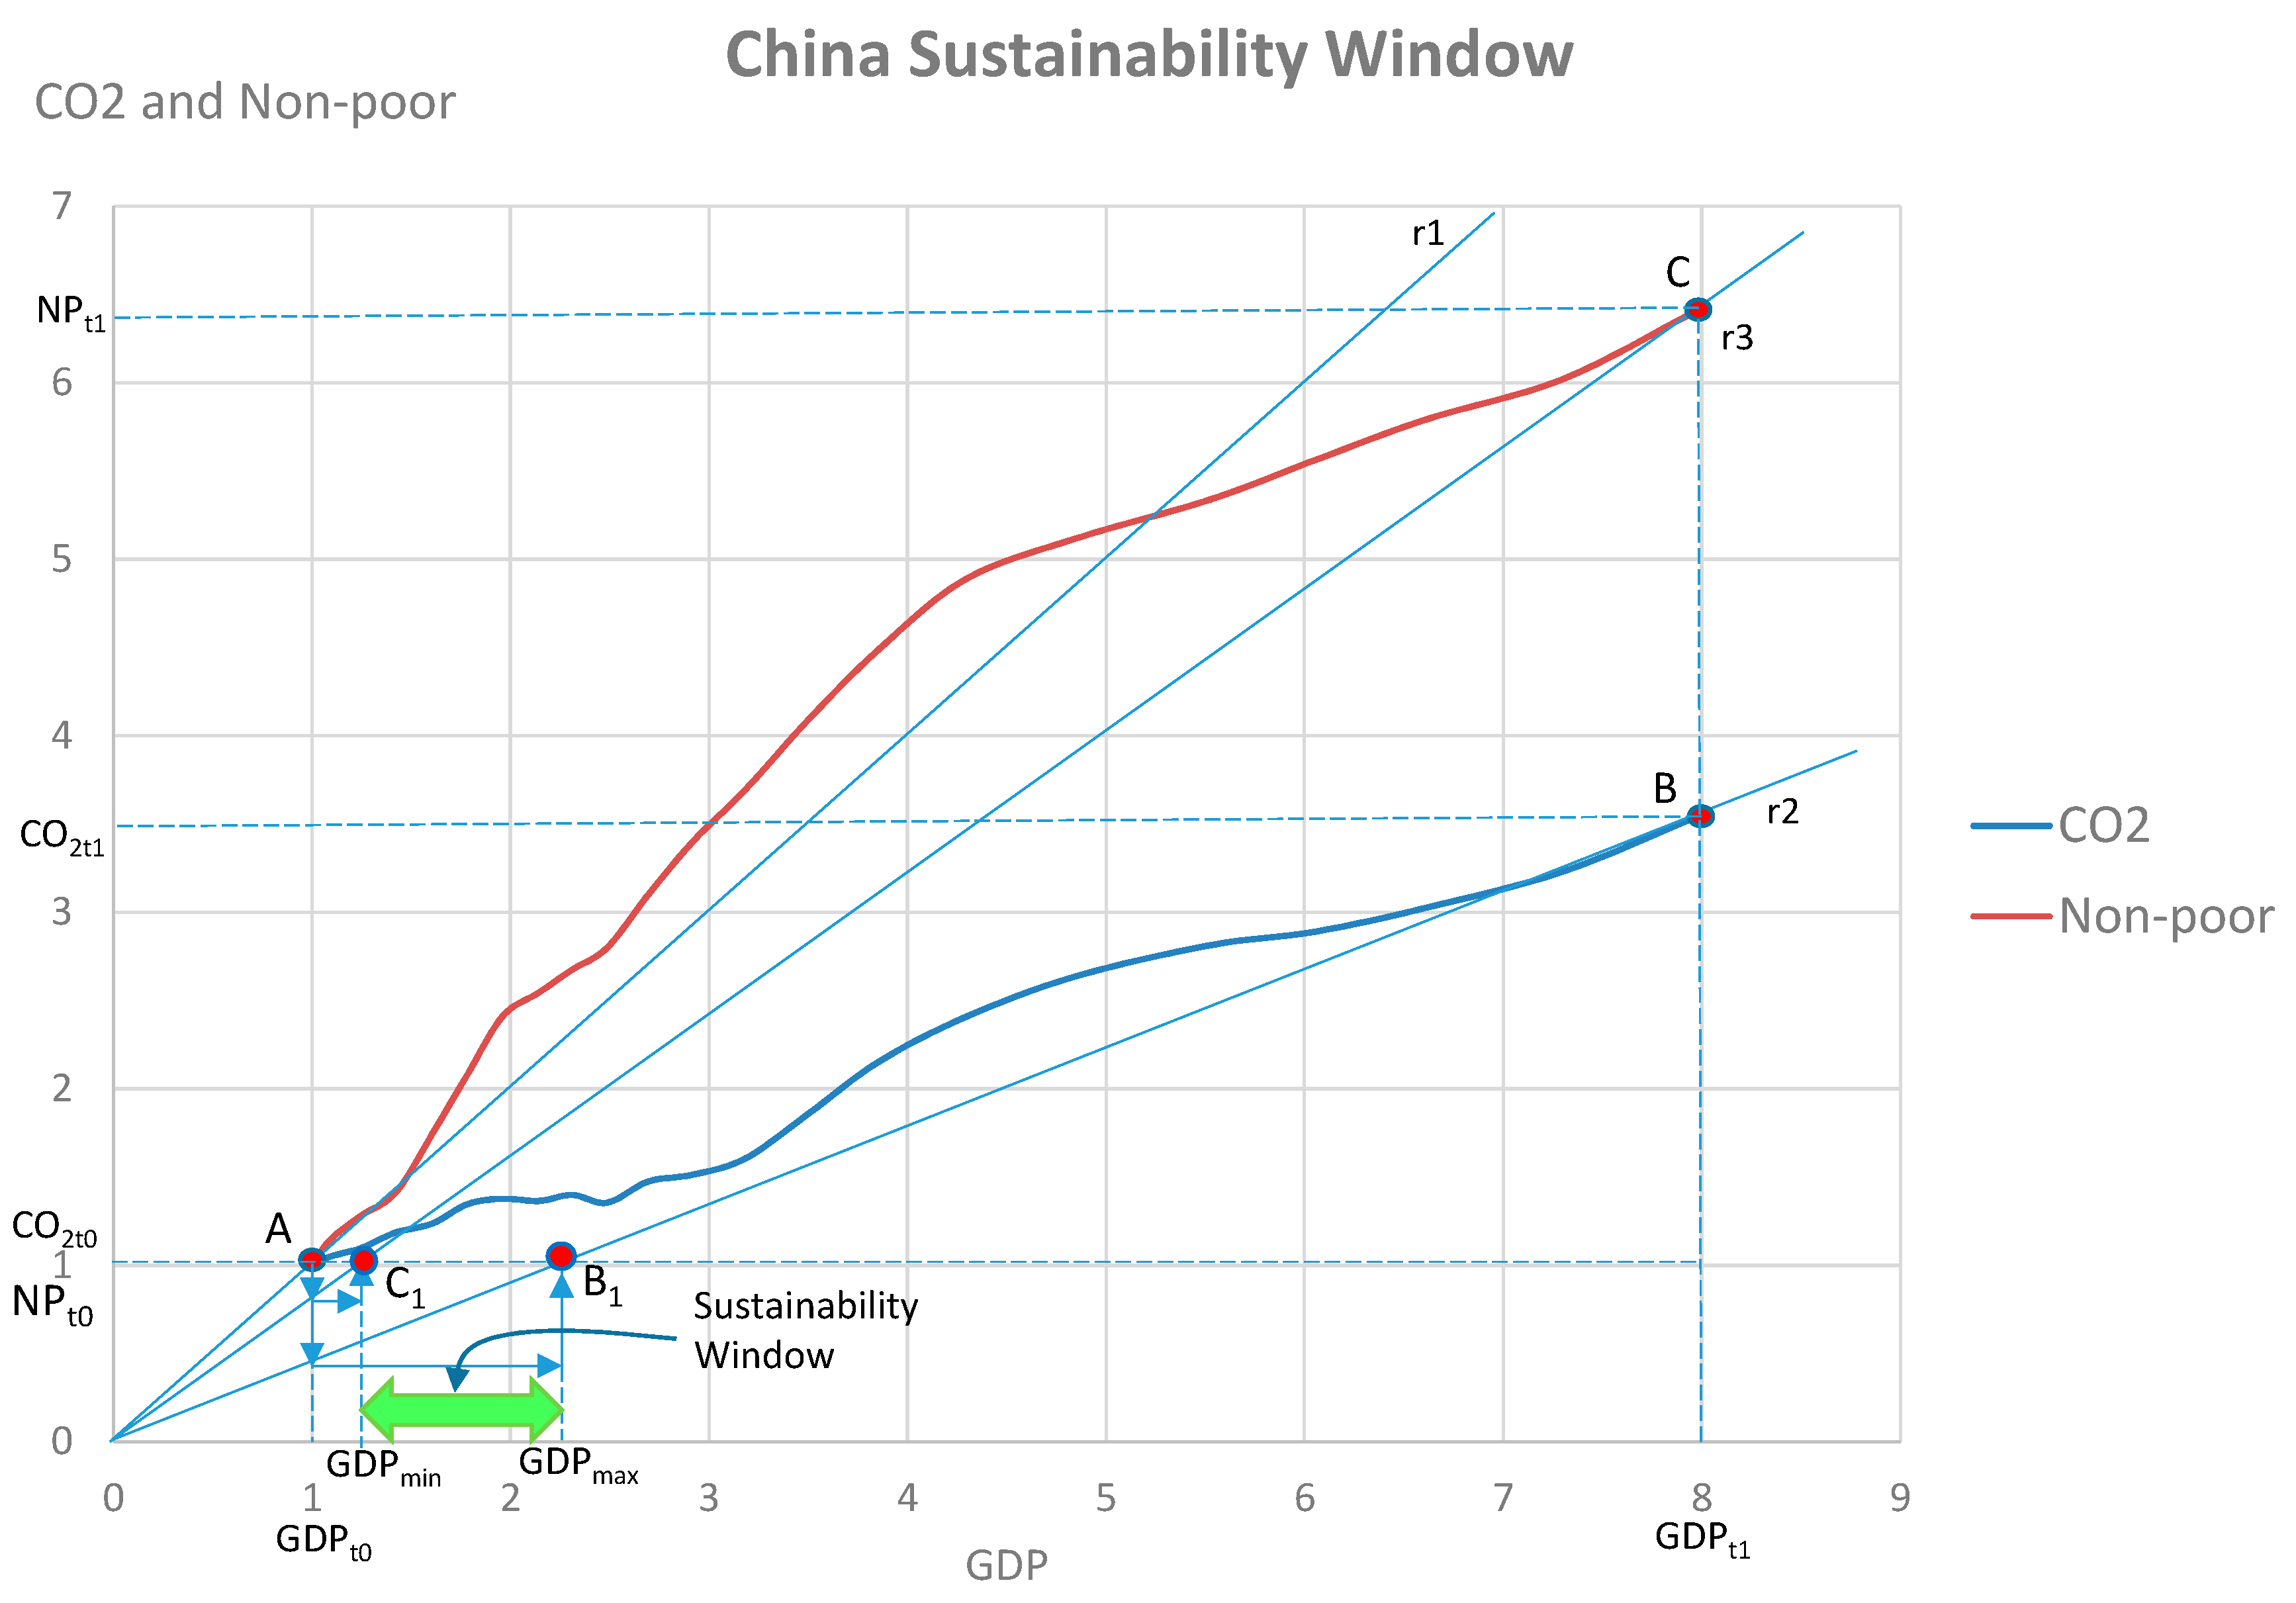
As a case study of Sustainability Window we can analyze the development in China. In this case we have chosen CO
2 emissions as the environmental indicator and the number of non-poor people as the social indicator. The Chinese case study in shown in
Figure 4.
Figure 4.
Sustainability Window analysis for China for the years 1990–2011. The economic indicator is GDP at constant price, the environmental indicator is CO2 emissions and the social indicator is the number of non-poor people (NP).
Figure 4.
Sustainability Window analysis for China for the years 1990–2011. The economic indicator is GDP at constant price, the environmental indicator is CO2 emissions and the social indicator is the number of non-poor people (NP).
The social indicator, the amount of non-poor people is calculated from the number of population and the poverty rate (percentage) from the World Bank statistics [
24]. The CO
2 emissions and GDP is from IEA statistics [
25]. The data is indexed so that the start year 1990 values are one. During the research period the GDP has increased about eight-fold, the CO
2 emissions about 3.5 fold and the number of non-poor people about 6.4 fold.
In this case and with these indicators the Sustainability Window exists since GDP
max is larger than GDP
min. The GDP
max is about 2.25 times the value of GDP in 1990 and the GDP
min is about 1.24 time the value of GDP in 1990. The values can be calculated using following equations with the indexed data:
and
The SuWi analysis can be carried out for different periods of time and it produces results concerning the chosen time period. Since the development can vary considerably depending on the time period the results must always be assessed in relation to the selected time period. For example the development during one year can be unsustainable if the CO2 emissions increase, but during the next year it can be sustainable in that respect. The SuWi approach provides possibilities to analyze the sustainability of different time periods and compare these results.
3. Results: Sustainability Dynamics in China
The analyses of the changes in the Sustainability Window during the course of time provide information of the trends related to sustainable development.
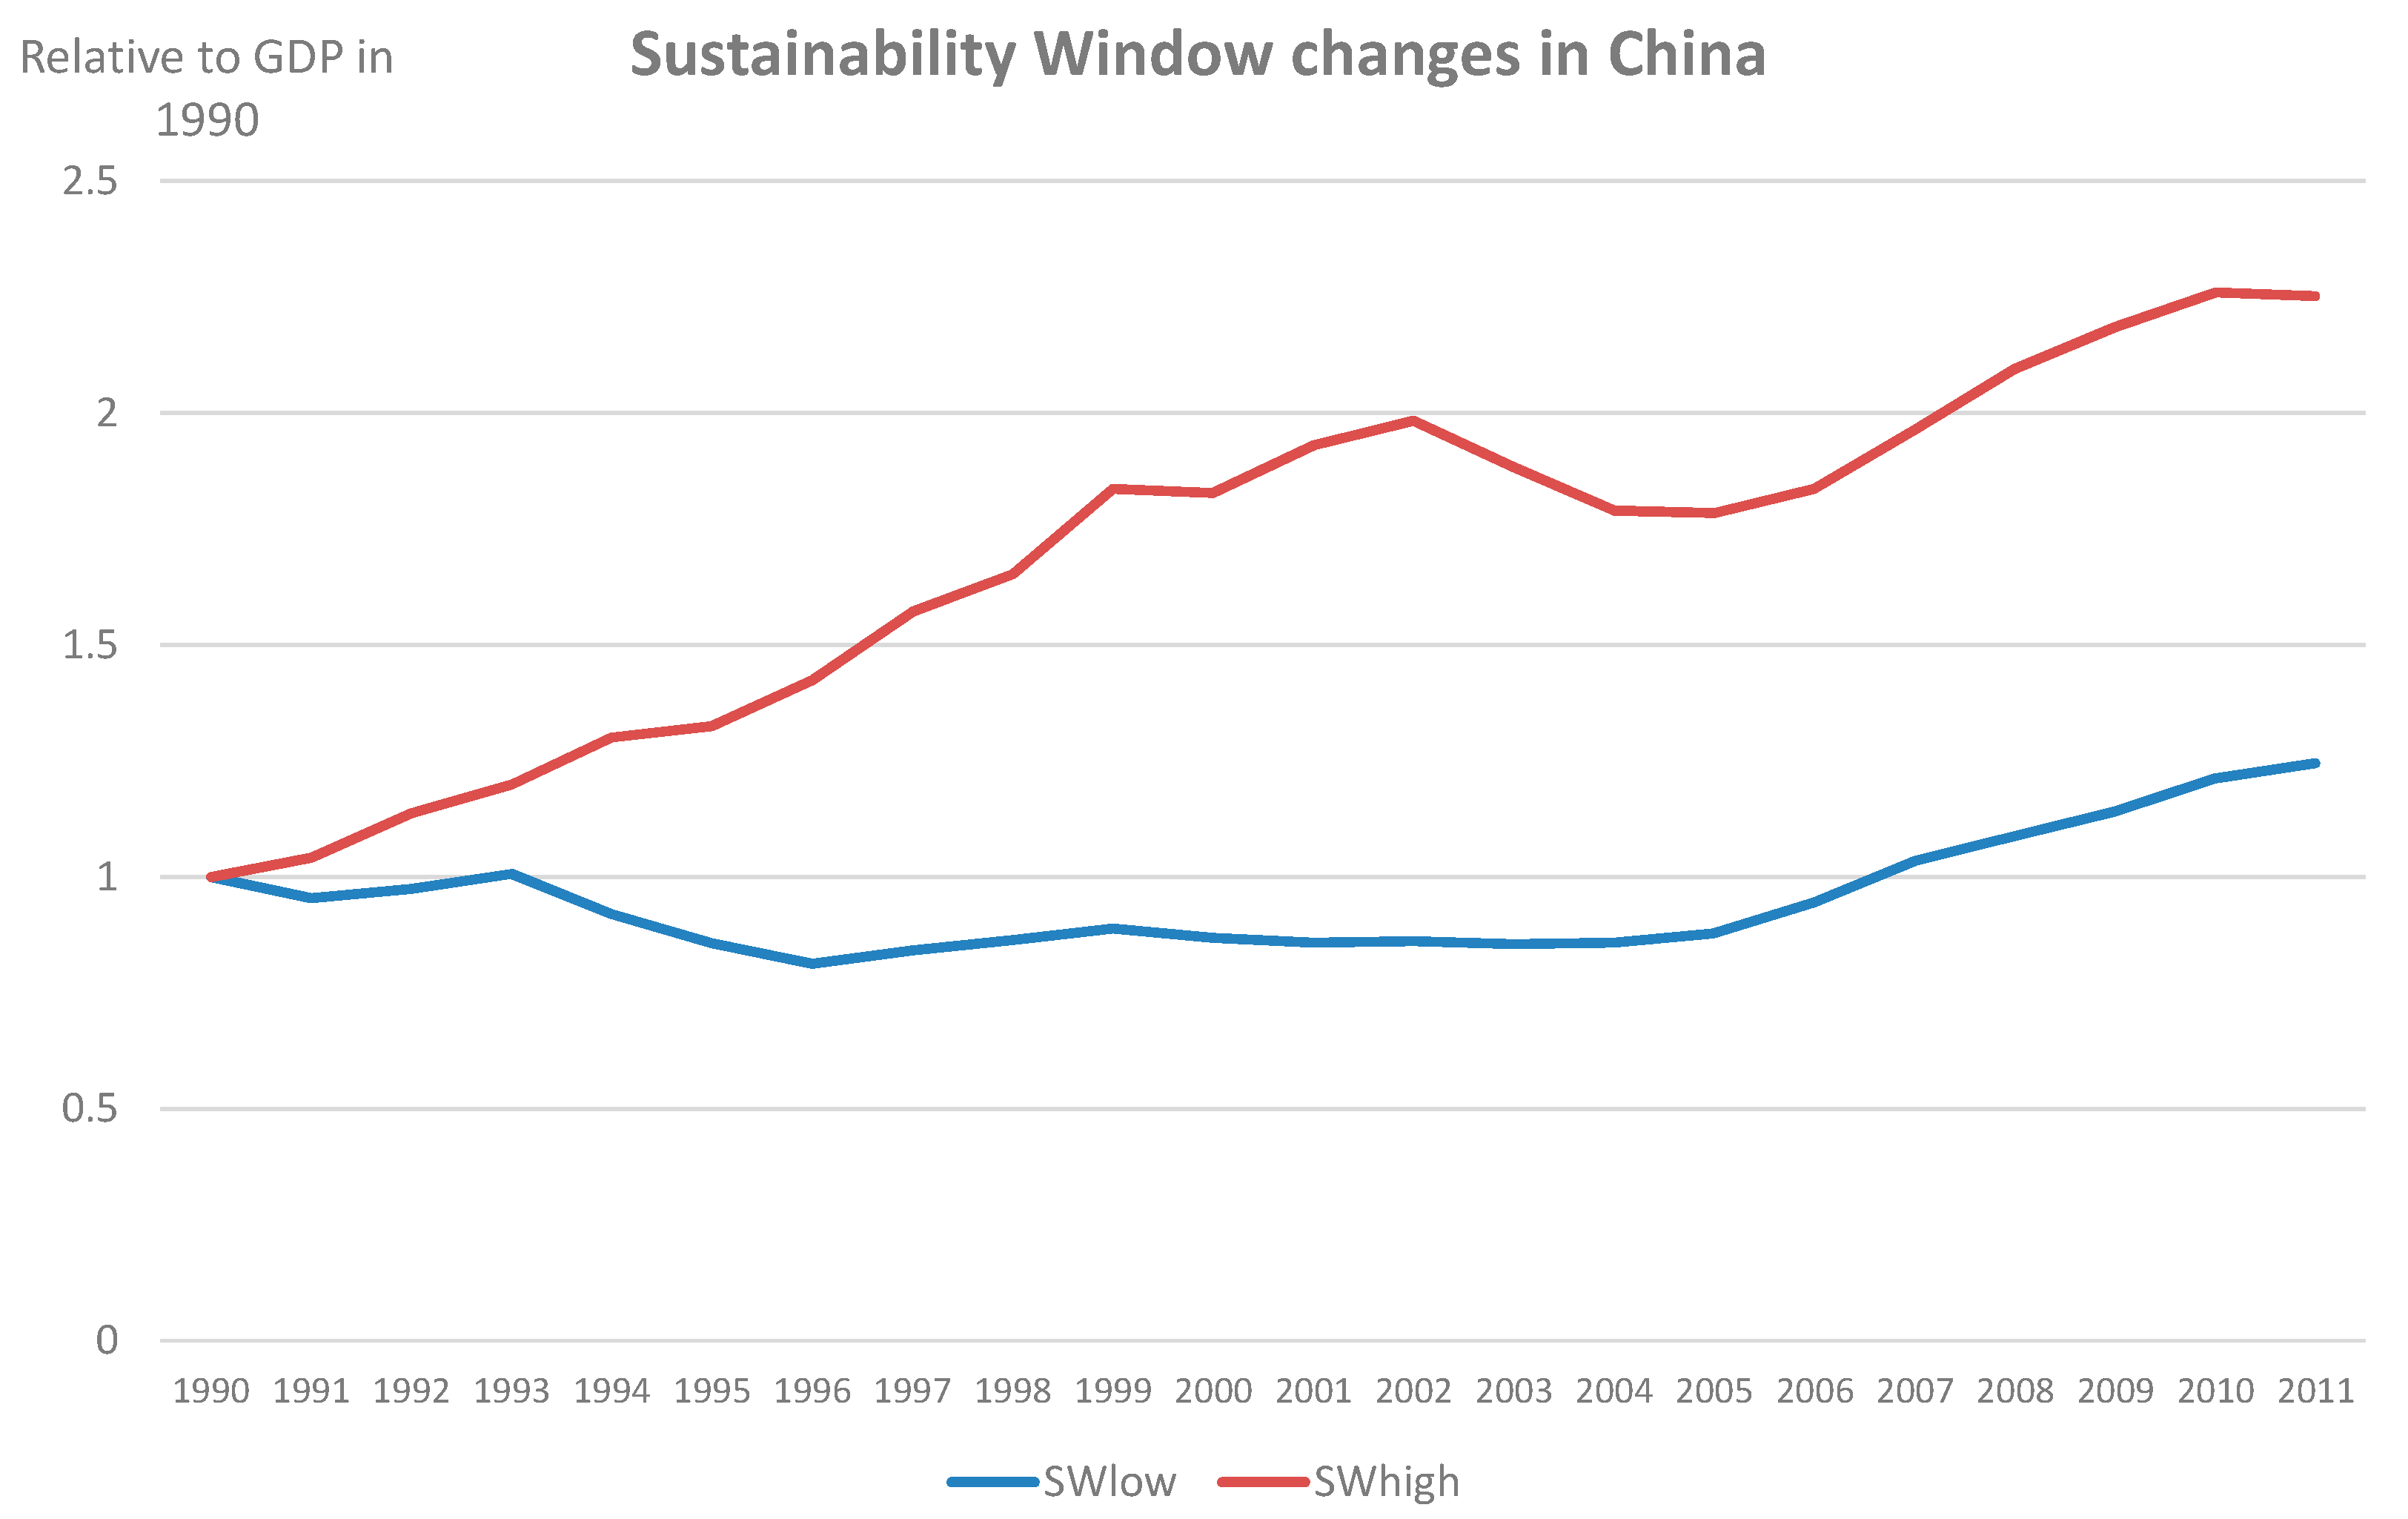
Figure 5 illustrates the changes in the minimum and maximum values of the Sustainability Window. The maximum value of sustainable economic growth (measured with the indicator of CO
2 emissions) increased quite fast in China up to 2002. During 2003–2007 there was, however, a downward bend in the curve due to the temporary increase in the CO
2 intensity of GDP, which was mainly caused by the fast increase in CO
2 emissions. During this period the CO
2 intensity of the Chinese economy increased after a long period of decreasing intensity. The result of this can be clearly seen also in the downward bend of the higher limit of sustainable economic growth.
The lower limit of the sustainable economic development has slowly decreased or stayed quite constant up to 2006 after which is has increased. This means that after 2006 the reduction of poverty has required higher economic growth than earlier. It seems that the Chinese policy of poverty reduction has not been as effective as earlier. Even though China has been able to reduce poverty considerably and has raised hundreds of million people out of poverty, the poverty reduction has required more economic growth than before.
Figure 5.
The changes in the higher and lower limit of Sustainability Window in Chinese economy determined by the CO2 emissions and the number of non-poor people measured as the volume of GDP in relation to the value of 1990.
Figure 5.
The changes in the higher and lower limit of Sustainability Window in Chinese economy determined by the CO2 emissions and the number of non-poor people measured as the volume of GDP in relation to the value of 1990.
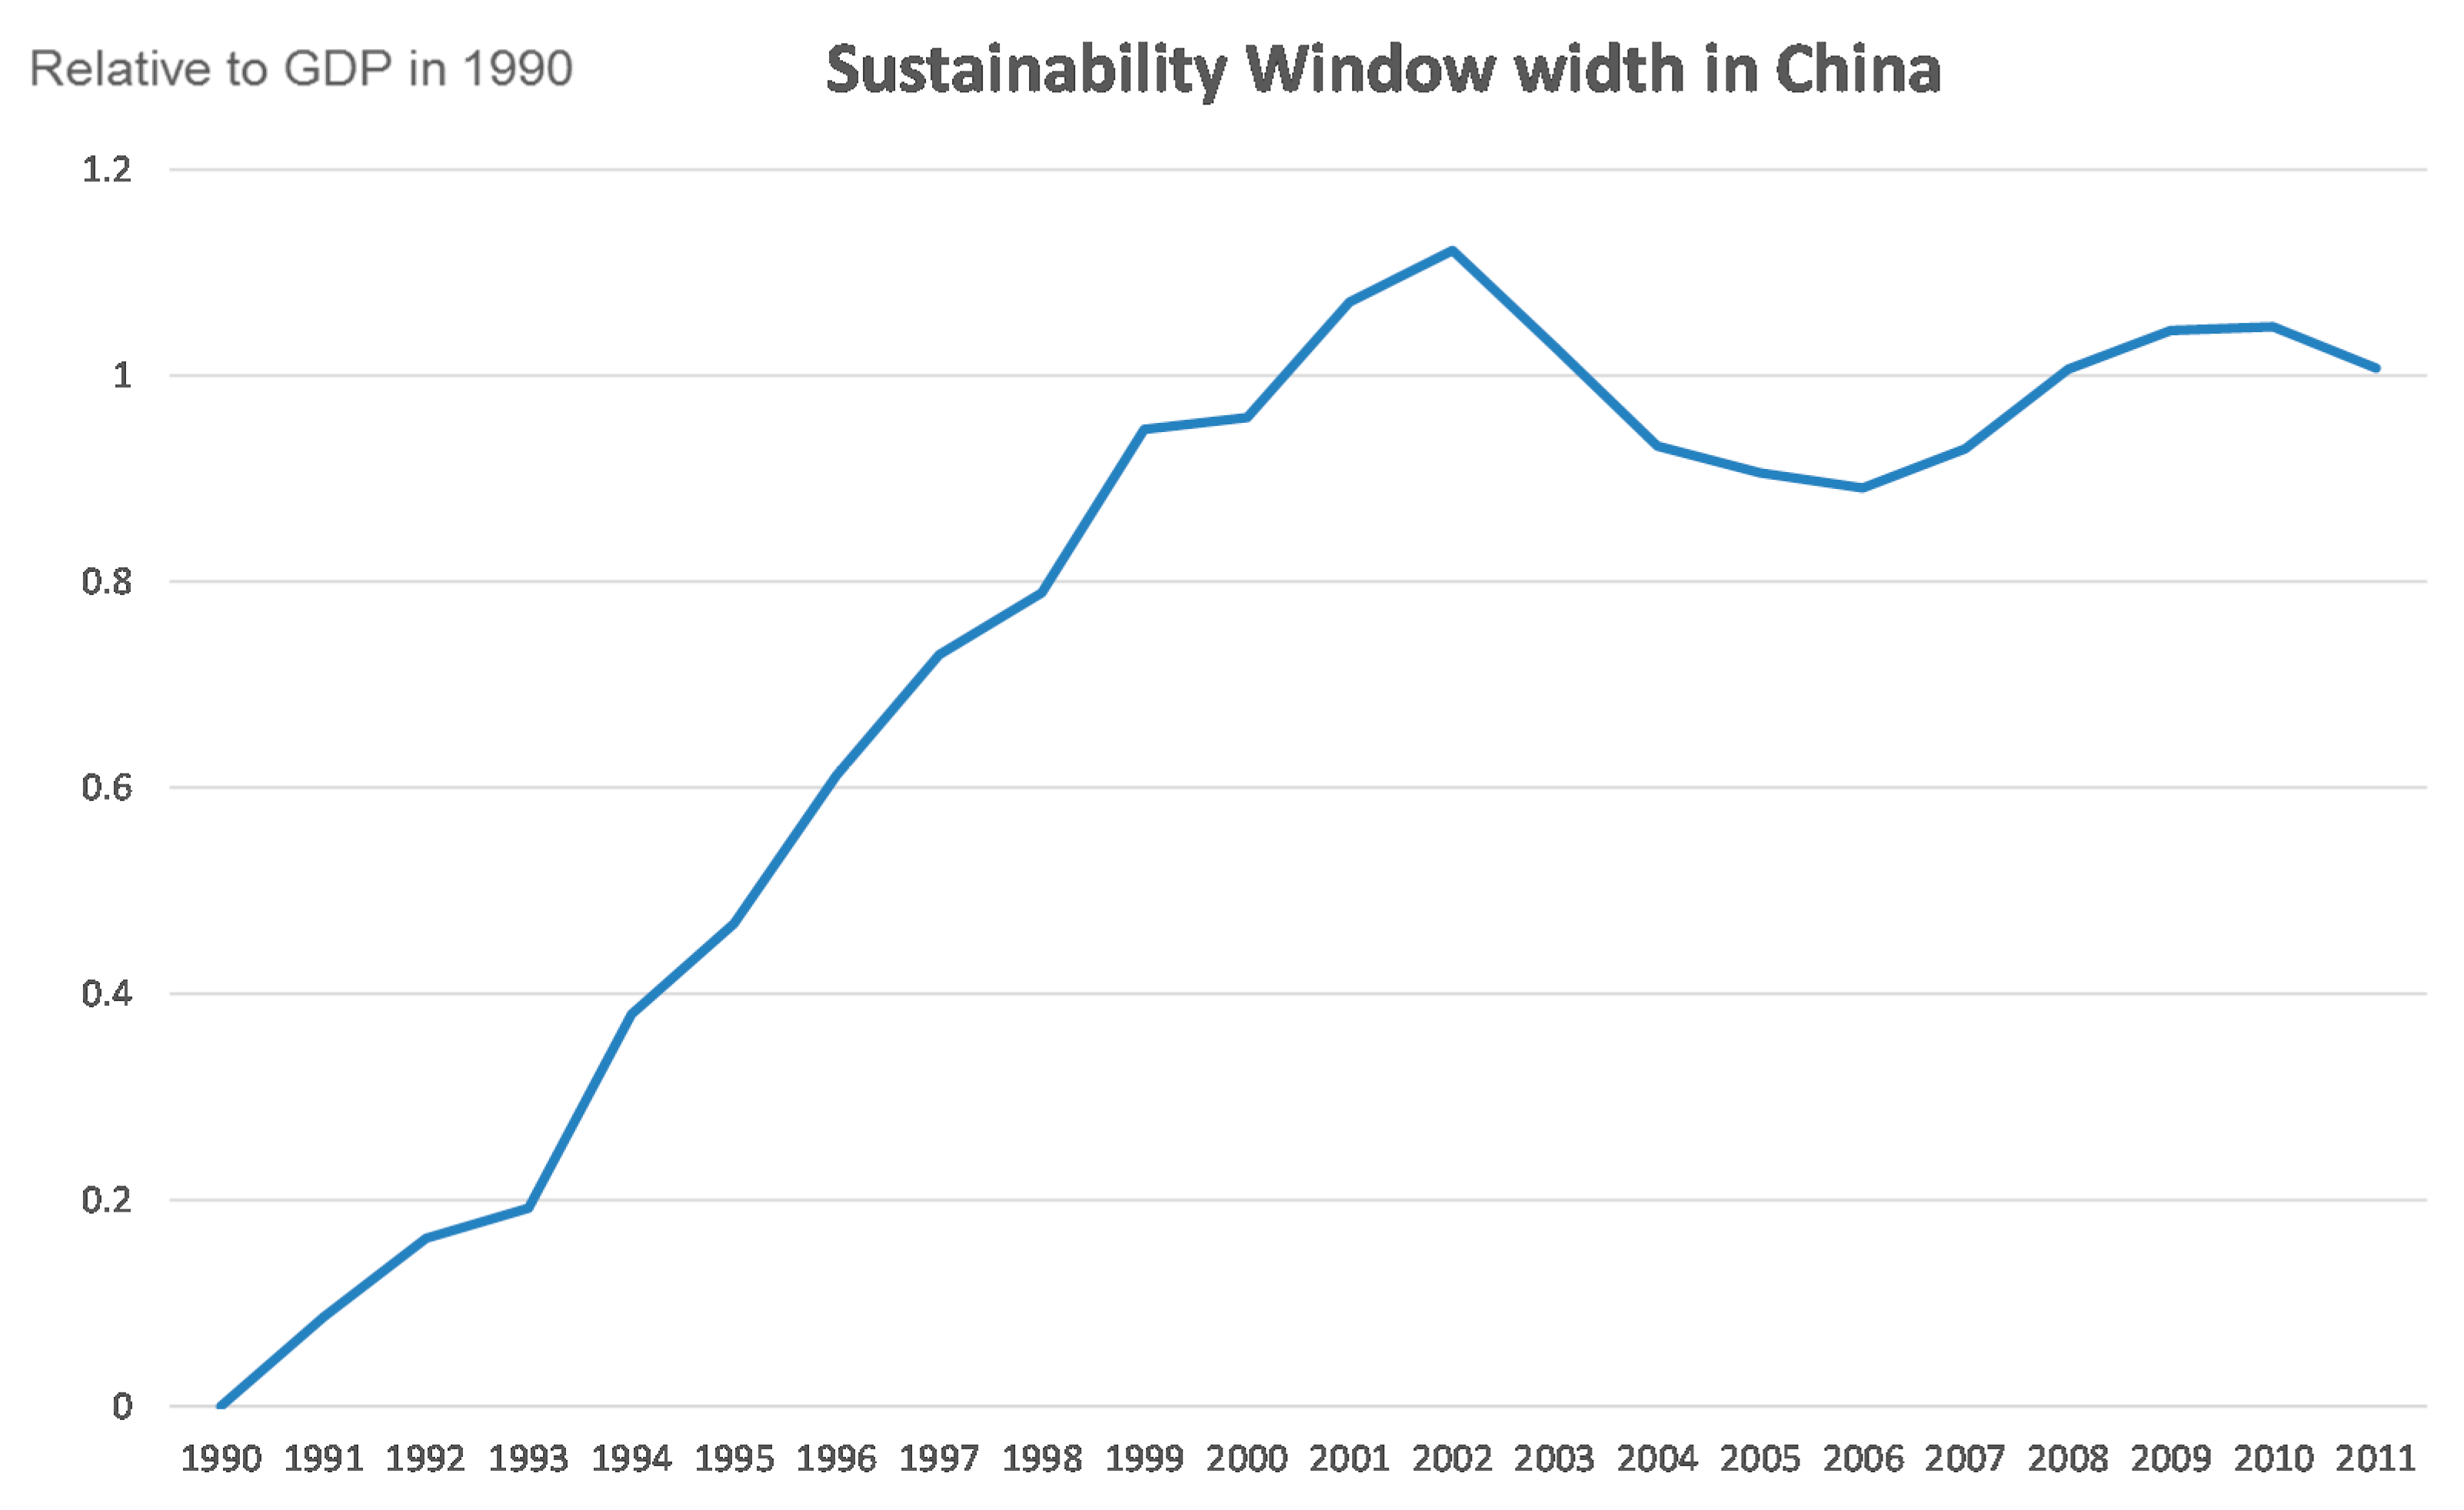
The width of the Sustainability Window of the Chinese economy is presented in
Figure 6. The window has become wider from the base year of 1990 up to the year 2002, but after that the width has not increased. This means that the room for maneuverer in the policy planning has not increased during the last years and the Chinese policy planning has fewer options to fulfill the different criteria of sustainable development. This dynamic approach of the Sustainability Window provides a possibility for predictive use of the SuWi approach. Predictions of future development can be based on the analysis of the trends of the lower and upper boundaries of sustainability and the width of the Sustainability Window.
The selection of indicators for the Sustainability Window analysis is important. With different indicators it is possible to get different Sustainability Windows, which describe the development relative to the selected aspect of sustainability. The use of composite indicators (see [
26]) provides one possibility to integrate more information in one analysis.
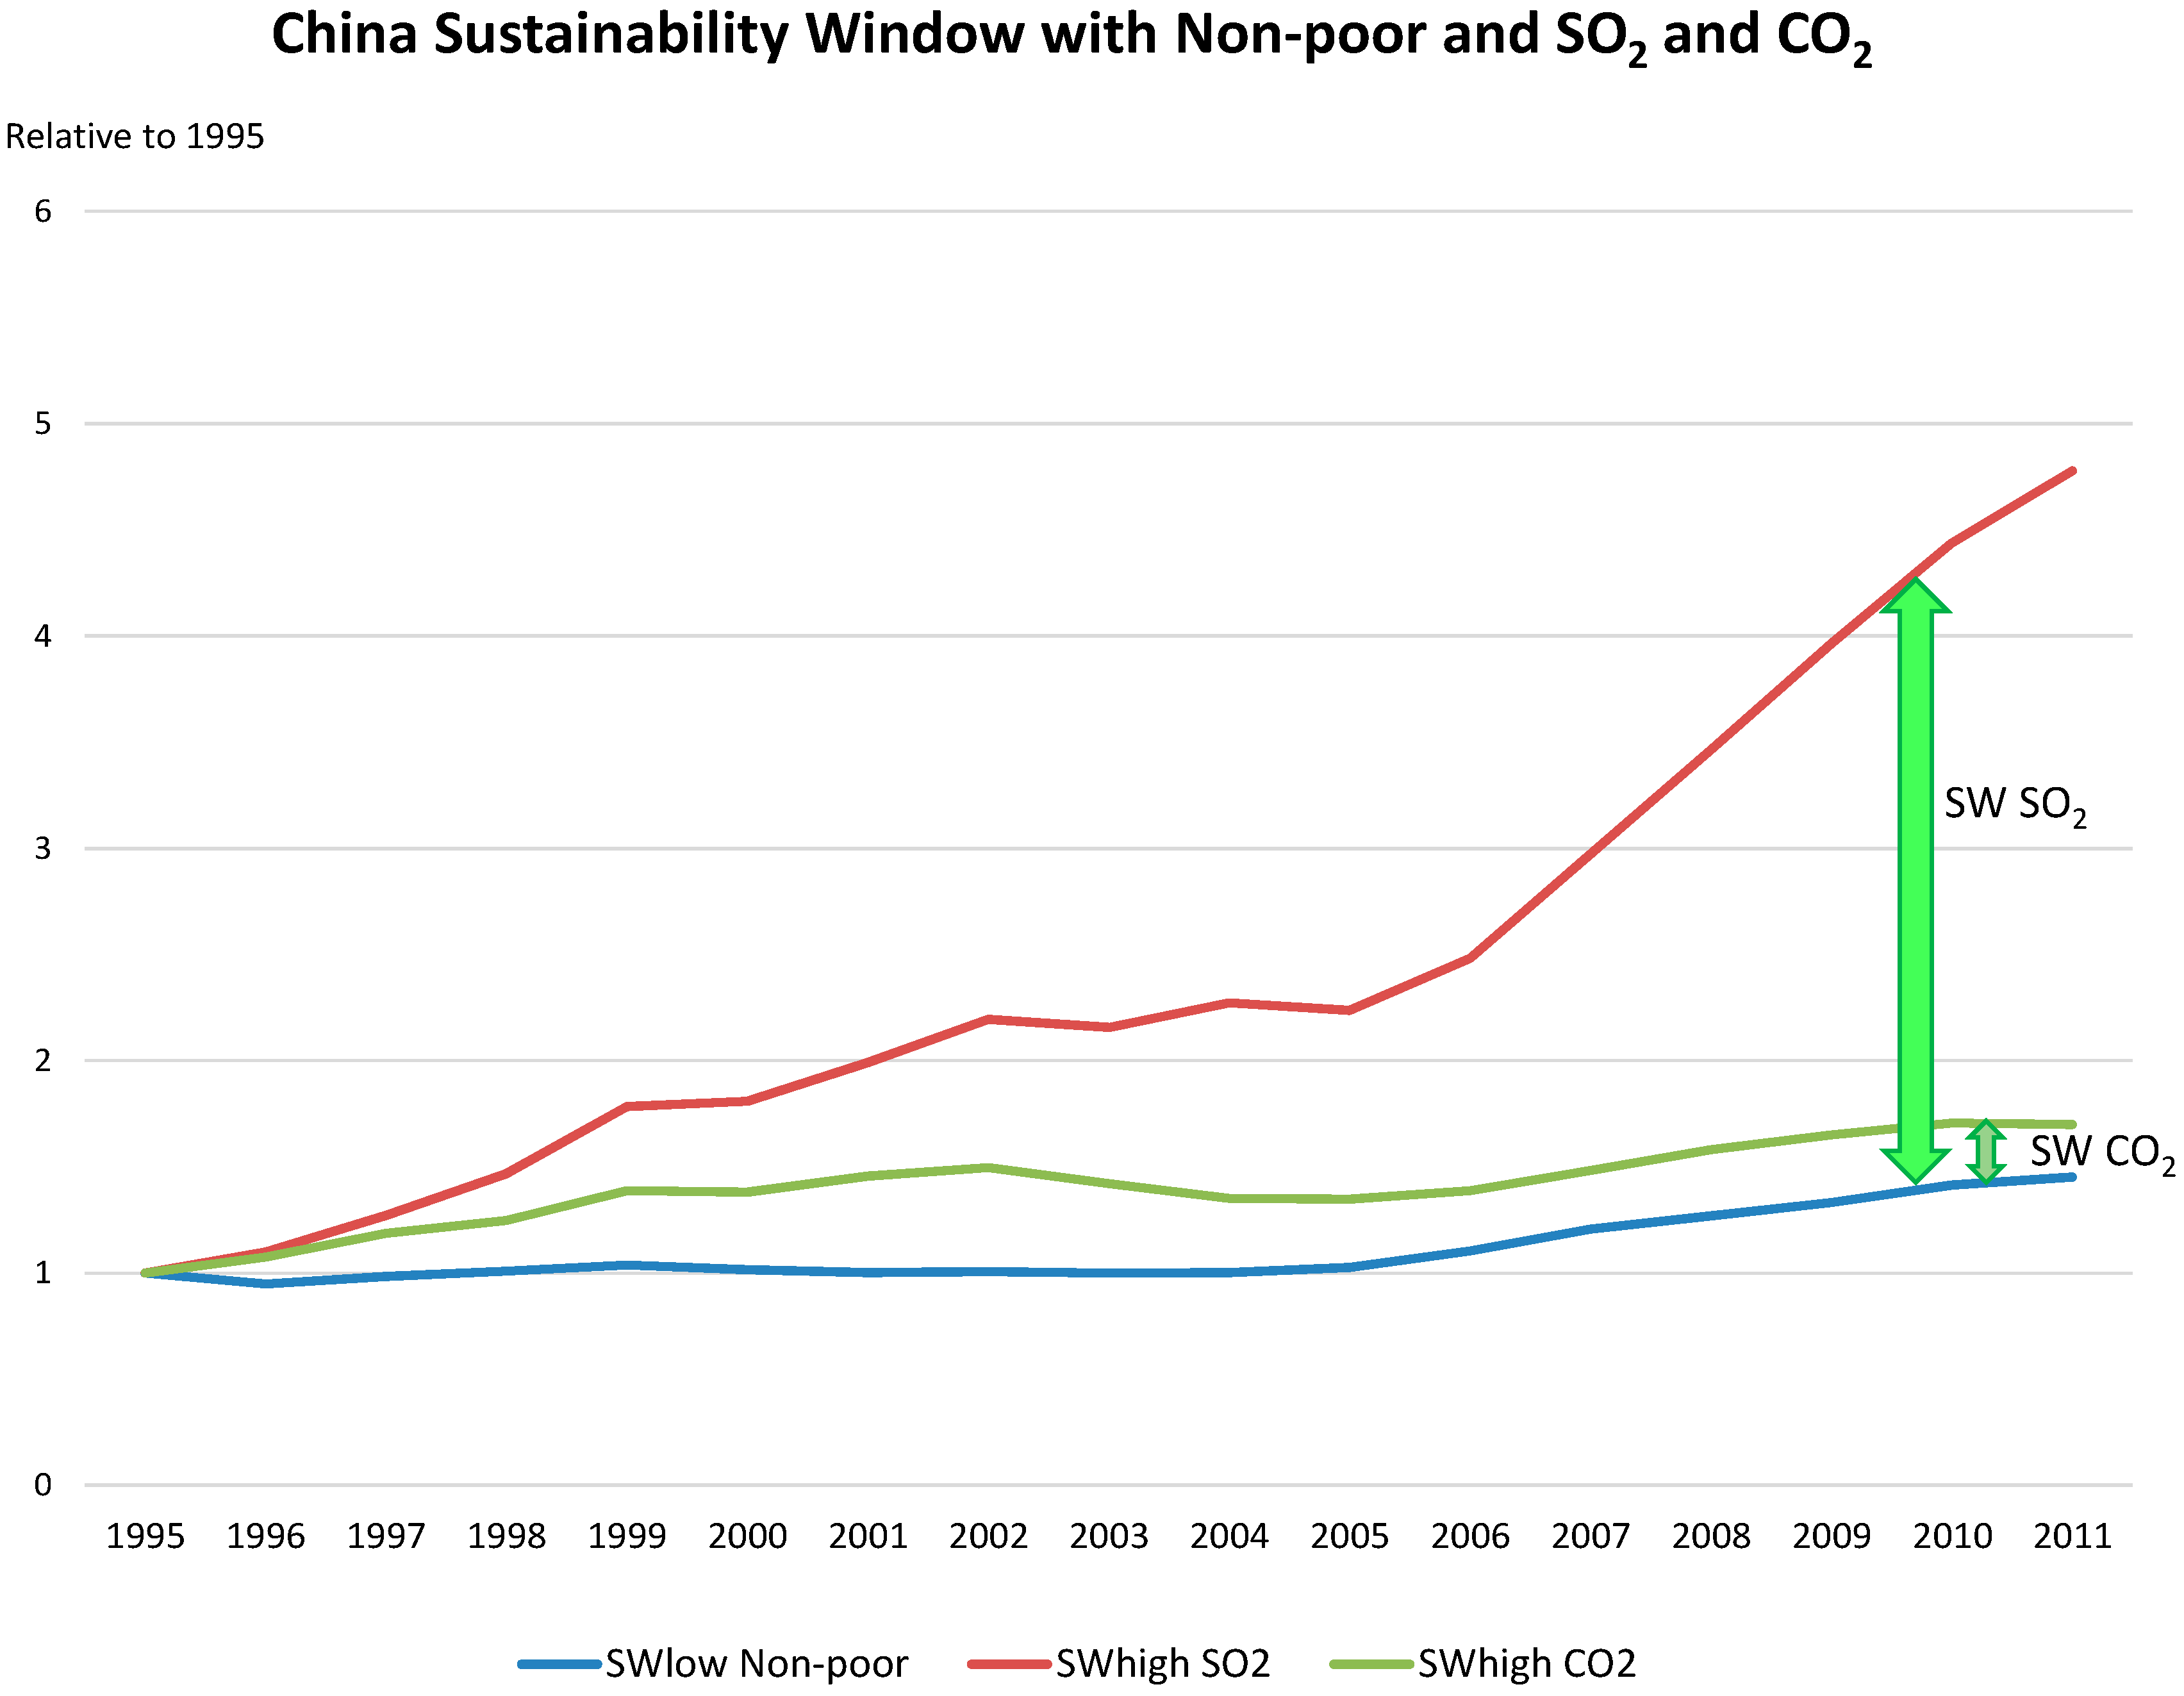
Figure 7 shows a comparison of Sustainability Windows and their dynamics calculated using GDP as the economic indicator, non-poor people as the social indicator, and sulphur dioxide (SO
2) emissions, as well as carbon dioxide (CO
2) emissions, as indicators for the environmental dimension for years 1995–2011. The sulphur dioxide SO
2 emissions are from the China Statistical Yearbooks [
27] and from [
28]. The two Sustainability Windows provide very different perspectives in relation to the environmental performance. The SuWi calculated with SO
2 emissions is much wider, indicating that the reduction of SO
2 emission intensity has been considerably greater than the reduction of CO
2 emission intensity. The SO
2 emission intensity has especially reduced after 2006, denoting the fast technological development of de-sulphurization.
Figure 6.
The width of the Sustainability Window in China determined by CO2 emissions and the number of non-poor people.
Figure 6.
The width of the Sustainability Window in China determined by CO2 emissions and the number of non-poor people.
Figure 7.
Sustainability Windows and their changes in China in relation to 1995 GDP, calculation based on the amount of non-poor population (SWlow) and the SO2 (SWhigh SO2) and CO2 (SWhigh CO2) emissions.
Figure 7.
Sustainability Windows and their changes in China in relation to 1995 GDP, calculation based on the amount of non-poor population (SWlow) and the SO2 (SWhigh SO2) and CO2 (SWhigh CO2) emissions.
Figure 7 also indicates the importance of the selection of the base year for which the comparisons are carried out. In
Figure 7 the base year is 1995, and in
Figure 5 the base year is 1990; the SuWi figures based on the calculation of CO
2 emissions look quite different. The Sustainability Window method provides an easy way to analyze the development dynamics in relation to different sustainability indicators as well as using different base years as the reference point. This is important in analyzing the impacts of different policy measures. The time lag from policy decisions to real changes in environmental, social, or economic impacts can be several years and this has to be taken into account when the efficiency of the policy is assessed.
4. Conclusions and Discussions
The developed method of analyzing sustainable development with the Sustainability Window provides a new simple way of assessing whether the development has been towards more sustainable direction or not. The developed method enables a simultaneous analysis of the sustainability in its three dimensions; social, economic, and environmental.
The results of the analysis depend on the selected indicators, but due to the simplicity and transparency of the method it is possible to easily carry out several analyses with different indicators and compare the results. The use of composite indicators provides one possibility to integrate more information in one analysis. The selection of the base year also has an impact on the results calculated with the SuWi approach.
The assessment of the dynamics of the Sustainability Window also enables the interpretation of cyclical types of development. The longer the available time series of indicators, the more information of different dynamics related to the sustainability can be observed using the SuWi approach. It can also provide information of stagnating societies and whether their development is towards a more sustainable state in relation to all three dimensions of sustainability.
The graphical presentation of the results makes it easy to understand the method and makes it very transparent for decision-makers. The dynamic SuWi evaluation can tell policy-makers what has happened in the economy in relation to the critical Brundtland sustainability criteria and what the future trends are. The Sustainability Window approach can utilize different indicators for assessing the sustainability of economic growth. The use of several indicators and the resulting several Sustainability Windows can provide novel information of the limiting critical factors for sustainability. The use of different indicators and different base years for the dynamic analysis of Sustainability Window can yield information of the limiting factors of sustainability as a function of time, shedding more light on the complex development process and related synergies and trade-offs.
The analyzed case of China using its GDP growth, CO2 emissions, and the number of non-poor people as indicators of economic, environmental, and social development provided interesting results of the changes in the size of the Sustainability Window. It seems that the widening of the Sustainability Window has reduced after 2002 due to the decrease in the speed of reduction of the CO2 intensity. This indicates the difficulty of the shift to a low-carbon economy.


