1. Introduction
Electricity contributes significantly to human life and societies today, and its lack impedes economic development. Gas turbine power plants are widely used technologies for the generation of electrical energy, in part because the gas turbines used in these power plants are currently inexpensive, relatively simple and quick-responding [
1].
About 70 years ago, gas turbines began to be applied for power generation, but over the past 20 years, global manufacturing of these kinds of turbines has increased twenty fold [
1]. One of the most typical applications of gas turbines in the power industry is satisfying the electrical load of a single facility. However, in countries such as Iran where fuels such as gas and gas oil are available, gas turbine units supply base loads [
2].
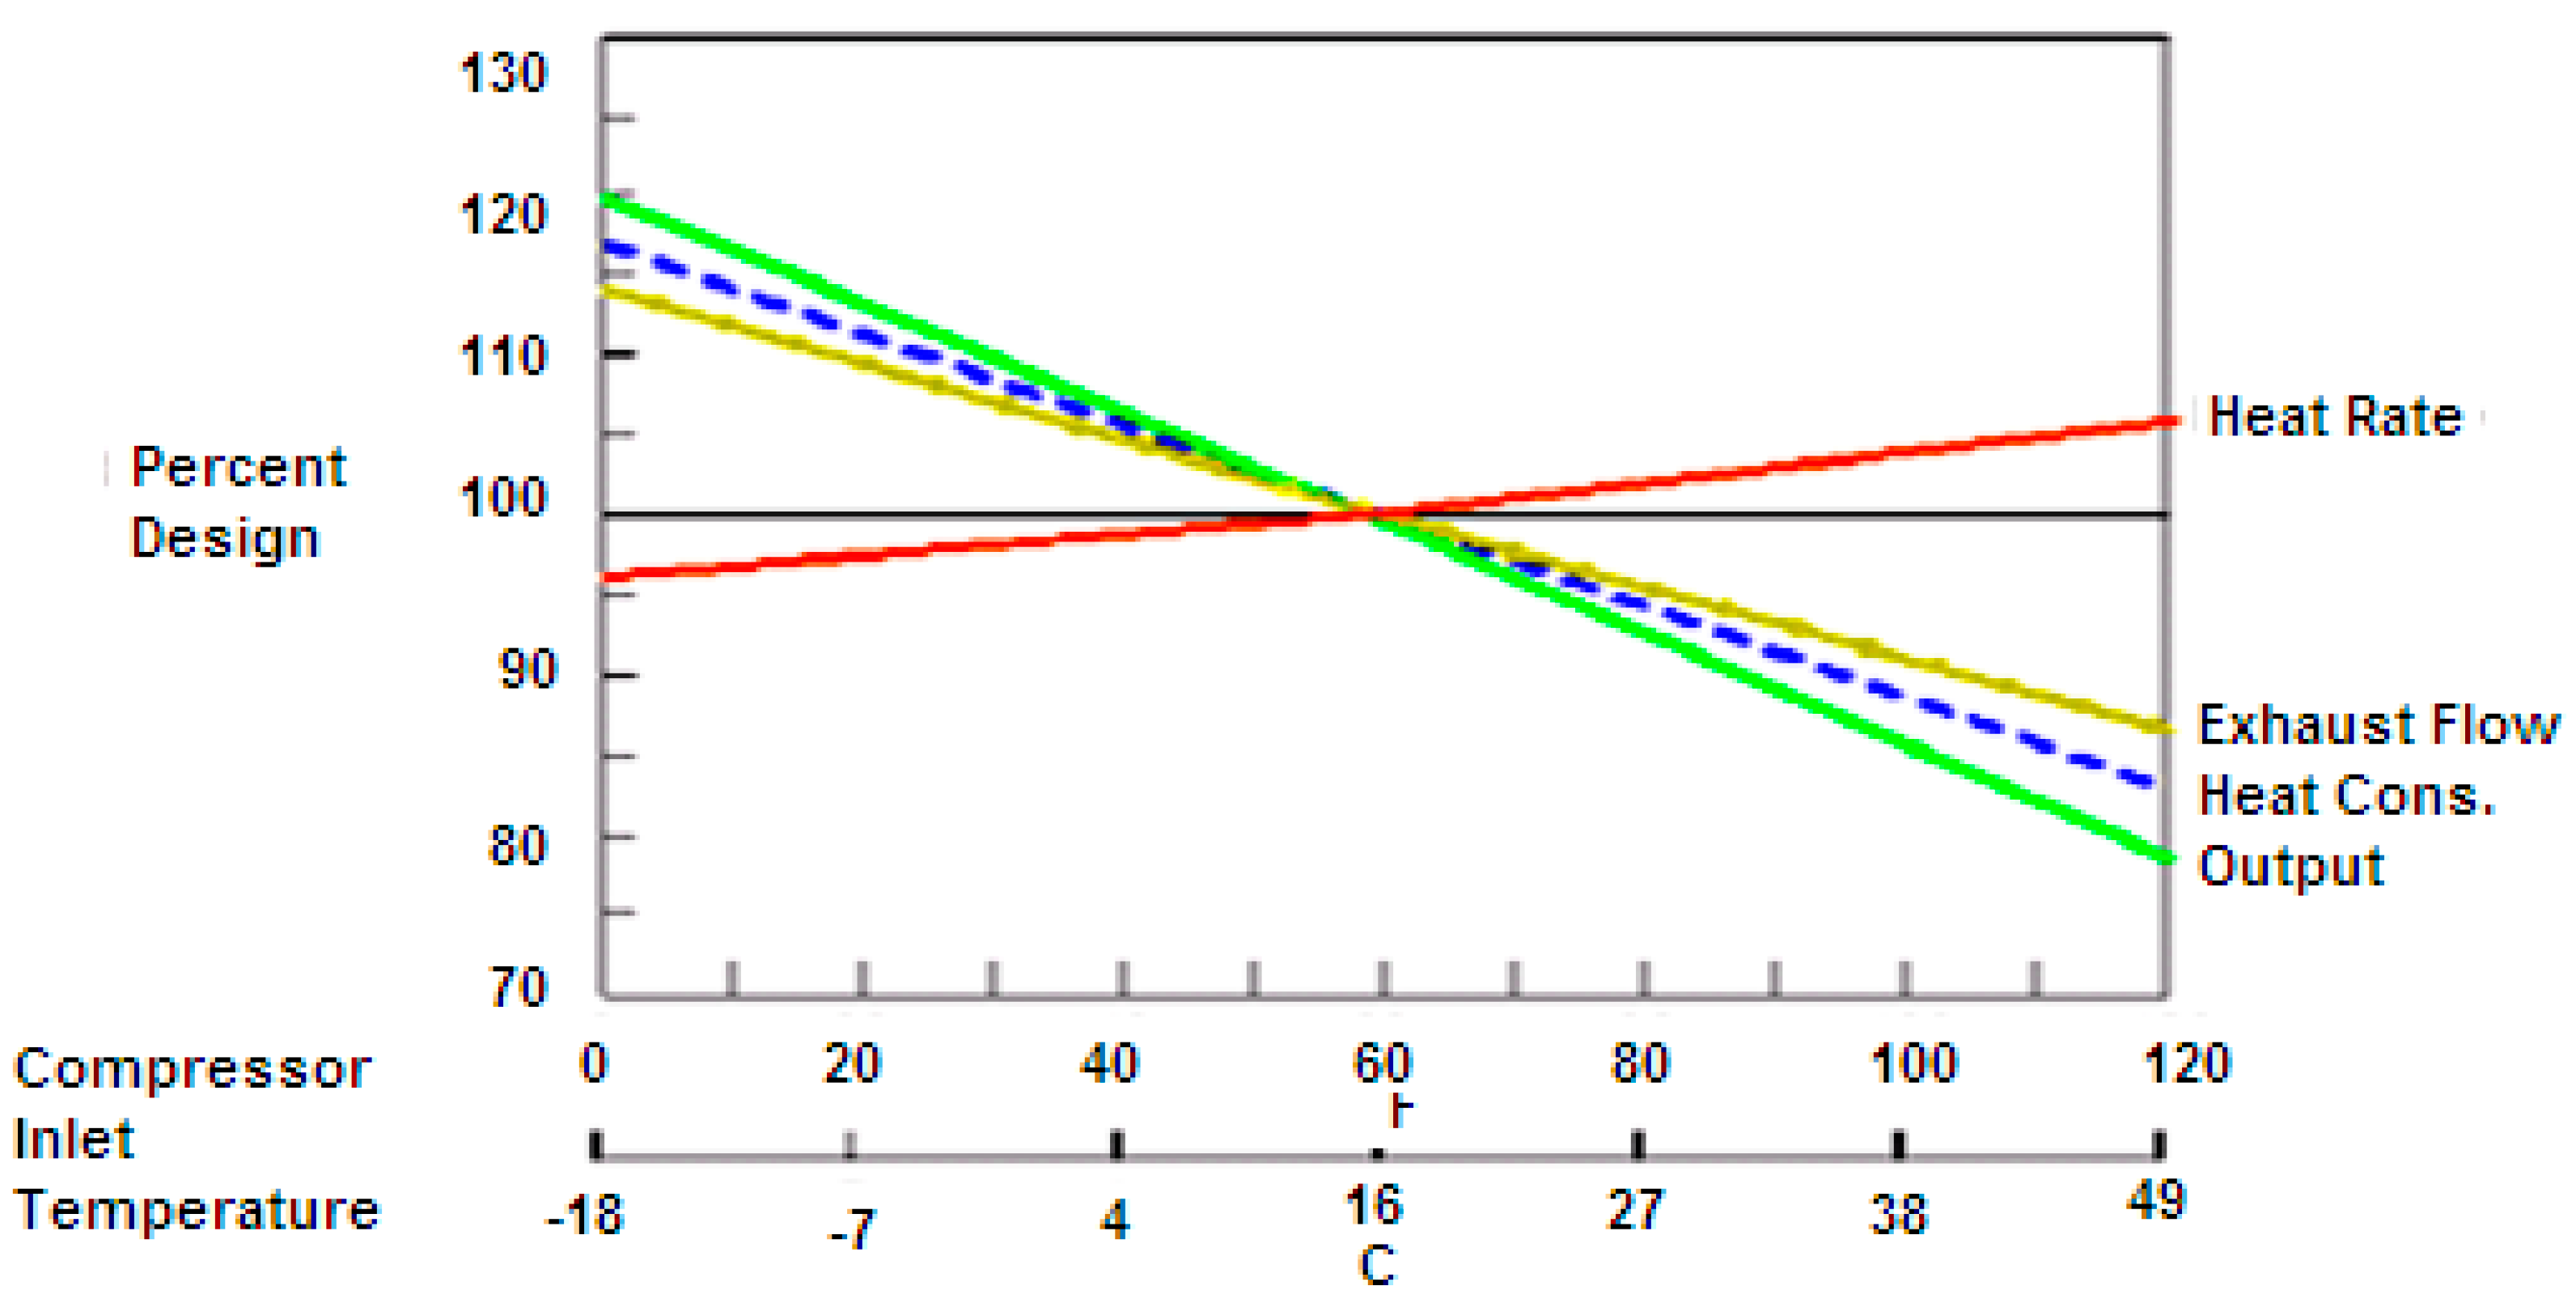
One inefficiency experienced by such power plants is a loss of electricity generation during hot seasons, as illustrated in
Figure 1. This is particularly problematic when the electrical demand peak occurs during these seasons and, sometimes, when demand exceeds power production for that area. This phenomenon occurs because gas turbines directly use the ambient air, so variations in ambient conditions such as temperature and pressure affect the turbine performance. Gas turbines operate in a continual cycle and intake a constant air volumetric flow rate, so air volumes entering the compressors experience a drop in density as the air is heated. Since turbine output power is directly related to the mass flow rate through it, a decrease in air mass flow rate leads to lower turbine output power. Simultaneously, the power required by the compressor to compress the input air (low density) increases in hot seasons [
1,
3]. These issues combine to decrease power generation.
Figure 1.
Relative variation of several gas turbine parameters with ambient temperature [
3,
4].
Figure 1.
Relative variation of several gas turbine parameters with ambient temperature [
3,
4].
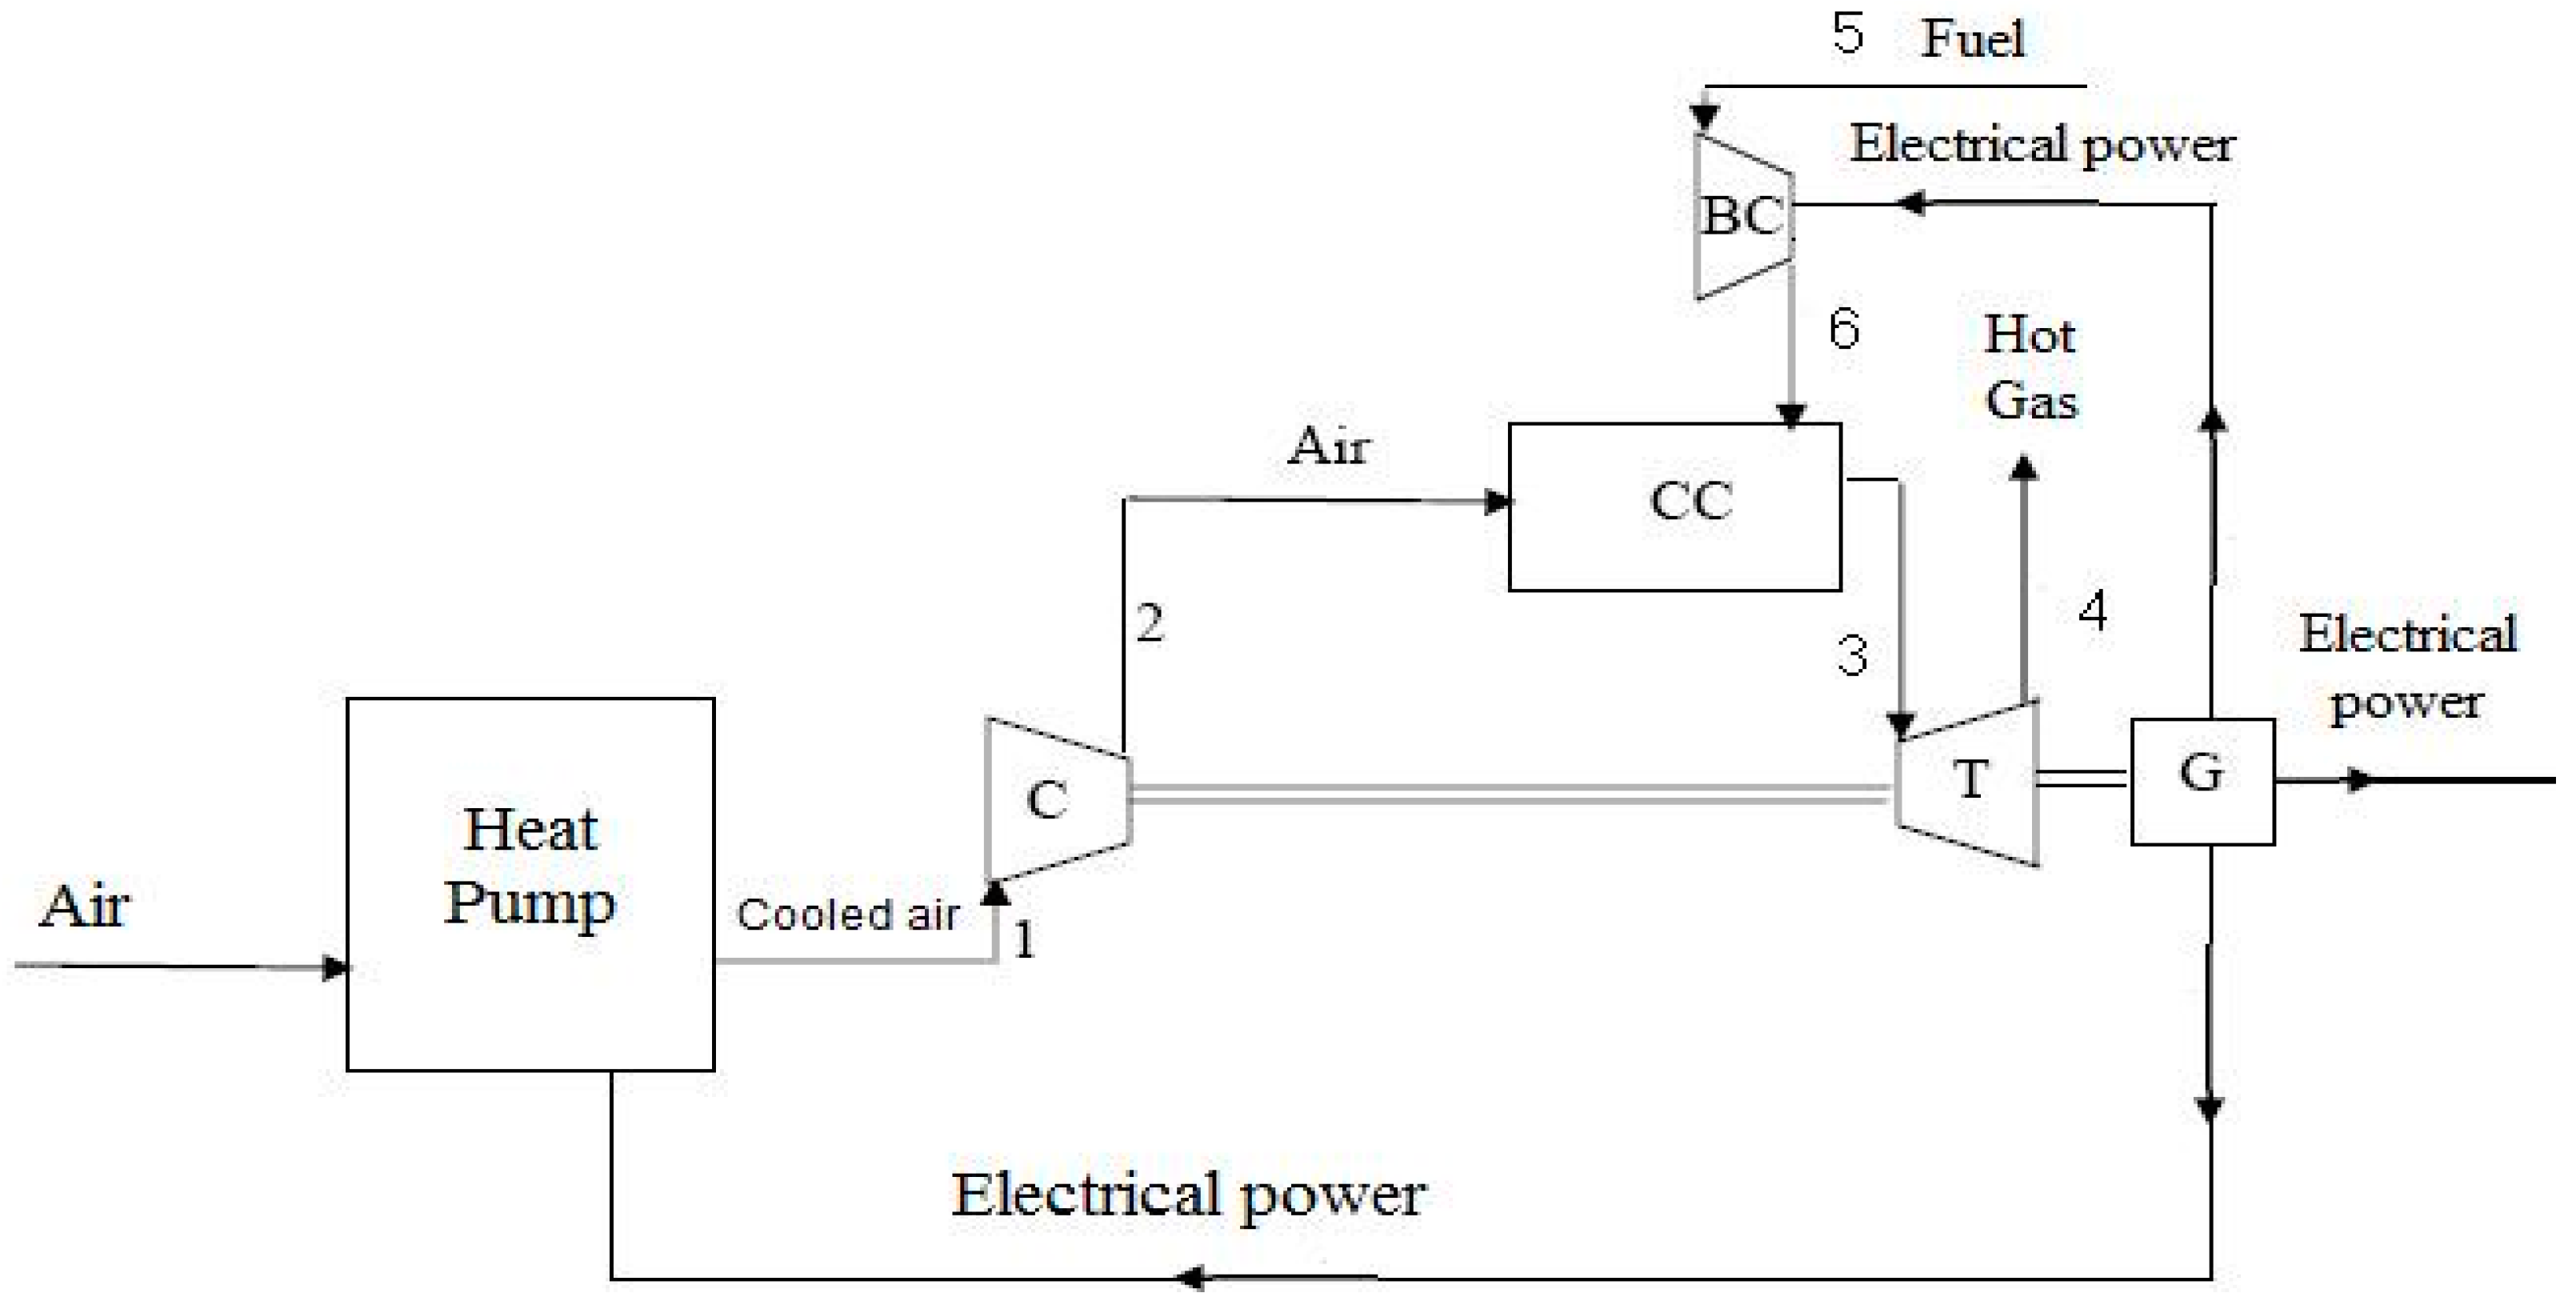
One approach to addressing this problem is to decrease the temperature of the input air, utilizing an air cooling system at the compressor inlet. This method can normally be implemented without modification of the main components of the gas turbine, as its components are generally independent of the main components of the gas turbine cycle. The approach is also relatively simple in terms of design and components. Various methods for cooling the input air to gas turbines can be designed and implemented, of which evaporative cooling systems are among the most common [
5].
It has been shown that, for every Centigrade degree of decrease in the air input to a gas turbine system, the output power increases by 0.5% to 1% [
5,
6,
7]. More than 700 gas turbine units around the world are equipped with input air cooling systems. These generally permit the density and mass of the input air to be elevated and the net output power and efficiency correspondingly increased. By corollary, lowering the temperature of input air decreases the system heat rate (fuel consumption per unit of electrical energy generated) [
5].
Although the installation of cooling systems and their use is somewhat costly, they prevent a loss of power and waste of energy (due to higher total efficiency), generally decreasing the total costs of energy provision and eliminating the need for installation of additional gas turbines [
5,
6,
7]. Thus the additional costs for inlet cooling are usually offset by the economic savings it provides.
For a country like Iran, located in a relatively warm region, the use of input air cooling systems in gas turbines is often necessary [
7,
8,
9]. Depending on the specific task, it is often necessary to select several input air cooling methods appropriate for the climatic conditions of the area and to technically and economically determine a suitable method for input air cooling. Often, this can be accomplished appropriately and inexpensively by simulating the turbine behavior in the actual situation. Simulation of a gas turbine is dependent on having a suitable procedure to investigate the impact of ambient conditions on the output parameters (power and efficiency) of gas turbines. Simulation is normally carried out based on characteristic curves representing performance and modeling of each component using thermodynamic relations. Vapor compression cooling systems can use to achieve desired coolant temperatures and temperature decrease of the input air to the turbine compressor. At temperatures lower than 5 °C, however, ice may form at the input air and damage the compressor. Therefore, a minimum permissible temperature of 5 °C is considered for the current research [
5].
Some research has been conducted in this area. Ameri and Hejazi used lithium bromide absorption chiller to increase the output work of a Frame 5 gas turbine (16.6 MW) in Chabahar port, Iran by about 11.3% [
9]. Abdollahian investigated the potential increase in cycle power of a plant in Kerman, Iran using several compressor input air chillers and demonstrated that absorption chillers increase the output power by about 16% [
10]. Through a techno-economic analysis of application of absorption and compression chillers to cool the input air of gas turbines, Sanaye and Safari determined that turbine power increased 0.6% to 0.8% for every degree of decrease in compressor input air temperature, based on a study on a gas turbine with a nominal power of 56.8 MW in Imam Port, Iran [
11]. Ameri
et al. investigated the output power of Frame 5 and 6 gas turbines at the Kish Island, Iran gas power plant using absorption chillers for inlet air cooling, and found that this method raised the output power of gas turbine by about 14% [
12]. Mohanty and Poloso used absorption chillers on gas turbine inlets in Bangkok to decrease the compressor input air temperature about 15 °C, achieving an increase in turbine output work of 11% [
13]. Boonnasa
et al. increased the turbine work output of two of gas turbines units of 110 MW capacity in Thailand by 10.6% by applying absorption chillers for compressor inlet air cooling [
14]. Boonnasa and Namprakai used a lithium-bromide absorption chiller to improve the output work of a gas turbine cycle in a 400 MW power plant in Thailand by 9.3% [
15]. Dawoud
et al. compared gas cycle input air cooling systems in two areas in Oman. They concluded that fog chillers increase electrical energy generation by 11.4% more than a fog cooling system [
16]. They also investigated such other systems as evaporative cooling units and lithium-bromide water absorption chillers. They concluded that these two systems generate 40% and 55% more electrical power respectively than a fog cooling system [
16]. Farzaneh-Gord and Deymi-Dashtebayaz investigated the effects for Khangiran power plant in the south Iran of input air cooling by two common methods (evaporative cooling and mechanical chillers) and a new method based on extra gas pressure derived from gas pressure diminution stations [
17]. They found that system efficiencies are raise using absorption chiller (by 5%), evaporative cooling (3%) and the turbo-expander method (4%) [
17]. Wang and Chiou examined the effect of simultaneous vapor injection and input air cooling on a frame 7B turbine in Taiwan, and demonstrated that turbine output power increased from 52.1 to 88.2 MW and total efficiency from 29.0% to 37.2% during the summer [
18]. By investigating the performance of a gas cycle including two high-pressure and low-pressure compressors and an inter-cooler evaporative chiller with a heat recovery system, Basilly found that cooling the compressor inlet air with an absorption chiller increased the efficiency and the turbine power 3.5% and 50%, respectively [
19]. Al-Ibrahim and Varnham showed in Saudi Arabia that decreasing compressor input temperature from 50 to 10 °C increased the output power by 30% in Riyadh and by 33% in Ghasim [
20]. In a study of gas turbine cycle performance, Bassily demonstrated that reducing the compressor inlet temperature by evaporative chilling elevated the cycle efficiency by 3.5%, and that evaporative cooling and heat recovery in the compressor outlet (after-cooling) as well as input air cooling by evaporative chilling increased the cycle output by 16% and the power by 110 kW [
21]. Sanaye
et al. investigated several methods for input air cooling in gas turbines with capacities of 25–100 MW and found that using thermal energy storage increased plant output power by 3.9%–25.7% and efficiency by 2.1%–5.2% [
22]. Farzaneh-Gord and Deymi-Dashtebayaz showed for gas turbines at Khangiran power plant located in the south of Iran that reducing the compressor inlet temperature from 25 to 4 °C can increase gas cycle efficiency by 1.5% to 5% for about 10 months of the year [
23]. Alhazmi and Najjar investigated two gas turbine cooling methods and found that (1) lowering the input temperature from 15 to 3 °C by water injection in the input air in arid and hot climates increased the output power and cycle efficiency by 1%–7% and 3%, respectively; and (2) using a cooling coil in cold and humid as well as hot and humid climates, respectively, increased turbine power by 10% and 18% [
24]. Salvi and Pierpauli optimized a vapor injection system for input air cooling for an Alison 501 gas turbine and achieved a 17% increase in power generation compared to previous research [
25].
It was evident that no research has been reported that uses a complete investigation including exergy, economic and environmental analyses. So, in current research, we use a heat pump to cool the compressor inlet air to a Siemens V94.2 gas turbine in a region with an arid and hot climate (Yazd, Iran) with and one with a relatively moderate climate (Tehran, Iran). The objective is to improve understanding of the performance of the system. The approach taken in this study, which includes several innovative aspects, involves a feasibility analysis of gas turbine inlet air cooling using heat pumps, supporting energy, exergy and economic analyses, and determination of the social costs of air pollutants, fuel consumption, electricity cost and payback period for the capital investment of a heat pump installation in Yazd and Tehran.
3. Analysis of Cycle Thermodynamic Processes
The compressor output temperature and pressure and work consumption are determined as follows [
6,
7,
26]:
Here, T
1 is the compressor inlet temperature (K), η
c is the compressor isentropic efficiency, r
c is the compressor pressure ratio, k is the ratio of constant pressure specific heat to constant volume specific heat, P
1 is the air compressor inlet pressure (kPa) and R is the gas constant. Data on the relevant gas components are given in
Table 1. Due to the pressure difference between Yazd and Tehran with ISO conditions, we calculate the pressure difference coefficient. This is done by considering a pressure drop of 1 kPa across the compressor inlet valve and air pressures of 87.3 kPa and 87.7 kPa for Yazd and Tehran, respectively, and 101.3 kPa as the ISO pressure, and the following expression:
Here, x denotes the pressure correction factor, P the ambient pressure (kPa), P
comp the pressure drop in the compressor inlet channel (kPa), and P
0 the reference environment pressure (101 kPa). This pressure correction factor is found to be 0.85 for Yazd and 0.86 for Tehran [
26].
Note that the compressor is of a booster type, and the temperature, output pressure and specific work are determined as in Equations (1)–(3). To investigate and design the combustion chamber, we use data for the natural gas used by the gas turbine (see
Table 2) [
6,
7].
Table 1.
Analysis of the gas consumed by the gas turbine.
Table 1.
Analysis of the gas consumed by the gas turbine.
| Parameter | Constituent |
|---|
| CH4 | C2H6 | C3H8 | C4H10 | CO2 | N2 |
|---|
| y, % by mole | 81 | 7.9 | 4.2 | 4.7 | 1.2 | 1 |
| x, % by mass | 62.58 | 11.44 | 8.92 | 13.16 | 2.55 | 1.35 |
| M, kg/kmole | 16 | 30 | 44 | 58 | 44 | 28 |
| Cp, kJ/kg K | 2.25 | 1.76 | 1.67 | 1.64 | 0.84 | 1.04 |
The molecular mass and gas constant of the fuel can be calculated as follows [
6,
7]:
where M denotes the mixture molecular mass (kg), M
i the molecular mass of component i (kg), y
i the molar fraction of component i, R
u the universal gas constant (kJ/kmole K) and R the gas constant (kJ/kg K).
The chemical reaction within the combustion chamber is as follows:
where r
a is the air-fuel molar ratio and the following balanced equations are considered:
Here, P
3 is the pressure in the combustion chamber (kPa), and K
co and K
no are equilibrium constants.
We can also write
where
is the mass flow of products (kg/s),
is the mass flow of reactants (kg/s),
ηcc is the efficiency of the combustion chamber, h is specific enthalpy (kJ/kg),
h˚ is the specific enthalpy at the reference temperature, and
h˚ƒ is the enthalpy of formation.
The pressure in the combustion chamber is calculated as follows:
where n
3 denotes the number of moles entering the combustion chamber, T
3 the inlet temperature to the combustion chamber, P
4 the combustion chamber pressure (kPa), n
4 the number of moles exiting the combustion chamber and T
4 the combustion chamber temperature (K).
The gas turbine output pressure and temperature are calculated as follows:
where T
4 denotes the turbine output temperature (K), η
t the polytropic efficiency of gas turbine, r
t the gas turbine pressure ratio, and P
4 the gas turbine output pressure (kPa).
The output work of turbine per unit mass can be expressed as:
The net generation rate of work by the gas turbine can be written as follows:
where
denotes the net-work rate generated by the gas turbine (kW),
the consumer work per unit mass flow through the fuel compressor (kJ/kg),
the air flow rate (kg/s), and
the fuel flow rate (kg/s).
The first law (energy) efficiency η
I of the gas turbine can be determined as follows [
6,
7,
27]:
where
LHV denotes the lower heating value of the fuel (kJ/kg). The first law efficiency expresses the rate of electricity generation divided by the energy consumption rate with fuel.
4. Exergy Analysis of Gas Turbine
Exergy is often treated as being composed of physical and chemical exergy.
Expressions for specific physical and chemical exergy can be written, considering a gas-like flow behavior, are as follows [
6,
7,
28,
29]:
Here, e
ph denotes specific physical exergy (kJ/kg), e
ch specific chemical exergy (kJ/kg), e
ch,i specific chemical exergy of component i of fuel (kJ/kg), T
o the reference environment temperature (taken here to be 298.15 K), and P
o the reference environment pressure (taken here to be 101.3 kPa).
With these components, specific total exergy e
t (kJ/kg) can be written as [
6,
7,
28,
29]:
The entropy generation rate
(kW/K) can be expressed for the overall system as follows [
6,
7]:
The second law efficiency
ηII can be written as [
6,
7,
28]:
The second law efficiency represent the amount of useful energy derived from the system divided by the difference between the input and output exergies from system.
5. Analysis of Gas Turbine with Compressor Inlet Cooling Using a Heat Pump
Compression refrigeration systems are flexible in terms of operation in varied environmental conditions (humid and arid) and by using them, it is possible to achieve low temperatures. But if the temperature drops below the saturation point, water drops can form and leak into the compressor, which can damage the compressor blades. In applications of compressive cooling systems, measures must be taken to prevent the formation of water drops at the compressor inlet or to expel liquid drops (for example, embedding grooves inside the compressor inlet channel can expel water) [
5]. Also, as noted earlier, at temperatures lower than 5 °C, ice rimes may appear at the compressor inlet due to the air speed, potentially damaging the compressor blades. Therefore, the minimum accessible temperature in these systems is 5 °C and sometimes, for economic reasons, the optimal temperature is considered higher [
5]. In the current study, the temperature of the compressor inlet air is considered to be 5 °C.
The required cooling load
(kW) can be calculated as follows [
6,
7]:
where
ha is the specific enthalpy of ambient air (kJ/kg) and
ha is the specific enthalpy of compressor inlet air (kJ/kg). Values for
ha as a function of ambient temperature and moisture content are obtained using software packages or psychrometric diagrams. Knowing the ambient temperature is 5 °C and its relative moisture content, we can calculate the specific enthalpy at this point. If point 1 is not saturated by the cooling procedure (assuming a constant moisture ratio during the process), we determine
as follows [
16]:
We can calculate the air mass flow rate using ideal gas relations for the constant volumetric input rate of air into the compressor. Here, is the ratio of input air moisture, Cpa is the thermal capacity at constant pressure of air (kJ/kg) and Cpv is the thermal capacity at constant pressure of water vapor (kJ/kg). The maximum cooling load necessary during the hottest month of year is evaluated to be about 12,900 kW for Yazd and about 11,600 kW for Tehran.
Knowing the functional coefficient of performance COP of the heat pump, we can obtain the energy consumption rate by the compressor, which is supplied by the power plant generator:
This compressor work rate into the heat pump must be considered when calculating the power plant or gas turbine net power, as this energy rate is subtracted from the gross power of gas turbine.
When calculating the entropy generation rate compared to that without inlet cooling, the work rate input to the heat pump, and the heat transfer rate to the environment from the condenser of the heat pump
, are determined:
where
denotes the heat rejection rate to the atmosphere by the condenser.
After determination of values for , we can select the type and capacity of the compressor, condenser and the heat pump for the ambient conditions.
6. Economic and Environmental Analyses of Gas Turbine with and without Cooling System
The objective function for calculating the cost of power generated by the gas turbine system is defined as follows [
6,
7]:
where C
E denotes normalized cost per unit power generation (US$/kWh), C
I initial installation normalized cost per unit power generation (US$/kWh), C
0 repair and maintenance normalized costs per unit power generation (US$/kWh), C
F fuel cost per unit power generation (US$/kWh) and C
A social normalized costs of air pollutants per unit power generation (US$/kWh).
An advantage of this method is that the calculation of costs per unit power generation is that, by changing parameters and conditions, the final cost of generated power can be calculated [
9]. For example, the price of consumed fuel may increase by changing some parameter values, but those changes may significantly increase the power or efficiency or decrease the pollutant emissions, perhaps leading to a reduction of the power generation cost. Installation, service and maintenance costs are taken into account. For instance, when the output power is reduced, the initial installation costs, which are fixed, are not fully exploited and increases cost per unit of power generation during hot seasons.
Social costs of air pollutants include reduced human effectiveness due to pollutants generated by gas turbines. Also, emissions of pollutants over a long period of time endanger human health and ultimately lead to mortality, by which some costs are imposed upon society [
6,
7,
29].
Electricity costs related to the initial installation can be determined as follows:
where
denotes initial installation cost per kilowatt (US$/kW) and
Cf is a capacity factor (kW) and
I the profit of initial expenditures, which is calculated as follows [
6,
7,
29]:
here, L denotes the life time of the gas turbine (year) and i the interest rate.
The electricity cost for initial installation is now evaluated. The gas turbine installation cost in Iran is about 300 US$/kW, which is calculated by Equation (31) [
6,
7,
29] considering a useful gas turbine life of 20 years and a bank interest rate equivalent to 8%. Repair and maintenance costs are considered to be 4% of initial installation cost [
6].
The fuel cost is calculated as follows [
6,
7]:
With this equation, the fuel-based electricity cost can be calculated considering a fuel cost equivalent to 0.003 US$/MJ and specifying the value of first law efficiency [
20].
The social costs of air pollutants can be expressed as follows:
where
,
and
respectively are mass flow rates of CO
2, CO and NO (kg/s), C
A,CO2, C
A,CO, C
A,NO are normalized social costs of pollutants CO
2, CO and NO (US$/kg) per unit mass, and normalized costs per unit mass related to pollutants CO
2, CO and NO respectively are evaluated as 0.0242, 6.424 and 8.175 US$/kg [
6,
29].
With the mass flow of each gas and using Equation (35), we can calculate the electricity costs of social pollutants, which are added to the generation costs.
In cases where the gas turbine using a heat pump is investigated, we have to consider initial installation, repair, service and maintenance costs for the heat pump in calculations. The heat pump installation cost is about 150 US$ per kW of power added to the power plant [
30]. This cost is about US$1,950,000 in Yazd and US$1,800,000 in Tehran. Regarding the reduction of power generation cost during the year as well as investment costs and the initial profit, we may calculate the capital payback period [
31]:
where PP denotes the payback period (year), A the annual financial benefit of reducing the cost of produced electricity in a year (US$), B the amount of revenue obtained from increasing the power output of the gas turbine per year (US$), C the increased costs due to increased fuel consumption per year (US$), D the heat pump maintenance and repair costs in a year (US$), E the annual depreciation expense for the heat pump (US$) and C
c the total initial investment cost (US$).
7. Results and Discussion
Yazd has an area of 6305 square kilometers, is about 1229 m above sea level, is located at a latitude of 54°36′ E and a longitude 31°89′ N, and has a very dry and hot climate. In fact, the city of Yazd is one of the hottest and driest areas in Iran, with a very low average annual rainfall. This city is located mainly in the desert belt. Large fluctuations in temperature are characteristic of the Yazd climate. In
Table 2, annual climate parameters are given for Yazd [
32].
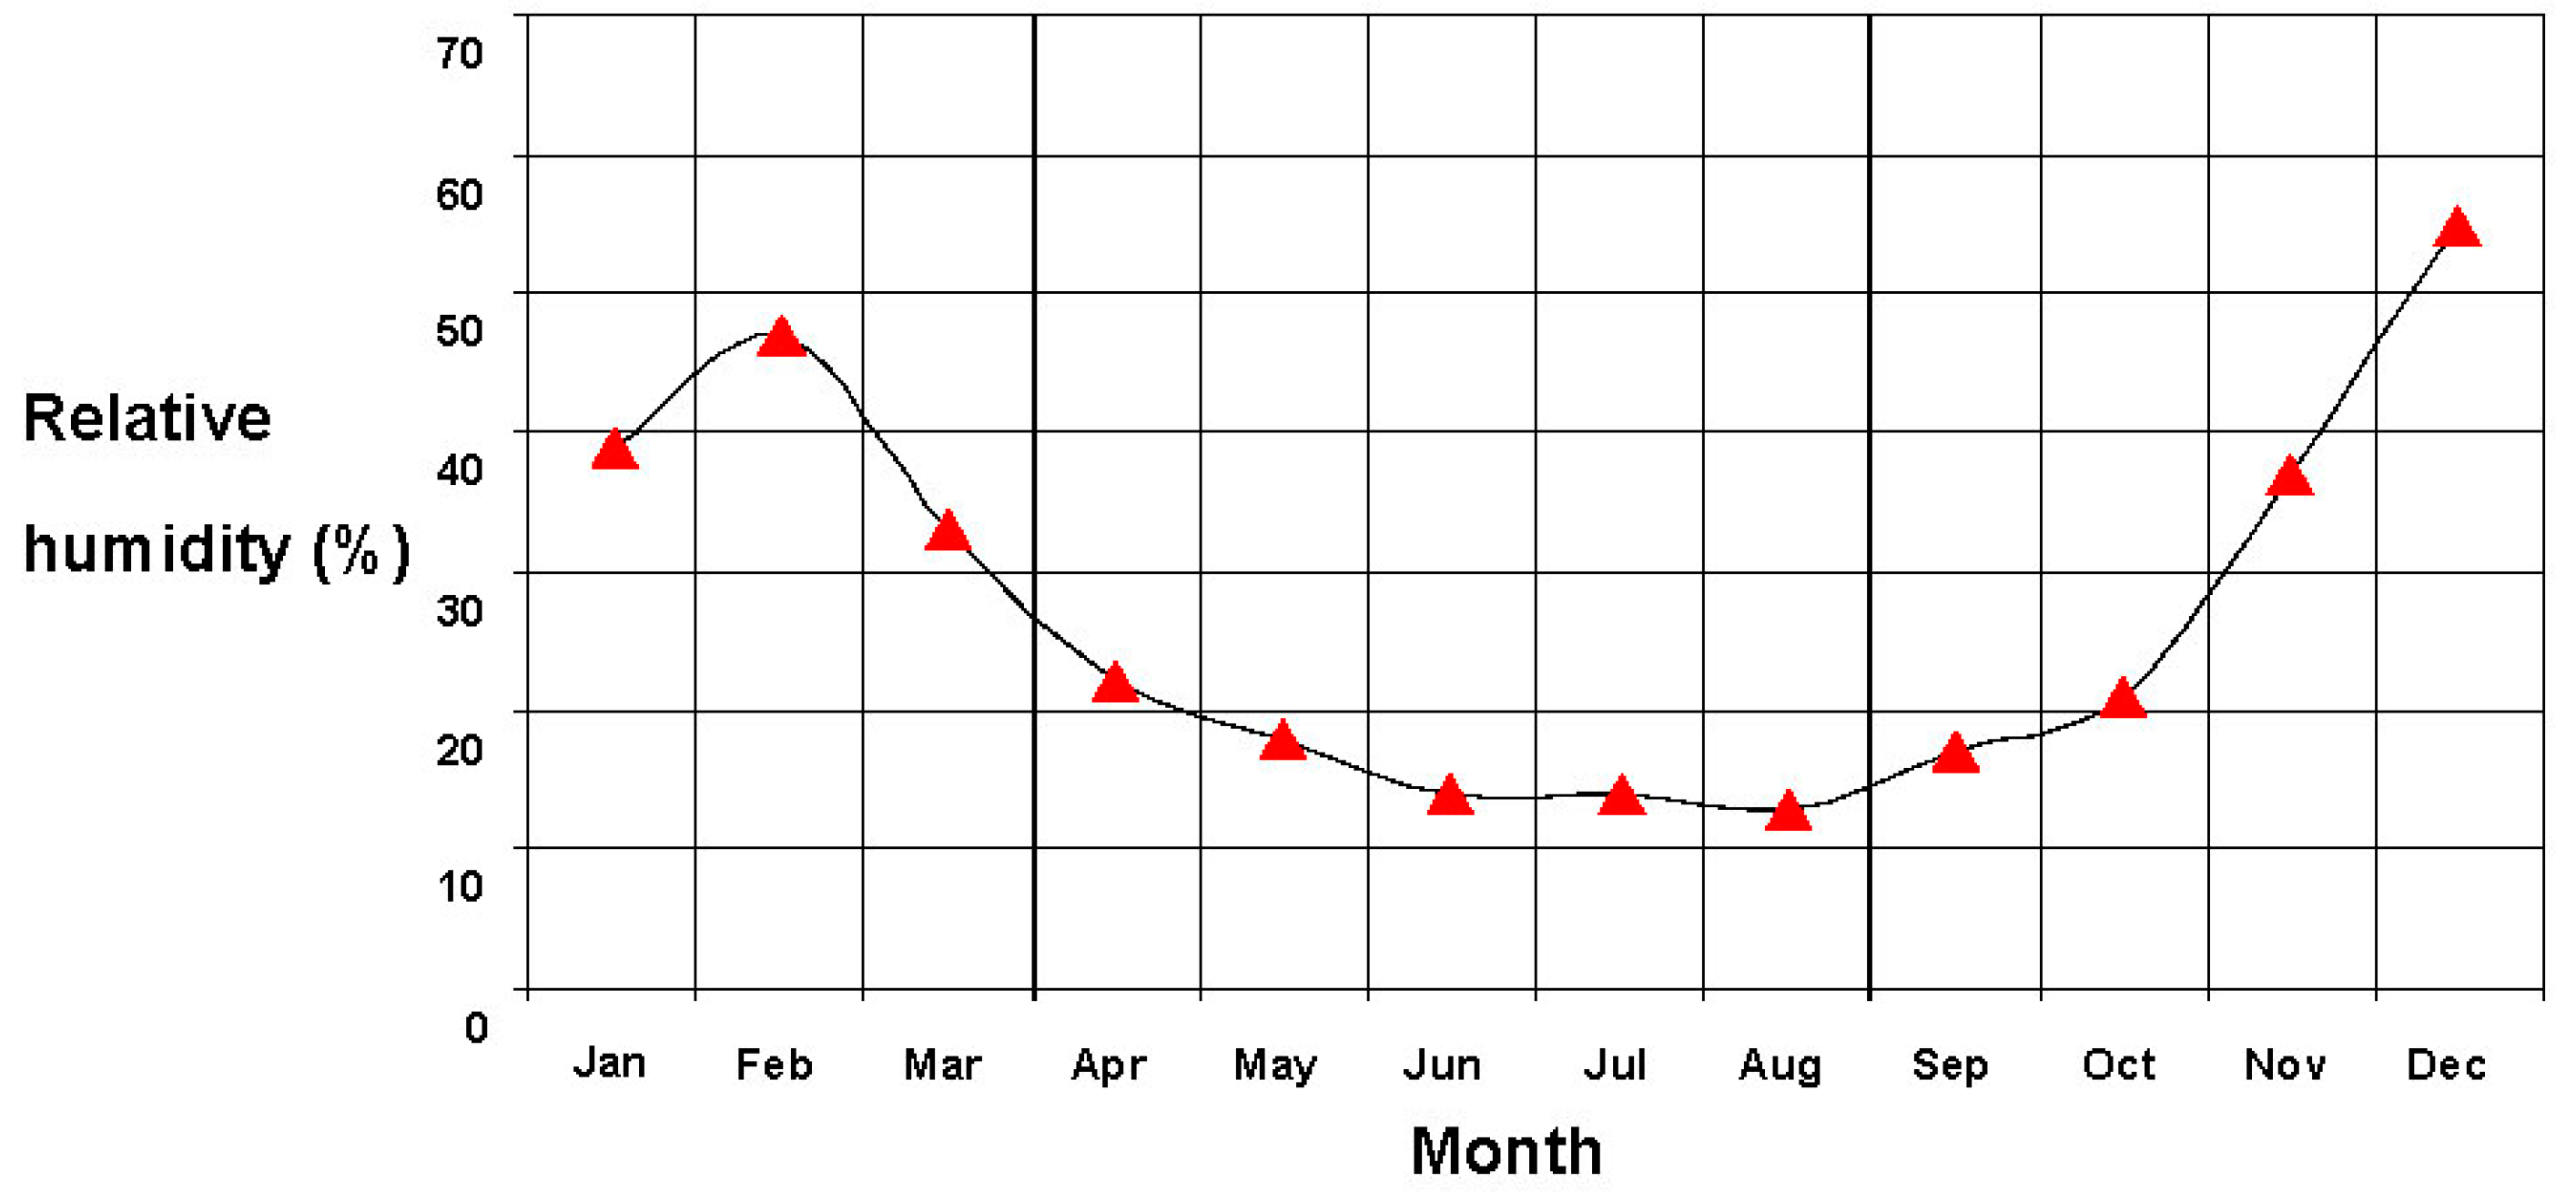
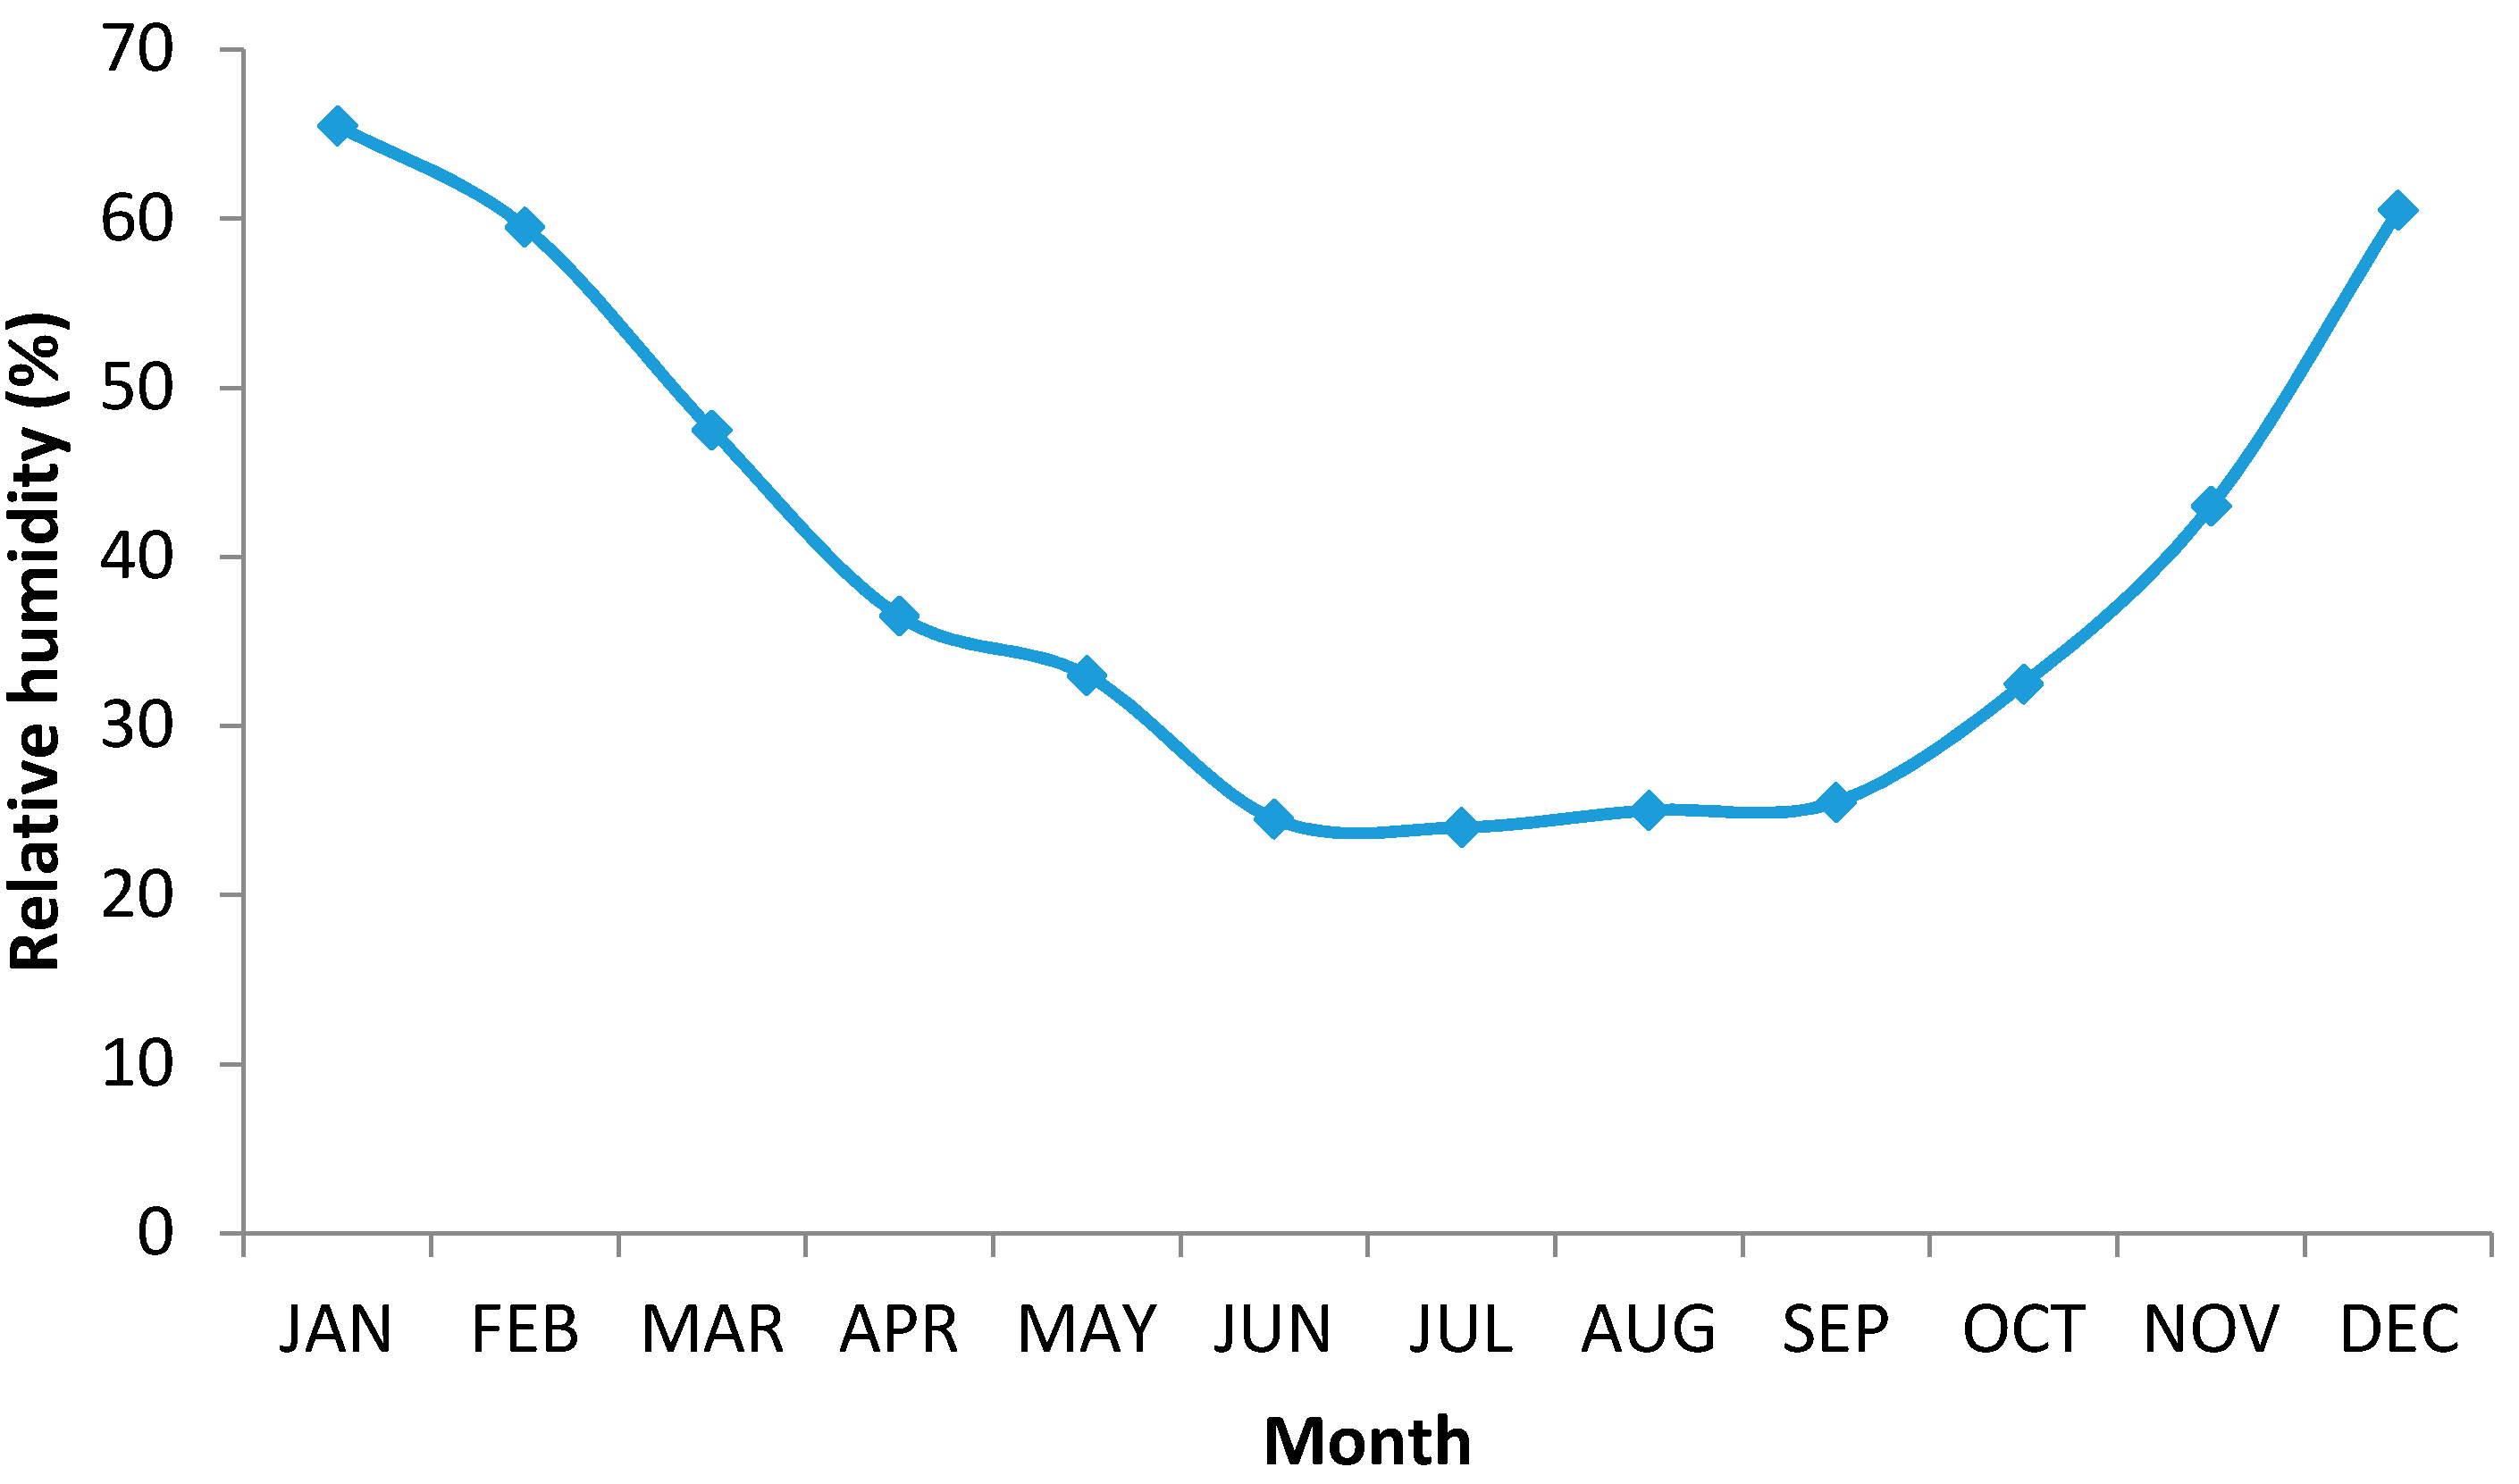
Tehran is located between 51°2′ E to 51°36′ E longitude and 35°34′ N to 35°50′ N latitude. Tehran’s altitude varies from 2000 m in the north to 1200 m in center and 1050 m in the south. Also, Tehran is located between mountains and desert in the southern slopes of the Alborz Mountains. Tehran’s climate is influenced by the mountains in the north and the south plains. Tehran’s climate is temperate in mountainous regions and semi-arid in the plains. The variation of relative humidity over the year is shown in
Figure 3 and
Figure 4 for Yazd and Tehran respectively. In
Table 3, annual climate parameters are given for Tehran [
32].
In order to evaluate the validity of the computer model, actual registered data from the Parand power plant, which is located 20 km from Tehran, was compared with output data from the computer model.
Table 4 shows this comparison.
The maximum error in the parameters of the operating cycle is observed to be less than 3%, suggesting that the written code is adequately accurate and can be utilized for simulation of the gas turbine performance with acceptable precision.
Table 2.
Monthly climate parameters for Yazd [
32].
Table 2.
Monthly climate parameters for Yazd [32].
| Month | January | February | March | April | May | June | July | August | September | October | November | December |
|---|
| Average temperature (°C) | 5 | 8 | 14 | 20 | 25 | 31 | 33 | 30 | 26 | 20 | 12 | 8 |
| Humidity ratio | 0.0034 | 0.0031 | 0.0034 | 0.0055 | 0.0051 | 0.0047 | 0.0047 | 0.0052 | 0.004 | 0.0037 | 0.0034 | 0.0034 |
| Average dew point temperature (°C) | −3 | −4 | −3 | 3 | 2 | 1 | 1 | 2 | −1 | −2 | −3 | −3 |
Figure 3.
Variation in relative humidity over the year in Yazd [
32].
Figure 3.
Variation in relative humidity over the year in Yazd [
32].
Table 3.
Monthly climate parameters for Tehran [
32].
Table 3.
Monthly climate parameters for Tehran [32].
| Month | January | February | March | April | May | June | July | August | September | October | November | December |
|---|
| Average temperature (°C) | 1 | 5 | 10 | 17 | 21 | 27 | 31 | 29 | 26 | 18 | 11 | 5 |
| Humidity ratio | 0.0034 | 0.0031 | 0.0037 | 0.0051 | 0.0051 | 0.0054 | 0.0067 | 0.0063 | 0.0054 | 0.0048 | 0.004 | 0.0034 |
| Average dew point temperature (°C) | −4 | −3 | −2 | 2 | 2 | 3 | 6 | 5 | 3 | 1 | −1 | −2 |
Figure 4.
Variation in relative humidity over the year in Tehran [
32].
Figure 4.
Variation in relative humidity over the year in Tehran [
32].
Table 4.
Comparison of gas turbine operating parameters in ISO conditions from manufacturer’s technical data and a real cycle in Parand City with an analytical model [
33,
34].
Table 4.
Comparison of gas turbine operating parameters in ISO conditions from manufacturer’s technical data and a real cycle in Parand City with an analytical model [33,34].
| Parameter | ISO Conditions | Real Cycle in Parand |
|---|
| Manufacturer Data | Analytical Model | Error (%) | Power Plant Data | Analytical Model | Error (%) |
|---|
| Mass flow rate of inlet air (kg/s) | 535 | 530.2 | 0.9 | 442.3 | 455.57 | 3 |
| Compressor pressure ratio | 11.7 | 11.7 | 0 | 11.7 | 11.7 | 0 |
| Net power generation (MW) | 159 | 156.3 | 1.7 | 132.800 | 132.823 | 0.02 |
| Heat rate (kJ/kWh) | 10.459 | 10.5 | 0.8 | 107.695 | 107.702 | 0.01 |
| Turbine inlet temperature (°C) | 1060 | 1065 | 0.5 | 1060 | 1070.71 | 1 |
| Exhaust temperature (°C) | 537 | 533 | 0.74 | 546.7 | 530.846 | 2.9 |
7.1. Comparison of Gas Turbine Results for Two Conditions with and without a Heat Pump
The gas turbine performance graph is shown in
Figure 5, as can be seen in the graph, with increasing temperature the power and efficiency is reduced.
In this section, several parameters for a gas turbine with and without inlet cooling using a heat pump are compared for all seasons.
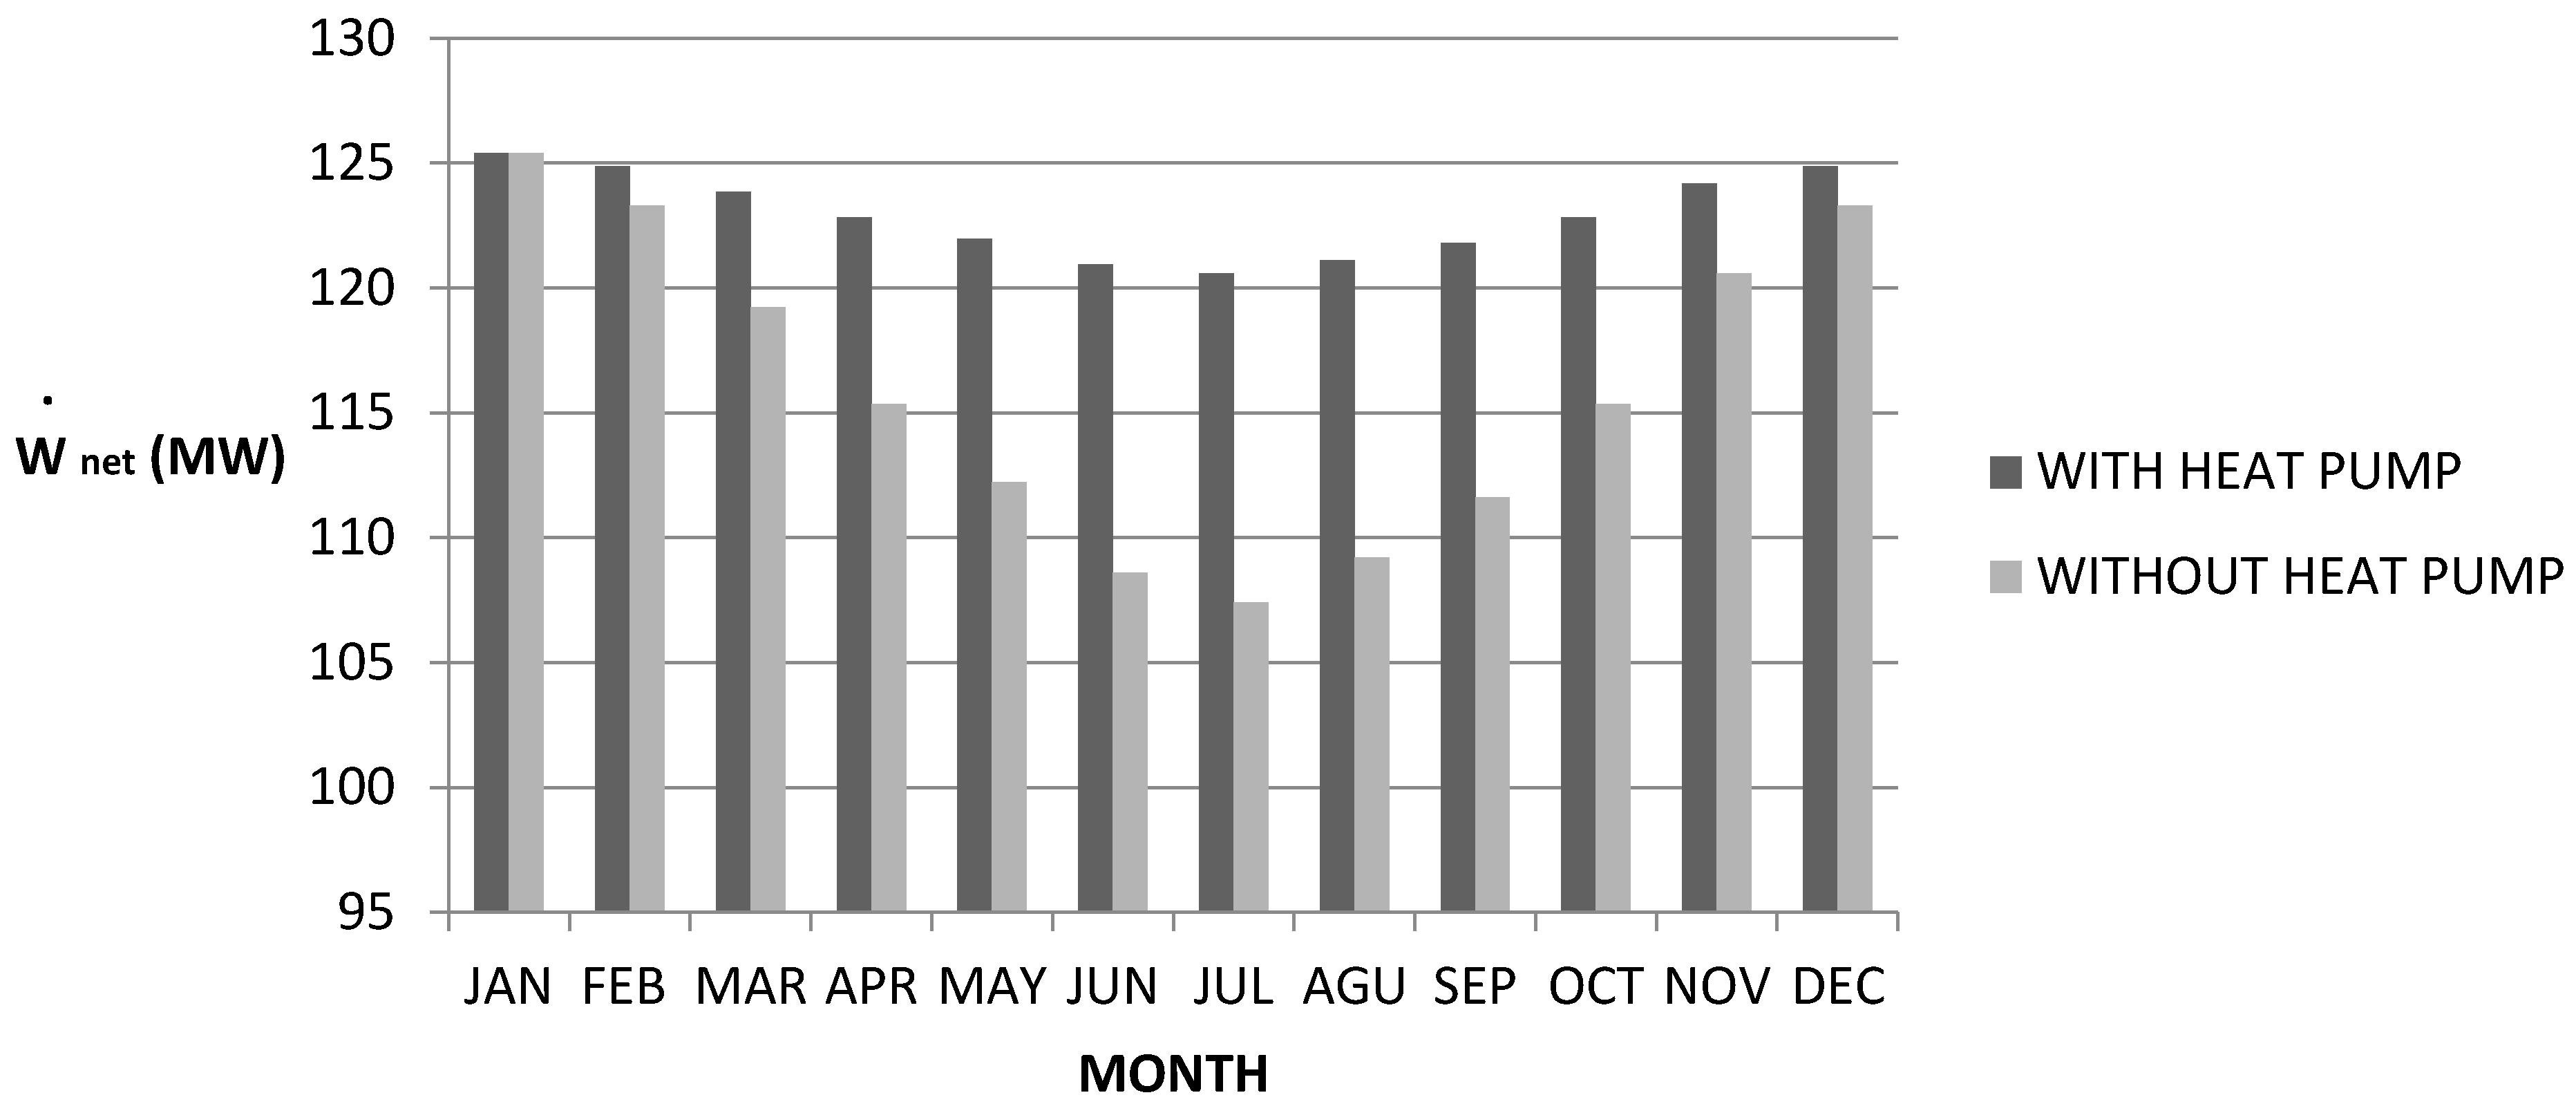
Figure 6 shows monthly average of power produced by the gas turbine system located in Yazd city. It is seen that the heat pump system increases power production from February to December. However, this increase is most noticeable from April to October. The minimum power increase occurs in February (about 1.2%) and the maximum in July (about 13.5%). Also this system does not experience many effects due to ambient temperature variations in warm seasons.
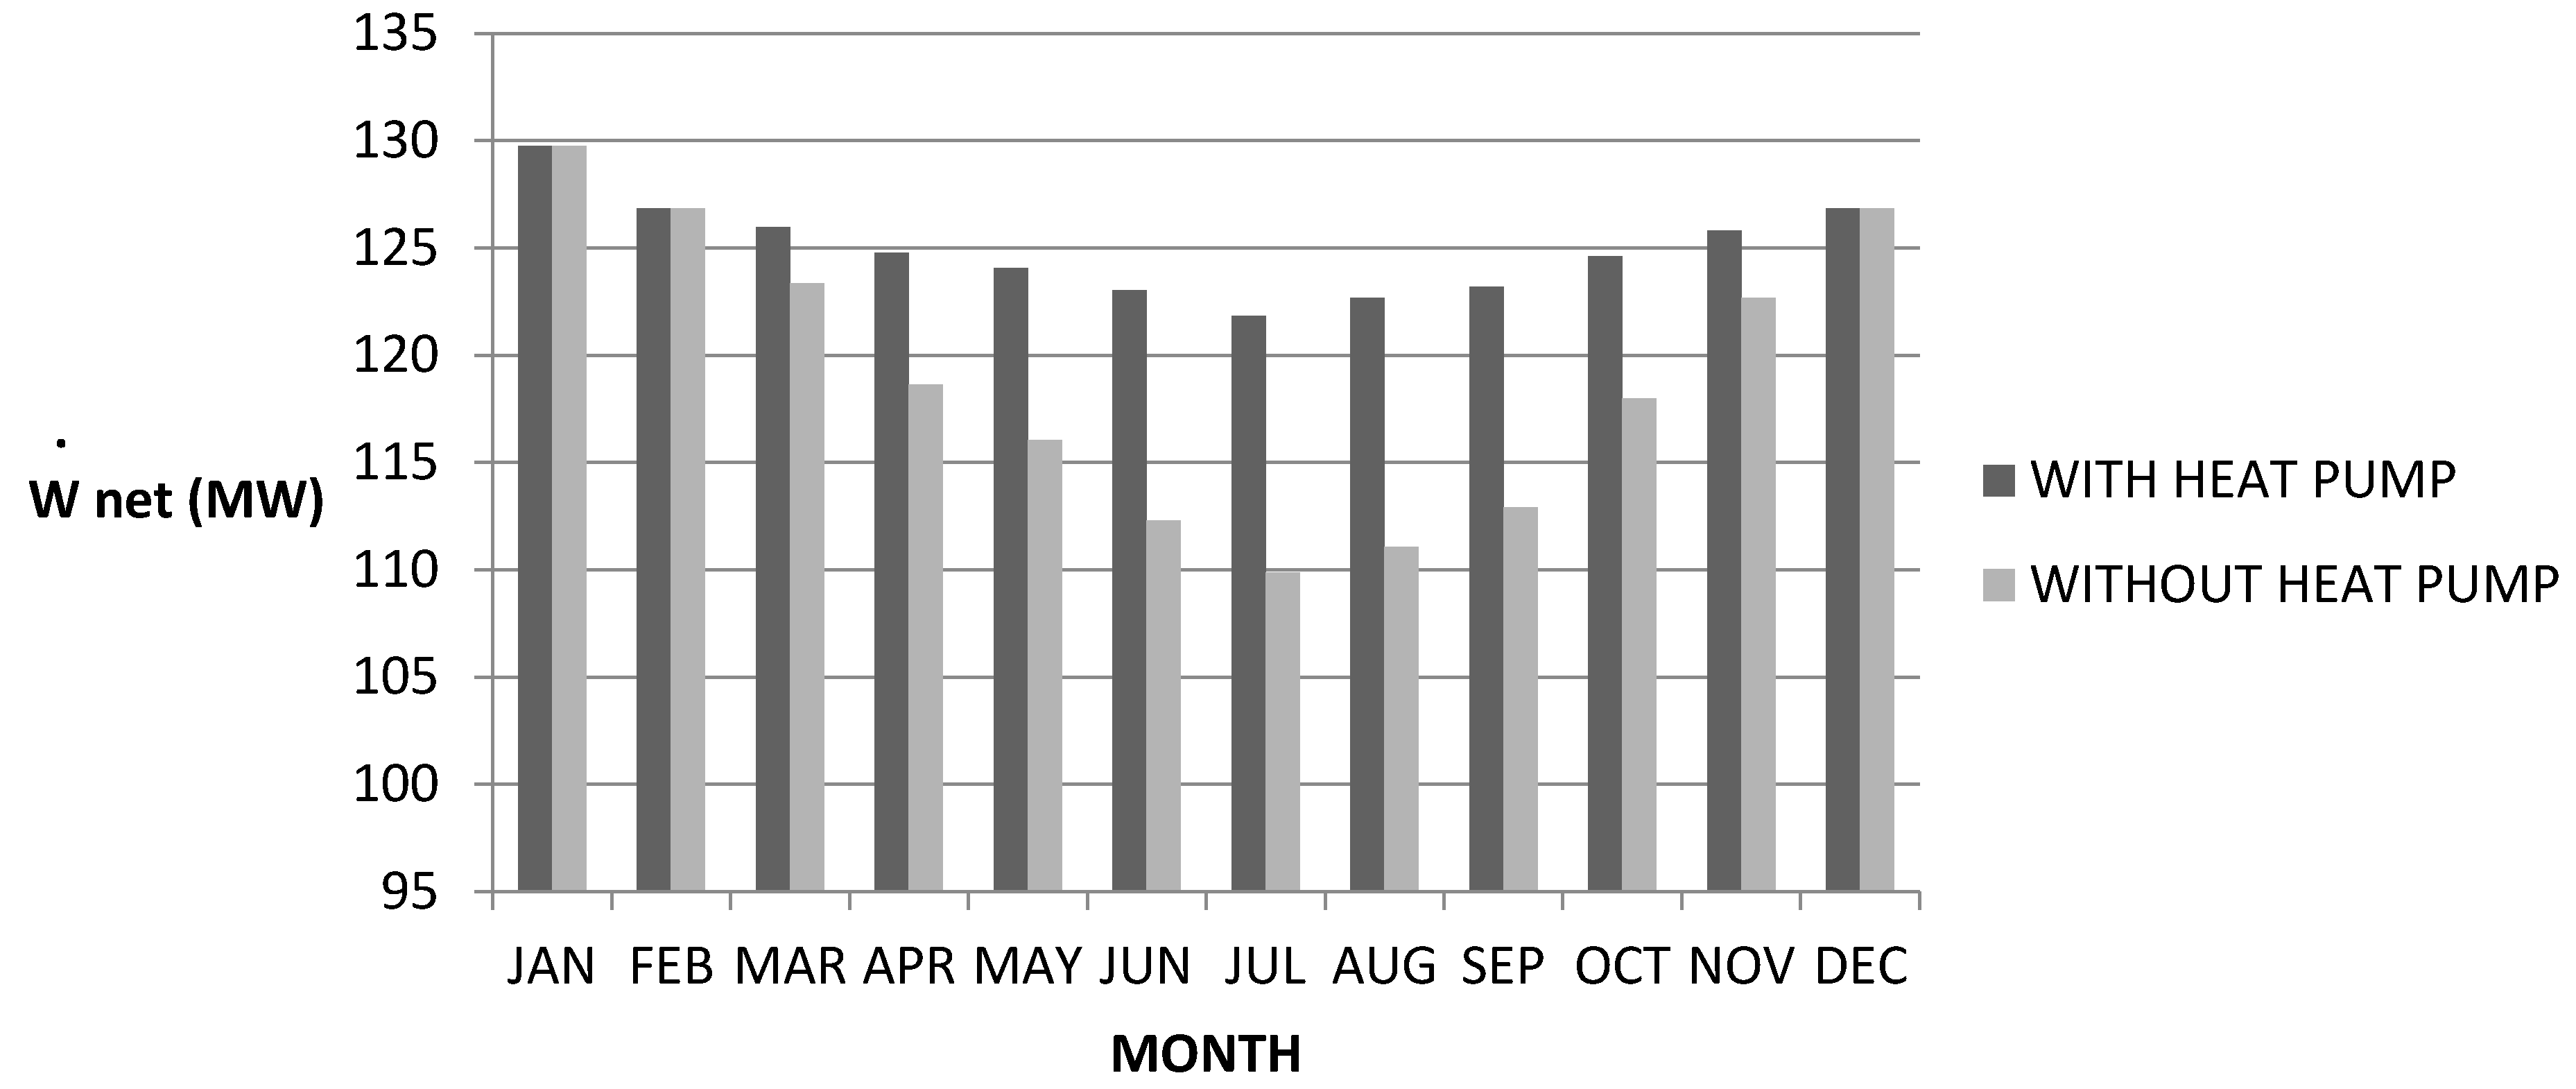
Figure 7 shows a similar figure for Tehran. From this figure it can be observed that, due to the lower monthly average temperature of Tehran compared to Yazd, the effectiveness of this system is reduced. For example, in the months of January and February, the heat pump system is not effective.
For Tehran the minimum power increase occurs in November (about 1%) and the maximum in July (about 12%).
As can be seen in
Figure 6 and
Figure 7, the greatest increase in output power occurs in July, at about 12%. The increase in the output power is reduced in colder seasons.
Figure 5.
Performance graph of Siemens V94.2 gas turbine [
33].
Figure 5.
Performance graph of Siemens V94.2 gas turbine [
33].
Figure 6.
Monthly average power generation by gas turbine in Yazd.
Figure 6.
Monthly average power generation by gas turbine in Yazd.
Figure 7.
Monthly average work generation rate by gas turbine in Tehran.
Figure 7.
Monthly average work generation rate by gas turbine in Tehran.
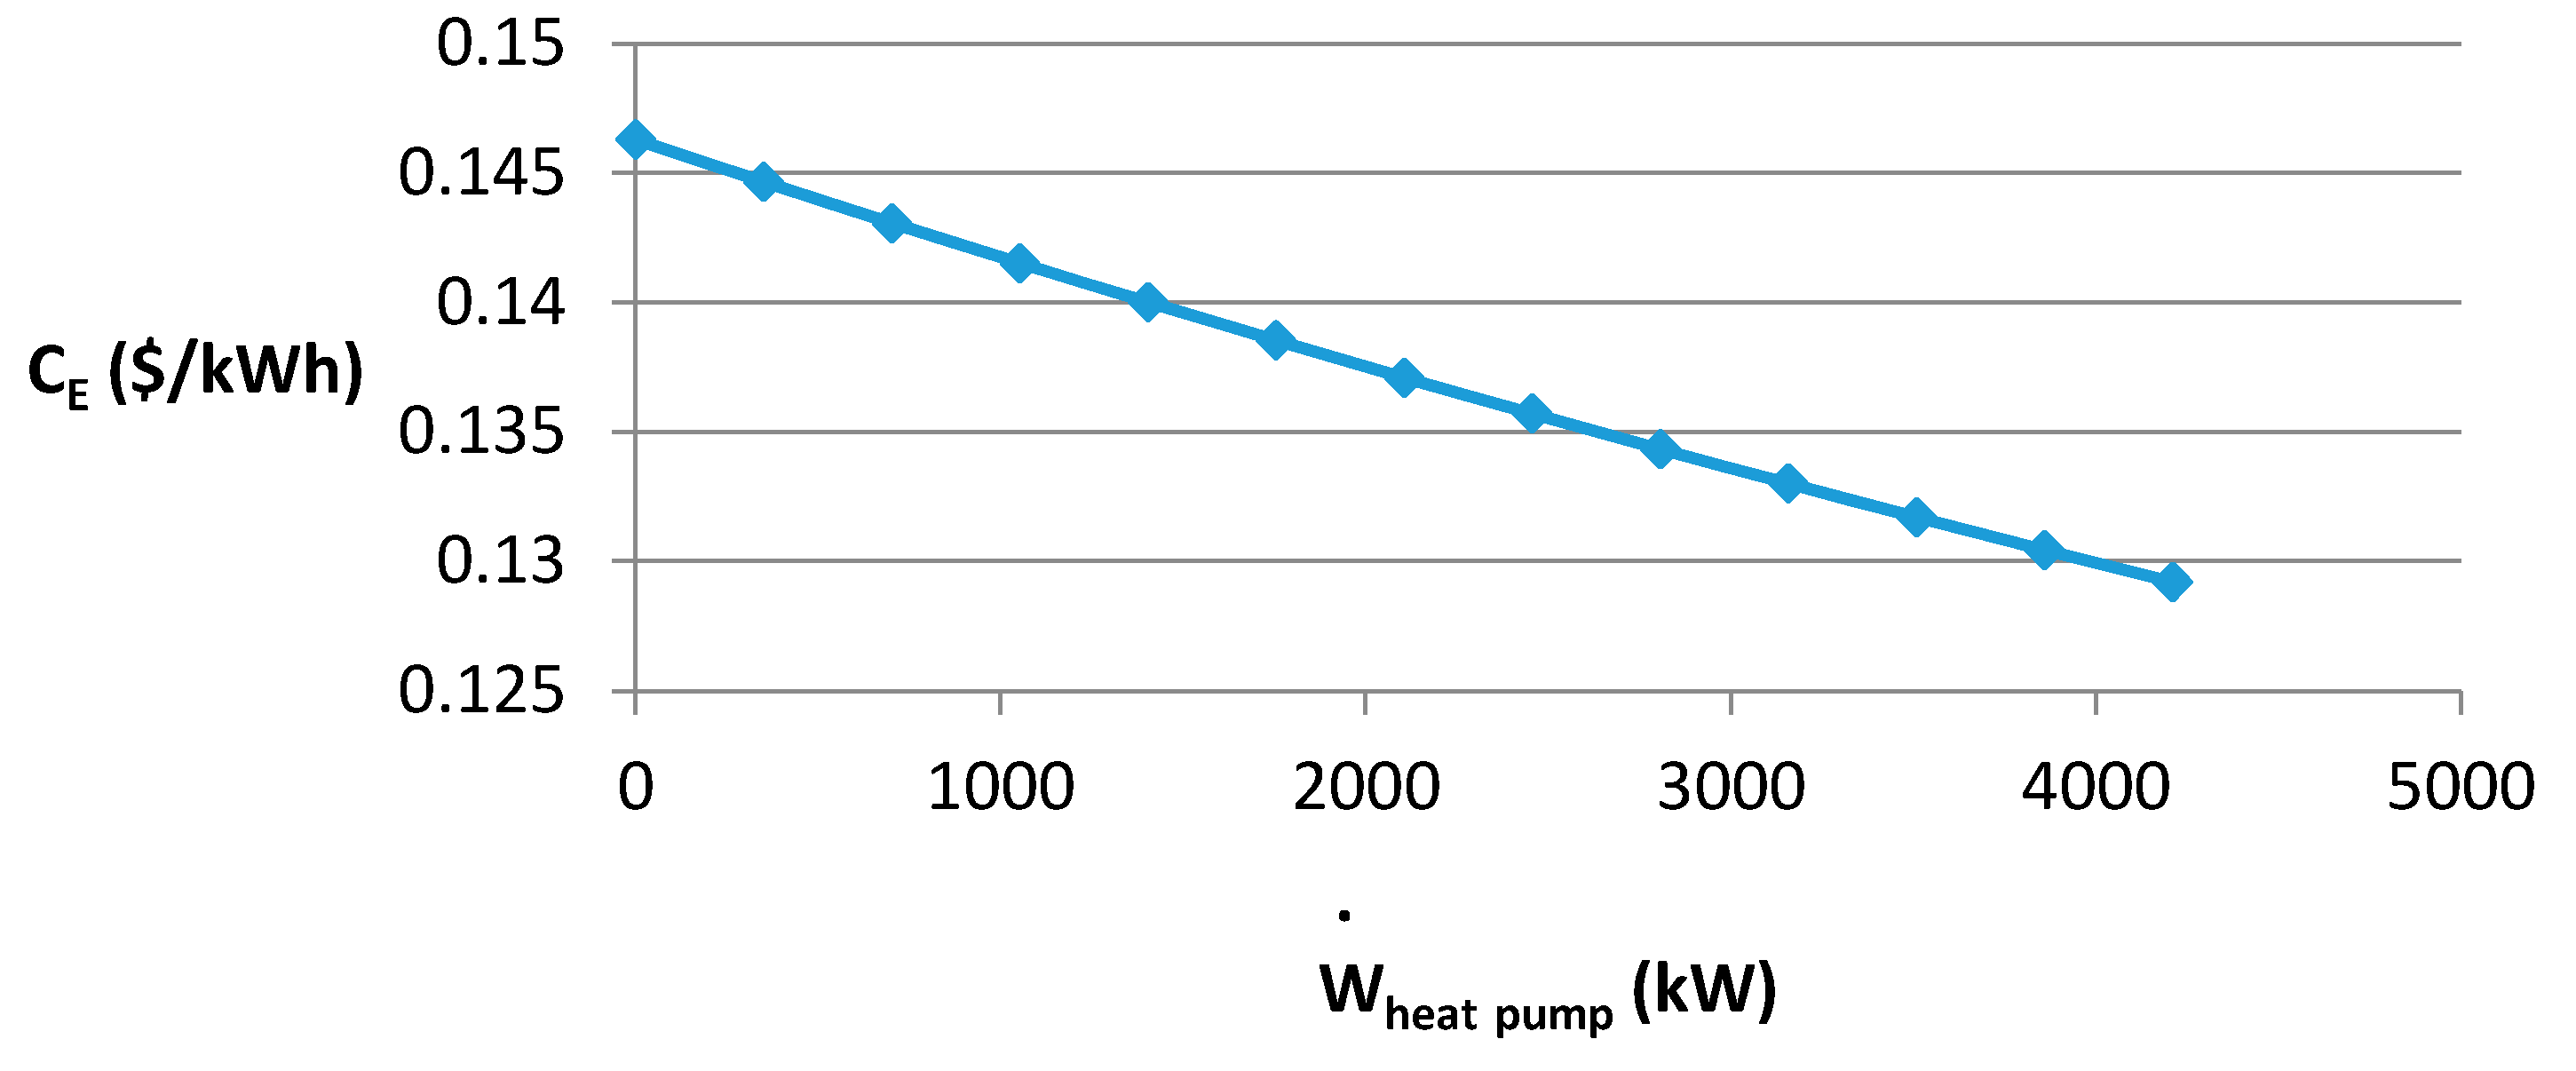
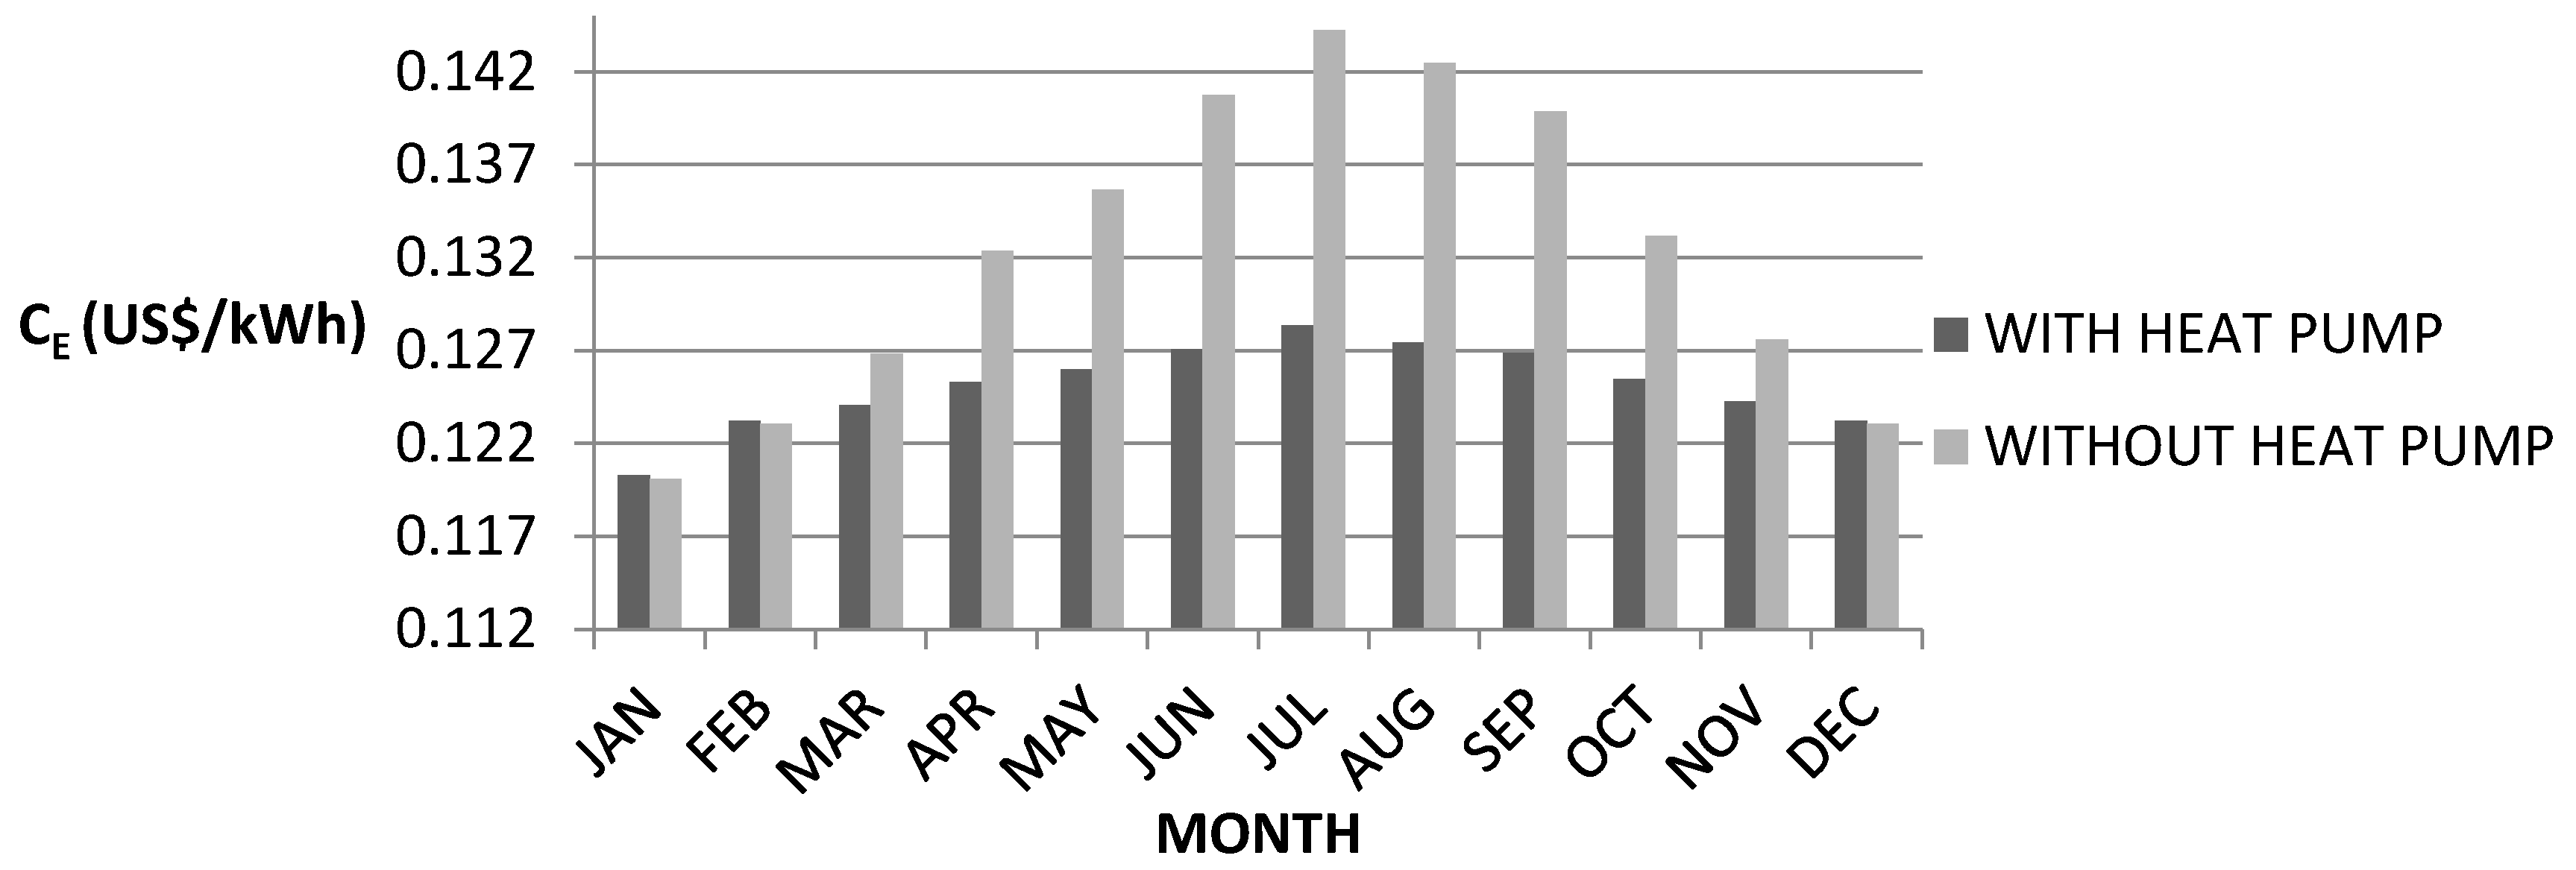
Figure 8 and
Figure 9 show the monthly average electricity cost considering the social cost of air pollution in Yazd and Tehran cities, respectively. From these figures, it can be seen that greatest electricity cost reduction occurs in July, and that these reductions are about 16% and 12% in Yazd and Tehran, respectively. This system has less of an effect on electricity costs in cold rather than warm seasons. For example in Yazd, this system has no effect on electricity cost in January; in Tehran a similar phenomenon can be seen in January, February and December. However a slight increase can be seen in
Figure 8 in cold months because of the initial installation cost.
Figure 8.
Monthly average normalized electricity cost per unit power considering social cost of air pollution in Yazd.
Figure 8.
Monthly average normalized electricity cost per unit power considering social cost of air pollution in Yazd.
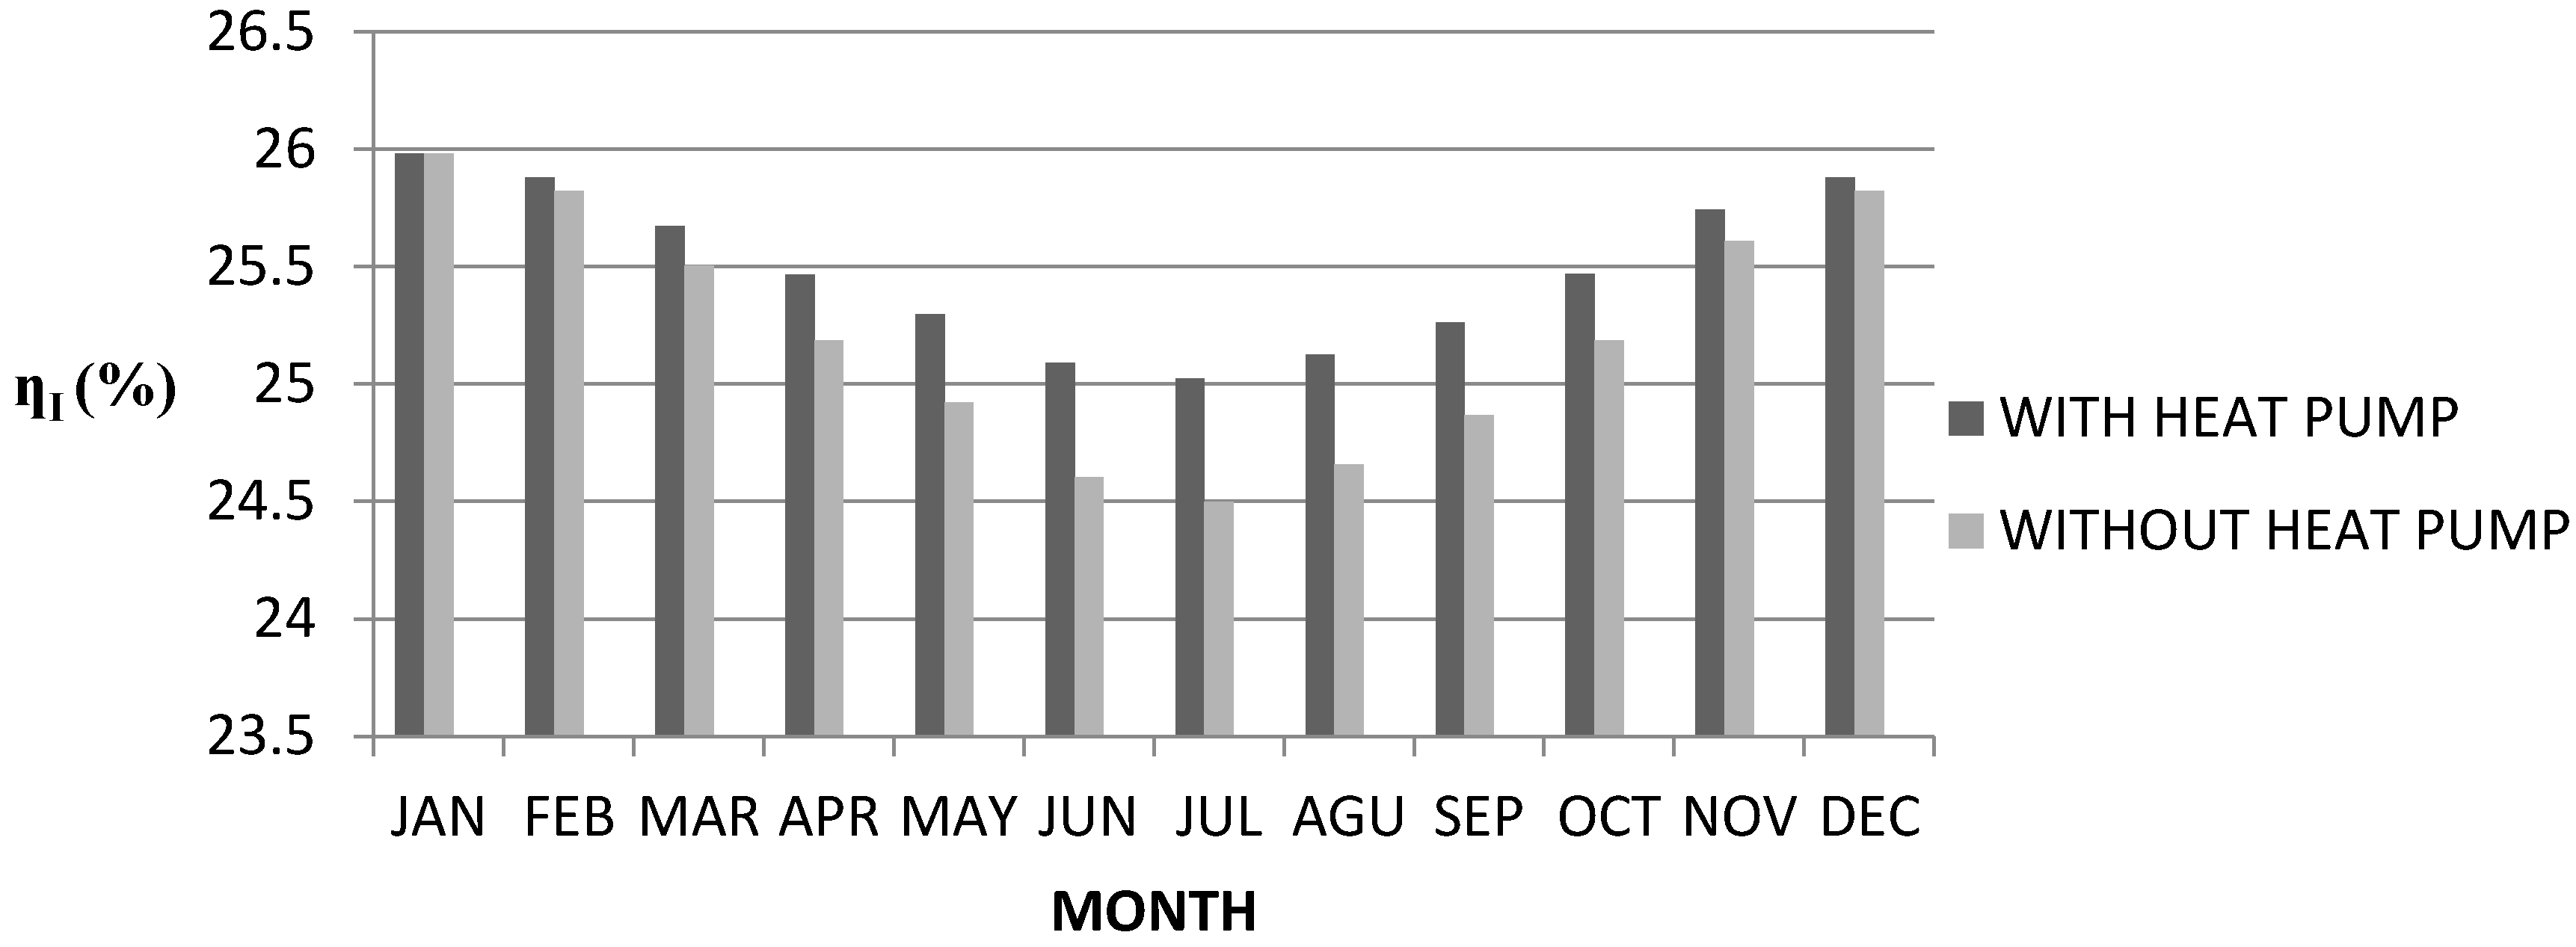
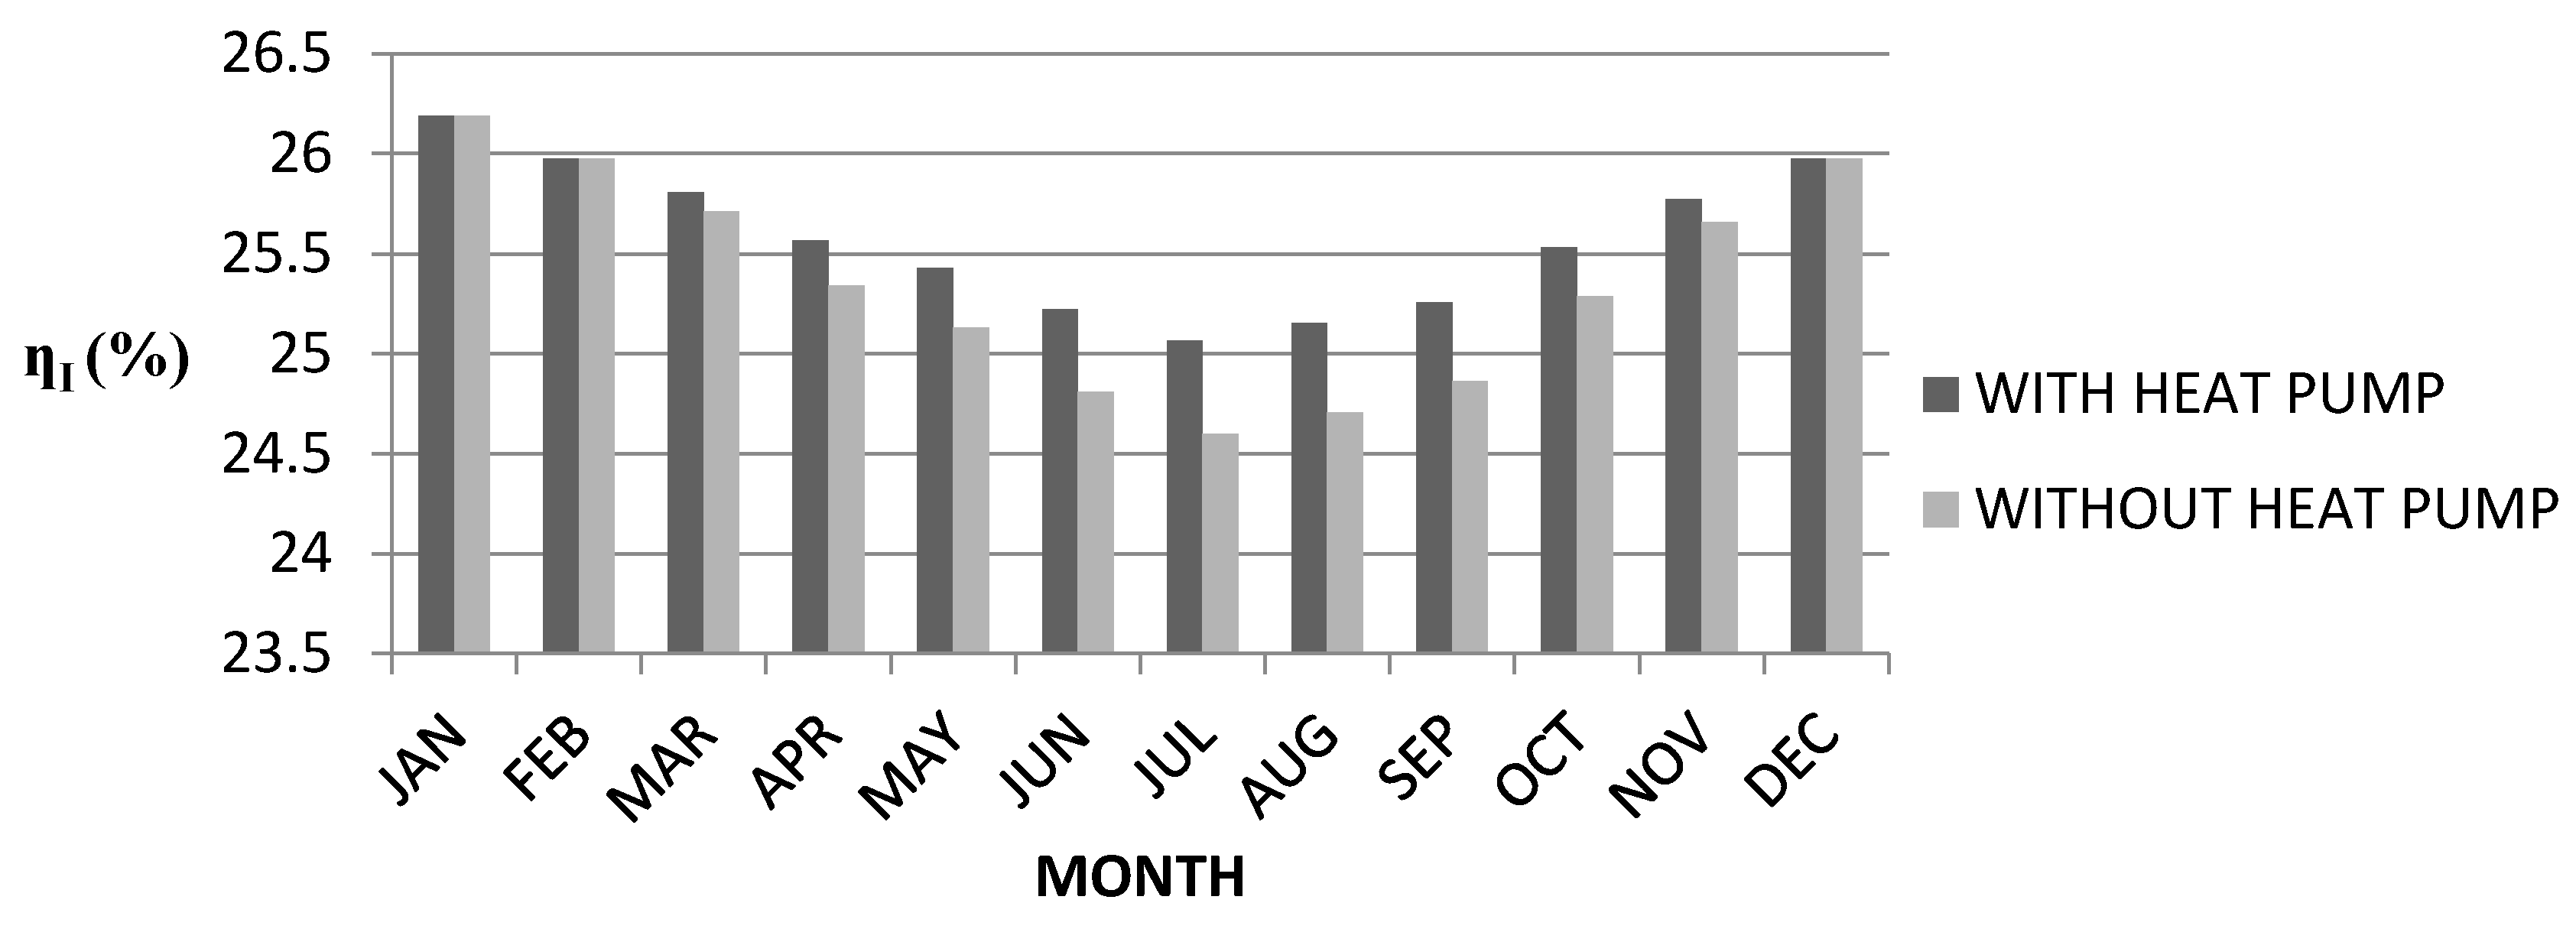
Figure 10 and
Figure 11 show monthly average first law efficiencies in the cities of Yazd and Tehran, respectively. The efficiency variations are similar to those in
Figure 6 and
Figure 7. The effect of the heat pump on system efficiency is similar to power production, since the heat pump system has no effect on fuel consumption and considering Equation (19). The first law or energy efficiency increases in July by about 1.5% and 2% in Tehran and Yazd, respectively.
Figure 9.
Monthly average normalized electricity cost per unit power considering social cost of air pollution in Tehran.
Figure 9.
Monthly average normalized electricity cost per unit power considering social cost of air pollution in Tehran.
Figure 10.
Monthly average of first law efficiency in Yazd.
Figure 10.
Monthly average of first law efficiency in Yazd.
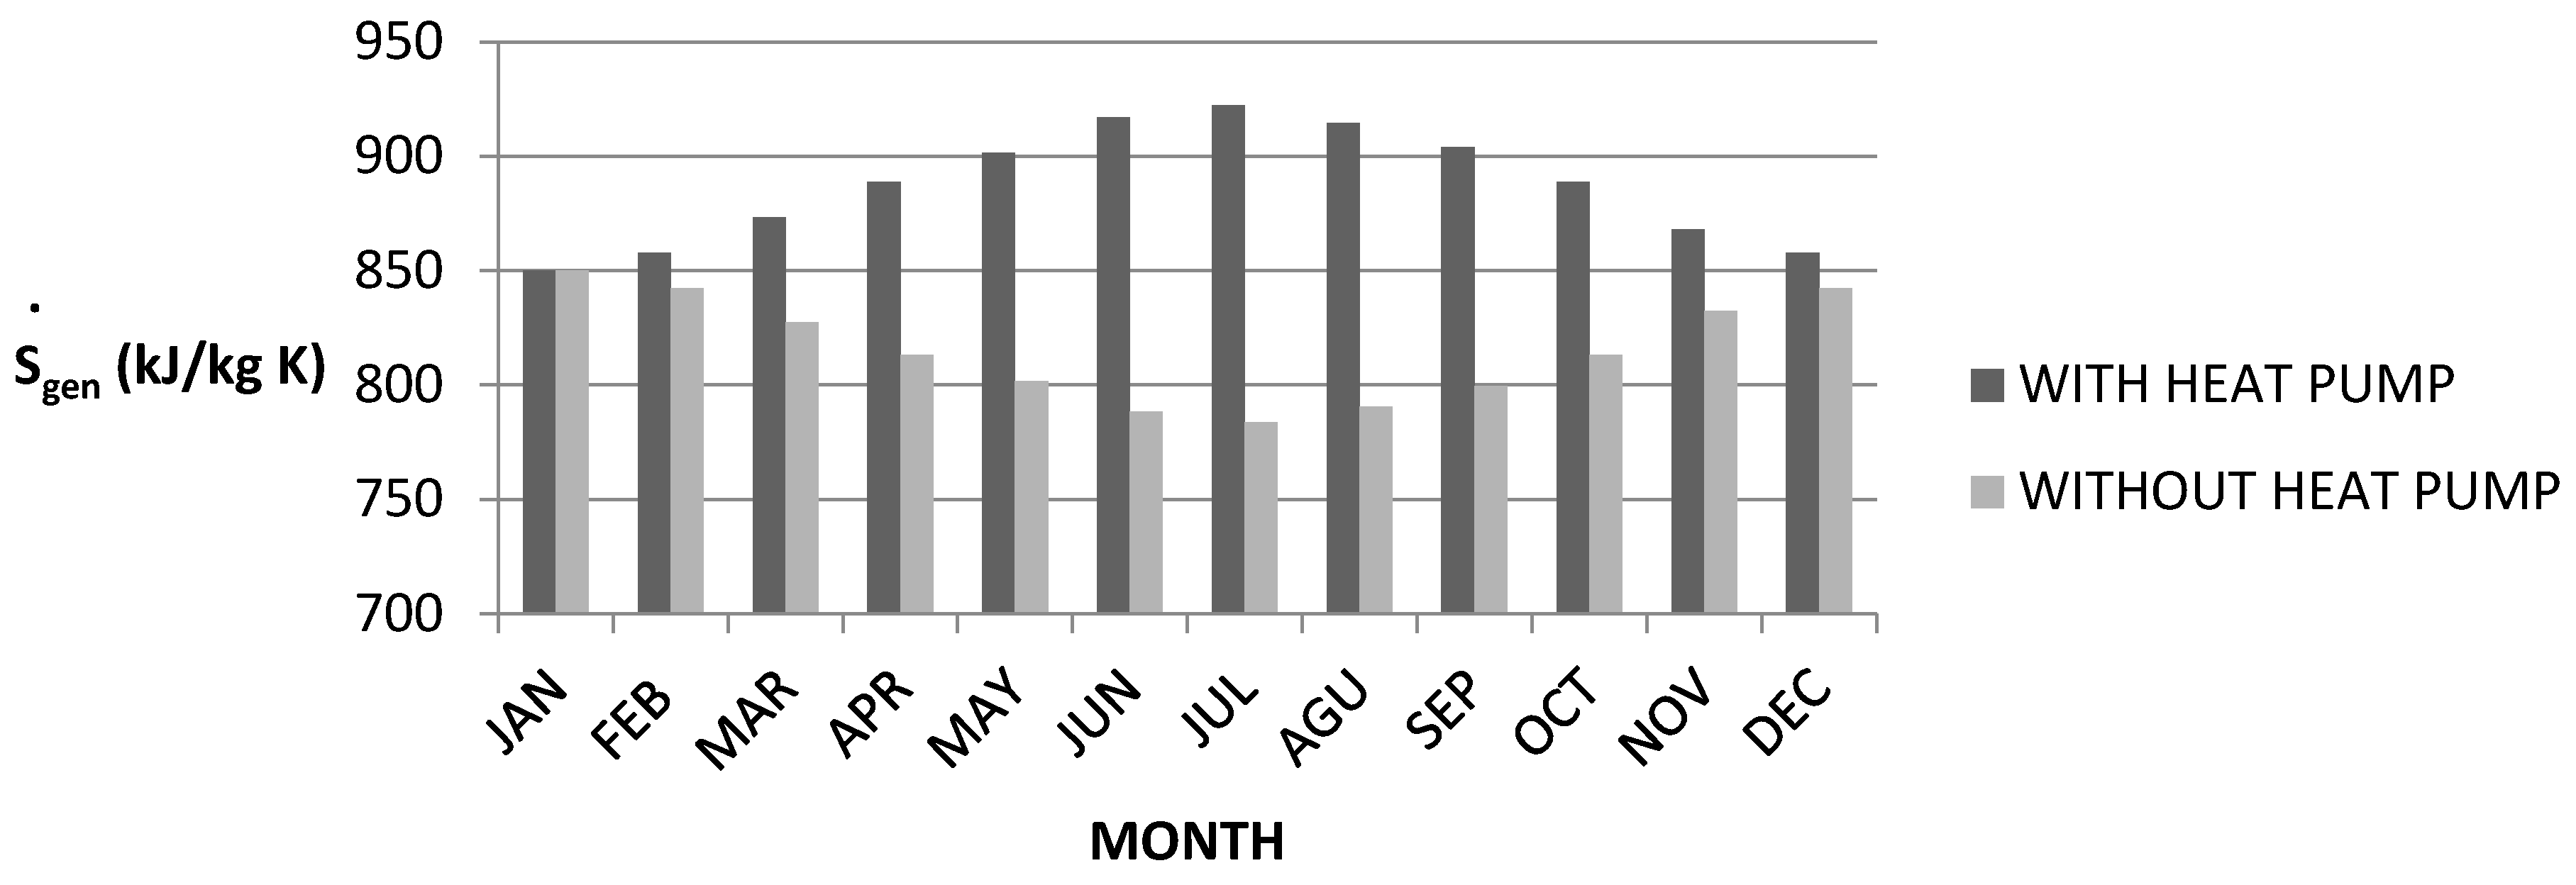
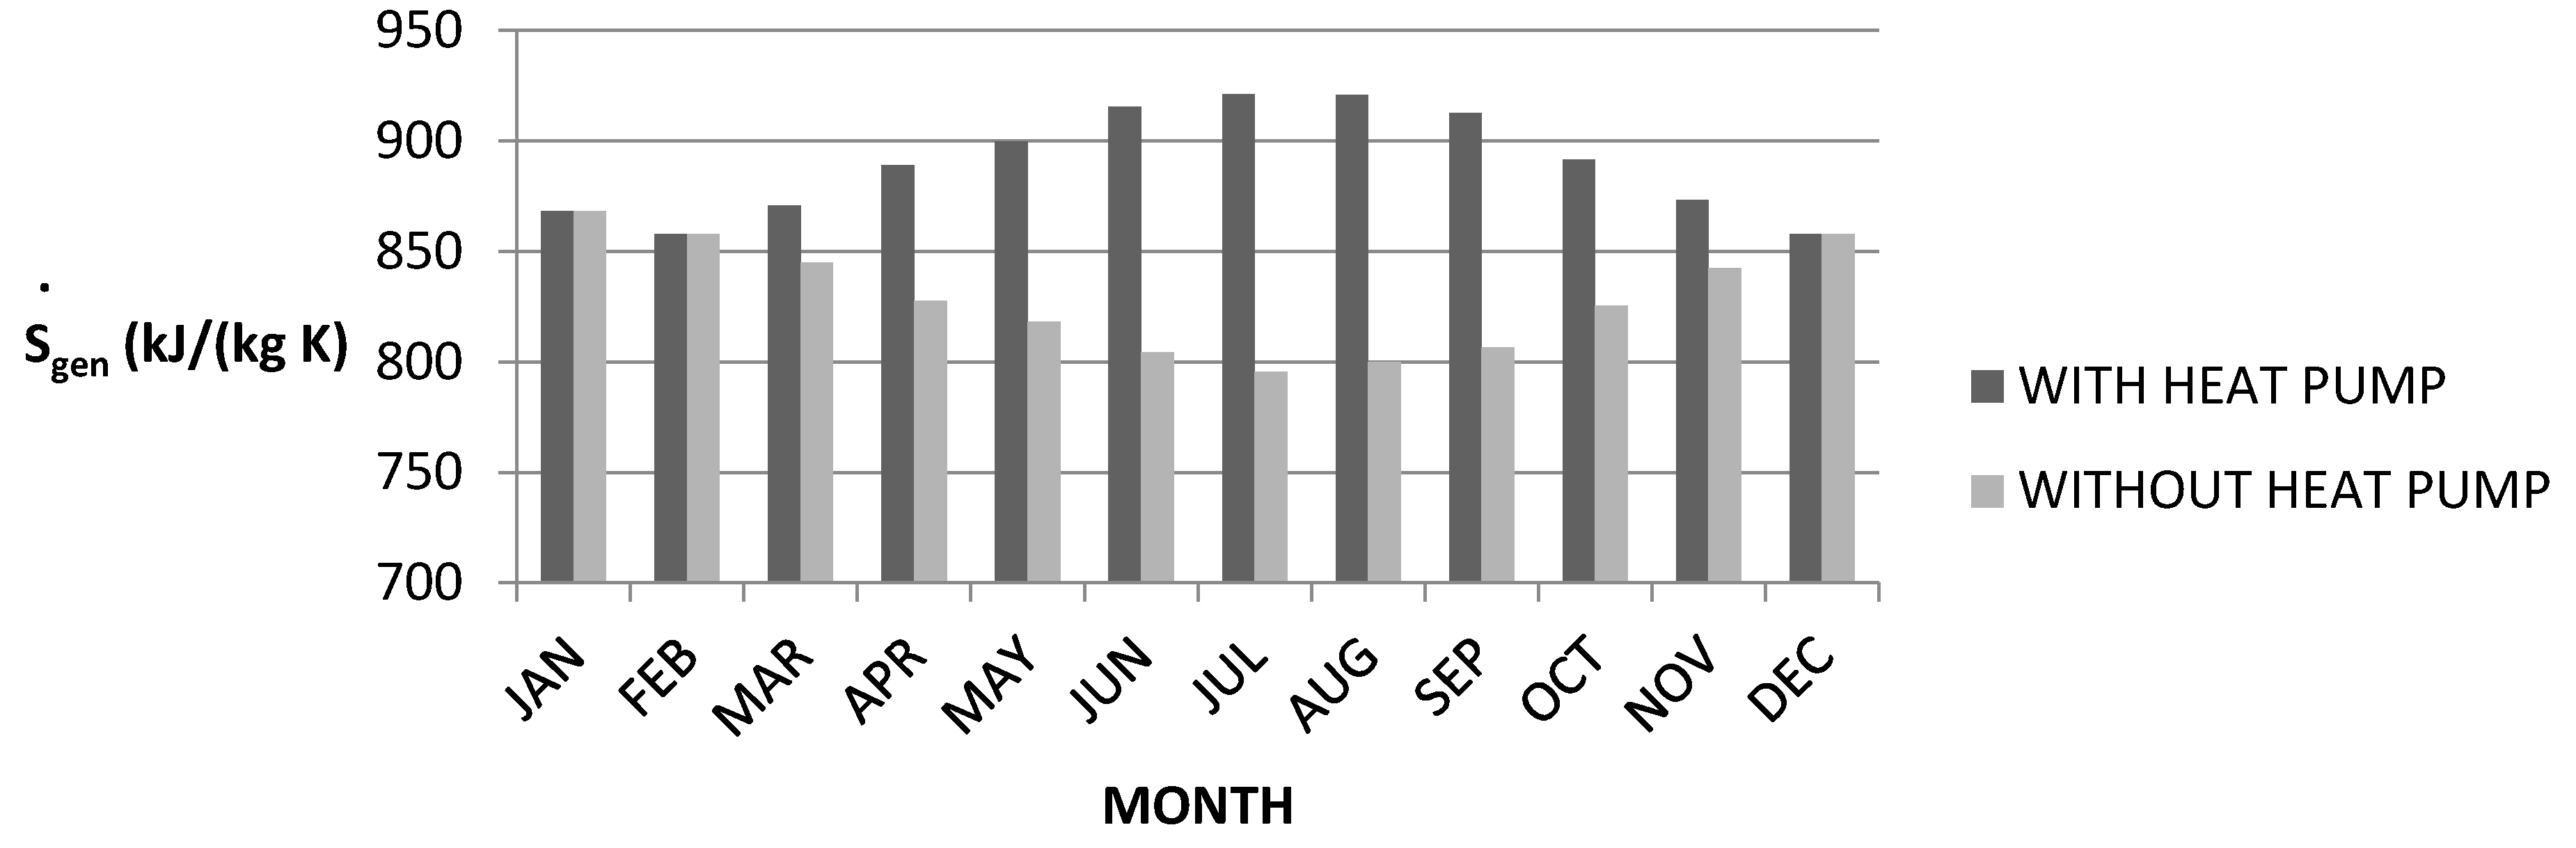
Figure 12 and
Figure 13 show the system entropy generation with and without the heat pump. The maximum entropy generation reduction occurs in July. But this reduction is more pronounced in Yazd than in Tehran, due to the warmer temperature in Yazd. Also it can be concluded that the heat pump system is more efficient in a warm and dry city. The increase in entropy caused by installing a heat pump system in Yazd (about 17%) in July is slightly greater than the increase in Tehran (about 16%) in Tehran.
Figure 11.
Monthly average of first law efficiency in Tehran.
Figure 11.
Monthly average of first law efficiency in Tehran.
Figure 12.
Monthly average of entropy generation in Yazd.
Figure 12.
Monthly average of entropy generation in Yazd.
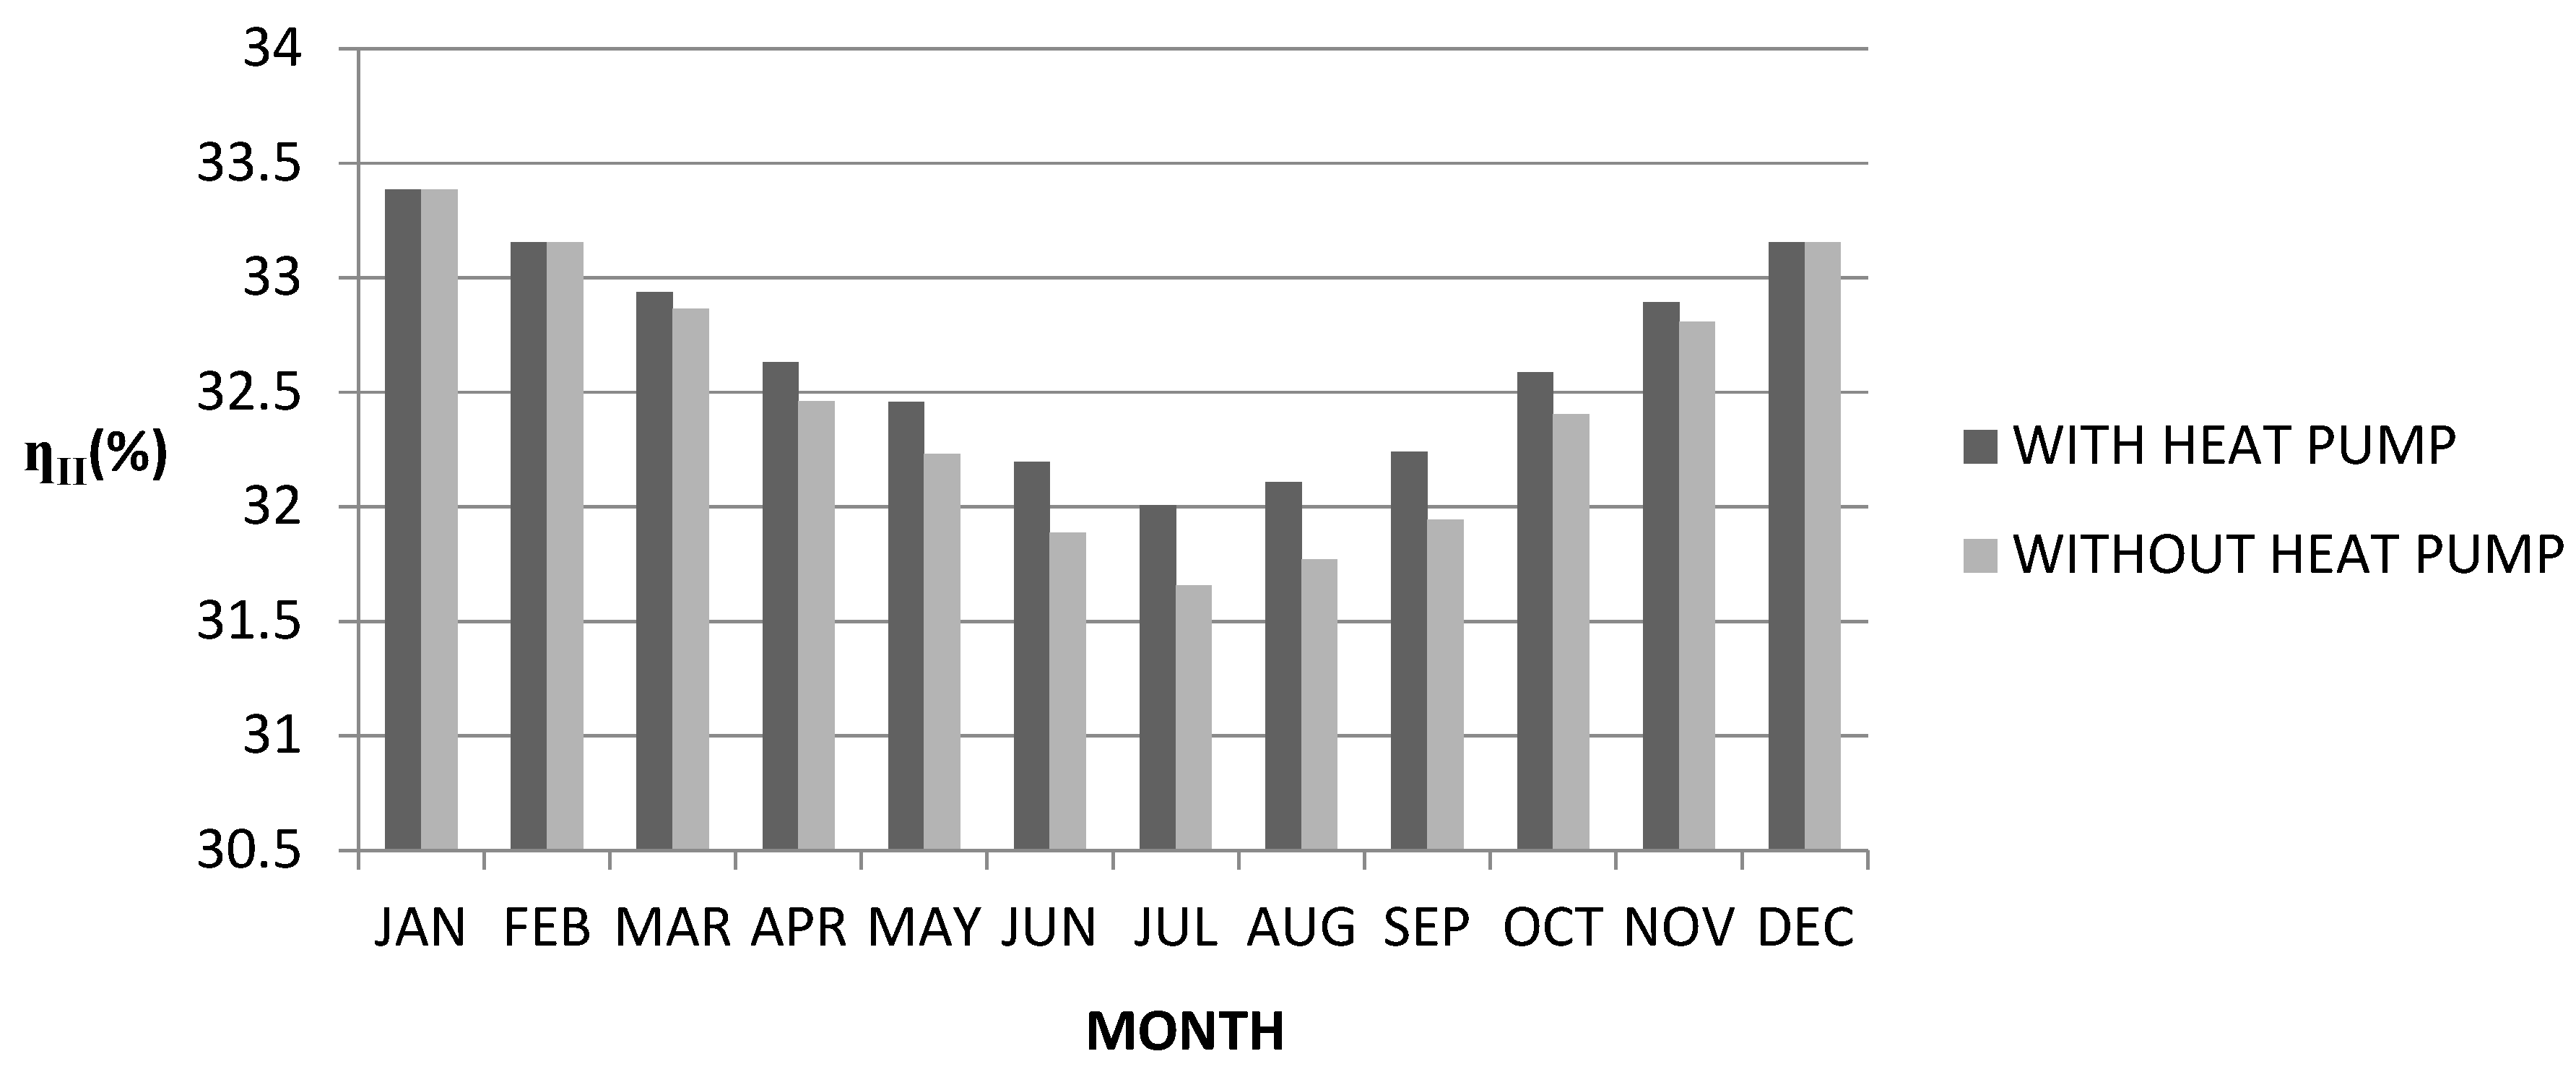
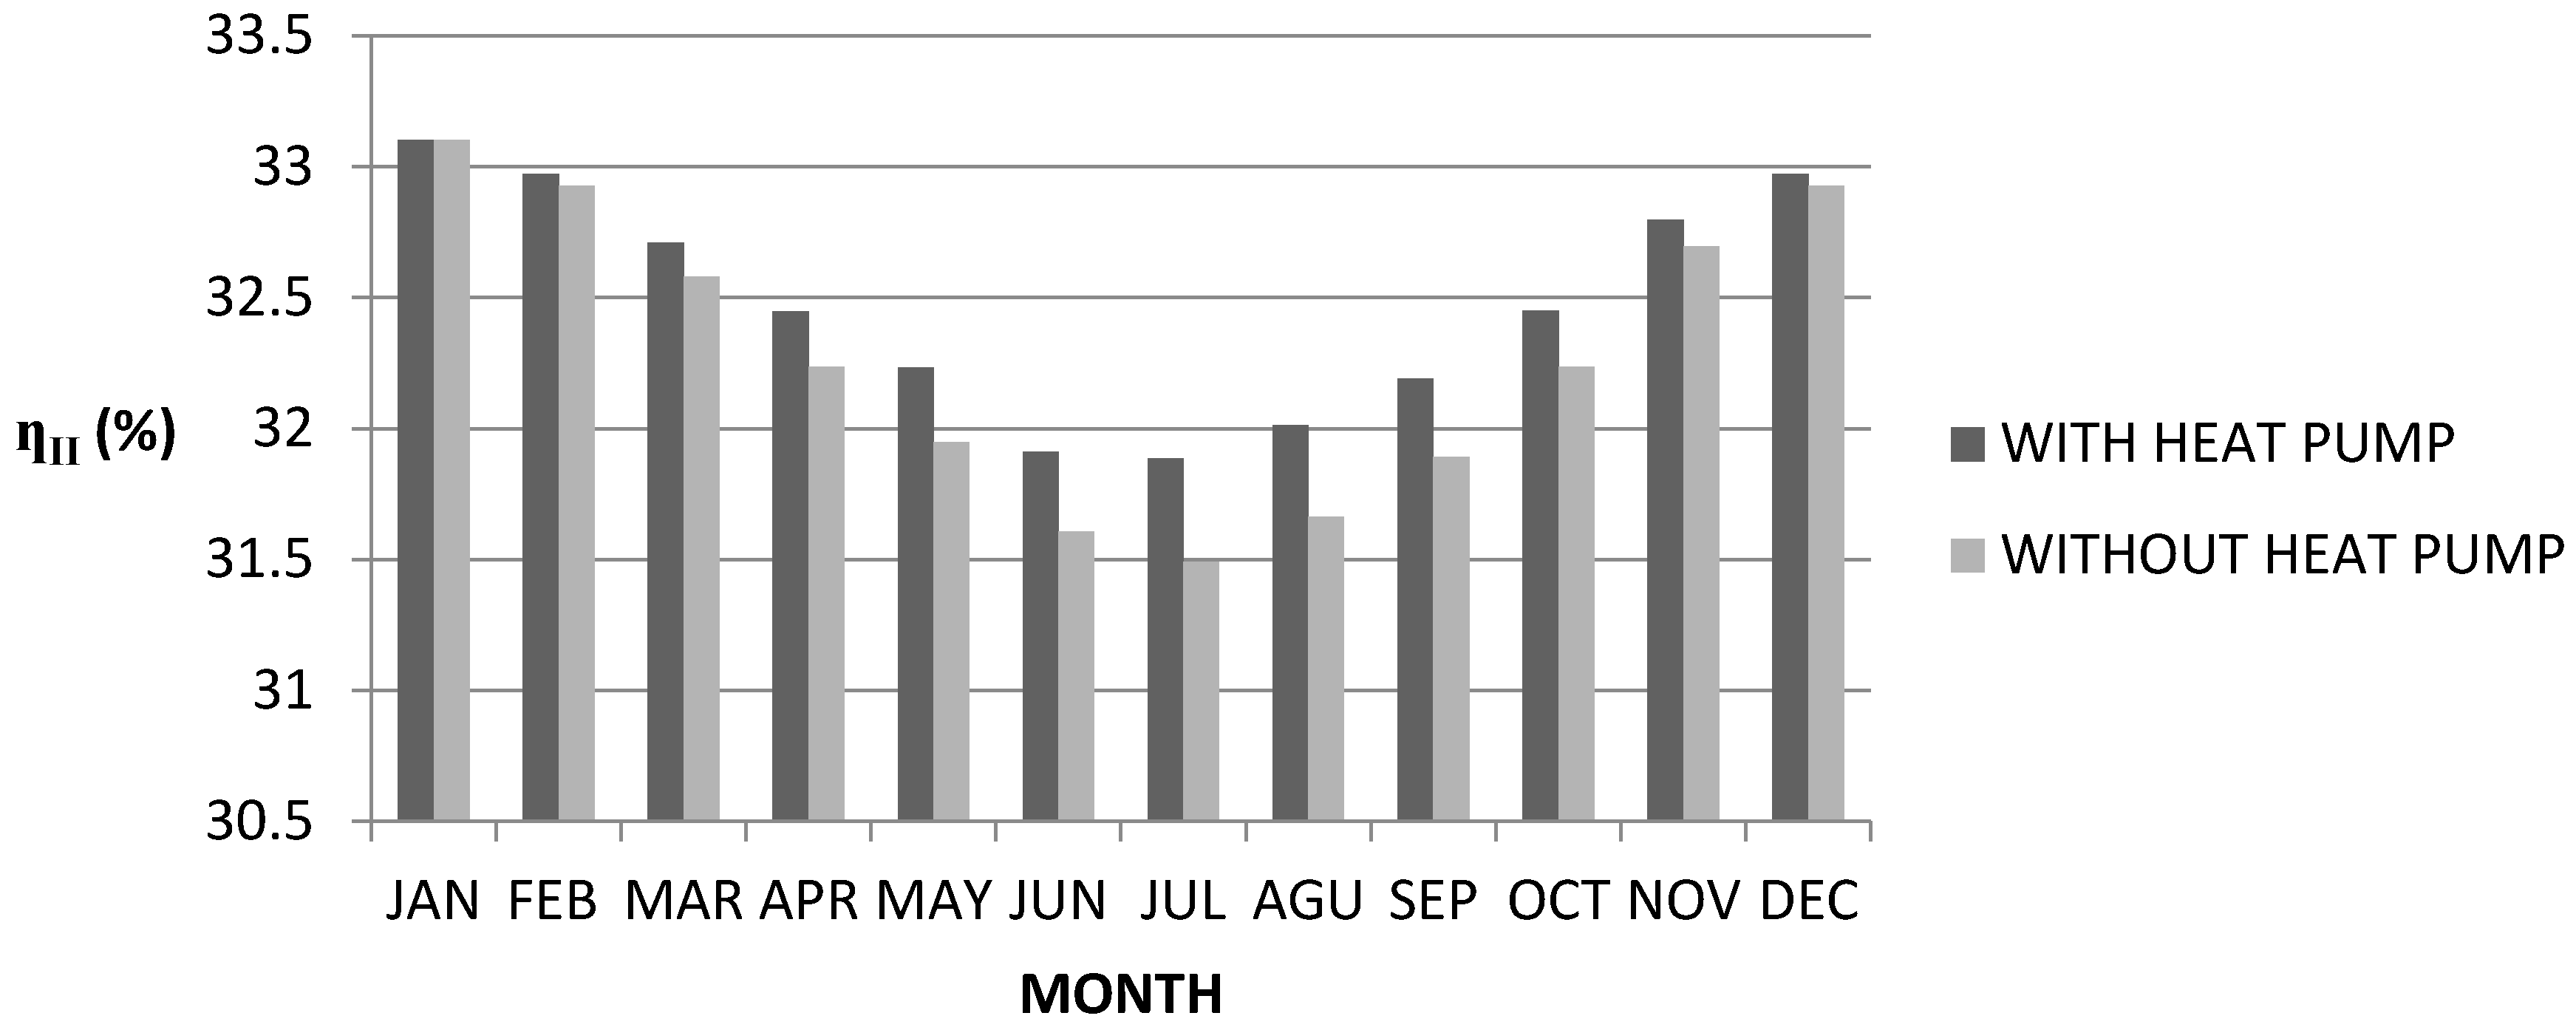
Figure 14 and
Figure 15 show the system second law efficiencies with and without the heat pump. It can be seen that the first and second law investigations for this system lead to similar results. As can be seen, the system second law efficiency increases by about 1.2% in July for both cities when the heat pump is applied.
Figure 13.
Monthly average of entropy generation in Tehran.
Figure 13.
Monthly average of entropy generation in Tehran.
Figure 14.
Monthly average of second law efficiency in Yazd.
Figure 14.
Monthly average of second law efficiency in Yazd.
Figure 15.
Monthly average of second law efficiency in Tehran.
Figure 15.
Monthly average of second law efficiency in Tehran.
7.2. Analysis of Results
The above results are summarized in
Table 5 and
Table 6. Also shown are percentage increases or decreases in various gas turbine parameters over one year of operation, for the case with input air cooling system relative to the case without.
The results in
Table 6 and
Table 7 have been calculated for all months of the year, and then combined. In a typical year, it is possible to apply the input air cooling system for 11 months in Yazd and 9 months in Tehran. Compressor inlet cooling is beneficial when the ambient air has a high temperature and low dew point.
The reduction in the cost of producing electricity per kilowatt, and the increase in the net power generation and efficiency of the gas turbine, as observed in
Table 6 and
Table 7, suggests that the air cooling system is cost effective. For instance, if the price of electricity is 5 cents/kW [
18,
29], we can calculate the benefits of installing a heat pump while accounting for the annual cost of repair and maintenance for the heat pump, the annual increasing cost due to higher fuel consumption and the annual deprecation cost. Then, we can estimate payback period time for the initial investment. The payback period is found to be about 2 years for Yazd and 2.5 years for Tehran.
Table 5.
Annual average values of selected operating parameters for the gas turbine plant in Tehran, with and without inlet air cooling via heat pumps.
Table 5.
Annual average values of selected operating parameters for the gas turbine plant in Tehran, with and without inlet air cooling via heat pumps.
| Case | Cost of Electricity Excluding Costs of Emissions (US$) | Wnet (MW) | (kJ/kg K) | Electricity Cost Including Costs of Pollutants (US$) | Production Rate of Carbon Monoxide (kg/s) | Production Rate of Carbon Dioxide (kg/s) | Production Rate of NOx (kg/s) | Fuel Rate Consumption (kg/s) |
|---|
| Without compressor inlet cooling | 0.045 | 115.96 | 815.37 | 0.13 | 7.74 × 10⁻⁶ | 27.63 | 0.27 | 9.80 |
| With compressor inlet cooling | 0.044 | 122.93 | 886.99 | 0.13 | 5.89 × 10⁻⁶ | 29 | 0.25 | 10.29 |
| Percentage change when inlet cooling is applied | −1.12% | +6.02% | +8.78% | −6.67% | −23.97% | +4.96% | −5.90% | +4.97% |
Table 6.
Comparison the parameters of power plant with and without air cooling in a year.
Table 6.
Comparison the parameters of power plant with and without air cooling in a year.
| Annual Average Parameter | Cost of Electricity Excluding Costs of Emissions (US$) | Wnet (MW) | (kJ/kg.K) | Electricity Cost Including Costs of Pollutants (US$) | Production Rate of Carbon Monoxide (kg/s) | Production Rate of Carbon Dioxide (kg/s) | Production Rate of NOx (kg/s) | Fuel Rate Consumption (kg/s) |
|---|
| Without cooling | 0.044 | 119.02 | 829.16 | 0.13 | 7.42 × 10⁻⁶ | 28.21 | 0.27 | 10.00 |
| With cooling | 0.044 | 124.95 | 889.89 | 0.12 | 5.62 × 10⁻⁶ | 29.37 | 0.26 | 10.42 |
| Annual percentage change | −0.90% | +4.99% | +7.32% | −24.33% | −5.30% | +4.13% | −4.8% | +4.14% |
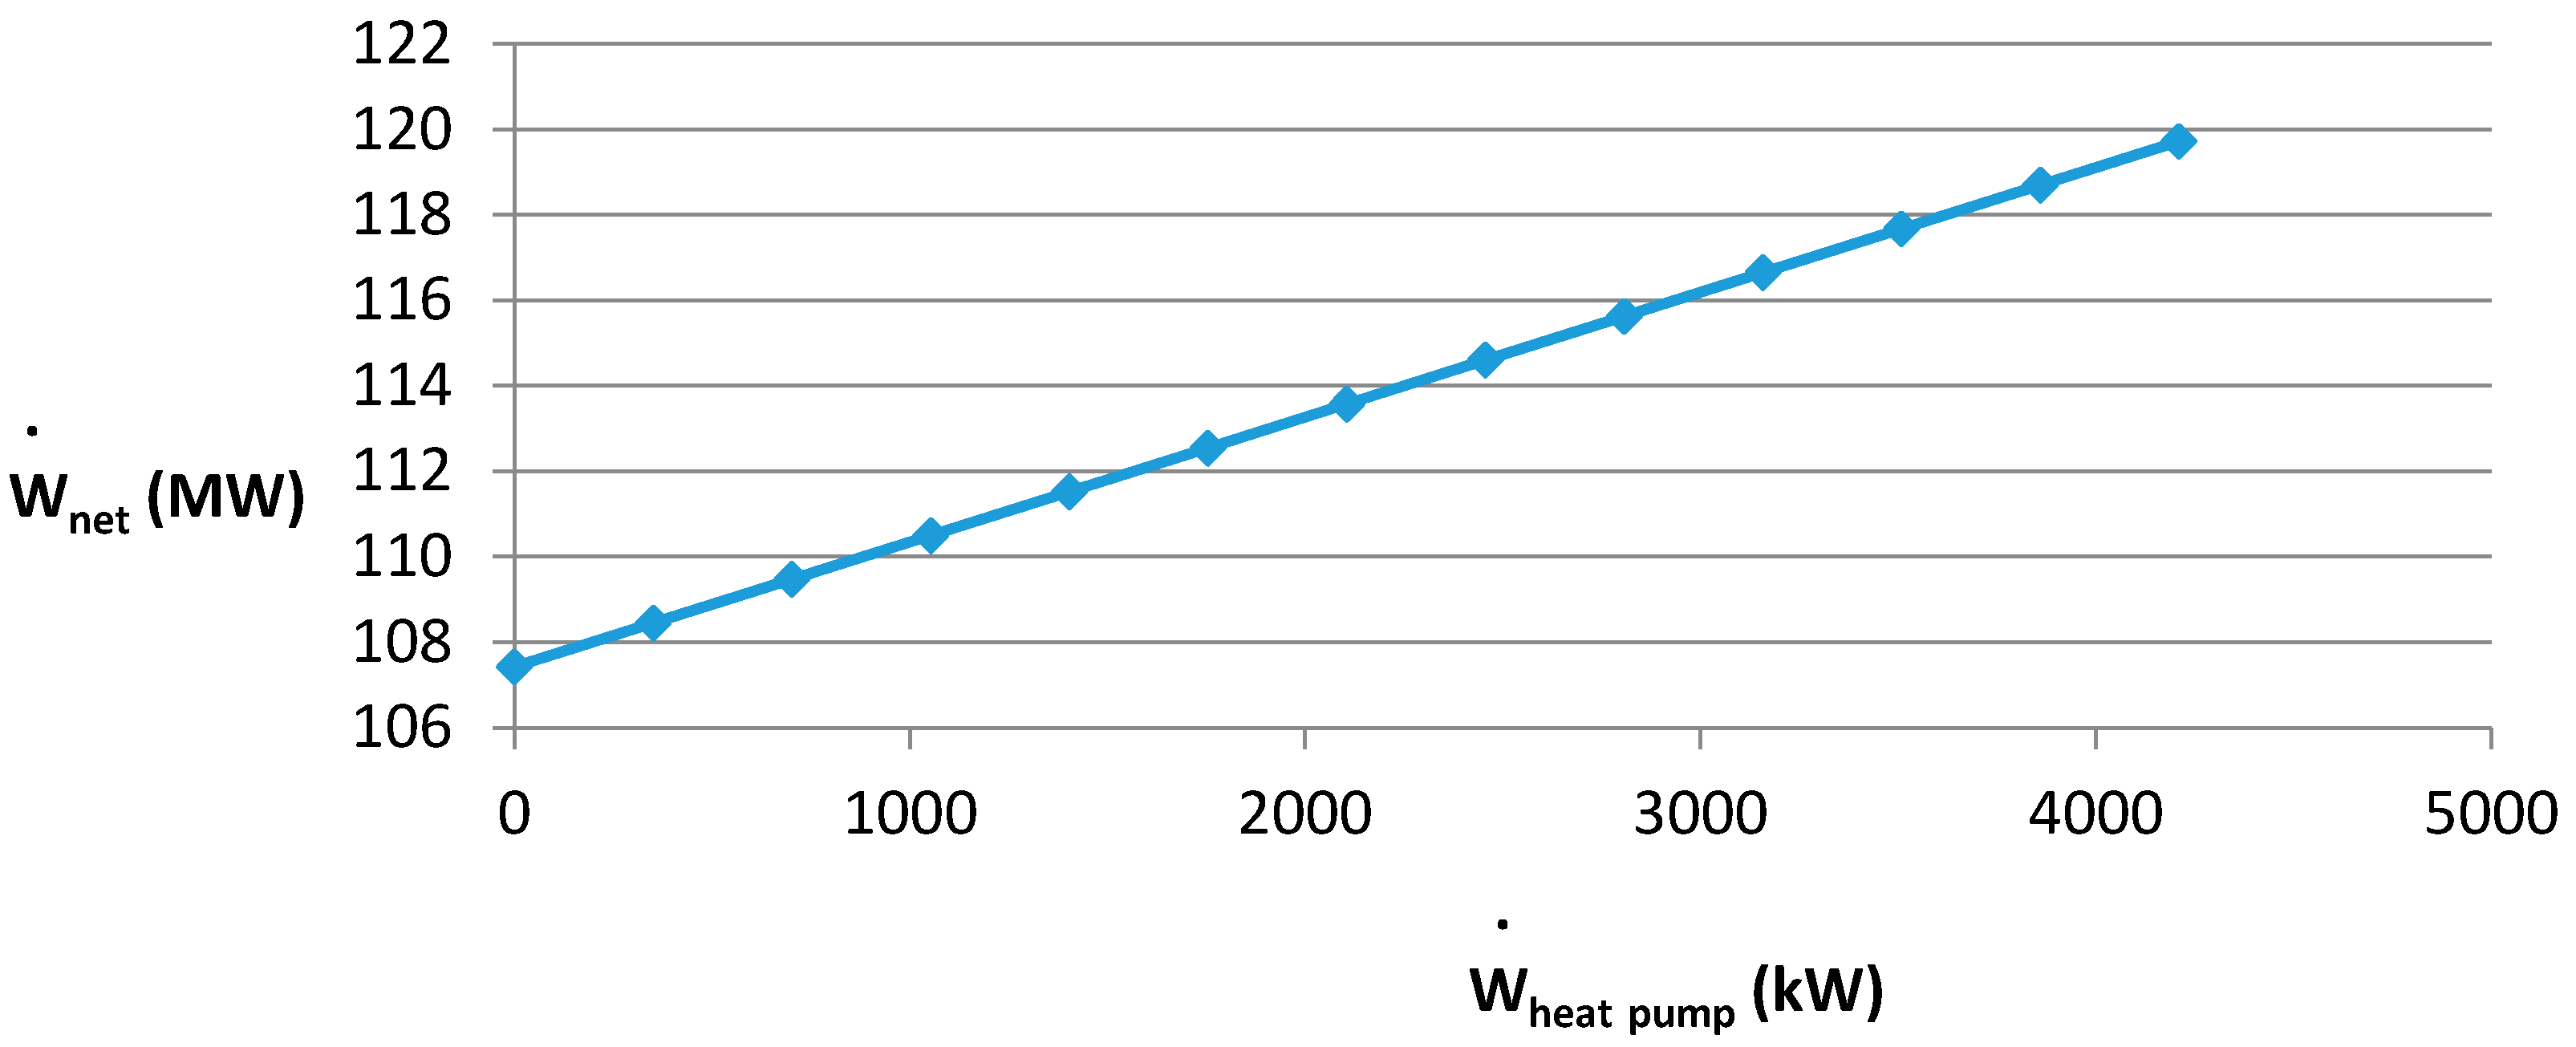
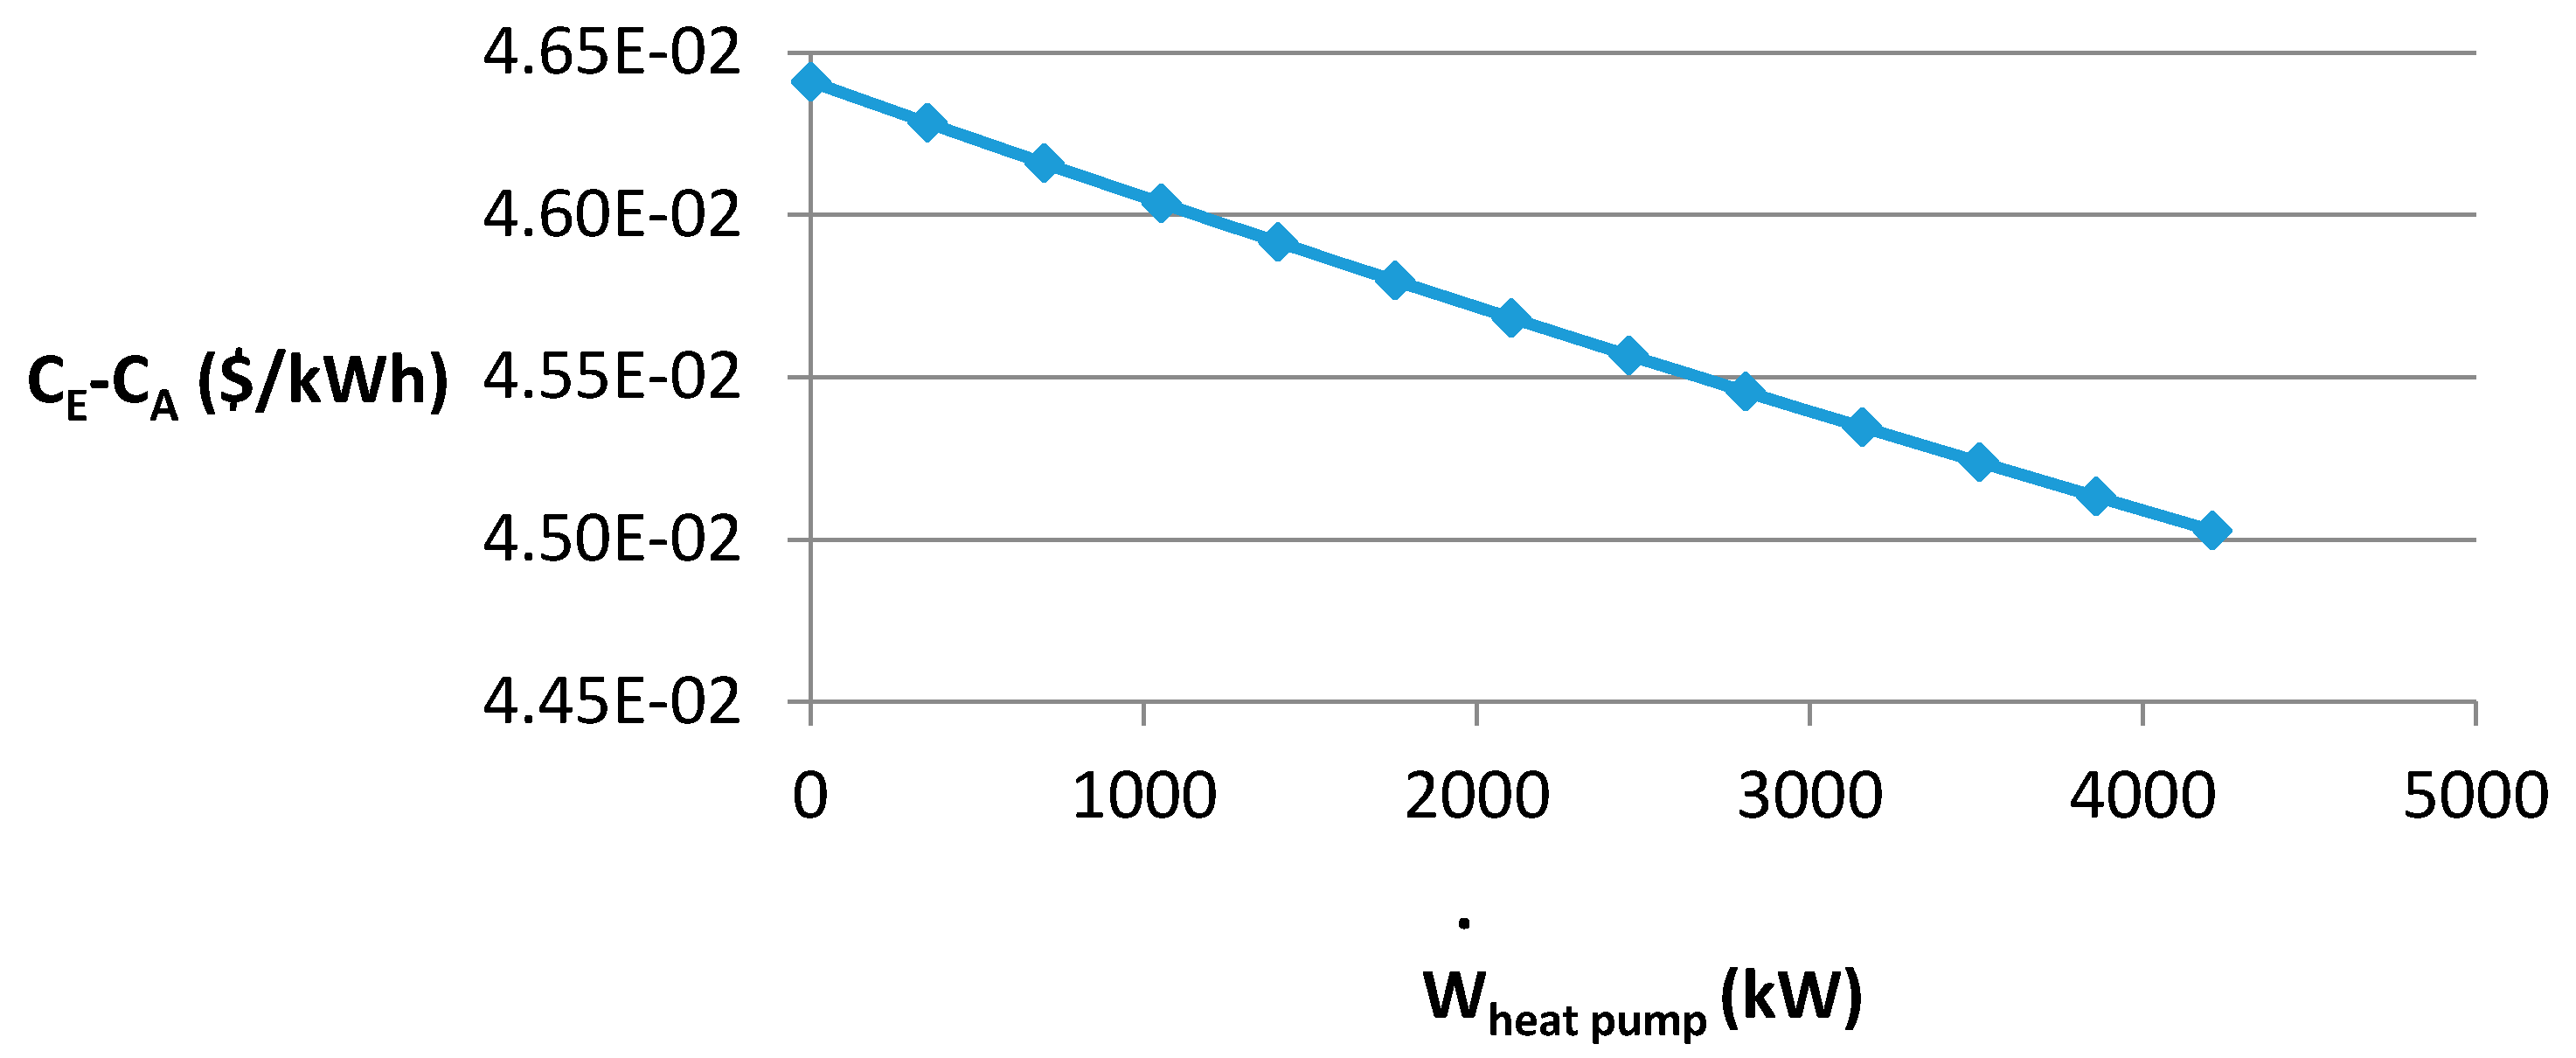
Figure 16 and
Figure 17 show the decrease in unit cost of electricity generation (including costs of pollutants), when a given amount of work is provided to the heat pumps in Yazd and Tehran.
Figure 16.
Decrease in unit cost of electricity, including costs of pollutants, for use by the heat pump in Yazd.
Figure 16.
Decrease in unit cost of electricity, including costs of pollutants, for use by the heat pump in Yazd.
Figure 17.
Decrease in cost of electricity generation, including costs of pollutants, for use by the heat pump in Tehran.
Figure 17.
Decrease in cost of electricity generation, including costs of pollutants, for use by the heat pump in Tehran.
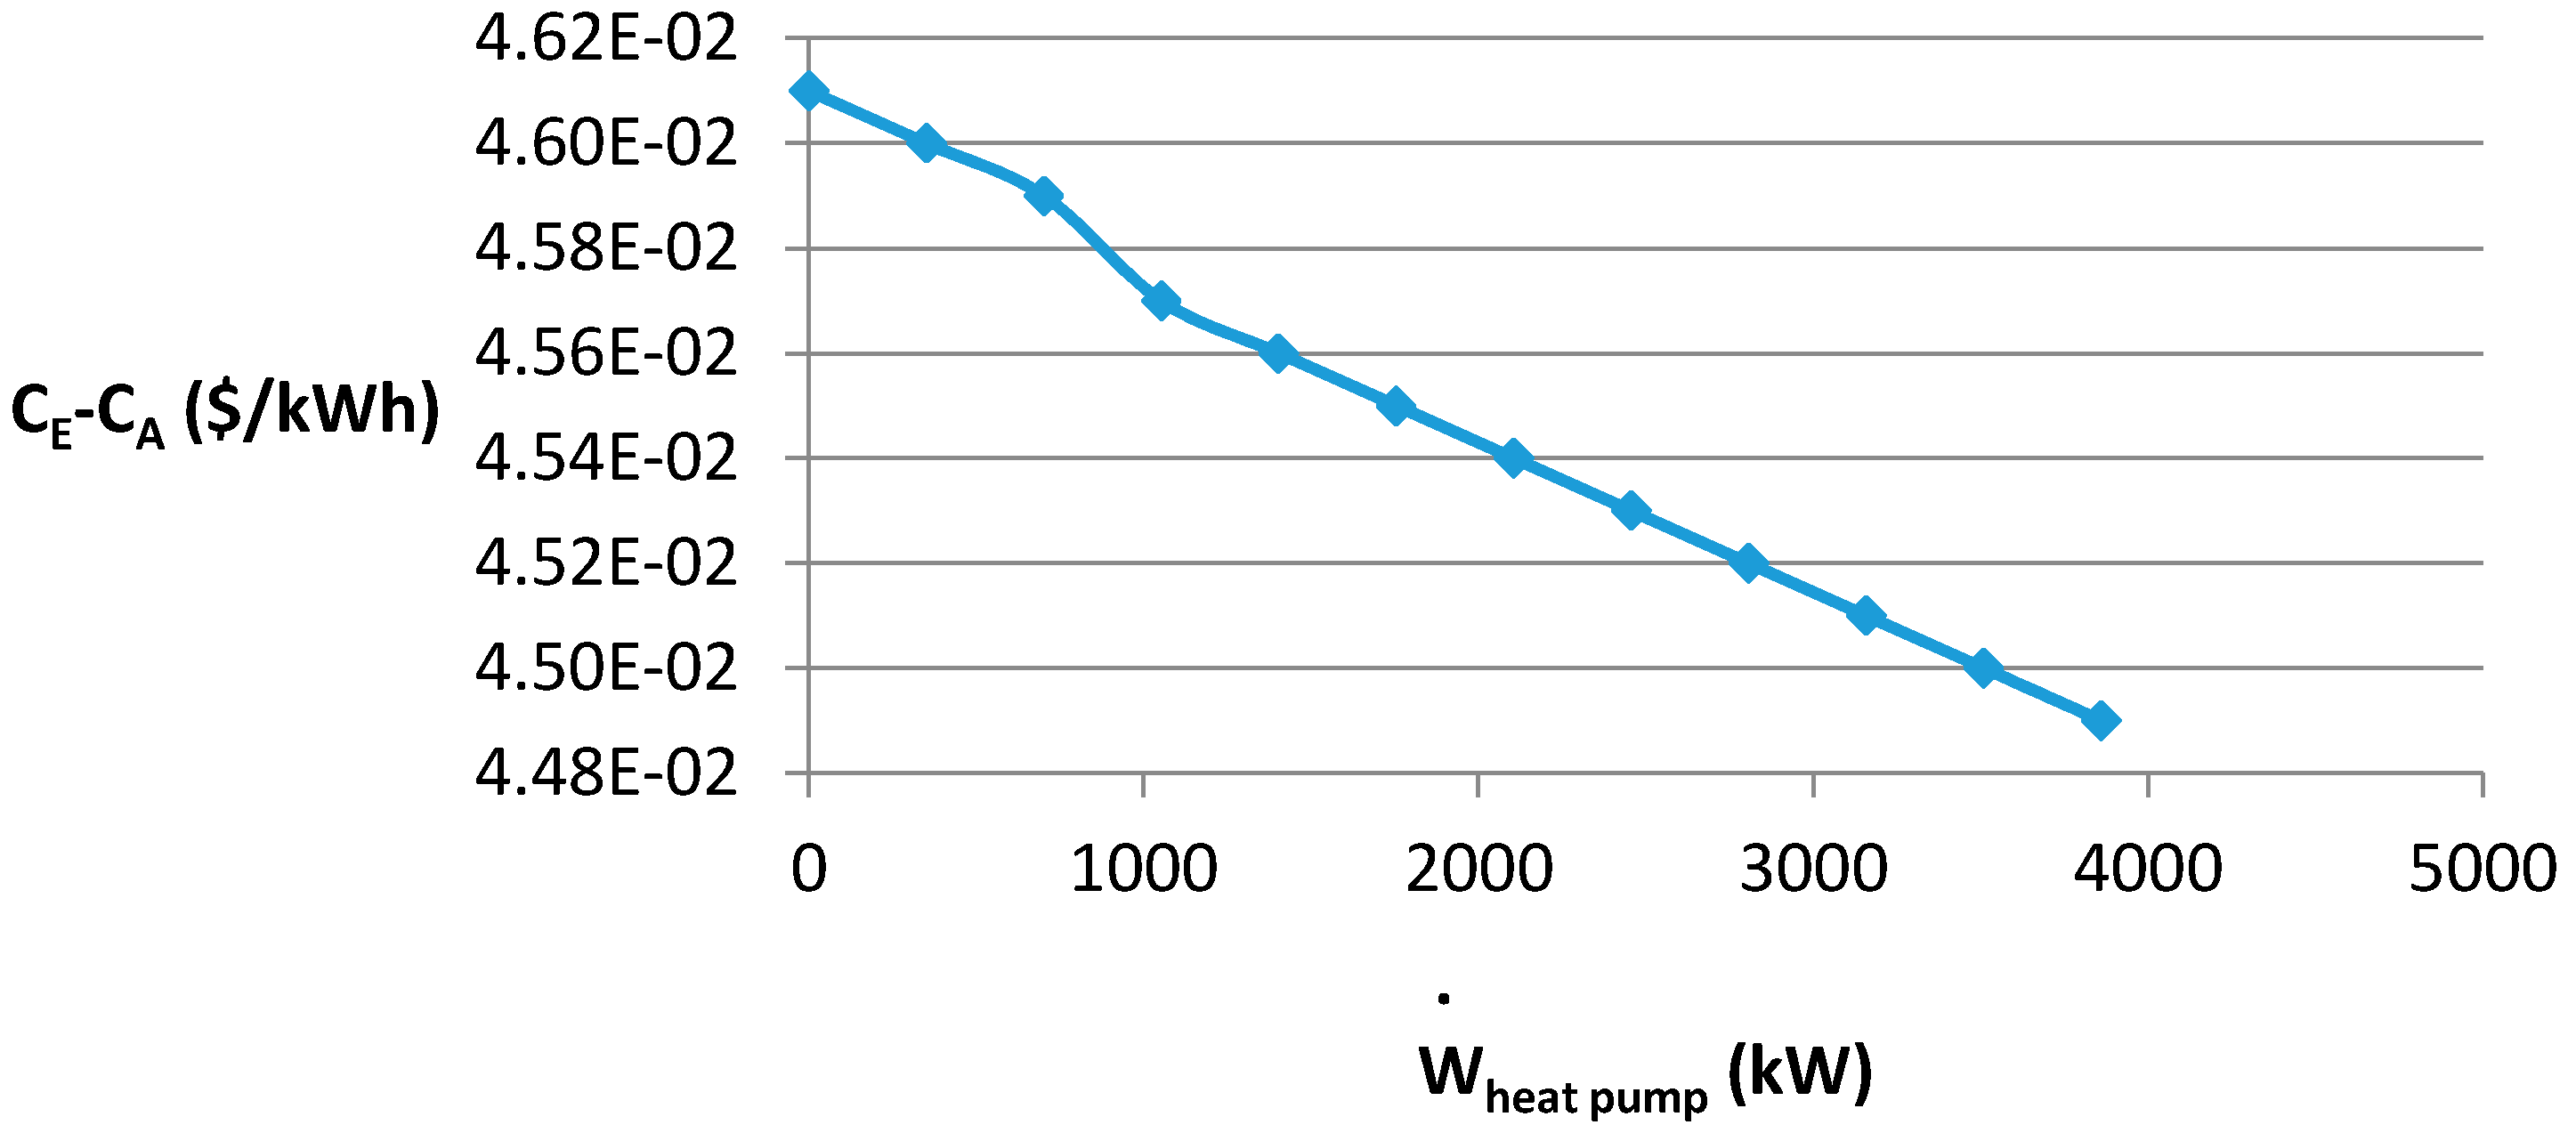
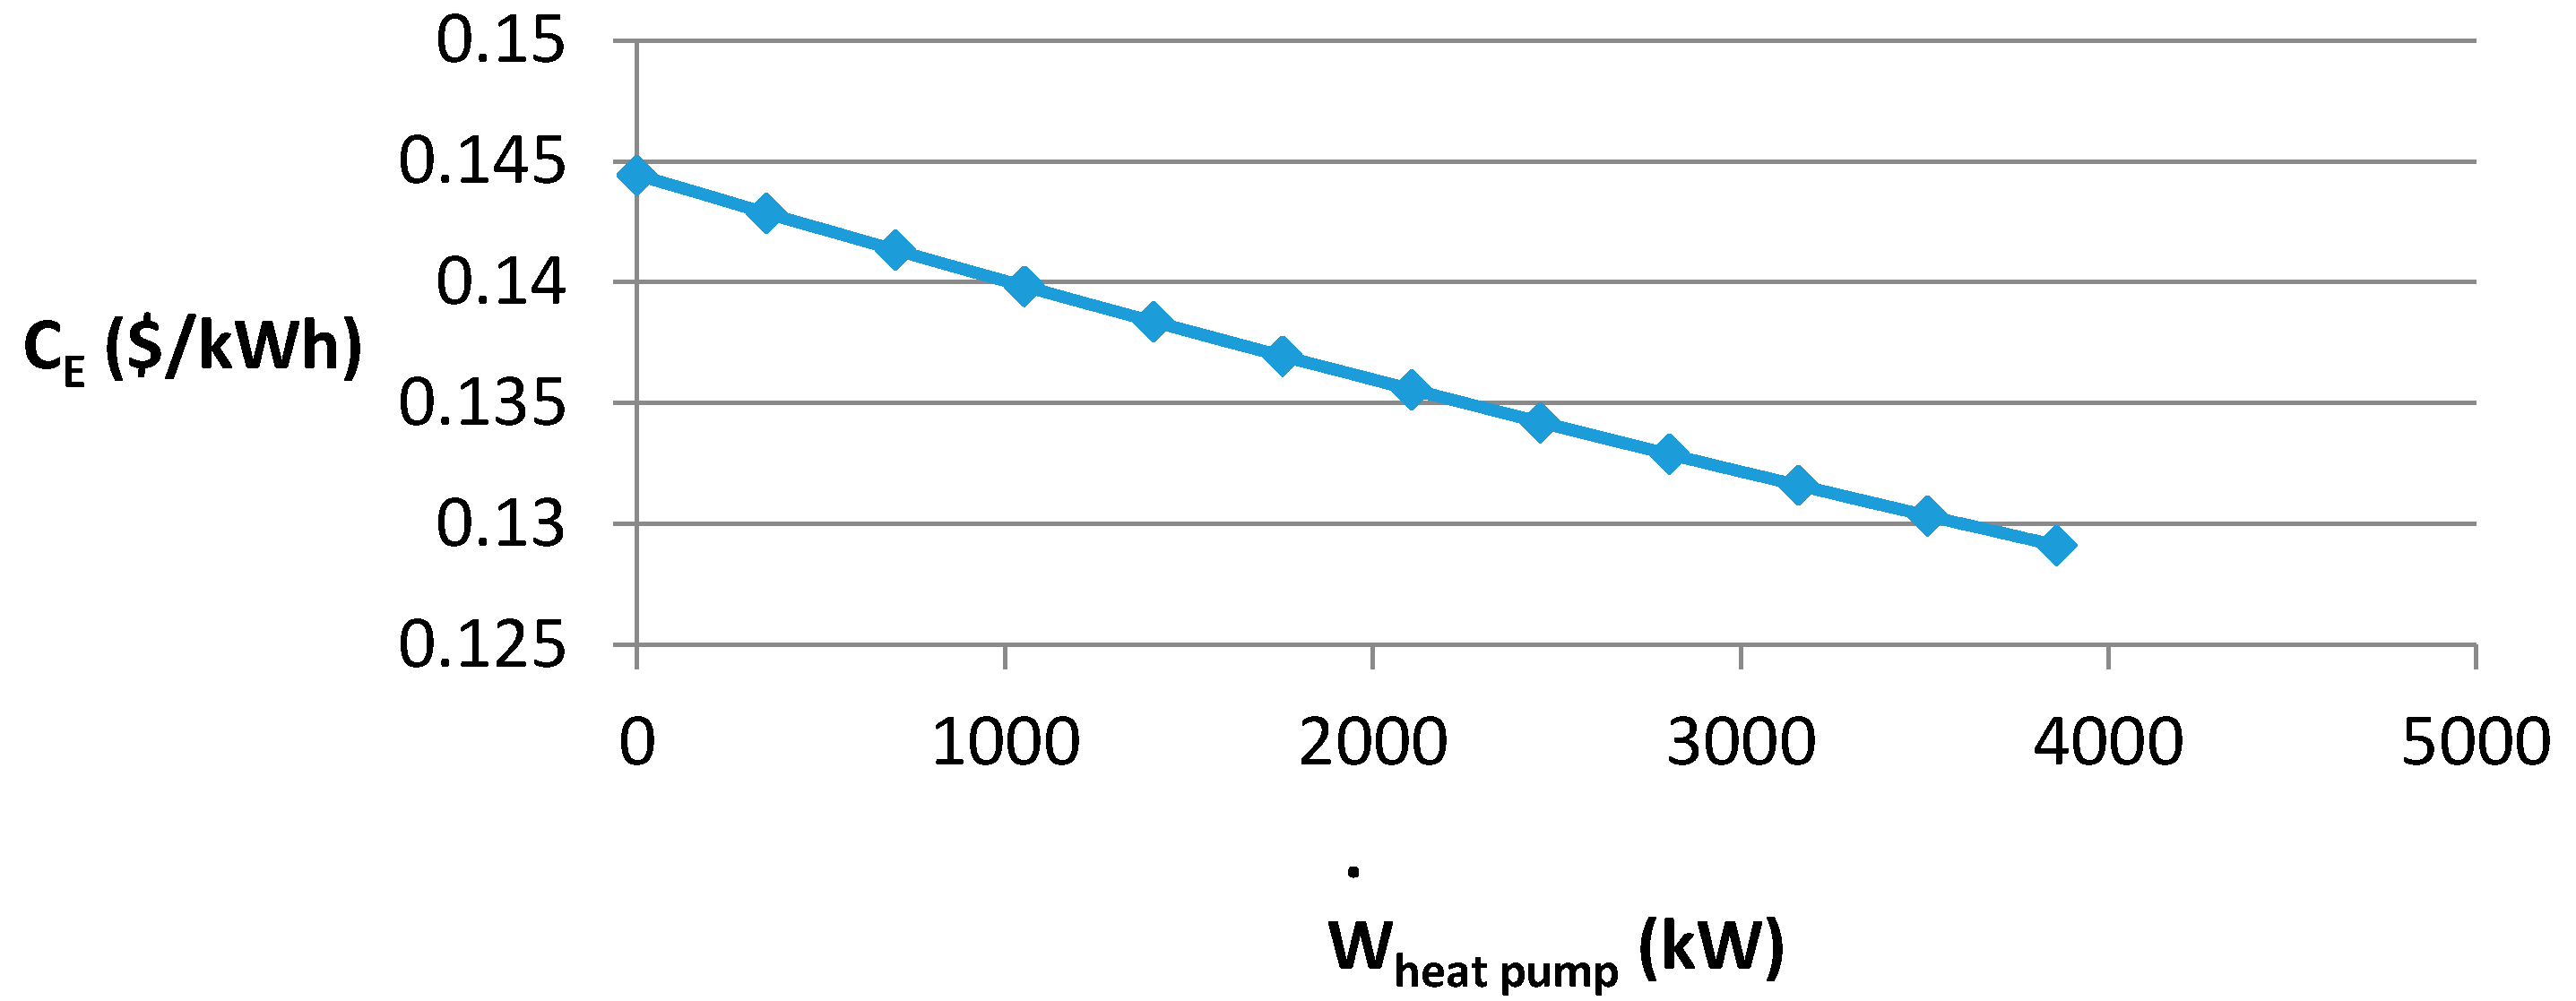
Also,
Figure 18 and
Figure 19 show the decrease in unit cost of electricity generation (excluding costs of pollutants), for a given amount of work provided to the heat pump in Yazd and Tehran.
Figure 18.
Decrease in unit cost of electricity generation excluding costs of pollutants for power use by the heat pump in Yazd.
Figure 18.
Decrease in unit cost of electricity generation excluding costs of pollutants for power use by the heat pump in Yazd.
Figure 19.
Decrease in cost of electricity generation excluding costs of pollutants for power use by the heat pump in Tehran.
Figure 19.
Decrease in cost of electricity generation excluding costs of pollutants for power use by the heat pump in Tehran.
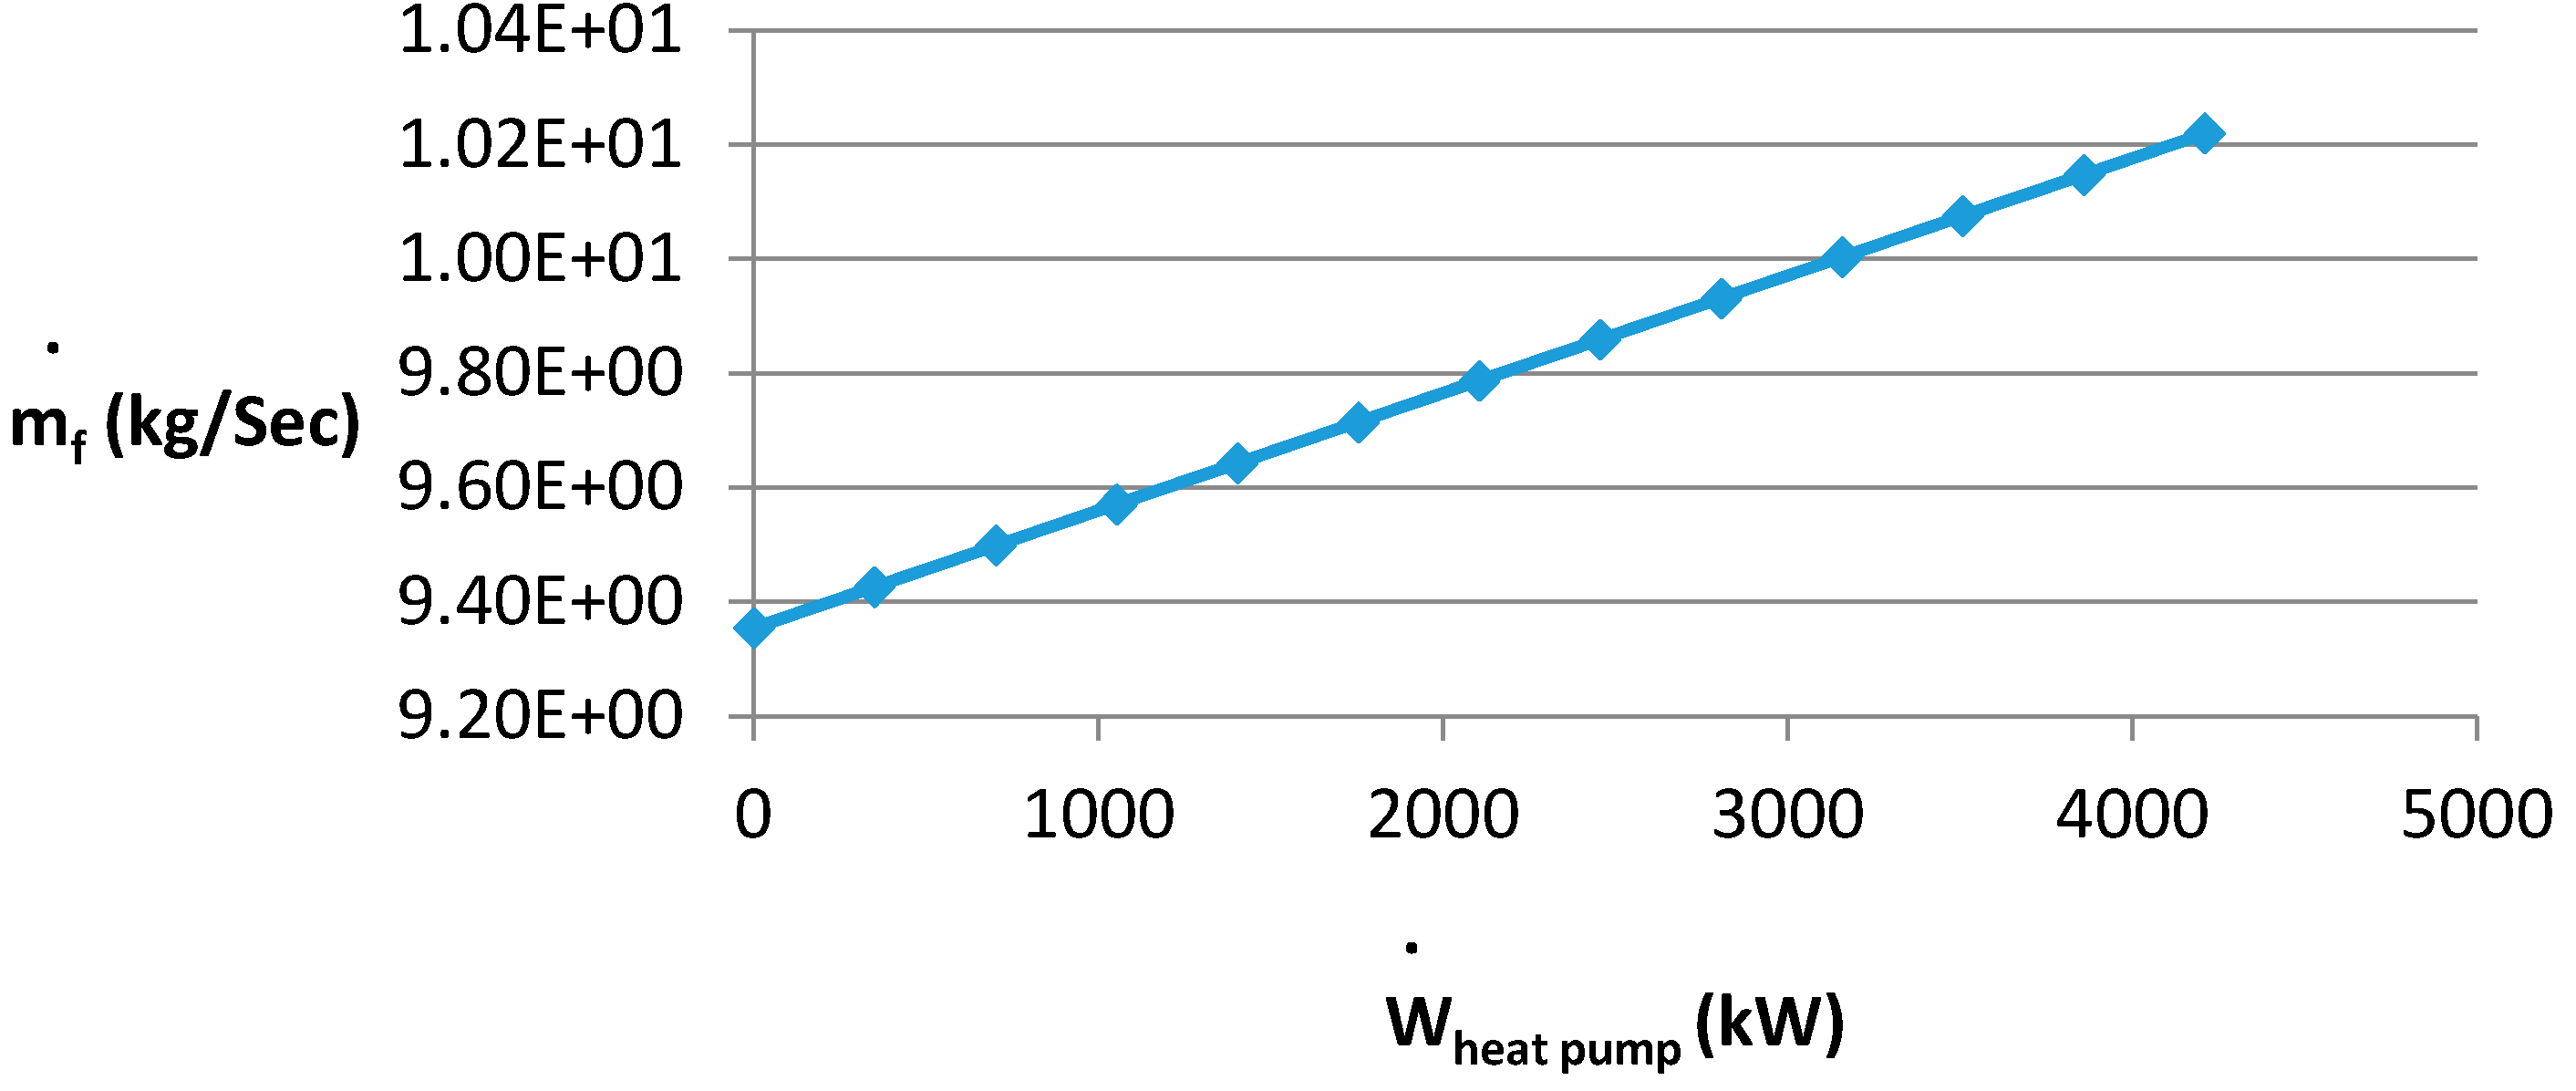
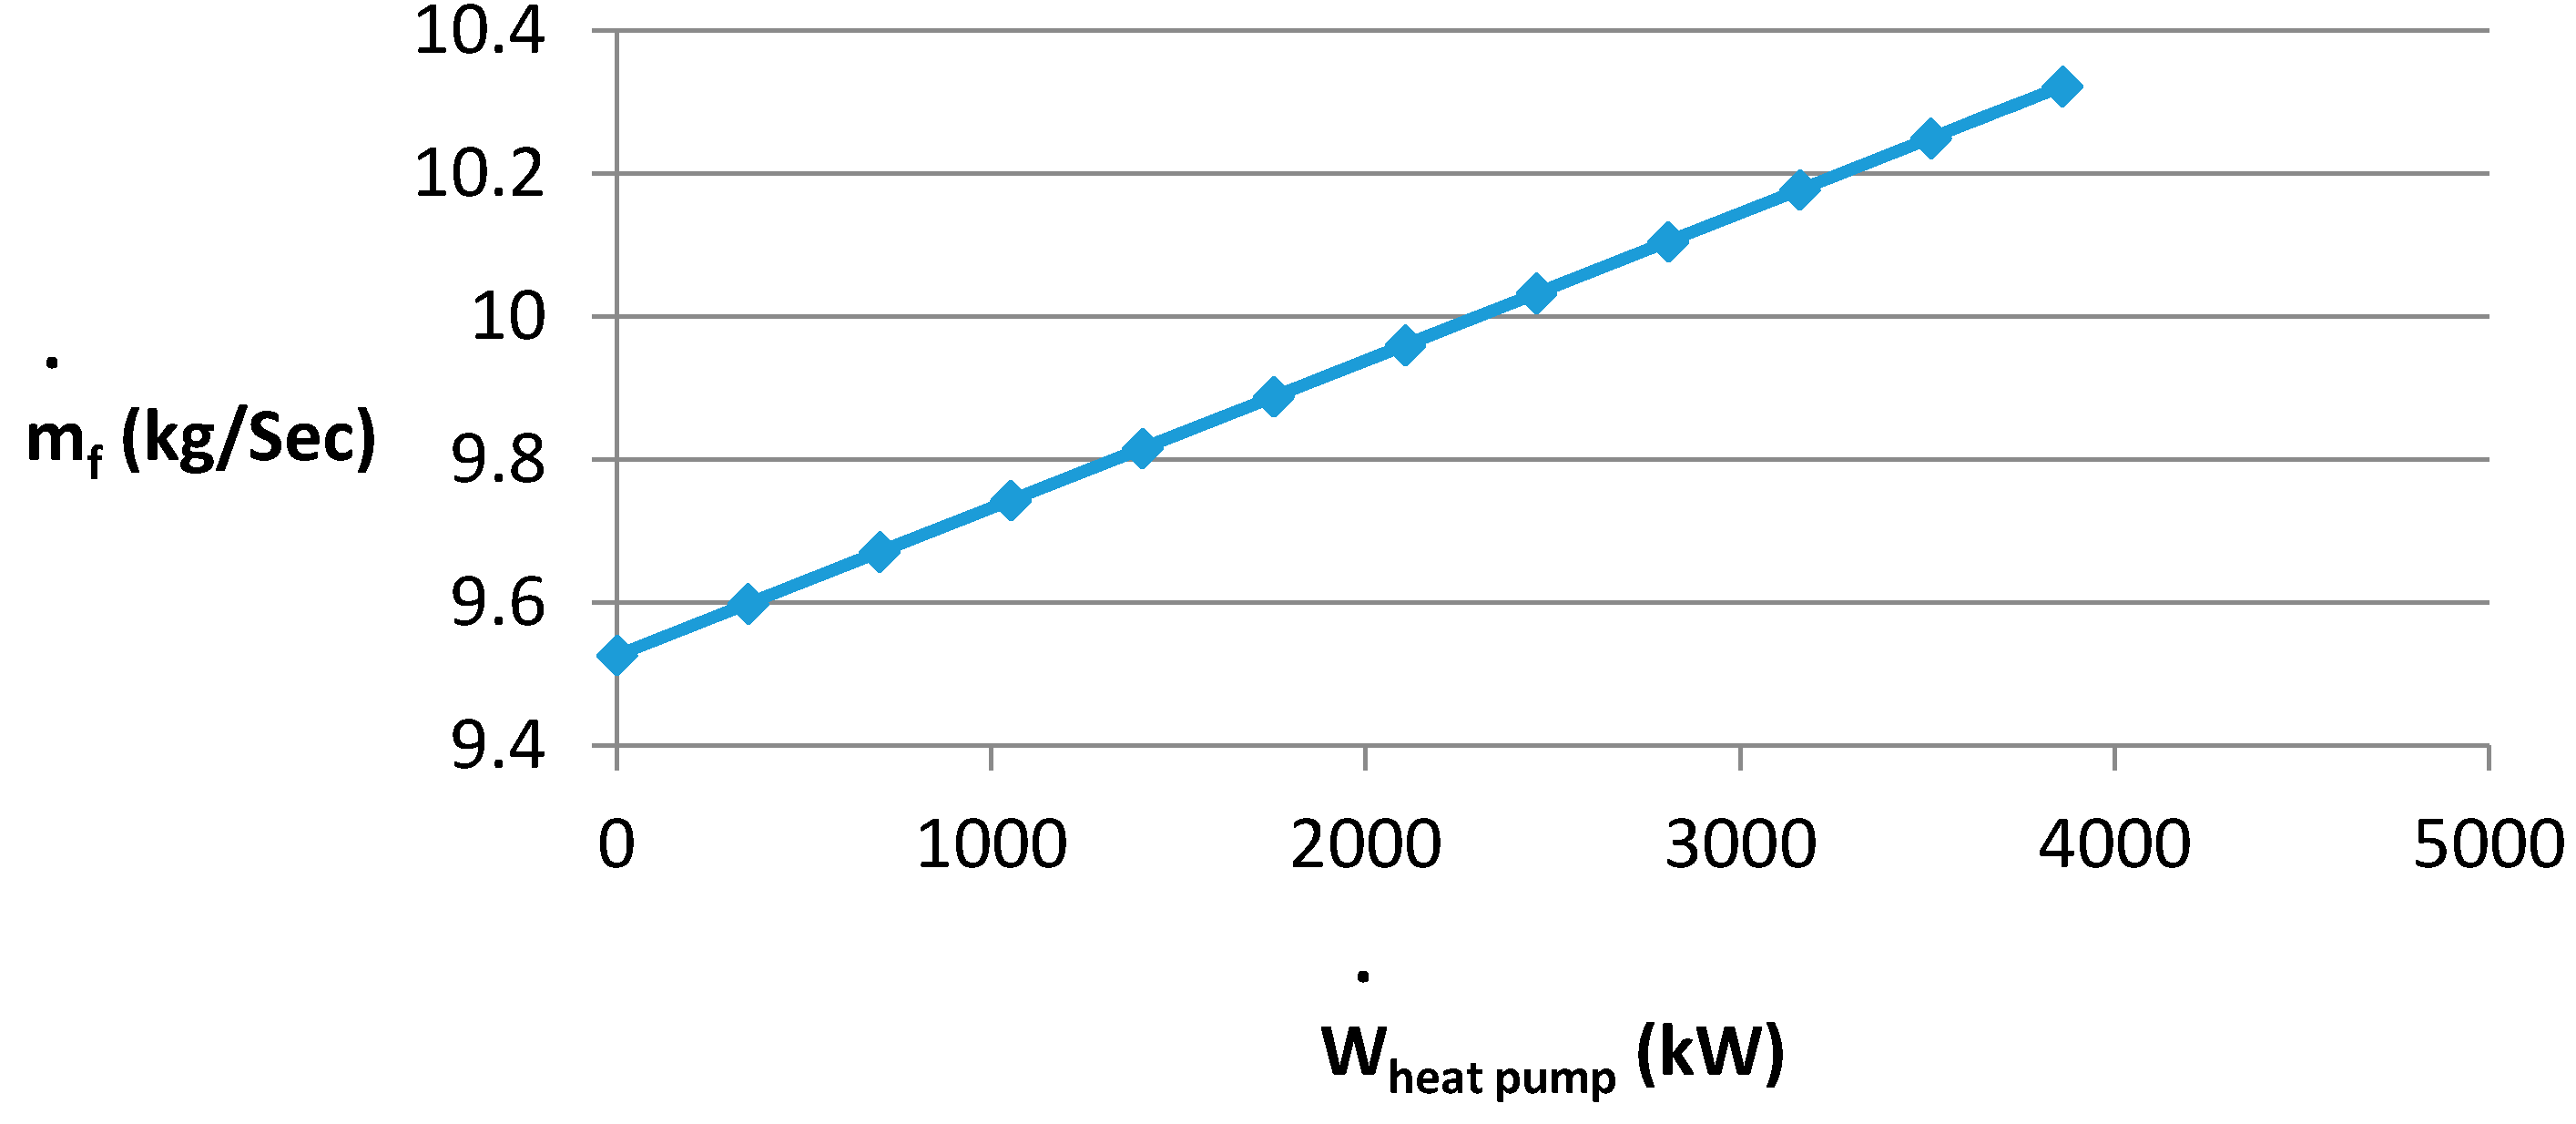
Figure 20 and
Figure 21 show the increase in fuel consumption rate for a specific amount of work provided to the heat pump. Decisions should be based on the working conditions in each city.
Figure 20.
Increase in fuel consumption rate of overall plant for power use by the heat pump in Yazd.
Figure 20.
Increase in fuel consumption rate of overall plant for power use by the heat pump in Yazd.
Figure 21.
Increase in fuel consumption rate of overall plant for power use by the heat pump in Tehran.
Figure 21.
Increase in fuel consumption rate of overall plant for power use by the heat pump in Tehran.
The application of this inlet air cooling system in Yazd for 11 months and in Tehran for 9 months per year lowers the power generation costs during those months. However, for the one month for Yazd and three months for Tehran when inlet cooling is not applied, the power generation costs increase slightly. Over the full year, however, lower annual power generation costs are observed with inlet air cooling.
It is observed that, during hot seasons, the inlet air cooling system exhibits better performance, in that the power generated by the gas turbine plant increases for Yazd and Tehran by about 11.5% and 10.0%, respectively, and that the power generation costs (including pollutant costs) decline by 11 and 10% for Yazd and Tehran, respectively. The system efficiency increases by about 2% during warm seasons and the formation of NOx and CO decreases significantly, by about 10% and 35%, respectively. The reduction in NOx generation is attributable to the decrease in thermal NOx and prompt NOx that result from reducing the combustion temperature. The reduction in CO generation is likely attributable to the more efficient conversion of CO to CO2 during combustion.
The vapor compression systems used by heat pumps have relatively low costs of repair and maintenance and can be utilized all year. The advantages of this system include an increase in power generation at significantly lower costs than are associated with the purchase and installation of new turbines, a significant decrease in emissions of environmental pollutants and a reduction in power generation costs. In other words, input air cooling provides less costly power ion Note that the application of this cooling system slightly increases fuel consumption but, since the efficiency and power generation of the gas turbine increases, overall fuel consumption is reduced.
The formation of CO2 in the gas turbine exhaust gases increases, although this is accompanied by significant decreases in NOx and CO formation. Often NOx and CO emissions are viewed as posing higher risks than CO2 emissions for human health and the environment, so the net environmental impact is likely reduced through inlet air cooling.
Application of heat pump system for inlet air cooling also increases entropy that was observed in
Figure 12 and
Figure 13.
Table 7 indicates changes in selected operating parameters of the gas turbine in July for Yazd and Tehran, for an electrical power input to the heat pump normalized one megawatt. Using this table and specific requirements of the plant, we can calculate and optimize cooling capacity and power of the heat pump.
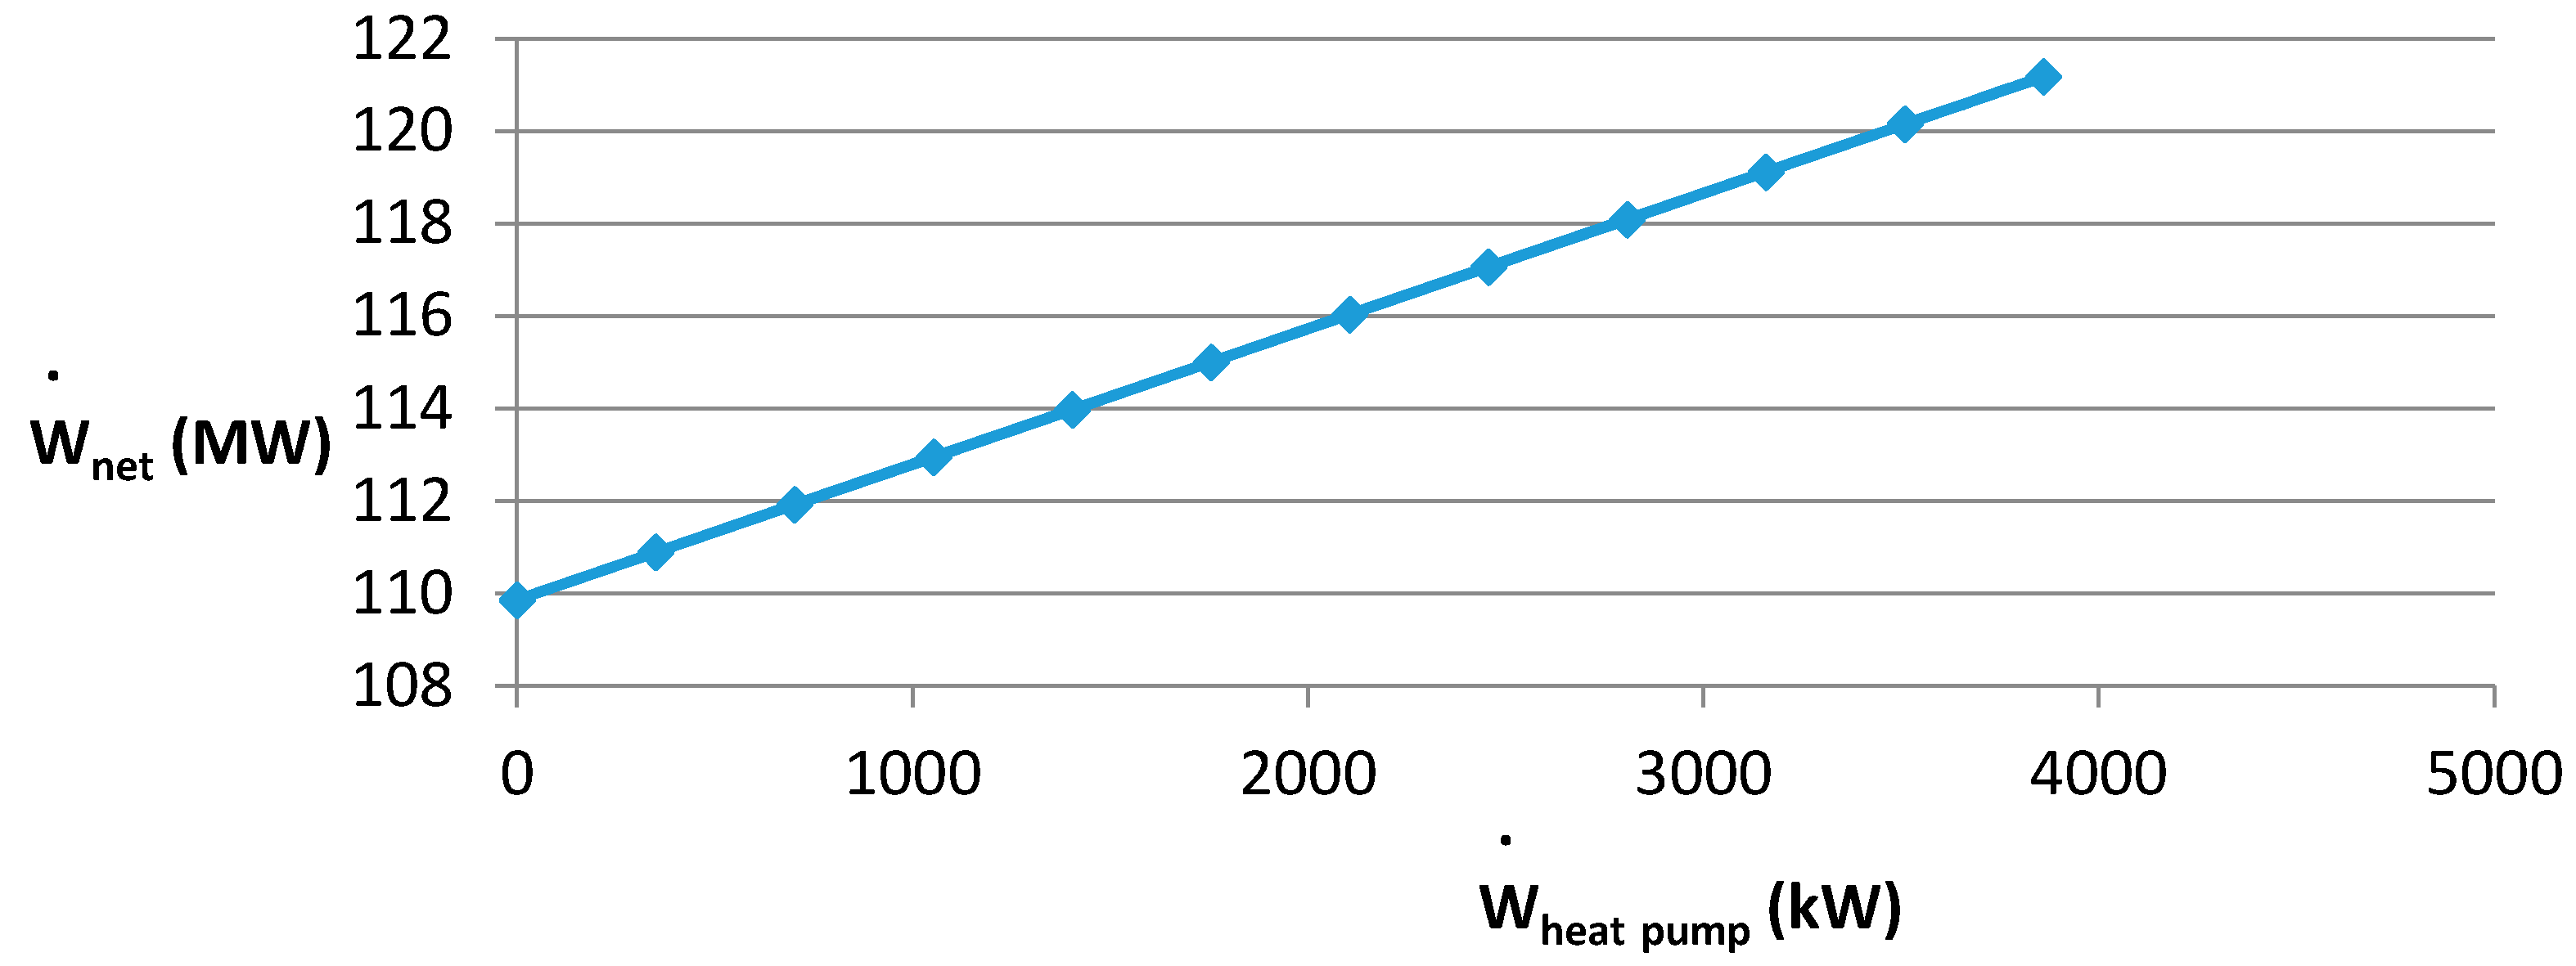
Figure 22 and
Figure 23 show the amount of increase in net power generation in megawatts for power use by the heat pump in kilowatts in Yazd and Tehran respectively. As shown in figures and
Table 7 for 1 MW power use by heat pump in July, net power generation increases about 3 MW in both cities.
Table 7.
Changes of selected parameters for the gas turbine for 1 MW power use by the heat pump, for July in two climates.
Table 7.
Changes of selected parameters for the gas turbine for 1 MW power use by the heat pump, for July in two climates.
| City | Reduction in Compressor Inlet Temperature (K) | Increase in Net Power Generation of Overall Plant (MW) | Increase in Total Entropy Generation (kJ/kg K) | Reduction in Cost of Electricity Generation (US$) | Reduction in CO Generation rate (kg/s) | Increase in CO2 Generation Rate (kg/s) | Reduction in NOx Generation Rate (kg/s) | Increase in Fuel Consumption Rate (kg/s) |
|---|
| Yazd | 7 | 3 | 32 | 0.0005 | 0.000015 | 0.6 | 0.01 | 0.2 |
| Tehran | 6.5 | 3 | 32.5 | 0.0004 | 0.000013 | 0.6 | 0.008 | 0.2 |
Figure 22.
Increase in net power generation of overall plant for power use by the heat pump in Yazd.
Figure 22.
Increase in net power generation of overall plant for power use by the heat pump in Yazd.
Figure 23.
Increase in net power generation of overall plant for power use by the heat pump in Tehran.
Figure 23.
Increase in net power generation of overall plant for power use by the heat pump in Tehran.
8. Conclusions
The usefulness and economic benefits have been demonstrated of a heat pump-based inlet air cooling system for months of the year, particularly warm/hot months in Yazd and Tehran. In cities with hot and arid weather such as Yazd, however, evaporative chillers may provide a good option for compressor inlet air cooling.
Evaporative cooling systems have much lower costs for initial installation (especially for plants with distilled water generation capability) than vapor compression cooling systems, but evaporative systems incur higher repair and maintenance costs and significantly increase water consumption. The use of evaporative systems also shortens gas turbine life. Generally, decisions on the kind of compressor air cooling system are made based on environmental conditions and gas turbine requirements.
Although the use of a heat pump for inlet air cooling significantly raises gas turbine power generation during warm seasons, this puts the generator under pressure and dramatically increases its temperature. To prevent damage to the gas turbine generator, therefore, additional cooling is needed throughout the hot seasons. It appears that application of inlet air cooling systems in combined heat and power plant (CHP) systems and recovery of the heat pump condenser heat can significantly increase the overall system efficiency.


