Article

Understanding Attitudes and Pro-Environmental Behaviors in a Chilean Community

by
Nicolás C. Bronfman
1,2,
Pamela C. Cisternas
1,2,*,
Esperanza López-Vázquez
3,
Cristóbal De la Maza
4 and
Juan Carlos Oyanedel
5
1
Engineering Sciences Department, Universidad Andres Bello, Avenida República 237, Santiago 8370146, Chile
2
National Research Center for Integrated Natural Disaster Management, CONICYT/FONDAP/15110017, Santiago 7820436, Chile
3
Interdisciplinary Psychology Research Center, Universidad Autónoma del Estado de Morelos, Pico de Orizaba No. 1 Col. Volcanes, Cuernavaca, Morelos 62350, México
4
Department of Engineering and Public Policy, Carnegie Mellon University, 5000 Forbes Avenue, Pittsburgh, PA 15213, USA
5
Public Policy and Management Department, Administration and Economics Faculty, Universidad de Santiago de Chile, Santiago 8370146, Chile
*
Author to whom correspondence should be addressed.
Sustainability 2015, 7(10), 14133-14152; https://doi.org/10.3390/su71014133
Submission received: 10 August 2015 / Revised: 13 October 2015 / Accepted: 14 October 2015 / Published: 20 October 2015

Abstract

:
Environmental protection and restoration are some of the major challenges faced by our society. To address this problem, it is fundamental to understand pro-environmental behaviors in the population, as well as the factors that determine them. There are, however, very few studies conducted in Latin America that are focused in understanding the environmental behavior of its citizens. The main goal of this research was to study the environmental behaviors of a Chilean community and identify the factors that determine them. To that end, a diverse set of environmental behaviors (power and water conservation, environmentally-aware consumer behavior, biodiversity protection, rational automobile use and ecological waste management) and sociodemographic and attitudinal factors—based on the VBN model—were evaluated. Survey data was obtained from a statistically representative sample (N = 1537) in Santiago, Chile. Our results suggest that several participants displayed tendencies that favor more responsible environmental behaviors, with high environmental concern, and demonstrating their ample awareness of the consequences of failing to protect the environment. Nevertheless, the highest average scores of environmental behavior were related to low cost behaviors and those that imposed the fewest behavioral restrictions. In global terms, we concluded that the youngest subjects in the lowest socioeconomic group obtained the lowest scores across the pro-environmental behavior spectrum.

1. Introduction

At present, environmental protection and restoration are some of the major challenges faced by our society. Several governments have undertaken the task of addressing much of this challenge by establishing policies and standards to regulate the impacts of human activity. Environmental protection and restoration efforts, however, depend not only on the schemes implemented by regulatory bodies, but also on the daily choices made by individuals—how they behave toward the environment, what they consume, or what they are willing to give up. Therefore, studying pro-environmental attitudes and behaviors—as well as the factors that determine them—is a fundamental part of understanding the true potential to foster more sustainable development.
The process of social and economic development that Chile has experienced over recent decades has had a significant impact on the development and implementation of environment policies aiming at addressing environmental impacts from different economic sectors. However, institutional and normative efforts aiming at promoting social responsibility and strengthening pro-environmental behavior among citizens have not developed at the same pace. For example, infrastructure for household recycling is very limited at a national level. At the date of the present study, approximately 170 recycling points for plastic, cardboard, paper and glass were located in Santiago, which were concentrated in a few municipalities.
Today, the task of protecting the environment is being addressed not only by the industrialized economies of Europe and North America, but it has also become a transcendental subject matter for Latin American countries, whose economic and social development have generated societies increasingly concerned about their environment. That said, there are only a few studies in Latin America focused on knowing and understanding the environmental attitudes of its citizens.

1.1. Pro-Environmental Attitudes Studies in Latin American Countries

Based on the notion that environmental concern is a post-material attitude, it has been argued that developing nations, such as Latin American countries, would express lower concern about environmental issues than the industrialized countries of Europe and North America [1,2]. Nevertheless, intercultural studies show completely different relationships [3]. Dunlap and Mertig [4] studied environmental attitudes in 24 countries, including industrialized and developing countries—such as Mexico, Uruguay, Chile and Brazil—among others. When these authors correlated the national GNP per capita with the level of support for specific environmental protection measures among the 24 countries, they found a strong negative correlation. Dunlap and Mertig [4] conclude that residents of poorer nations not only tend to see environmental problems as most serious but are also more supportive of efforts to ameliorate them. The foregoing clearly suggests that the traditional belief that environmental concern is a luxury afforded only by the wealthy is cross-culturally unfounded [3]. One explanation for these differences is that culture plays an important role in determining environmental attitudes [5,6]. These results have led to the development of a number of cross-cultural studies, which have allowed for the validation and extension of theories and models trying to explain and predict the population’s environmental attitudes and behaviors (see studies by Schultz and Zelezny [7], De Groot and Steg [8], and Milfont et al. [9]).
Despite the above, the development of local studies specifically designed to understand the environmental attitudes and behaviors of Latin American populations is scarce. Most research has focused on environmental behaviors of Mexican and Chilean communities. One of the first studies was developed by Corral-Verdugo [10], who researched the direct and indirect effects produced by several variables (demographic, situational, and dispositional factors) on reuse and recycling behaviors in a group of Mexican families. By using structural models, he found that conservation competencies and motives to reuse/recycle were the most important direct predictors. Subsequently, Corral-Verdugo and Armendariz [11] studied the environmental beliefs of a Mexican community by assessing and comparing two scales with opposing views traditionally used to measure environmental beliefs: the New Environmental Paradigm (NEP—in this view, human beings are part of the natural world and are governed by the same rules as the rest of nature) and the Human Exception Paradigm (HEP—in this view, humans are conceived as being superior and apart from nature). Their results suggest that the community was more committed to preserving the environment (NEP view) than to a utilitarian view of nature (HEP view).
Other sets of studies have been conducted with Chilean populations. Menzel and Bögeholz [12] researched the level of commitment among Chilean and German teenagers to preserve biodiversity. Using a regression analysis, they reported that the personal norms variable was the best predictor of environmental behavior. Cordano et al. [13] compared the three main theories of pro-environmental behavior (the Theory of Reasoned Action, the Norm-Activation Theory, and the Value-Belief-Norm Theory) and cultural differences among business students in Chile and the United States. Through a regression analysis, they found that each theory was able to account for a significant level of variation in behavioral intention (R2 values between 0.50 and 0.55) and that the norms variable recorded the strongest relationship with behavioral intention.
The paragraphs above help to illustrate the lack of studies conducted in Latin America focusing on understanding the environmental attitudes and behaviors of its citizens. Considering the cultural differences, this lack of studies could condition the success or failure of future local policies and programs focused on achieving more environmentally responsible societies; achieving a more detailed understanding of why individuals undertake pro-environmental behaviors is important for policy makers and researchers seeking solutions to environmental problems that require behavioral change [14].
In order to fill this gap, the purpose of this research was to study the environmental behaviors of a Latin American community and identify the factors that determine them.

1.2. Attitudinal Factors Influencing Environmental Behaviors

Several studies have researched the factors that influence environmental behavior, using different theoretical models that seek to explain and predict people’s pro-environmental behavior. These theories are concerned with the ability to understand environmental behavior via a causal model. According to Stern [15], there are four kinds of causal variables that influence environmental behavior: attitudinal factors (which include norms, beliefs and values), contextual forces, personal capacities, and the habits and routines of each subject. Among the most accepted theories that analyze the different attitudinal variables influencing environmental behavior we find the Theory of Planned Behavior (TPB) and the Value-Belief-Norm (VBN) Theory. Proposed by Ajzen [16], the TPB is based on the assumption that individuals make rational decisions and choose options they perceive as having the most benefits and fewer costs. As such, this theory proposes that an individual’s behavior is directly explained by behavioral intention, which is in turn influenced by three variables: attitude, subjective norms and perceived behavioral control. The latter also directly affects the individual’s behavior.
The TPB has been successfully used to understand various behaviors: understanding the use of public transport [17], modeling the changes in modes of transport after an intervention [18], predicting the behavior of speeding drivers [19], and explaining environmental behavior [20], among others.
Although this theory has successfully predicted a broad variety of behavioral outcomes, it has also been criticized for failing to incorporate moral judgments [20,21].
On the other hand, the VBN model, shown in Figure 1, is based on the assumption that individuals adopt a pro-environmental attitude if they perceive a moral obligation to protect themselves, other members of society, or the ecosystem in general [22]. The VBN model was proposed by Stern [23] to evaluate the pro-environmental behavior of individuals by linking the Norm-Activation Model with the New Ecological Paradigm (NEP) proposed by Dunlap and Van Liere [24]. The model proposes that personal values influence the development of the general beliefs held by an individual regarding the environment (NEP). These beliefs cause the individual to be aware of the consequences that their behavior could unleash on the environment, as well as accept some level of responsibility (see Figure 1). This cognitive process would trigger the activation of a sense of moral obligation (personal norms) to protect the environment. Thus, this final variable in the model activates pro-environmental behavior [25]. According to Stern [15], personal values related to the environment fall within a three-tiered classification: biospheric, social/altruistic and egoistic.
Figure 1. VBN model for environmental behavior [15,23].
Sustainability 07 14133 g001
The VBN model has been successfully applied to explain recycling behavior [26], explain the willingness to pay for a suburban park [27], evaluate behavior supporting sustainability policies in a multinational pharmaceutical company [28], evaluate land management behavior of property owners and their moral obligation to protect local diversity [29], explain pro-environmental consumption behavior [30] and conservation behavior [20], and to study the variables that promote a commitment to protect biodiversity in young people [12], among others.
One of the environmental behaviors that has been most studied in papers is recycling. Aguilar-Luzón et al. [31] studied glass recycling behavior in a sample of 275 university students. The results showed that the personal norms and altruistic value orientations were the variables that explained the greatest proportion of glass recycling behavior. The VBN model has also proven successful in explaining acceptability decisions. Steg et al. [32] examine the factors that influence the acceptability of energy policies intended to reduce domestic CO2 emissions. The results show that there is a causal chain in the model, in which each variable relates significantly with the following variable.
For purposes of the present study, the VBN model will be used insofar as it incorporates values (altruistic, biospheric, and egoistic), morals (personal norms) and environmental awareness (NEP) as behavioral predictors. Given that the VBN model has been widely studied and validated in specialized literature [12,15,23,26,31,32], it has been hypothesized that the relationships between the variables shown in Figure 1 will be kept unaltered; that is, that the causal chain in the model will remain statistically significant (p < 0.001).

1.3. Socio-Demographic Factors Influencing Environmental Behavior

A breadth of literature has focused on studying the influence of socio-demographic factors on pro-environmental behavior, with the most influential being age, gender, education level and income [21,33,34,35,36].
The relationship between gender and pro-environmental behavior has been studied intensely in recent years. Generally speaking, women demonstrate greater concern for the environment [34,37,38,39,40,41,42]. For example, Hunter et al. [43] concluded that compared to men, women are more committed to pro-environmental behaviors such as recycling, buying organic products and reducing automobile usage. Similarly, Blocker et al. [37] observed that women show greater concern for environmental degradation, are more in favor of rights of living beings, and follow a lifestyle that is more environmentally friendly.
A broad variety of studies have indicated that age is an important predictor of pro-environmental behavior. While some have concluded that older people are more concerned in the environment than younger ones [34,35], others have found that younger people demonstrate a greater sense of obligation to the environment [33,36,44]. For example, Jones et al. [21] concluded that age was the strongest predictor of environmental concern, with young adults as the most interested group. It would seem that the relationship between age and environmental behavior depends on the specific behavior under study. Diekmann et al. [40] found a negative relationship between age and recycling (older people are less willing to participate in recycling activities), but a positive relationship between age and ecological automobile use (older people are more willing to use automobiles less frequently).
The positive relationship between education level and environmental awareness has been widely recorded in specialized literature [21,33,34,35,41,45,46,47,48]. More educated people tend to be more concerned for the environment and more willing to adhere to pro-environmental behaviors.
Studies of the link between income and environmental behavior have led to diverse conclusions. While some investigations have shown that income is negatively related to environmental concern [33], others have concluded that concern grows as income rises [35,48].
Finally, a higher socioeconomic status is associated with high income and more education. As such, socioeconomic status is, in general, positively associated with a higher level of environmental concern. One possible explanation for this relationship is that people with greater resources have already met their basic needs and, as a result, can concentrate on other types of needs [36].

1.4. Overview

At present, the task of protecting the environment is not exclusive of industrialized economies. The social and economic development in Latin American countries has generated societies more concerned about their environment, demanding greater control and regulation. There are, however, few studies conducted in Latin America focused on understanding the environmental behaviors of its citizens. This lack of studies could condition the success or failure of current and future policies, programs and plans focused on achieving more environmentally responsible societies. In order to fill this gap, the main goal of this research was to study the environmental behaviors of a Chilean community and identify its main predictor variables. To this end, a heterogeneous set of environmental behaviors and the factors that determine them—based on the VBN model—will be evaluated.

2. Methods

2.1. Study Area

The investigation focused on inhabitants of Chile’s capital city, Santiago, home to nearly 40% of the national population, of which women make up 51.6% [49]. Santiago is the country’s financial center, with an unemployment rate of 5.7% as of December 2013 [50]. By age cohort, the city’s population is classified as 20.4% between 18 and 29 years old, 21.5% between 30 and 44, 18.5% between 45 and 59, and 14.0% 60 or older.
Santiago’s household distribution based on socioeconomic status (SES) is: 11.1% high SES, 19.5% middle-high SES, 24.9% middle SES, 35.6% middle-low SES and 9% low SES.

2.2. Materials

The survey was divided into three sections. Section 1 comprised all items selected to measure environmental behaviors. These measures of environmental behavior were selected through a series of focus groups with experts employed in the various departments of the Chile’s Ministry of the Environment, using as starting point the scale developed by Kaiser et al. [51,52]. As a result, six environmental behavior subscales (EBS) were identified as priorities: power conservation, ecologically-aware consumer behavior, biodiversity protection, water conservation, rational automobile use, and ecological waste management. Expert panels of ministry employees were convened to determine which items would comprise each subscale. In the end, a total of 34 items were selected (see Table 1): power conservation (7 items), environmentally-aware consumer behavior (5 items), biodiversity protection (4 items), water conservation (5 items), rational automobile use (5 items) and ecological waste management (8 items). Study participants had to rate each item on a five-point Likert scale (1. Never, 2. Rarely, 3. Sometimes, 4. Often, and 5. Always).
The integration of the six subscales makes up the General Ecological Behavior (GEB) Scale.
Table 1. Environmental behavior subscales: reliability (α-Cronbach), means, and Standard Deviations (SD).
Environmental Behavior SubscalesMeanSD
Power Conservation (α = 0.67) (b)
(a) (c)PC1. In winter, I keep the heat at such a temperature that I can wear light clothing inside my house.3.821.35
(a) (c)PC2. In winter, I leave the windows of my house open for long periods of time to air the house.2.551.40
PC3. In winter, I turn off the heat in my house at night.4.540.96
PC4. In winter, when I leave my house for more than 30 min, I turn off the heat.4.530.94
PC5. I make the most use out of natural light.4.660.67
PC6. I turn off any lights I’m not using.4.500.82
(a)PC7. I unplug any electrical appliances I’m not using.3.551.43
Ecologically Aware Consumer Behavior (α = 0.68)
EAC1. I buy biodegradable detergents to wash laundry.3.311.58
EAC2. I buy organic products.2.971.42
EAC3. I buy rechargeable batteries.3.161.54
EAC4. I buy energy-efficient light bulbs.4.141.23
EAC5. I buy products in reusable or returnable containers.3.921.22
Biodiversity Protection (α = 0.56) (d)
(a)BP1. After spending a day outdoors, I leave the site as clean as it was when I got there.4.700.66
BP2. I visit national parks and/or nature reserves.2.901.40
BP3. I take my pet to the veterinarian.3.661.62
(c)BP4. I collect plants, seeds and organic matter when I visit natural areas.3.791.53
Water Conservation (α = 0.63) (b)
WC1. I try to repair leaky faucets quickly.4.420.94
(a) (c)WC2. I leave the water running in the shower until it reaches the proper temperature.2.511.47
WC3. I try to turn off the faucet when I brush my teeth.4.161.18
WC4. I wait until I have a full load of laundry before putting it in the washing machine.4.361.01
WC5. I try to take short showers (less than 5 min).3.581.40
Rational Automobile Use (α = 0.46) (d)
RAU1. To travel short distances (less than 10 blocks), I prefer to walk or use a bike.3.971.37
(a)RAU2. I share a car.3.351.57
RAU3. I drive in such a way to minimize the amount of gas I consume.4.081.17
RAU4. I refrain from driving a car on days of high pollution levels.3.251.56
(a) (c)RAU5. I honk the horn when I drive.3.601.29
Ecological Waste Management (α = 0.88) (b)
(a)EWM1. When I go shopping, I use cloth instead of plastic bags.2.551.54
(a)EWM2. I reuse plastic bags (from the supermarket).4.241.19
EWM3. I sort leftover food to make compost.1.581.32
EWM4. I sort papers and cardboard for recycling.2.171.69
EWM5. I sort soda cans for recycling.1.971.60
EWM6. I sort glass containers for recycling.2.261.75
EWM7. I sort batteries for recycling.1.831.51
EWM8. I sort electrical/electronic appliances for recycling.1.941.59
(a) Removed items to improve reliability. (b) The α-Cronbach coefficient was calculated using raw data and does not include the items that were omitted. (c) Negatively formulated items were re-coded as inverse responses. (d) Subscale omitted for the SEM analysis.
Section 2 was designed to measure the five attitudinal variables of the VBN model (see Table 2). Personal values (PV) were measured through 7 items adapted from Schwartz [53]. The participants were presented with the following statement: “The next section will present several brief characterizations that describe certain personal value traits. In your view, how much does each of these represent you?” After this introduction, the participants had to rate each item using the following scale: “1. Not at all like me, 2. Not like me, 3. Neutral, 4. Like me, 5. Very much like me”.
Table 2. Predictor Variables: Reliability (α-Cronbach), Means, Standard Deviations (SD), Unstandardized Regression Weights (B) and Standardized Regression Weights (β).
Predictor VariablesMeanSDBβ
Biospheric Values (α = 0.79)0.220.30 ***
PV1. A person who believes that everyone must look after the environment.4.430.921.000.77 ***
PV2. A person who respects the environment and believes that we should live in harmony with other living beings.4.520.780.940.86 ***
Altruistic Values (α = 0.70) 0.04 n.s.0.06 n.s.
PV3. A person who believes it is important to help others around them.4.500.771.000.88 ***
PV4. A person who believes in the fair treatment of all people, including persons who are unknown to them.4.390.910.840.62 ***
Egoistic Values (α = 0.70) −0.18−0.26 ***
PV5. A person who makes decisions and likes to be a leader.3.281.351.000.55 ***
PV6. A person who believes it is important to have a lot of money.2.551.311.230.70 ***
PV7. A person who believes it is important to have influence over people and their actions.2.841.391.410.76 ***
Ecological Vision (α = 0.64) (b)0.310.57 ***
NEP1. In recent times, the human population has grown at a faster rate than the planet can support.4.251.091.000.47 ***
NEP2. The earth has limited resources and space (e.g., like a space ship).4.131.230.640.27 ***
(a)NEP3. Human beings have the right to modify the environment as fits their needs.3.131.52----
NEP4. Plants and animals have the same right to life as human beings.4.311.081.130.54 ***
(a)NEP5. Nature is sufficiently strong to support the impacts produced as a result of modern life.2.631.45----
NEP6. The balance of nature is very fragile and easily disrupted.4.261.051.240.60 ***
(a)NEP7. Most environmental problems can be solved through the application of more and better technology.3.591.39----
(a)NEP8. Human beings will learn enough about how nature works to be able to control it.3.121.43----
(a)NEP9. Environmental degradation is not as bad as people normally say it is.1.961.31----
NEP10. If things continue on the current path, we will soon experience a major natural disaster.4.141.201.290.56 ***
Awareness of Consequences (α = 0.81) (b) 0.970.80 ***
AC1. Protecting the environment benefits everyone.4.850.481.250.75 ***
AC2. Protecting the environment will help to improve the quality of life for everyone.4.830.481.380.83 ***
AC3. Protecting the environment will create a better world for me and my family.4.820.491.290.85 ***
AC4. Degradation of the environment directly affects my health (e.g., air pollution).4.740.651.000.51 ***
(a)AC5. Environmental degradation caused in my neighborhood will often affect people in other parts of the world.4.171.20----
(a)AC6. In the next 10 years, thousands of animal and plant species will go extinct.4.321.06----
Ascription of Responsibility (α = 0.60) (b) 0.510.85 ***
AR1. Every person is responsible for protecting the environment.4.750.681.000.57 ***
AR2. The government bears the most responsibility for protecting the environment.4.251.250.220.07 *
AR3. Corporations bear the most responsibility for reducing environmental degradation.4.660.840.450.21 ***
AR4. My household is responsible for reducing environmental degradation.4.500.911.040.45 ***
AR5. All households are responsible for reducing environmental degradation.4.670.720.960.53 ***
(a)AR6. I am unwilling to cooperate to reduce environmental degradation if others do not do same.1.881.39----
Personal Norms (α = 0.70) 0.900.48 ***
PN1. I have a moral obligation to protect the environment.4.560.842.160.62 ***
PN2. Environmental problems cannot be ignored.4.810.531.650.75 ***
PN3. I think it is important that people protect the environment.4.860.431.400.77 ***
PN4. The government should require greater environmental protections.4.810.570.910.38 ***
PN5. Corporations should reduce their impact in degrading the environment.4.850.531.000.45 ***
(a) Removed items to improve reliability. (b) The α-Cronbach coefficients was calculated using raw data and do not include the items that were omitted. *** p < 0.001, ** p < 0.01, * p < 0.05. n.s., non-significant p-value (p > 0.05).
For the remaining attitudinal variables, study participants indicated their level of agreement with each statement using the following scale: “1. Completely disagree, 2. Slightly disagree, 3. Neither agree nor disagree, 4. Slightly agree, 5. Completely agree.” In this manner, ecological view (NEP) was measured with 10 items selected from Dunlap et al. [54] awareness of consequences (AC) with 6 items adapted from Stern et al., ascribed responsibility (AR) with 5 items and personal norms (PN) with 5 items, each taken from Gärling et al. [55]. Finally, Section 3 included questions related to the participants’ socioeconomic and demographic traits.

2.3. Procedure and Participants

To check that the scales were comprehensible, the study team organized two focus groups comprised of eight non-expert citizens. Subsequently, the survey underwent a pilot test to evaluate the reliability of the scales. A total of 154 people from the different socioeconomic statuses under study participated in the pilot survey, which they completed in 25 min on average. The average age of the trial sample was 48 years old (SD = 18 years), and 66% were women. The results allowed the study team to validate the various measurements and to correct several items that were confusing to participants.
Between September and November of 2013, the final survey was implemented for a statistically representative sample of Santiago, stratified according to socioeconomic status and age. A three-stage stratified random sample was created based on the sampling framework of the 2002 housing and population census provided by the National Institute of Statistics of Chile. The first stage considered the random selection of geographic clusters (housing blocks) by block code inside each socio-economic stratum. In the second stage households were selected using the Kish table and then systematic sampling. The third stage involved the selection of people on the basis of a quota system (to allow variability of age). Finally, in order to correct for design effects, weights based on the 2013 population projections for each city were applied to final data. A group of interviewers, mostly undergraduate students, contacted a total of 1,571 voluntary participants, who had to complete a paper questionnaire face to face at their homes (receiving no compensation of any form), with a non-response rate of 19%. Each item was examined using frequency analysis with the aim of identifying possible erroneous data entries and missing data. Likewise, an exploratory data analysis and box-plots were carried out to identify possible outliers. After these analyses, a total of 34 cases were excluded from the database, leaving a total of 1,537 valid cases. The average age of the final sample was 44 years old (SD = 17 years, with a range of 18–80), and 62% were women. The sample was homogenously distributed among the four socioeconomic statuses [56] (25% high SES, 25% middle-high SES, 25% middle SES, and 25% middle-low SES).

2.4. Data Analysis

Internal Consistency Analysis. The internal consistency of each scale was checked by using two measures—Cronbach’s alpha (α-Cronbach) and the corrected item-to-total correlation. For the former, the suggested value for a highly consistent scale is anything above 0.7; for the corrected item-to-total correlation, anything above 0.3 is the suggested value [34]. Values for the corrected item-to-total correlation below the cutoff value mean that an item has no correlation with the scale and should therefore be omitted. Only the raw data for the selected items was used to calculate Cronbach’s alpha.
Structural Equation Model. For this analysis, the missing values were handled by mean substitution (non-stochastic imputation method). Using the IBM SPSS AMOS 18.0 software, a structural equation model was created to estimate the VBN model’s predictive power. The average of the items that make up each subscale was calculated to include the subscales of the GEB scale in the model; omitted items were not considered.
The model’s fit was evaluated using the following indexes: chi-square test (χ2), robustness of mean square error approximation (RMSEA), comparative fix index (CFI), Tucker-Lewis index (TLI) and normed fit index (NFI). According to Hair et al. [57], the RMSEA index must be lower than 0.05 for a good fit, but values of up to 0.1 may be accepted as they indicate a moderate fit. For the CFI, values above 0.95 indicate an excellent fit, although values as low as 0.8 are acceptable. Values close to 0.90–0.95 of the TLI and NFI indices indicate a very good fit of the model [58]. The proportion of variance explained by each model was measured using the Squared Multiple Correlations (R2SMC).
Socio-demographic Variables. Survey results were studied based on gender, age group and socioeconomic status. Gender-based differences were analyzed using the t-test of mean difference for independent samples. Meanwhile, differences by age group and socioeconomic status were analyzed using Tukey’s test.

3. Results

3.1. Internal Consistency Analysis

After the internal consistency analysis using the α-Cronbach coefficient and the corrected item-to-total correlation analysis, the subscales biodiversity protection and rational automobile use did not achieve acceptable reliability values, and as such were not considered in this study.
Three items from power conservation, one from water conservation and two from ecological waste management were eliminated to improve reliability. Regarding the VBN model scales, five items from the NEP scale, two items from the AC scale, and one item from the AR scale were omitted to improve reliability. Finally, all the scales showed reliability close to or above 0.7. Table 1 and Table 2 show, respectively, the reliability indices for the six environmental behavior subscales and the VBN model variables (PV, NEP, AC, AR, and PN).

3.2. Descriptive Results

Table 1 shows the mean values for each EBS item. The highest average scores of environmental behavior were related to water and power conservation. A similar situation was observed for the activities related to ecologically aware consumer behavior, particularly for the use of efficient, low-energy light bulbs and returnable or reusable containers. However, the ecological waste management subscale showed the lowest mean values.
The mean values obtained for each of the items in the VBN model are shown in Table 2. Participants stated that they felt better represented by biospheric and altruistic values than by egoistic values. On the other hand, participants expressed pro-environment ecological views, mainly regarding the same right to life of humans and animals, the existence of limited resources on the planet and the fragility of the balance of nature. The results also show that the participants have a high level of awareness of consequences and a high degree of attribution of responsibility for protecting the environment to government, companies, society and individuals. Lastly, the high mean values of personal norms suggest the existence of a profound feeling of moral responsibility to protect the environment.
Table 3 shows the averages and standard deviations obtained for each EBS when the sample is stratified by gender, socioeconomic status and age group. For water and power conservation, although the scores were high among all age groups, the behavior of younger subjects proved to be less conservation-oriented. In addition, the relationship between SES and water and power conservation showed an inverted U-shaped curve. This implies that people belonging to middle and middle-high SES are more conservation-oriented than those from the lowest and higher SES. Any statistically significant difference was not observed at gender level.
With regard to ecologically aware consumer behavior, people older than 30 and belonging to the highest SES were more prone to consuming environmentally-friendly products. Our results indicate that, although the mean scores obtained for ecological waste management were quite low, as a person’s socioeconomic status and age group increased, they showed more willingness to sort and recycle their garbage. The relationship between SES and earlier behaviors showed a monotonically enhancing curve. In other words, the higher the socioeconomic status, the greater the tendency for buying environmentally friendly products and waste disposal.
Table 3. Means (and standard deviations) for each Environmental Behavior Subscale (EBS) when sample is stratified at socio-demographic level.
Socio-demographic VariableEnvironmental Behavior Subscales
EBSPCEBSEACEBSWCEBSEWM
Gender
Male4.53(0.65)3.49(0.93)4.13(0.78)1.91(1.17)
Female4.58(0.57)3.52(0.92)4.12(0.80)2.01(1.27)
Socio-Economic Status (SES)
High4.51 b,c(0.61)3.57 a(0.92)4.07 a(0.77)2.12 a(1.34)
Middle-High4.66 a(0.48)3.58 a(0.92)4.24 b(0.82)2.05 a(1.26)
Middle4.59 a,b(0.58)3.53 a(0.92)4.14 a,b(0.84)1.93 a,b(1.19)
Middle-Low4.48 c(0.71)3.33 b(0.90)4.04 a(0.74)1.78 b(1.10)
Age group
18–294.52 a(0.60)3.39 a(0.87)3.93 a(0.75)1.84 a,b(1.11)
30–444.52 a(0.64)3.53 a,b(0.93)4.07 a,b(0.79)1.81 a(1.16)
45–594.57 a,b(0.56)3.58 b(0.92)4.17 b,c(0.80)2.06 b,c(1.31)
60+4.67 b(0.59)3.54 a,b(0.95)4.37 c(0.79)2.27 c(1.31)
Mean values reported here were computed averaging mean values of each item that comprises the respective subscale. Read by column (environmental behavior subscale), for each socio-demographic variable, the mean values with different letters are significantly different at the p < 0.05 level (Tukey HSD). PC = Power Conservation; EAC = Ecologically Aware Consumer Behavior; BP = Biodiversity Protection; WC = Water Conservation; RAU = Rational automobile use; EWM = Ecological Waste Management.

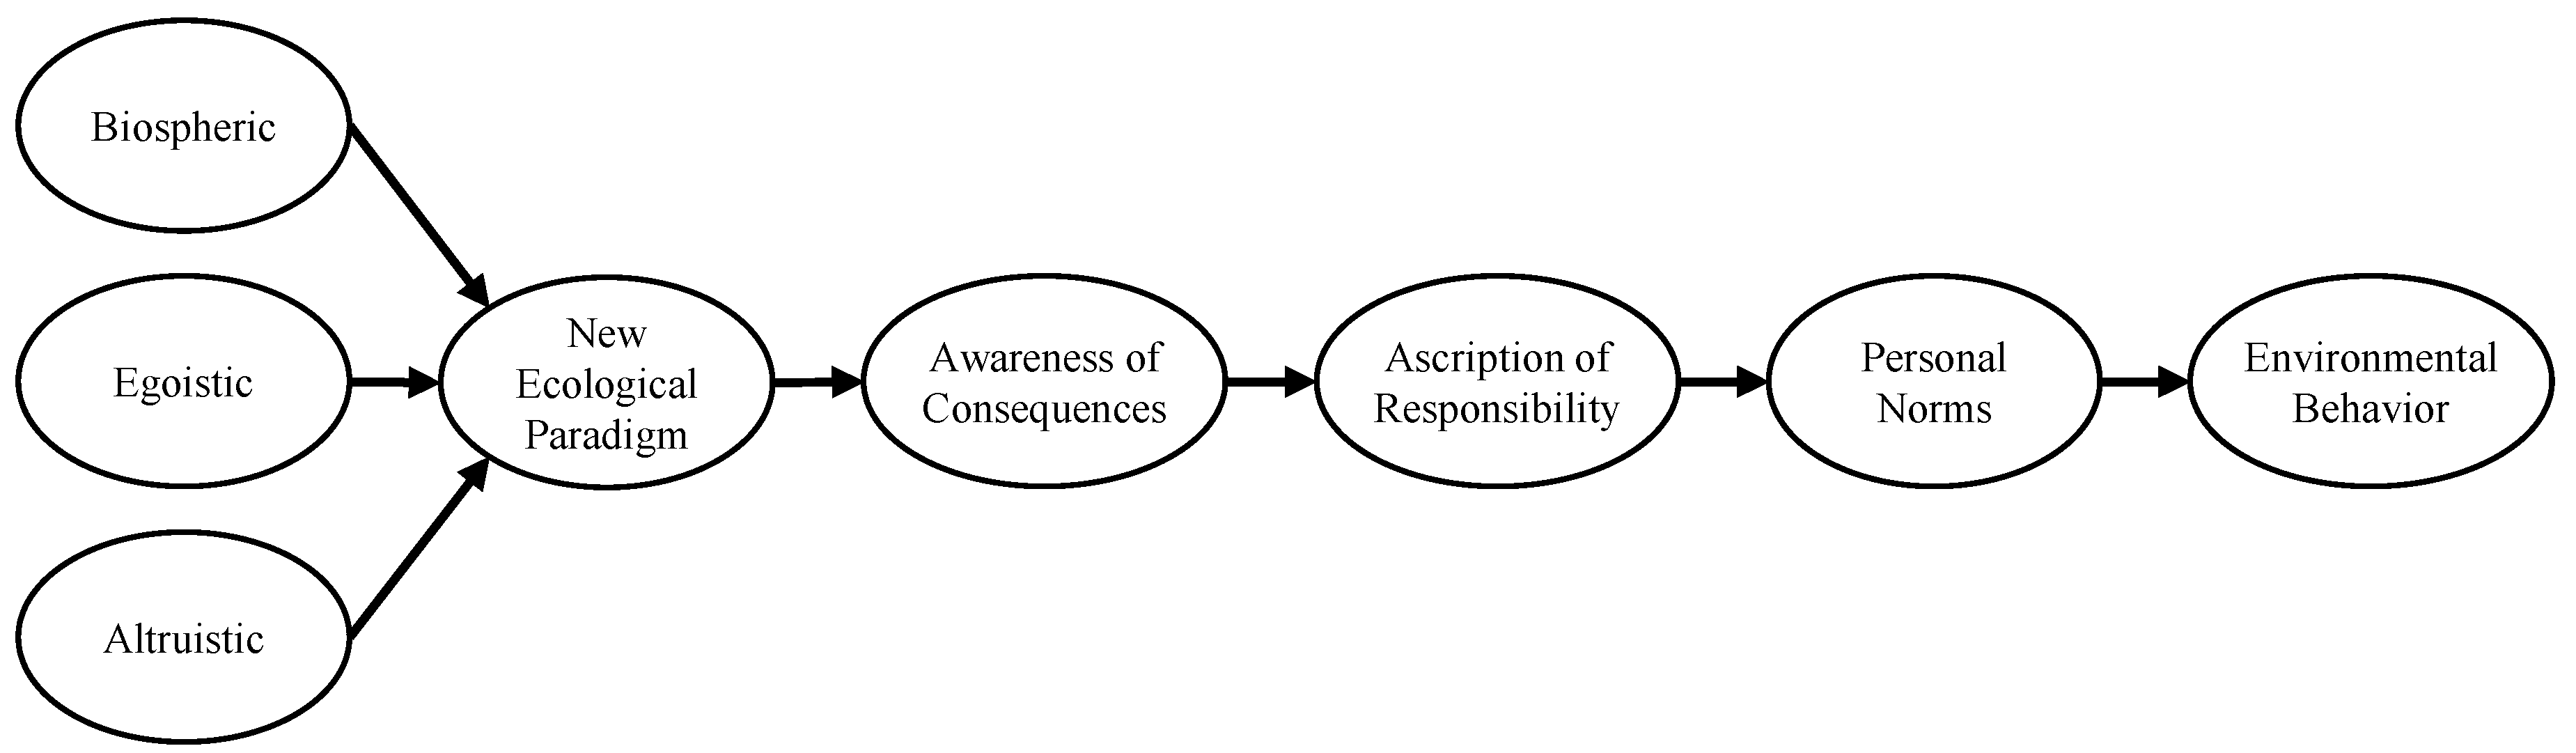
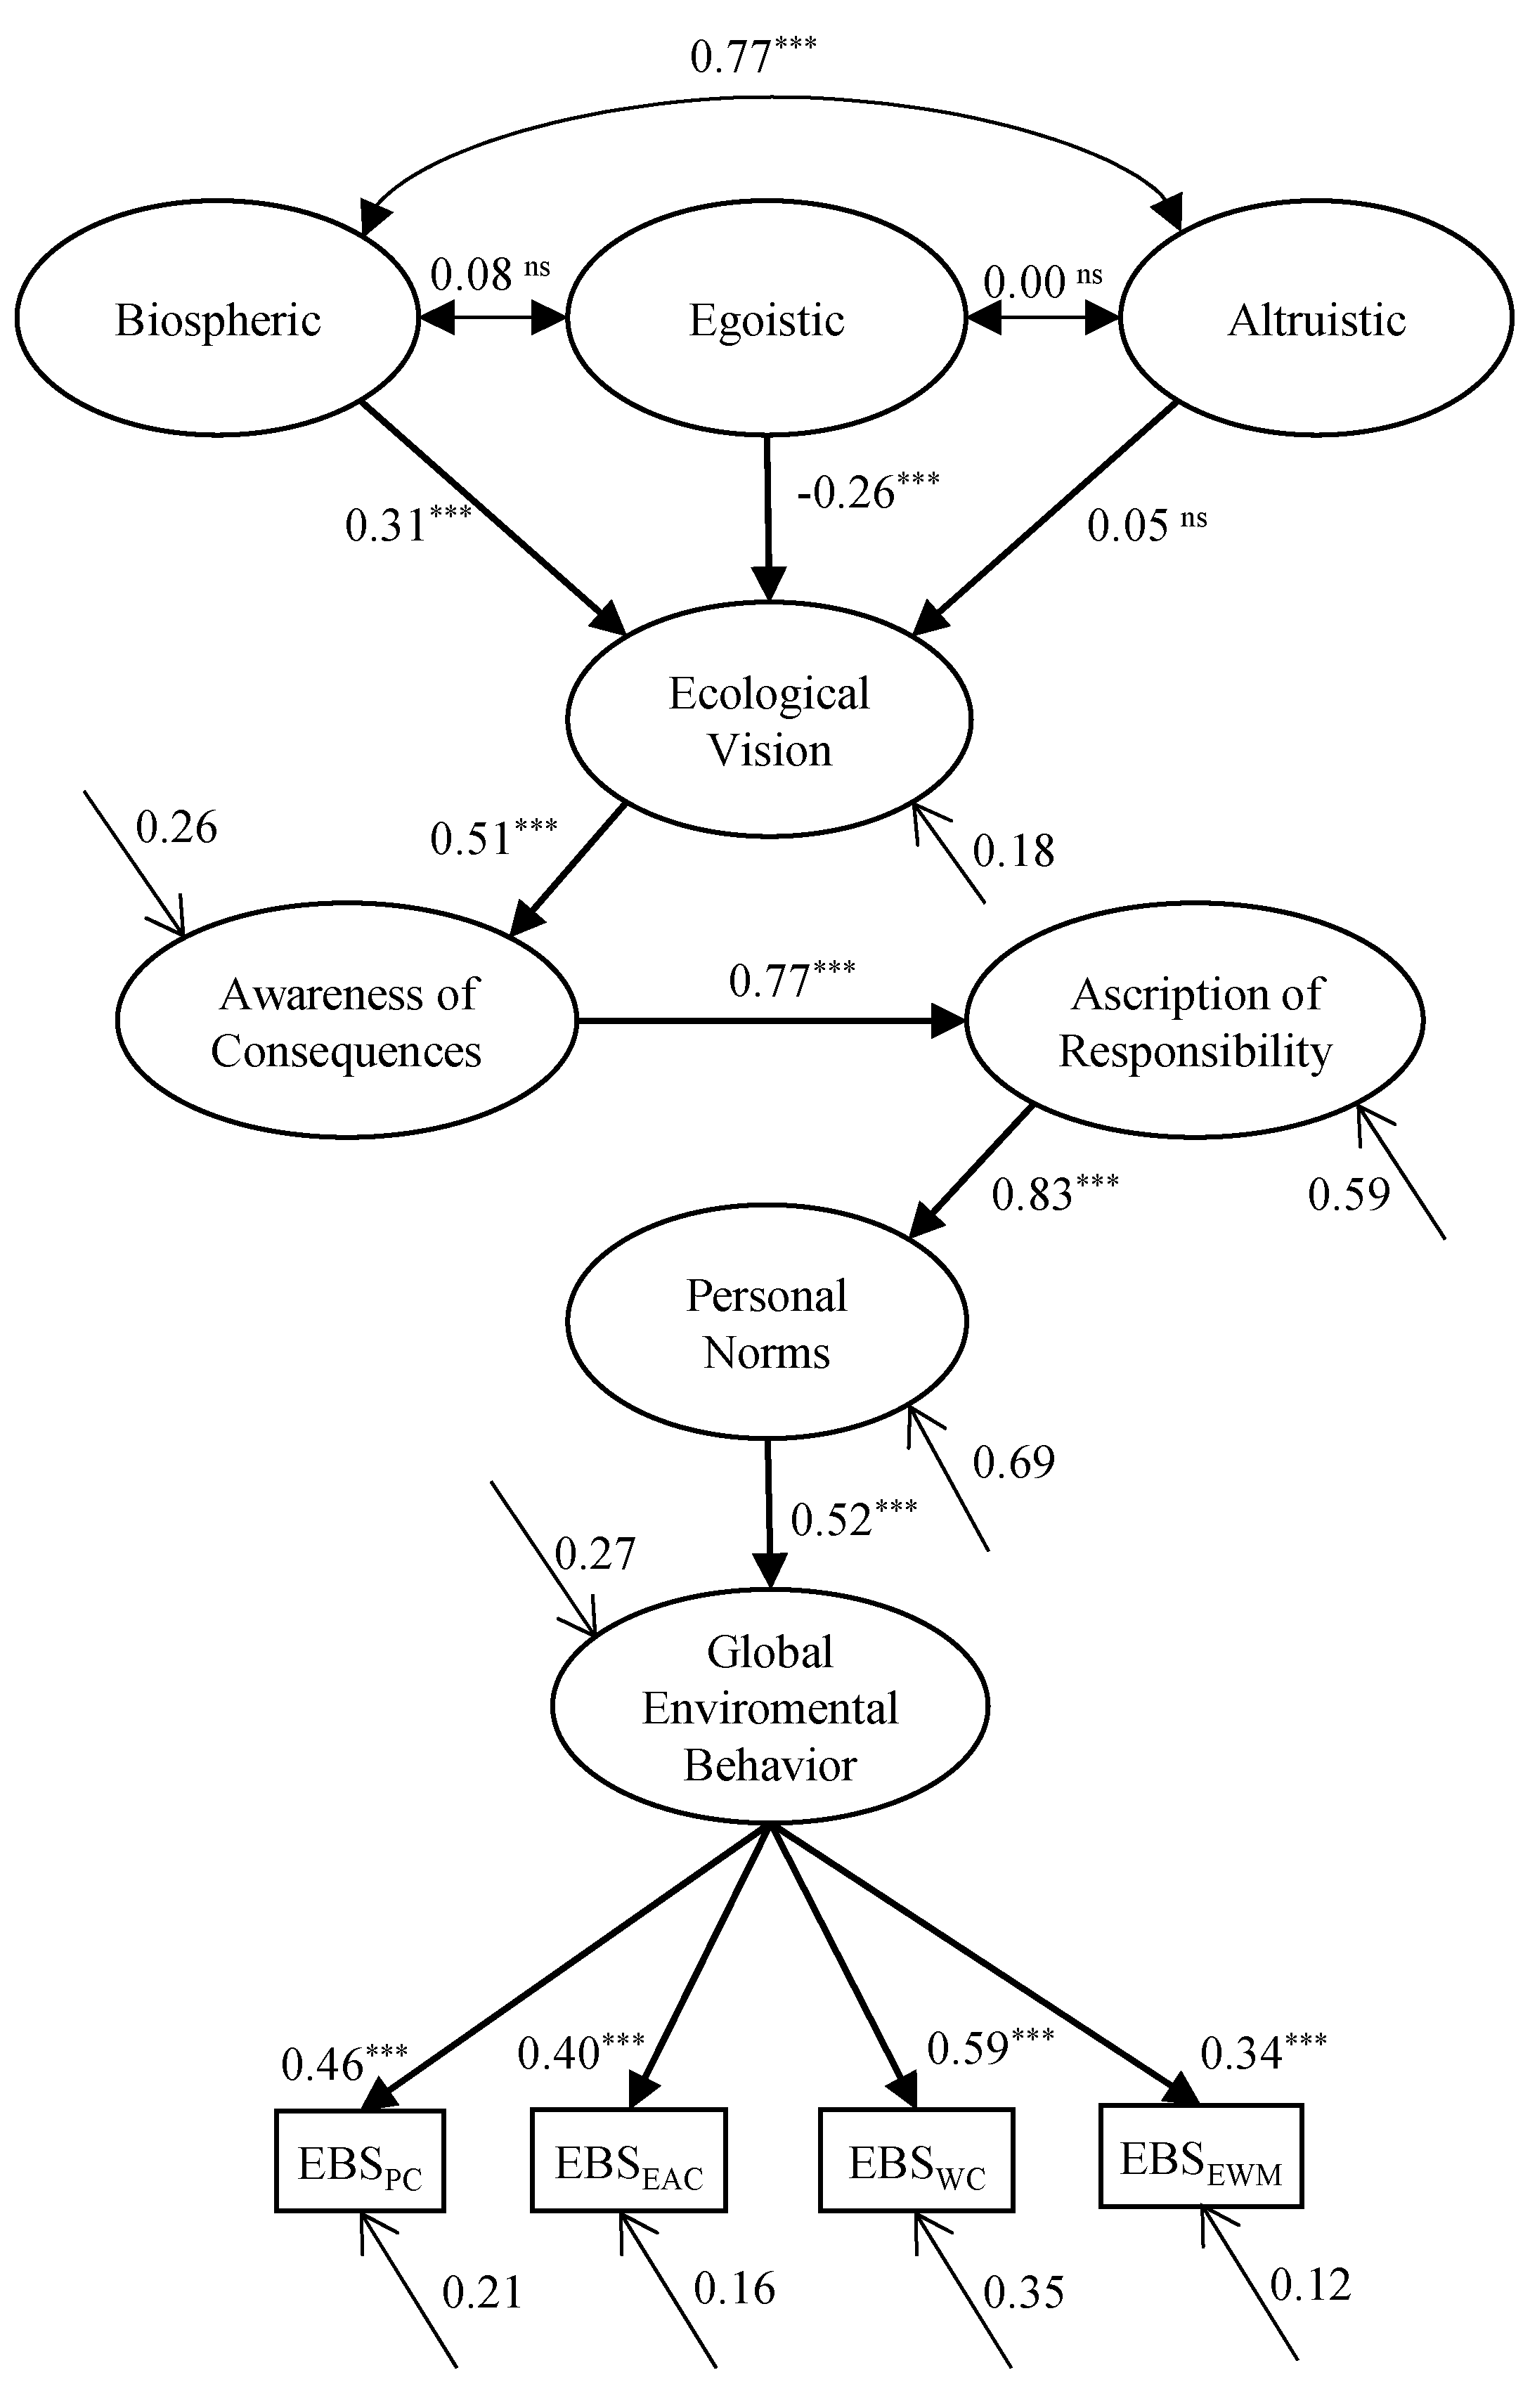
3.3. Structural Equation Model

For the GEB scale and VBN model items, missing values were less than 2% of total data. The items with higher missing values percentage were deleted in the internal consistency analysis.
The standardized and unstandardized regression values of the VBN model are displayed in the final columns of Table 2. The initial model did not produce satisfactory fit indexes (χ2 = 2852.63; df = 395; χ2/df = 7.22; RMSEA = 0.064; CFI = 0.81; TLI = 0.79 NFI = 0.79). The modification indexes suggested the incorporation of six covariance errors related to the following items: NEP1–NEP2; AR2–AR3; AR3–AR4; AR4–AR5; PN4–PN5 y AR2–PN4. After applying these relationships, the model’s global fit improved significantly (Δχ2 = 1019.53; χ2/df = 4.71; RMSEA = 0.049; CFI = 0.89; TLI = 0.88; NFI = 0.87). Figure 2 shows the resulting VBN model.
Figure 2. VBN model for environmental behaviors. Two-headed arrows indicate Pearson correlation coefficients. Arrows are used for the direct relationships between constructs. β coefficients (i.e., standardized multiple regression coefficients) represent their strength. Arrows without origin indicate proportions of error and unexplained variances. *** p < 0.001. n.s., non-significant p-value (p > 0.001). PC = Power Conservation; EAC = Ecologically Aware Consumer Behavior; WC = Water Conservation; EWM = Ecological Waste Management.
Sustainability 07 14133 g002
The causal relationships hypothesized in the VBN model were successfully validated in this study. The only exception was the causal relationship between altruistic values and the NEP. Our results indicate that the EBS are positively related to biospheric values and negatively related to egoistic values.
The Squared Multiple Correlations (R2SMC) values, shown by the arrows without origin in the Figure 2, indicate that PN explains 27% of the variance of GEB, AR explains 69% of the variance of PN, AC explains 59% of the variance of AR, NEP explains 25% of the variance of AC, and values (PV) explain 18% of the variance of NEP.
In a similar fashion, the model was able to explain respective variances of 21%, 16%, 35%, and 12% in the environmental behaviors for power conservation, ecologically aware consumer behavior, water conservation and ecological waste management.

4. Discussions

Generally speaking, a large share of the population studied displayed tendencies that highly favor sustaining more responsible environmental behavior. This is reflected in the fact that study participants expressed heightened environmental concern, demonstrating their ample awareness of the consequences of failing to protect the environment. Furthermore, a majority acknowledged the responsibility of the government, corporations, society and their own households, revealing a heightened sense of moral obligation to protect the environment. In line with the results of previous studies [35,36], this trend became particularly accentuated with the age of the participant; in other words, in older subjects, expectations for pro-environmental behavior are greater.
To a large extent our results support the hypothesis of a causal chain between the variables of the VBN model. However, it was observed that the relationship between the altruist values and the NEP were not significant. This result is consistent with that found by Nordlund and Garvill [25] and Steg et al. [32]. The latter proposed that concern for the wellbeing of others was unrelated to the NEP, and that biospheric values would be more important in stimulating pro-environmental behavior than altruistic values. This implies that it is important to make a distinction between biospheric and altruistic values, as postulated by Stern [15].
Our results indicated that the VBN model explained particularly well the EBS’s for power and water conservation. That said, the model’s explanatory power is weak for behaviors related to ecologically aware consumer behavior and ecological waste management. These results are consistent with previous studies [26,30,31]. One possible explanation for this trend was proposed by Steg and Vlek [22], who argued that “… the VBN theory appeared to be successful in explaining low-cost environmental behavior and ‘good intentions’ such as willingness to change behavior, political behavior, environmental citizenship, or policy acceptability, but they appear to have far less explanatory power in situations characterized by high behavioral costs or strong constraints on behavior, such as reducing car use….”. Our results empirically corroborate their assertion.
Based on our results, we were able to observe that variables such as personal norms explain an important part of pro-environmental behaviors. It is therefore essential that environmental education policies are designed to create non-monetary incentives to favor proper behaviors, highlighting the importance of individual responsibility.

Environmental Behavior Subscales

The highest average scores of environmental behavior were related to low cost behaviors and those that imposed the fewest behavioral restrictions. Such was the case for behaviors related to water and power conservation, as these activities also resulted in reduced household spending and did not imply a major change to the lifestyles of the subjects. A similar situation was observed for the activities related to ecologically aware consumer behavior, particularly for the use of efficient, low-energy light bulbs and returnable or reusable containers. Consistent with previous studies [21,34,35], we concluded that the younger the subjects, the lower their behavior for conservation and ecologically aware consumption.
Participants indicated that ecological waste management (how often they sort their garbage for recycling) was a substantially less common pro-environmental behavior. Various factors could explain these results. First, recycling activities entail significant changes to people’s habits and routines, which in turn imply a conscious effort on their part to give up old customs and develop new habits. This could constitute barrier to adopting a pro-environmental behavior if there is a lack of sufficient motivation to break those habits [25]. Second, there are several contextual factors (community expectations, government regulations, monetary incentives, available technology, available infrastructure, etc.) that may significantly affect environmental behaviors [15]. The lack of proper infrastructure to collect and/or dispose of waste sorted at home, or a municipal collection system that makes no distinctions among the waste it collects (mixing garbage that has already been sorted at home) could be a few reasons for the low level of this environmental behavior. A third explanation could be the personal capabilities of the population being studied [15]. It is possible that the population lacks sufficient knowledge of what recycling is, how to sort waste at home, or where to dispose of it. A fourth explanation may lie in the fact that there are no evident financial savings or incentives for pro-recycling behaviors that trigger behavioral change, whereas they exist for water and power conservation behaviors. All of these factors should be addressed prior to developing and implementing any future plans or government programs aimed at fostering recycling among households. Based on the above, the authors hypothesize that contextual factors—specifically the lack of a national policy to manage recycling of household waste and the limited access to recycling points—may have a significant impact on the ecological waste management behavior of the Chilean community.
Additional incentives may be necessary to foster changes to the current behavioral patterns related to waste management. One option would be to introduce tax schemes or subsidies to internalize the economic variable in the individual cost-benefit analysis. It is worth noting that Chile’s legislature is currently debating a bill that would implement a deposit-refund system to incentivize responsible waste management [59]. In addition, the same bill would introduce an extended producer responsibility mechanism for waste management, which would entail incentives from the industries themselves to encourage sorting at source. These policies would provide an additional economic stimulus to households that do not sort their waste, which would help to improve the environmental behavior component.
In global terms, we concluded that the youngest subjects in the lowest socioeconomic group obtained the lowest scores across the EBSs. Based on the review conducted by Van Liere y Dunlap [36], young people are passing through a period of emotional and social changes that tend to affect their lives in general; therefore, their priorities are more closely related to their age.
On the other hand, our results indicate that the higher the socioeconomic status, the higher the tendency to engage with high costs behaviors [35,48], as observed in ecological waste management and the ecologically aware consumer. This result could be explained by the fact that higher socioeconomic statuses are associated with higher income and education level, which could entail more willingness to buy environmentally friendly products and commit into deeper changes in household garbage disposal. Additionally, because they have access to fewer economic resources, these young people are likely more concerned with meeting basic needs, which would prevent them for devoting more attention to environmental issues [36].
In general, people in the lowest socioeconomic groups showed a tendency for less favorable environmental behaviors, a similar result to Cottrell’s [33].
We expect that the information provided in this study will be useful for the authorities, encouraging a more responsible and friendly society toward the environment.

5. Limitations of the Study

Some limitations of the present study should be pointed out. First, the sample is representative only for Santiago’s residents; thus, it does not reflect the societal and demographic structure of the entire Chilean population. Further analysis must be performed in order to account for the cultural, geographical and climatological differences, which should incorporate other cities in the country. In addition, it is worth noting that the present study was based on self-reporting. Although this method is widely used, its results should be validated with external data, i.e., census data. Unfortunately, this data was not available at the time of the study.

6. Conclusions

Based on our results, we conclude that the VBN model explained particularly well the EBS’s for power and water conservation. Nevertheless, the model’s explanatory power was weak for behaviors related to ecologically aware consumer behavior and ecological waste management.
The highest average scores of environmental behavior were related to low cost behaviors and those that imposed the fewest behavioral restrictions. Such was the case for behaviors related to water and power conservation, as these activities also resulted in reduced household spending and did not imply a major change to the lifestyles of the subjects. As a final point, the youngest subjects in the lowest socioeconomic group obtained the lowest scores across the pro-environmental behavior spectrum.

Acknowledgments

We thank the employees of the Chilean Ministry of the Environment, particularly the staff of the research division’s environmental statistics and information departments, for the time and effort they kindly contributed to this project. This research was funded by Chile’s Ministry of the Environment and partially funded by Chile’s Conicyt program through the National Fund for Scientific and Technological Research (Fondecyt, grant 1130864), and by the National Research Center for Integrated Natural Disaster Management CONICYT/FONDAP/15110017.

Author Contributions

The manuscript was collaboratively written by Nicolás C. Bronfman, Pamela C. Cisternas, Esperanza López-Vázquez and Cristóbal de la Maza, who analyzed the data and contributed in discussing the results of the present study. Juan Carlos Oyanedel contributed with sample design and survey implementation. Nicolás C. Bronfman, Cristóbal de la Maza and Pamela C. Cisternas designed and validated the survey. All authors of this paper have read and approved the final submitted version.

Conflicts of Interest

The authors declare no conflict of interest.

References and Notes

  1. Buttel, F.H. Environmentalization: Origins, Processes, and Implications for Rural Social Change1. Rural Sociol. 1992, 57, 1–27. [Google Scholar]
  2. Brechin, S.R.; Kempton, W. Global environmentalism: A challenge to the postmaterialism thesis? Soc. Sci. Q. 1994, 75, 245–269. [Google Scholar]
  3. Schultz, P.W.; Zelezny, L.C. Values as predictors of environmental attitudes: Evidence for consistency across 14 countries. J. Environ. Psychol. 1999, 19, 255–265. [Google Scholar] [CrossRef]
  4. Dunlap, R.E.; Mertig, A.G. Global concern for the environment: Is affluence a prerequisite? J. Soc. Issues 1995, 51, 121–137. [Google Scholar] [CrossRef]
  5. Schultz, P.W.; Unipan, J.B.; Gamba, R.J. Acculturation and ecological worldview among Latino Americans. J. Environ. Educ. 2000, 31, 22–27. [Google Scholar] [CrossRef]
  6. Lynch, B.D. The garden and the sea: US Latino environmental discourses and mainstream environmentalism. Soc. Probl. 1993, 40, 108–124. [Google Scholar] [CrossRef]
  7. Schultz, P.W.; Zelezny, L.C. Values and Proenvironmental Behavior A Five-Country Survey. J. Cross Cult. Psychol. 1998, 29, 540–558. [Google Scholar] [CrossRef]
  8. De Groot, J.I.M.; Steg, L. Value Orientations and Environmental Beliefs in Five Countries Validity of an Instrument to Measure Egoistic, Altruistic and Biospheric Value Orientations. J. Cross-Cult. Psychol. 2007, 38, 318–332. [Google Scholar] [CrossRef]
  9. Milfont, T.L.; Duckitt, J.; Wagner, C. A cross-cultural test of the value-attitude-behavior hierarchy. J. Appl. Soc. Psychol. 2010, 40, 2791–2813. [Google Scholar] [CrossRef]
  10. Corral-Verdugo, V. A structural model of reuse and recycling in Mexico. Environ. Behav. 1996, 28, 665–696. [Google Scholar] [CrossRef]
  11. Corral-Verdugo, V.; Armendariz, L.I. The “new environmental paradigm” in a Mexican community. J. Environ. Educ. 2000, 31, 25–31. [Google Scholar] [CrossRef]
  12. Menzel, S.; Bögeholz, S. Values, beliefs and norms that foster Chilean and German pupils’ commitment to protect biodiversity. Int. J. Environ. Sci. Educ. 2010, 5, 31–49. [Google Scholar]
  13. Cordano, M.; Welcomer, S.; Scherer, R.F.; Pradenas, L.; Parada, V. A Cross-Cultural Assessment of Three Theories of Pro-Environmental Behavior A Comparison Between Business Students of Chile and the United States. Environ. Behav. 2011, 43, 634–657. [Google Scholar] [CrossRef]
  14. Clark, C.F.; Kotchen, M.J.; Moore, M.R. Internal and external influences on pro-environmental behavior: Participation in a green electricity program. J. Environ. Psychol. 2003, 23, 237–246. [Google Scholar] [CrossRef]
  15. Stern, P.C. Toward a coherent theory of environmentally significant behavior. J. Soc. Issues 2000, 56, 407–424. [Google Scholar] [CrossRef]
  16. Ajzen, I. The theory of planned behavior. Organ. Behav. Hum. Decis. Process. 1991, 50, 179–211. [Google Scholar] [CrossRef]
  17. Heath, Y.; Gifford, R. Extending the Theory of Planned Behavior: Predicting the Use of Public Transportation 1. J. Appl. Soc. Psychol. 2006, 32, 2154–2189. [Google Scholar] [CrossRef]
  18. Bamberg, S.; Ajzen, I.; Schmidt, P. Choice of travel mode in the theory of planned behavior: The roles of past behavior, habit, and reasoned action. Basic Appl. Soc. Psychol. 2003, 25, 175–187. [Google Scholar] [CrossRef]
  19. Warner, H.W.; Åberg, L. Drivers’ decision to speed: A study inspired by the theory of planned behavior. Transp. Res. Part F 2006, 9, 427–433. [Google Scholar] [CrossRef]
  20. Kaiser, F.G.; Hübner, G.; Bogner, F.X. Contrasting the Theory of Planned Behavior With the Value-Belief-Norm Model in Explaining Conservation Behavior. J. Appl. Soc. Psychol. 2005, 35, 2150–2170. [Google Scholar] [CrossRef]
  21. Jones, R.E.; Dunlap, R.E. The Social Bases of Environmental Concern: Have They Changed Over Time? Rural Sociol. 1992, 57, 28–47. [Google Scholar]
  22. Steg, L.; Vlek, C. Encouraging pro-environmental behaviour: An integrative review and research agenda. J. Environ. Psychol. 2009, 29, 309–317. [Google Scholar] [CrossRef]
  23. Stern, P.C.; Dietz, T.; Abel, T.D.; Guagnano, G.A.; Kalof, L. A value-belief-norm theory of support for social movements: The case of environmentalism. Hum. Ecol. Rev. 1999, 6, 81–98. [Google Scholar]
  24. Dunlap, R.E.; van Liere, K.D. A proposed measuring instrument and preliminary results: The ‘New Environmental Paradigm’. J. Environ. Educ. 1978, 9, 10–19. [Google Scholar] [CrossRef]
  25. Nordlund, A.M.; Garvill, J. Value structures behind proenvironmental behavior. Environ. Behav. 2002, 34, 740–756. [Google Scholar] [CrossRef]
  26. Aguilar-Luzón, M.C.; García-Martínez, J.M.A.; Monteoliva-Sánchez, A.; de Lecea, J.M.S. El modelo del valor, las normas y las creencias hacia el medio ambiente en la predicción de la conducta ecológica. Medio Ambient. Comport. Hum. 2006, 7, 21–44. (In Spanish) [Google Scholar]
  27. López-Mosquera, N.; Sánchez, M. Theory of Planned Behavior and the Value-Belief-Norm Theory explaining willingness to pay for a suburban park. J. Environ. Manag. 2012, 113, 251–262. [Google Scholar]
  28. Andersson, L.; Shivarajan, S.; Blau, G. Enacting ecological sustainability in the MNC: A test of an adapted value-belief-norm framework. J. Bus. Eth. 2005, 59, 295–305. [Google Scholar] [CrossRef]
  29. Johansson, M.; Rahm, J.; Gyllin, M. Landowners’ Participation in Biodiversity Conservation Examined through the Value-Belief-Norm Theory. Landsc. Res. 2012, 28, 295–311. [Google Scholar] [CrossRef]
  30. Stern, P.C. Information, incentives, and proenvironmental consumer behavior. J. Consum. Policy 1999, 22, 461–478. [Google Scholar] [CrossRef]
  31. Aguilar-Luzón, M.C.; Monteoliva, A.; García, J.M.A. Influencia de las normas, los valores, las creencias ambientales responsables y la conducta pasada sobre la intención de reciclar. Medio Ambient. Comport. Hum.: Rev. Int. Psicol. Ambient. 2005, 6, 23–36. (In Spanish) [Google Scholar]
  32. Steg, L.; Dreijerink, L.; Abrahamse, W. Factors influencing the acceptability of energy policies: A test of VBN theory. J. Environ. Psychol. 2005, 25, 415–425. [Google Scholar] [CrossRef]
  33. Cottrell, S.P. Influence of sociodemographics and environmental attitudes on general responsible environmental behavior among recreational boaters. Environ. Behav. 2003, 35, 347–375. [Google Scholar] [CrossRef]
  34. Raudsepp, M. Some socio-demographic and socio-psychological predictors of environmentalism. TRAMES J. Hum. Soc. Sci. 2001, 5, 355–367. [Google Scholar]
  35. Shen, J.; Saijo, T. Reexamining the relations between socio-demographic characteristics and individual environmental concern: Evidence from Shanghai data. J. Environ. Psychol. 2008, 28, 42–50. [Google Scholar] [CrossRef]
  36. Van Liere, K.D.; Dunlap, R.E. The social bases of environmental concern: A review of hypotheses, explanations and empirical evidence. Public Opin. Q. 1980, 44, 181–197. [Google Scholar] [CrossRef]
  37. Blocker, T.J.; Eckberg, D.L. Gender and environmentalism: Results from the 1993 general social survey. Soc. Sci. Q. 1997, 78, 841–858. [Google Scholar]
  38. Tindall, D.B.; Davies, S.; Mauboules, C. Activism and conservation behavior in an environmental movement: The contradictory effects of gender. Soc. Nat. Resour. 2003, 16, 909–932. [Google Scholar] [CrossRef]
  39. Chen, X.D.; Peterson, M.N.; Hull, V.; Lu, C.T.; Lee, G.D.; Hong, D.Y.; Liu, J.G. Effects of attitudinal and sociodemographic factors on pro-environmental behaviour in urban China. Environ. Conserv. 2011, 38, 45–52. [Google Scholar] [CrossRef]
  40. Diekmann, A.; Preisendörfer, P. Environmental behavior discrepancies between aspirations and reality. Ration. Soc. 1998, 10, 79–102. [Google Scholar] [CrossRef]
  41. Xiao, C.; Hong, D. Gender differences in environmental behaviors in China. Popul. Environ. 2010, 32, 88–104. [Google Scholar] [CrossRef]
  42. Xiao, C.; McCright, A.M. A Test of the Biographical Availability Argument for Gender Differences in Environmental Behaviors. Environ. Behav. 2014, 46, 241–263. [Google Scholar] [CrossRef]
  43. Hunter, L.M.; Hatch, A.; Johnson, A. Cross-National Gender Variation in Environmental Behaviors. Soc. Sci. Q. 2004, 85, 677–694. [Google Scholar] [CrossRef]
  44. Dietz, T.; Stern, P.C.; Guagnano, G.A. Social structural and social psychological bases of environmental concern. Environ. Behav. 1998, 30, 450–471. [Google Scholar] [CrossRef]
  45. Arcury, T.A.; Christianson, E.H. Environmental worldview in response to environmental problems Kentucky 1984 and 1988 compared. Environ. Behav. 1990, 22, 387–407. [Google Scholar] [CrossRef]
  46. Howell, S.E.; Laska, S.B. The Changing Face of the Environmental Coalition A Research Note. Environ. Behav. 1992, 24, 134–144. [Google Scholar] [CrossRef]
  47. Scott, D.; Willits, F.K. Environmental Attitudes and Behavior A Pennsylvania Survey. Environ. Behav. 1994, 26, 239–260. [Google Scholar] [CrossRef]
  48. Poortinga, W.; Steg, L.; Vlek, C. Values, Environmental Concern, and Environmental Behavior A Study into Household Energy Use. Environ. Behav. 2004, 36, 70–93. [Google Scholar] [CrossRef]
  49. Instituto Nacional de Estadísticas. Censo de Población 2012. Available online: www.ine.cl (accessed on 15 October 2015).
  50. Instituto Nacional de Estadísticas, Cifras Trimestrales de Empleo. 2013. Available online: https://www.google.com/url?sa=t&rct=j&q=&esrc=s&source=web&cd=1&cad=rja&uact=8&ved=0CB0QFjAAahUKEwiwnObZ6MTIAhWHHpAKHauMB1I&url=http%3A%2F%2Fwww.ine.cl%2Fdescarga.php%3Farchivo%3D384%26codigo%3DYB7HerQb4dCBvUcB&usg=AFQjCNF362Zri14CrAEY0EWlqiZEYsNbbA&sig2=auhqbGO-kb5DcbrjgEaszA (accessed on 15 October 2015).
  51. Kaiser, F.G. A General Measure of Ecological Behavior. J. Appl. Soc. Psychol. 1998, 28, 395–422. [Google Scholar] [CrossRef]
  52. Kaiser, F.G.; Doka, G.; Hofstetter, P.; Ranney, M.A. Ecological behavior and its environmental consequences: A life cycle assessment of a self-report measure. J. Environ. Psychol. 2003, 23, 11–20. [Google Scholar] [CrossRef]
  53. Schwartz, S.H. A proposal for measuring value orientations across nations. 2003. Available online: http://www.europeansocialsurvey.org/docs/methodology/core_ess_questionnaire/ESS_core_questionnaire_human_values.pdf (accessed on 15 October 2015).
  54. Dunlap, R.E.; van Liere, K.D.; Mertig, A.G.; Jones, R.E. New trends in measuring environmental attitudes: Measuring endorsement of the new ecological paradigm: A revised NEP scale. J. Soc. Issues 2002, 56, 425–442. [Google Scholar] [CrossRef]
  55. Gärling, T.; Fujii, S.; Garling, A.; Jakobsson, C. Moderating effects of social value orientation on determinants of proenvironmental behavior intention. J. Environ. Psychol. 2003, 23, 1–9. [Google Scholar] [CrossRef]
  56. Low SES was not considered for the purposes of this study, since it represents extreme poverty.
  57. Hair, J.; Black, W.C.; Babin, B.J.; Anderson, R.E.; Tatham, R.L. Multivariate Data Analysis, 7th ed; Prentice-Hall, Inc: Upper Saddle River, NJ, USA, 2010. [Google Scholar]
  58. Schumacker, R.E.; Lomax, R.G. A Beginnerʼs Guide to Structural Equation Modeling; Psychology Press: Mahwah, NJ, USA, 2004. [Google Scholar]
  59. Bill to Establish Framework for Waste Management and Extended Producer Responsibility, Submitted to Lower House on September 10, 2013. Available online: http://www.camara.cl/pley/pley_detalle.aspx?prmID=9501&prmBL=9094-12 (accessed on 15 October 2015).

