Article

Evaluation of Various Retrofitting Concepts of Building Envelope for Offices Equipped with Large Radiant Ceiling Panels by Dynamic Simulations

by
Sabina Jordan
1,*,
Jože Hafner
1,†,
Tilmann E. Kuhn
2,†,
Andraž Legat
1,† and
Martina Zbašnik-Senegačnik
3,†
1
Slovenian National Building and Civil Engineering Institute, Dimičeva ulica 12, Ljubljana 1000, Slovenia
2
Fraunhofer Institute for Solar Energy Systems, ISE, Heidenhofstrasse 2, Freiburg 79110, Germany
3
Faculty of Architecture, University of Ljubljana, Zoisova cesta 12, Ljubljana 1000, Slovenia
*
Author to whom correspondence should be addressed.
These authors contributed equally to this work.
Sustainability 2015, 7(10), 13169-13191; https://doi.org/10.3390/su71013169
Submission received: 31 July 2015 / Revised: 9 September 2015 / Accepted: 18 September 2015 / Published: 25 September 2015

Abstract

:
In order to achieve significant savings in energy and an improved level of thermal comfort in retrofitted existing buildings, specific retrofitting concepts that combine new technologies and design need to be developed and implemented. Large radiant surfaces systems are now among the most promising future technologies to be used both in retrofitted and in new low-energy buildings. These kinds of systems have been the topic of several studies dealing with thermal comfort and energy utilization, but some specific issues concerning their possible use in various concepts for retrofitting are still poorly understood. In the present paper, some results of dynamic simulations, with the transient system simulation tool (TRNSYS) model, of the retrofitted offices equipped with radiant ceiling panels are presented and thoroughly analysed. Based on a precise comparison of the results of these simulations with actual measurements in the offices, certain input data for the model were added, so that the model was consequently validated. The model was then applied to the evaluation of various concepts of building envelopes for office retrofitting. By means of dynamic simulations of indoor environment it was possible to determine the benefits and limitations of individual retrofitting concepts. Some specific parameters, which are relevant to these concepts, were also identified.

1. Introduction

The retrofitting of existing office buildings is becoming increasingly important due to required energy savings and the fact that people in industrial societies spend 90% of their time indoors [1,2,3], so that they require improved thermal comfort. For this reason, effective retrofitting concepts, which should include newly developed or modified and upgraded technologies, as well as new design concepts, need to be developed and their validity confirmed [4,5,6]. It should be mentioned that these technologies should also be considered from the seismic engineering point of view, since certain elements could influence the dynamic stability of a structure [7,8]. The specific properties and energy efficiency of such new technologies, as well as their design concepts, can be evaluated by the performance of different kinds of tests, especially when such measurements are combined with real case demonstrations [9,10,11,12,13]. On the other hand, modeling by means of various mathematical tools, too, is a powerful method for the evaluation of the overall impact of such technologies on thermal comfort and energy utilization [14,15,16]. Thus the most efficient method is surely to combine both approaches together, since in this way successive improvements in technologies and design are possible.
Large surface radiant bodies are one of the promising future technologies for the provision of heating and cooling energy in buildings. This particular technology makes efficient use of the principle of the small temperature differences between a large radiant surface and its surroundings [17]. Large surface radiant systems can be built into nearby structure, or suspended from it. The most widely known and commonly used form of built-in systems is the floor heating system. Built-in systems can be installed into the floor, ceiling, or wall structure, and possess the additional function of activating the thermal mass (so-called thermally activated building systems). Suspended systems are usually fixed onto the ceiling as a suspended ceiling in the form of gypsum plasterboard elements with embedded capillary tubes or tubes covered with metal sheets.
The energy utilization of radiant ceiling and wall surfaces, as well as thermal comfort, has been an important topic in many studies that have been described in literature. Most of the studies are mainly based on small-scale experiments or on numerical models, and have focused on specific questions concerning these systems. As shown in the study by Miriel et al. [12], radiant ceiling panels can be efficiently used for heating and cooling in buildings with good thermal insulation and low cooling loads. Compared to conventional air-conditioning systems, such systems can create a more comfortable environment with less energy utilization [11], and can also cope with complex user behavior as long as good solar protection is provided and correctly implemented [13]. In these cases, mechanical ventilation of the treated indoor environment also needs to be carefully considered: when no additional air treatment for increasing convection is provided, the system may be able to prevent possible overheating only to a limited extent [12]. Better results can be achieved by integrating suitable mechanical ventilation systems, which can increase the convective heat transfer and improve the time response of the radiant system [18]. In this way, the needed size of the radiant surfaces can be reduced [18].
As shown in the study by Rahimi et al. [19], in large surface radiant systems the main mechanism for transferring heat from the warm surface of a ceiling to another surface is radiation. However, in typical offices the transitional period between winter and summer is the most sensitive to user interference [20]. In many research studies [17,21,22] it has been mentioned that determining the proper heat transfer coefficient and the cooling capacity of the cooled ceiling systems is of crucial importance, especially in connection with solar gains. The surface temperatures in the room and the air velocity are the two main factors, which influence the actual cooling performance of ceiling radiant cooling panels [23]. In fact, both factors can have a considerable influence on the efficiency of radiant ceiling systems in both the heating and the cooling mode, so that the latter must be evaluated together with the nearby indoor environment, and not as separate heating, ventilation and air conditioning (HVAC) equipment [10,24,25].
The dynamic simulation program TRNSYS [26] is commonly used for modeling and analyzing larger models, e.g., when the energy performance and thermal comfort of buildings are studied [14,15]. However, the TRNSYS simulation program is also used for dynamic simulations of buildings or parts of buildings that are equipped with radiant systems [12,13,18,27]. By performing TRNSYS computer simulations of a typical office floor equipped with a radiant cooling system, it has been found that occupant behavior can have an important influence on the cooling demand and thermal comfort [13]. Similar conclusions have been drawn in the case of investigations into the possible impact of occupant behavior on building performance and thermal sensation in the case of conventionally heated buildings: compared to the design strategy used in the model, the measured energy demand can be twice as high, and the thermal comfort lower [28]. Additionally, it has been found not only that very good thermal insulation is needed, but also that an adequate thermal mass has to be foreseen in the case of buildings with large radiant surfaces [29]. By means of simulations, which were consequently calibrated using measured in situ data, Tian et al. [30] demonstrated that limitations of measured data can significantly contribute to observed discrepancies between measured and simulated results [30].
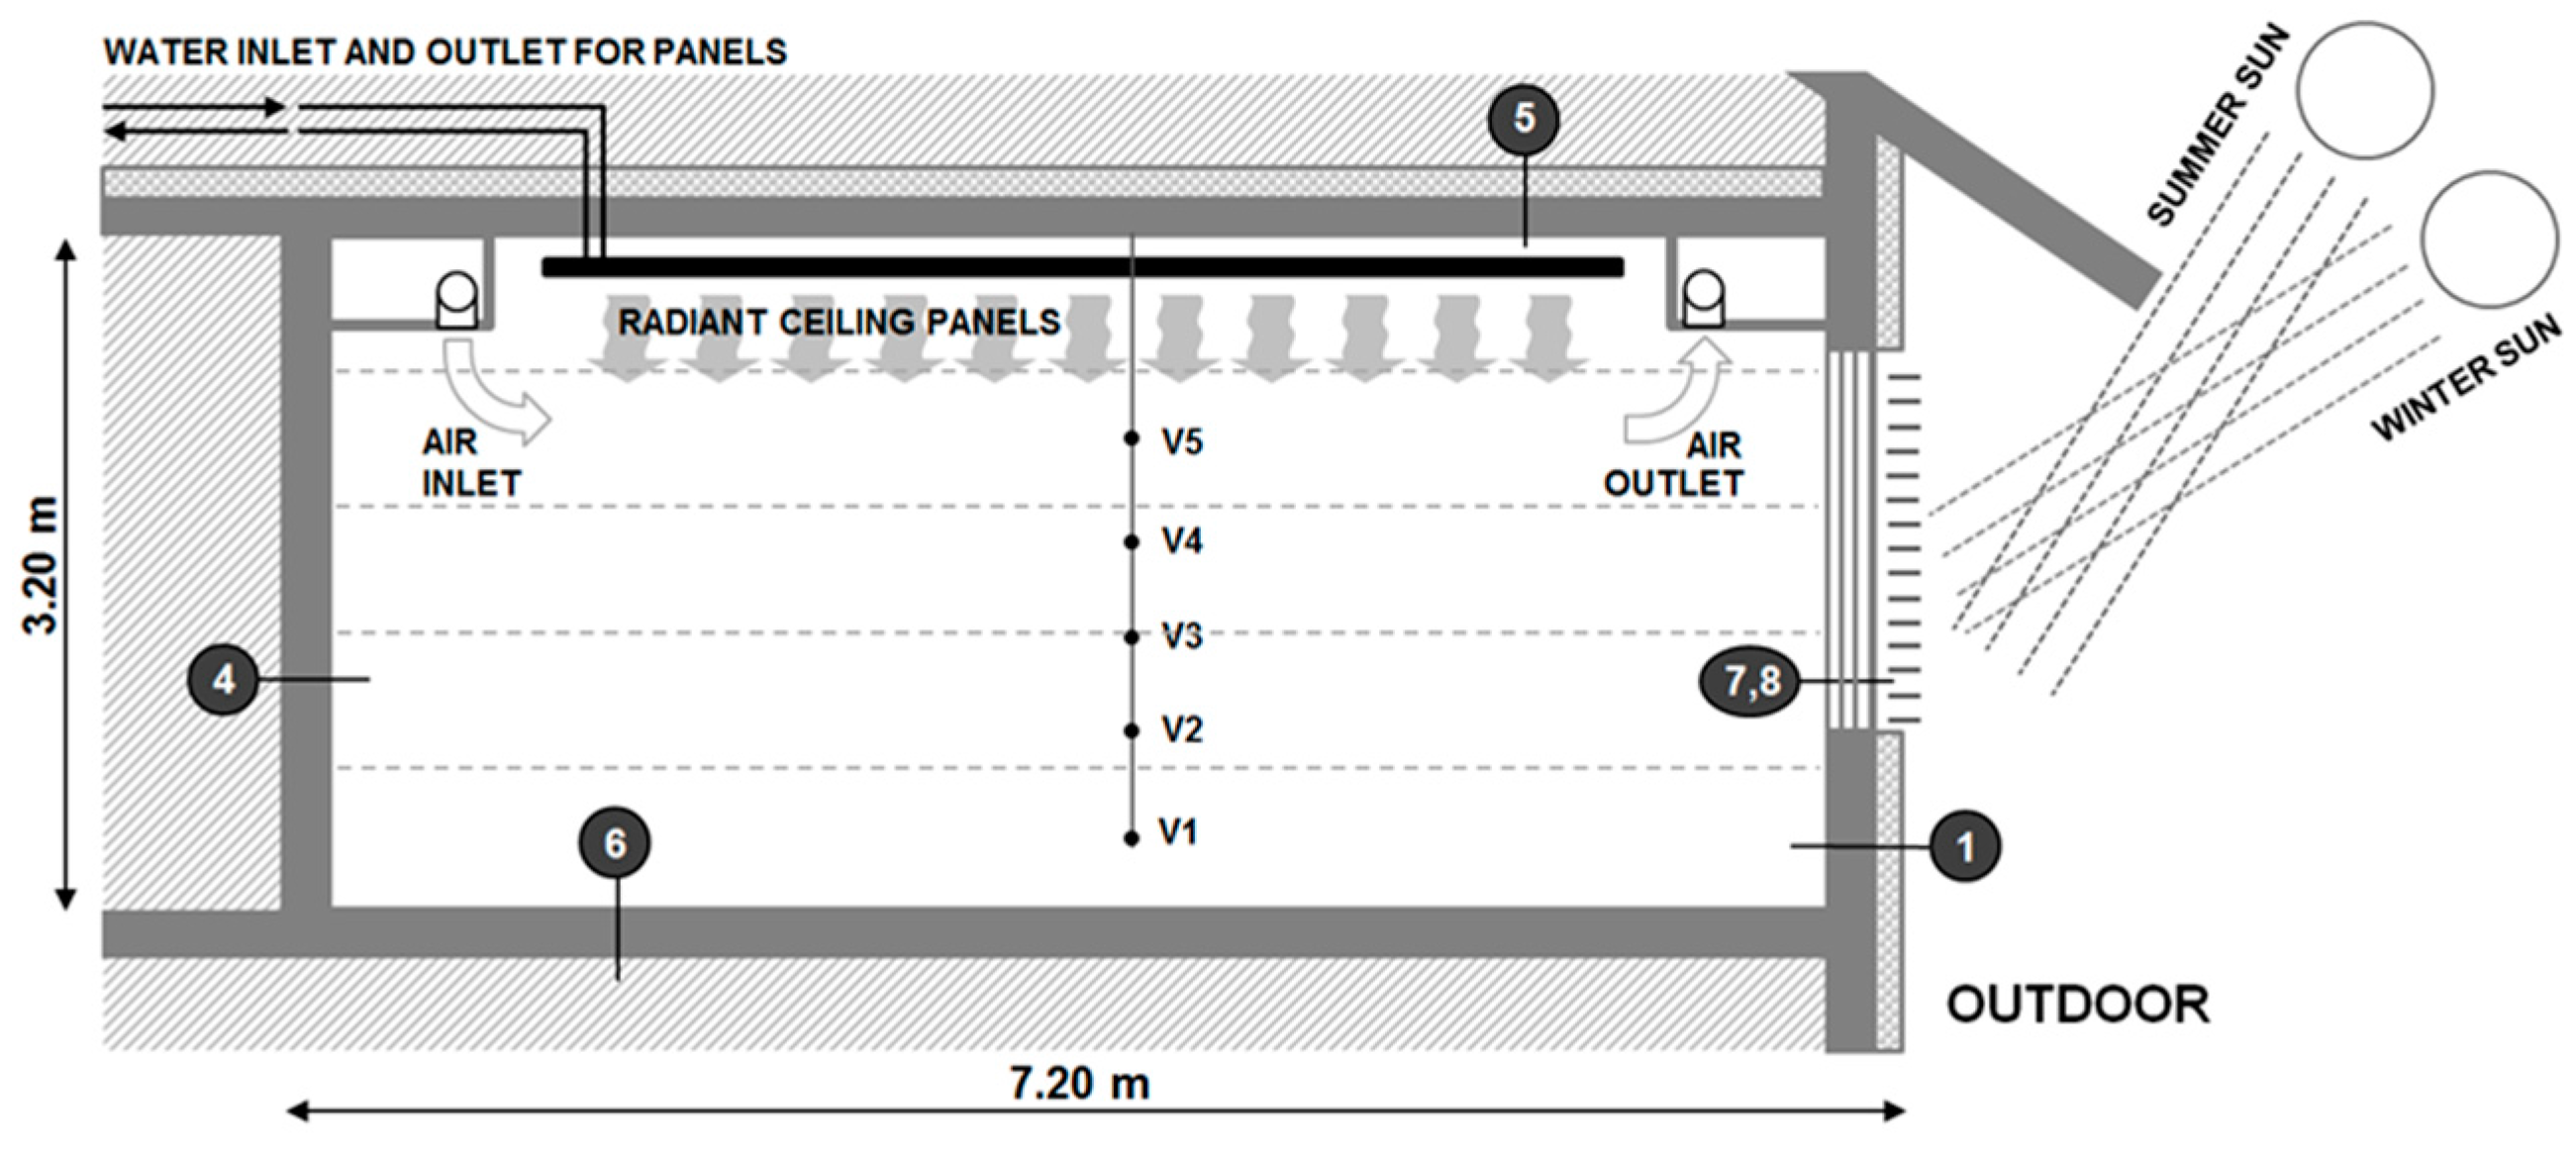
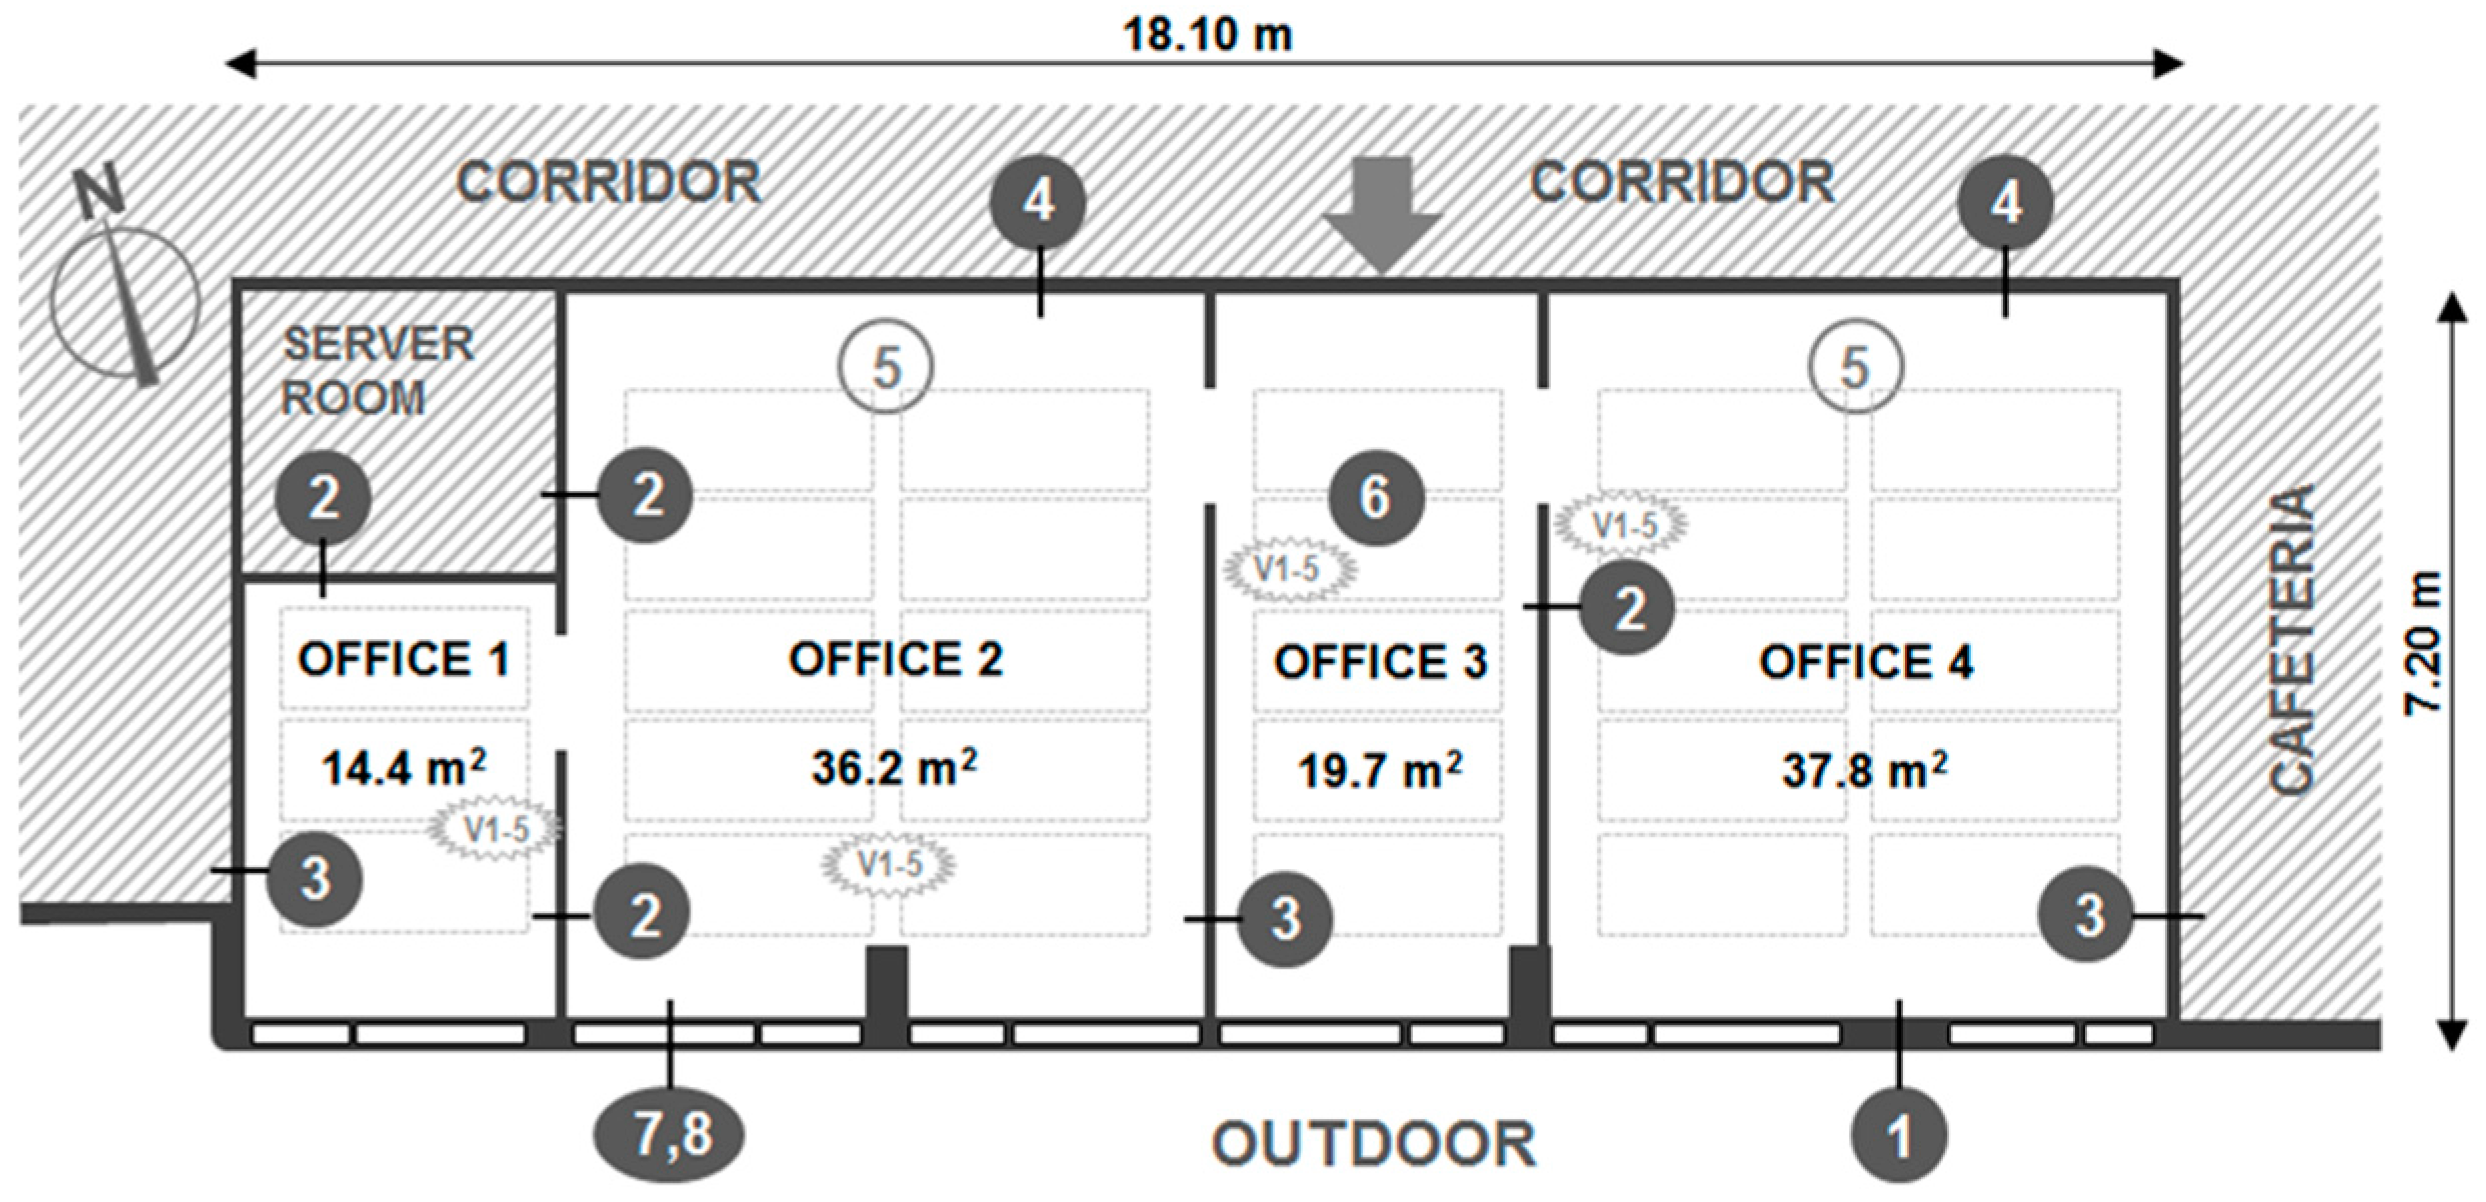
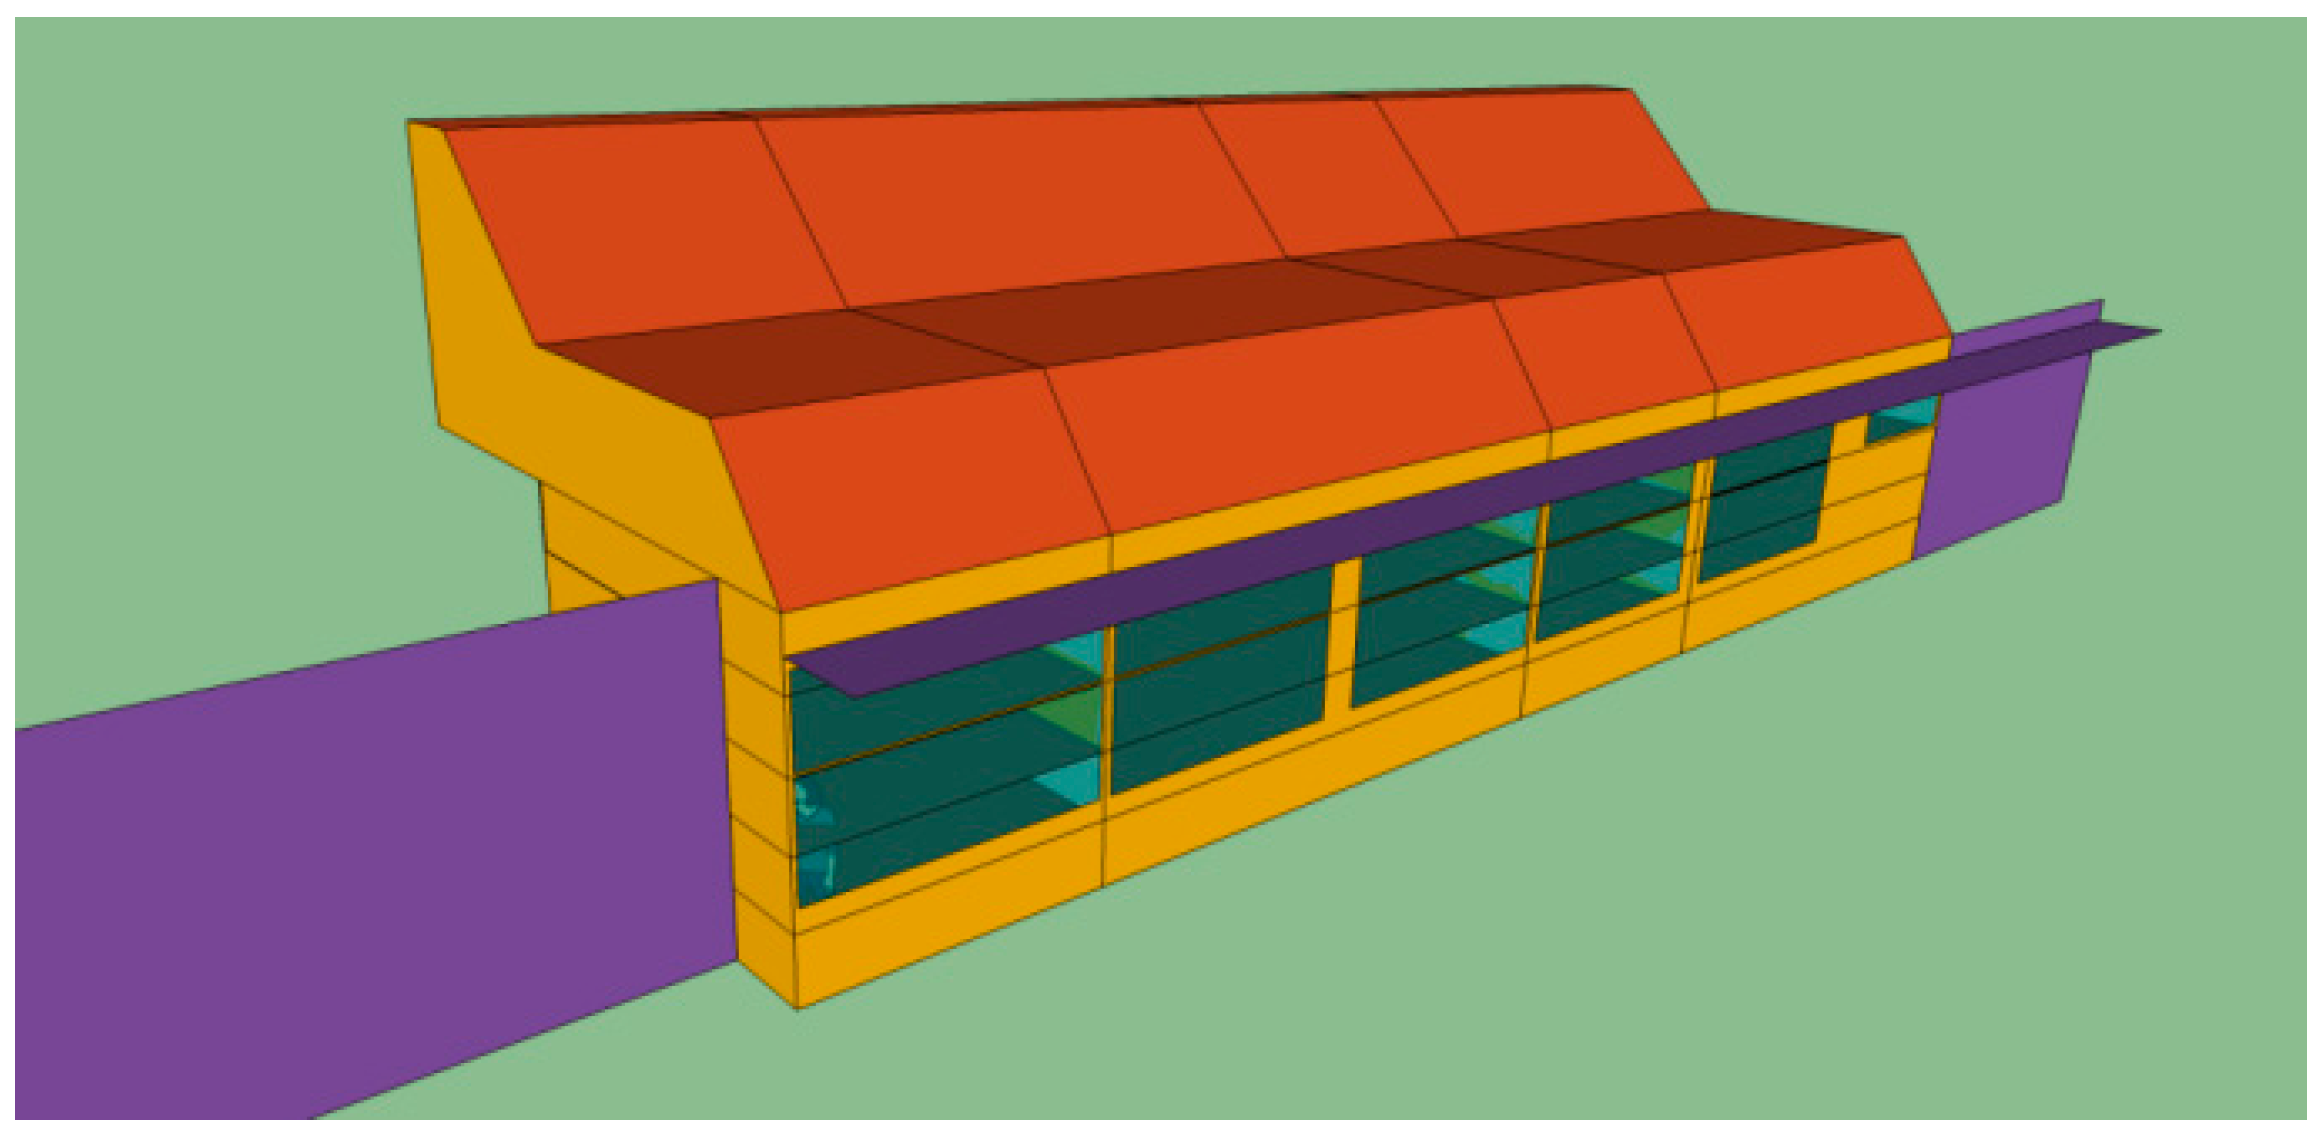
The purpose of the present study was to evaluate different retrofitting concepts for existing office buildings with the focus on the transparent part of the building envelope. The retrofitting concepts included different façade characteristics (glazing size, glazing types), shading strategies, and window opening strategies, combined with the radiant ceiling system. In order to perform sufficiently accurate analyses and evaluations of the proposed concepts, a comprehensive TRNSYS simulation model based on the actual technical performances of the retrofitted offices was defined. These retrofitted offices were pilot demonstrators in the EU project COST EFFECTIVE (Resource- and Cost-Effective Integration of Renewables in Existing High-Rise Buildings, 7FP, 2008-2012) [31]. After the TRNSYS model had been defined, specific data were added to the model. The model was then validated by means of a comparison with actual data that had been obtained in retrofitted pilot offices equipped with radiant heating/cooling ceiling system [9,32,33]. Furthermore, based on the variations of the model and the performed analyses, as well as on a comparison of the results, the goal was to determine valid concepts and to check the impacts of different parameters on the results obtained in the simulations.
It should be noted, however, that the study was limited to modeling and simulations of energy use and to an indoor environment only. Thus, evaluated quantities were the energy utilization for heating and cooling of the offices and the indoor air temperatures. Consequently, modeling of the energy supply equipment and equipment for the everyday operation of the investigated offices, as well as the use of primary energy, and evaluation of the various control strategies, were not considered within the scope of this study.

2. Materials and Methods

2.1. Basis for Defining the Model

The modeling process was based on the real case geometry of 108 m2 pilot offices on the 5th floor of ZAG’s (Slovenian National Building and Civil Engineering Institute) main building in Ljubljana, Slovenia [9]. Ljubljana’s latitude is 46°40′ N, and its longitude is 14°31′ E; the average elevation of the city is 299 m. The location has a mixed climate, with some continental and some Mediterranean characteristics, i.e., warm summers and moderately cold winters. The mean annual air temperature is 10.9 °C, and the number of solar irradiance hours is 1974. Ljubljana has 3200 heating degree days and 93 cooling degree days (at a reference temperature of 21 °C).
The pilot offices at ZAG were retrofitted and equipped with radiant ceiling heating/cooling panels and mechanical ventilation (Figure 1). The ceiling panels for heating and cooling of individual offices were equipped with calorimeters, which measure the amount of energy delivered to each office. The mechanical ventilation was designed to provide tempered air, and thereby a small part of the energy to the offices. For this reason the inlets and outlets of the mechanical ventilation system in each office were equipped with measuring devices. These consisted of electronic volume regulators and temperature sensors, which measured the air temperature and air volume delivered to and extracted from the rooms. Additional measurement points of the air temperature were also installed in the offices (Figure 1). Each measurement point consisted of five vertically installed Thermocouple type T sensors, which were arranged over the whole height of the room. These verticals were located at least half a meter from the wall at different locations in the offices, and relatively close to the working places of the users. The sensors at the verticals were at heights of approximately 0.25 m (V1), 0.80 m (V2), 1.20 m (V3), 1.80 m (V4) and 2.20 m (V5) from the floor (Figure 2). The whole system of the pilot offices was managed by a newly installed building management system (BMS), and was provided with additional monitoring equipment.
Figure 1. Schematic floor plan of the pilot offices with the radiation ceiling panels indicated by dashed lines, showing the position of the vertically installed air temperature sensors (V1–V5), and the main building elements (described in Table 1).
Sustainability 07 13169 g001
Figure 2. Typical elevation view of the pilot offices, showing the radiation ceiling panels, the air inlets/outlets of the mechanical ventilation system, the vertically installed air temperature sensors (V1–V5), and the five equal horizontal layers.
Sustainability 07 13169 g002

2.2. Modeling of the Built Structures and Elements

The basic geometry for the TRNSYS model was prepared in a SketchUp plug-in (Figure 3) according to the geometrical characteristics of pilot offices. The modeling was completed in TRNSYS using a Type56 block [26].
Figure 3. Geometry of the model that was graphically prepared in the SketchUp for TRNSYS.
Sustainability 07 13169 g003
The geometry of the model involved four main zones, which represented all four of the retrofitted offices (108 m2) according to Figure 1 and the unconditioned attic above the offices as the fifth model zone (Figure 3). It also involved a roof above the windows, since it provided the shade for the windows of the pilot offices for most of the summer. Each office zone of the model was subdivided into five equal horizontal layers (Figure 2 and Figure 3). This was done in order to define the micro-locations where input data were gathered about the energy supply from the ceiling panels (layer 5), about the air operation of the air inlets and outlets for mechanical ventilation (layer 5), about the internal gains from the individual workers and their devices (layers 1 and 2), and about the internal gains from the artificial lighting (layer 4).
The model assumed the same orientation as the pilot offices, 15° SW. However, the structure of the walls (Figure 1) was quite diverse in their composition. The structural elements consisted of plastered brick walls, lightweight gypsum walls, plastered concrete walls, concrete ceilings, and concrete floors. A description of the building envelope elements, including their dimensions and basic characteristics, is given in Table 1. These basic characteristics include the thermal transmittance of all structures (their U-values) and the total solar energy transmittance of the glazing (its g-value).
Table 1. Main building elements and their thermal characteristics.
Building Element
DescriptionU-Value (W/(m2K))g-Value (-)
1External wall (facade)20 cm concrete wall + 12 cm thermal insulation0.28-
2Lightweight wall2 × 1.25 cm gypsum board + 10 cm thermal insulation0.34-
3Solid wall12 cm brick wall2.71-
4Wall to corridorCombination of 12 cm brick wall and particle boards1.31-
5Ceiling to unheated attic20 cm concrete slab + 20 cm thermal insulation0.18-
6Floor20 cm concrete slab + 2 cm thermal insulation + 7 cm screed1.00-
7Window frameHigh insulation aluminum frame1.60-
8Window glazingTriple glazing + Argon gas filling + low-e coatings0.700.29
The window openings in the model, which corresponded to the actual windows, were 1.90 m high and covered almost the entire façade width of each office, one exception being the smaller window in Office 4 (Table 2).
Table 2. The surface areas of the windows and glazing in the façade of the modeled pilot offices.
Façade-Surfaces and Shares
Façade (m2)Window (m2)Fixed w. (m2)Openable w. (m2)Glazing (m2)Window Share (%)Glazing Share (%)
Office 111.15.54.01.54.149.737.5
Office 220.110.17.13.08.450.442.0
Office 310.75.23.61.54.248.339.6
Office 419.76.64.52.25.333.527.1
TOTAL61.527.419.28.222.2Average: 45.5Average: 36.0
The thermal capacitance of the movable equipment (i.e., the furniture, computers, and papers) and of the ceiling panels was estimated for each horizontal subzone, and included in the model as indicated in Table 3. These calculations were performed based on the real amount of equipment and panels, according to their known characteristics.
Table 3. Thermal capacitance of the offices as included into the model.
Thermal Capacitance (kJ/K)
Office 1Office 2Office 3Office 4
Layer 5 (2.56–3.20 m)92.9457.2242.1378.6
Layer 4 (1.92–2.56 m)5.2261.2142.4132.1
Layer 3 (1.28–1.92 m)26.9293.8180.3190.2
Layer 2 (0.64–1.28 m)355.1681.8316.2366.0
Layer 1 (0.00–0.64 m)185.9840.1317.4329.6
The air exchange rate between indoors and outdoors, 1.6 h−1, measured according to the standardized measuring procedure [34] at a pressure difference of 50 Pa, was applied to the model (recalculated to normal pressure). The measured value 1.6 h−1 meets the requirements of the Slovenian legislation, which is 2.0 h−1 for buildings with mechanical ventilation with an air exchange rate greater than 0.7 [35,36].

2.3. Modeling of the HVAC Systems

The model was supplemented with one of the existing routines defined in TRNSYS, i.e., the Layer Type Chilled Ceiling for the simulation of large suspended flat metal sheets with copper piping (Figure 2), which covered about 60% of the area of the ceilings of the four investigated offices. A variety of data was used within the Layer Type Chilled Ceiling: the geometry of the pipes (diameter, distances, lengths), the data that was obtained from the installed radiant ceiling elements in the pilot offices, the thermal transfer coefficient (data from producer: 8.3 W/(m2·K)), and the nominal water flow (30 kg/(m2·h)). The thermal capacitance of the panels was included in Layer 5 of the model. The cooling and heating power was a function of the water temperature and the indoor air temperature. The regulation of the radiant ceiling system was implemented in the model in the same way as in the pilot offices, by ON/OFF switching of the water flow at the virtual room temperature regulator in the model. As in the pilot offices, in the model the panels were also all set to operate in the same mode, i.e., in either heating or cooling mode. The metal radiation panels in the pilot offices had a fast response to temperature fluctuations. By using the existing routine in the model, i.e., the Layer Type Chilled Ceiling, and by adding the thermal capacitance of ceiling panels in Layer 5, satisfactory results were obtained.
Virtual room temperature regulators, similarly to the room temperature regulators in the pilot offices, operated the ceiling panels in the model. The settings in the model were adjusted to the actual settings of the pilot offices. In heating mode, the air temperatures of the modeled rooms were set to 22 °C, whereas in cooling mode the air temperatures were set to 24 °C with adjustments of ± 2 K. In heating mode only the set temperature was reduced by 1 K during nighttime (from 5:00 p.m. until 7:00 a.m.), and by 2 K over the weekend. In cooling mode, however, the system was modeled to operate continuously, with the same arrangements as in the pilot offices. Therefore, the set temperature of the virtual room temperature regulators in the model in cooling mode was not fixed (as it was set). It increases linearly by a maximum of 2 K from the set point throughout the day, depending on the outdoor temperature rise, taking into account an outdoor temperature of between 14 °C and 28 °C. Since surface condensation in cooling period could cause major problems on the cooled panels, special attention was paid to measures in the pilot offices, to avoid the risk of surface condensation. If the sensors detected a certain increase in the air humidity the water temperature in the ceiling panels was increased, and, if a window in an office was opened, the system stopped operating. When modeling, the same temperatures for cooling media were applied as were measured in the pilot offices.
The mechanical ventilation system was simulated at a level close to the ceiling, in layer 5, in the same way that the inlets and outlets of air in the pilot offices were arranged (Figure 2). Ventilation was defined by the air inlet quantity (kg/h) and the temperature (°C), as was measured in the pilot offices. Since the main purpose of the mechanical ventilation was the supply of fresh tempered air to the offices and the increase of the air movement around the radiant ceiling panels, which enhanced the latter’s efficiency, the air temperatures were moderate and rather constant. The daily averaged measured temperatures of the inlet air throughout the year were between 23 °C and 24 °C. Thus, the temperature of the inlet air in the model was also 23 °C–24 °C for both the heating and the cooling mode. The air exchange between the horizontal layers in specific zones of the model was also taken into account. The values for air movement speed that were used in the model were 0.03 m/s–0.10 m/s.

2.4. Boundary Conditions and Gains

The external conditions as well as the boundary conditions of the indoor environment were taken into account for the simulations. The data for the external conditions, which were used in the model, consisted of the actual outdoor air temperatures and the solar irradiation for Ljubljana in 2013. All the data were obtained from Slovenian Environment Agency [37], whose meteorological station at Ljubljana-Bežigrad, is located at a distance of 400 m from the pilot offices. The global irradiation at this location in 2013 varied from 26 kWh/m2 in December, up to 215 kWh/m2 in July. For the heating season it was calculated to amount to 318 kWh/m2, whereas in the cooling season it amounted to 887 kWh/m2. The indoor boundary conditions of the model in the server room and in the cafeteria were 21 °C, and a constant temperature regime was maintained there. The boundary conditions in all the other adjacent rooms, in the corridors, and in the offices located beneath the model, were 21 °C in the heating season. In the cooling season, they were equal to the model temperatures.
The solar gains through the windows of the model were calculated automatically by the software from the solar irradiation data corresponding to 2013, according to the geometry (including the roof geometry), taking into account similar data as in the pilot offices. Regulation of the solar gains was controlled by the modeled roof above the windows, and by the use of motorized venetian blinds, as well as the use of office glazing with a low g-value. Regulation of the solar gains by means of venetian blinds for further use in the model was estimated in correlation with the measurements. The shading coefficient of the venetian blinds varied in each office according to time of year and the occupation of the office. In the first three and last two months of the year, the shading coefficient for all four offices was estimated as amounting to between 0.40 and 0.75 (in the presence of users), with the minimum factor being typically applied in January and December. For all other months, the shading coefficient had a value of approximately 0.80. The shading of the internal roller blinds, which served to reduce glare in the offices, was estimated to amount to 0.30 (taking into account real usage, 0.60, and the characteristics of the device, 0.50).
Three types of internal gains that were identified in the pilot offices and were related to the use of the premises were taken into account in the model: office users (four in office 2, and one each in offices 1, 3, and 4), devices, and artificial lighting. The assessment of internal gains from users was based on the recorded attendance of office users, their estimated presence in the rooms, and their activity—light work which corresponds to 75 W for sensible heat only [38]. The assessment of internal gains from devices was also based on presence of users and on the results of the measurements of electricity utilization (including 16 h of standby power). Finally, the assessment of internal gains from lighting was also based on presence of users in the offices, as well as on the results of the measurements of electricity utilization (lighting switched off in non-working hours), and was calculated separately for heating/cooling period. These calculations were based on the average daily values for working and non-working days. They were summarized into total values separately for the heating and cooling periods (Table 4).
Table 4. The internal gains per square meter of office that were included in the model.
Internal Gains Per Day (kWh/(m2 day))
Office 1Office 2Office 3Office 4
UsersDevicesLightsUsersDevicesLightsUsersDevicesLightsUsersDevicesLights
Heating working day0.020.080.030.030.130.050.020.050.030.010.060.04
Cooling working day0.020.080.010.030.130.030.020.050.010.010.060.02
Non-working day0.000.020.000.000.040.000.000.040.000.000.030.00
Internal Gains Per Week (kWh/(m2 Week))
Heating week0.681.110.560.62
Cooling week0.601.010.480.52
Internal Gains Per Period (kWh/(m2 Period))
Heating period20.4833.4816.8518.79
Cooling period13.2022.0010.4911.45

3. Validation of the Model

3.1. Comparison between the Simulations and the Measurements

Simulations were performed for the whole year 2013 for further analysis and comparison with the results of measured heating and cooling energy and indoor air temperatures at the pilot offices. The monthly-simulated energy values for heating and cooling of the ceiling panels in the model were compared to the monthly measured values at the pilot offices. Finally, the calculated total energy of the simulated monthly values was compared to the measured values on the annual level.
The simulated indoor air temperatures of the middle layer, i.e., layer 3, were compared to the measured values of the air temperature sensor V4. The location of this sensor corresponds to layer 3 (Figure 2). The air temperature sensor V4 was part of the additionally installed measuring system, which measured the indoor air temperatures in each pilot office. The temperature simulations were one-hour averages, based on 15 min simulation intervals. Comparison with the measurements was made for each month for all four offices.

3.2. Refinement with Additional Input Data

It is known that in complex systems such as buildings numerous parameters and physical processes can influence the indoor air temperatures and the utilization of energy. The needed input data that were included in this model were obtained predominantly from the measurements that were performed at the pilot offices. Certain data were estimated from given parameters and characteristics of the rooms. Additionally, some specific data related to the pilot offices, could only be assessed by making correlations with the measurement results corresponding to a certain period. All these input data were more detailed than the usual general data that are available for modeling. They showed relatively satisfactory results. Nevertheless, a comparison of the measured and simulated temperatures showed a few specific irregularities in the measured temperature curves and certain gap in the energy utilization.
For this reason, two supplementary modifications were made in the case of the virtual room temperature regulators of the model, which had a certain influence on the simulation results. The first modification took into account the correction of small measurement errors of each room temperature regulator in the pilot offices. The room temperature regulators were checked with calibrated temperature sensors. For the second modification of the virtual room temperature regulators, the influence of the inner wall temperature was taken into account: this includes 1/3rd of the wall temperature and 2/3rds of the air temperature in the calculation of the regulator temperature. Apart from this, some additional refinements of the input data were studied and, introduced step by step into the model. Three of them are shown in the following cases.
The measured temperatures in the offices indicated typical deviations at certain hours when the opening of windows in the offices was actually observed. By opening the windows users caused an increased air exchange between the indoor and external environments. In the case of moderately lower outdoor temperatures, a drop in the measured indoor temperatures of the pilot offices was recorded (Figure 4a). For this reason an increased air exchange rate was included in the model, from 0.2 h−1 for about 0.5 h−1 up to 0.7 h−1. As a result the observed simulation temperature curve matched the measured temperature curve better (Figure 4a). During a short time period in March, an unusual irregularity was recorded on the measured temperature curve in Office 4 (Figure 4b). It was discovered that during this period an extra expert was present in the office, using additional equipment, i.e., a computer and a 3D scanner, which caused higher than usual internal gains. The data corresponding to the measured operational power of the devices and the estimated schedule of work were included in the model. As a result, the simulated air temperature curve approached the measured temperature curve much closely (Figure 4b).
Figure 4. (a) Simulation and measurements of window opening vs. non-opening in Office 2; and (b) simulation and measurements of the additional internal gains vs. the predicted internal gains in Office 4.
Sustainability 07 13169 g004
The pilot offices were also equipped to measure the air temperatures of the mechanical ventilation air outlets. It was thus possible to compare the mean air outlet temperatures of the mechanical ventilation system, and the mean measured temperatures at vertical sensor 5 (V5). The comparison showed temperature differences throughout the year for working and non-working hours (Figure 5). The measured average monthly temperature differences for each office were adopted as an input for improvement of the model. The same principle was used as for the inlet air: the extraction of the exhausted air (the same as the inlet airflow), and the average monthly temperature differences that were calculated from the measured values (Figure 5).
Figure 5. Temperature differences between the mean measured temperatures of the vertical sensor 5 (V5) and the mean outlet air temperatures for working and non-working hours.
Sustainability 07 13169 g005

3.3. Final Simulation Results

Final simulations for the validation of the model were performed for the whole year 2013, comprising all the data from a detailed analysis of the measurements. The yearly heating and cooling energy utilization released by the ceiling panels was calculated to amount of 3264.3 kWh. It matched the measured energy utilization at the panels, which amounted to 3237.8 kWh, very well. Figure 6 shows the total monthly energy released by the ceiling panels to the pilot offices, i.e., the measured heating and cooling energy and the simulated final result.
Figure 6. Simulated and measured monthly energy released to the pilot offices via the ceiling panels in 2013.
Sustainability 07 13169 g006
Percentage values of the root mean square error (RMSE) and the mean bias error (MBE) for the simulated energy from the office panels were calculated according to the established protocols [39,40]. The percentage errors of the final pilot simulation results for heating, cooling and total energy needs are presented in Table 5. As can be seen from this table, the simulation result of the total energy from the ceiling panels of the pilot offices model is very close to the measured result for the real offices. The RMSE percentage is only 3.9% and the MBE percentage is −0.8%. The simulated energy is therefore only 0.8% higher than the measured energy released into the offices by the radiant ceiling panels.
Table 5. Percentage errors for the simulated energy released by the ceiling panels.
Simulated Energy
RMSE (%)MBE (%)
Whole model-Heating4.9−2.0
Whole model-Cooling3.10.2
Whole model-TOTAL3.9−0.8
It was established that the simulated indoor air temperatures in the offices matched the measured temperatures very well, although it was observed that the months with low energy utilization were more sensitive to the activity of the occupants. The accuracy of each correlation between the temperatures was also evaluated by means of two statistical methods: the root mean square error (RMSE) method, and the mean bias error (MBE) method. These calculations were performed individually for all four offices in both the heating and the cooling period. In the case of both periods, i.e., heating and cooling, the RMSE percentage of the simulated temperatures was 0.4%. Whereas the calculated MBE percentage was 0.2% for the heating period, it was 0.0 for the cooling period (Table 6). The average RMSE of the simulated temperature values was ±0.45 K in the heating season and ±0.58 K in the cooling season.
Table 6. Percentage root mean square error (RMSE) and percentage mean bias error (MBE) for the simulated air temperatures.
Simulated Air Temperature Errors
Office 1Office 2Office 3Office 4Average
% RMSE% MBE% RMSE% MBE% RMSE% MBE% RMSE% MBE% RMSE% MBE
Heating0.50.40.40.20.3−0.00.30.10.40.2
Cooling0.40.10.40.10.40.10.4−0.10.40.0

4. Evaluation of the Retrofitting Concepts for the Building Envelope

4.1. Parameters

For the evaluation of the retrofitting concepts of building envelopes with the focus on glazing, the validated model was applied. The specific modifications that were related to the façade were implemented in the model: the type and share of glazing, the use and regime of shading devices (venetian blinds), the use and regime of window opening. These concepts did not, however, involve any variations in the geometry of the model, or any change in the opaque elements of the façade on the overall model, including the thermal insulation of the façade. For each simulation of the design concept, the calculated energy released from the panels in all four offices (i.e., the whole model) was observed. Office 2 was one of the two large offices. It has four occupants and thus showed the most frequent changes. For this reason, Office 2 was chosen for the analysis of simulated air temperatures, limited to the working hours (8:00 a.m. to 5:00 p.m.). The analysis comprised the average air temperatures within the working hours (Tav), the average air temperature difference (ΔTav), and the maximum air temperature difference (ΔTmax) between the lowest and the highest air temperature, also within the observed working hours. In the cooling period, the number of hours over certain air temperature limits was observed, as well as the maximum air temperatures (Tmax). For the first air temperature limit, a temperature of 26 °C was selected as the highest temperature for providing thermal comfort. Additionally, an air temperature of 28 °C was set as the limit which must not be exceeded at the work place [41].
The following types of glazing were used in the design concepts: a combination of glazing with two different thermal transmittances (U-values), i.e., 0.7 and 1.1 W/(m2·K), and four different solar energy transmittances (g-values), i.e., 0.22, 0.29, 0.33 and 0.50. The orientation was always 15 SW, but the size of the glazing varied according to the different glazing shares of 30%, 36%, or 42% in total the façade surface. A glazing share of 36% corresponded to the real glazing share of the investigated offices. A share of 42% was achieved by increasing the dimensions of each glazing area in all directions, whereas a share of 30% was achieved by correspondingly reducing them. The simulations were performed with and without the shading devices. The shading devices were used as follows: venetian blinds as actually used in 2013 (with a different shading coefficient, b, for each room), venetian blinds with an estimated common shading coefficient, b, for all the windows (Table 7), and fixed venetian blinds with shading coefficients b = 0.80 and b = 0.60. Furthermore, different shading strategies were checked: manual operation, fixed shading, and automatic operation with temperature conditions (only for the heating season). The temperature conditions for automatic shading were the following: shading if the indoor air temperature exceeded the temperature of the room regulator (ΔT(Ti − Tr) > 1 K, 2 K or 4 K).
Table 7. Estimated common average shading coefficient, b, for all windows in the model.
JanuaryFebruaryMarchAprilMayJune
0.400.450.600.650.700.70
JulyAugustSeptemberOctoberNovemberDecember
0.700.700.700.650.600.40
Ultimately, the performance of the radiant ceiling system in the model was also enhanced by additional actions, such as window opening. Window opening strategies were the following: manual opening of the windows as in 2013, no opening, manual opening from 8:00 a.m. to 9:00 a.m. (April, May, June, and September), and automatic opening depending on the temperature conditions. The temperature conditions for automatic opening were:
-
Open if the indoor air temperature was higher than the outdoor air temperature (ΔT(Ti − Te) > 1 K, 2 K or 4 K).
-
Open if the indoor air temperature was higher than the outdoor air temperature (ΔT(Ti − Te) >1 K, 2 K or 4 K), and the indoor air temperature was higher than 21 °C (Ti > 21 °C).
-
Open if the indoor air temperature was higher than the outdoor air temperature (ΔT(Ti-Te) > 1 K, 2 K or 4 K), and the indoor air temperature was higher than 21 °C (Ti > 21 °C) and lower than 26 °C (Ti < 26 °C).
-
Open if the indoor air temperature was higher than the outdoor air temperature (ΔT(Ti − Te) > 1 K, 2 K or 4 K), and the indoor air temperature was higher than 21 °C (Ti > 21 °C) and lower than 26 °C (Ti < 26 °C), and during non-working hours only.
Four sets of simulations are presented below. In first two sets the opening of the windows was the same as in the validated model, only the type and share of glazing has varied. The first set was performed without venetian blinds and the second with venetian blinds as used in the validated model. In the third and fourth set of simulations the type (0.7/0.29) and the share (36%) of glazing were the same for each simulated case. The third set was performed with window opening as used in validated model and the fourth set was performed with shading as used in the validated model.

4.2. Type and Share of Glazing without Venetian Blinds

Several simulations were performed to check the possibility of using different types of glazing with low g-values and without additional shading devices. Although the results showed expected low energy needs for heating, 1100 kWh on average, the energy utilization for cooling was very high: it amounted to between 3000 and over 5100 kWh (Figure 7b). Furthermore, a temperature analysis showed that there was a significant rise in air temperatures during the cooling and heating seasons (Figure 7c). A very large increase in the number of hours in which the air temperature limit 26 °C was exceeded was also indicated, and the indoor air temperatures also exceeded the limit 28 °C, which applies to office work places in all the simulated concepts without shading (Figure 7d). For this reason none of the simulated concepts met the temperature comfort criteria.
Figure 7. (a) Legend for graphs; (b) The simulated energy of the whole model; (c) the simulated air temperatures in Office 2; and (d) the hours when the air temperature limits were exceeded in Office 2, for each type and share of glazing without venetian blinds (note: window opening was not changed).
Sustainability 07 13169 g007aSustainability 07 13169 g007b

4.3. Type and Share of Glazing with Venetian Blinds

By means of modeling with the shading devices (i.e., venetian blinds) as per practice in 2013, the façade design concepts with different glazing yielded simulation results for energy utilization that were relatively close to one other. Energy utilization for the whole year was, on average, less than 3500 kWh, the lowest value occurring in the case of the glazing types 0.7/0.29 and 0.7/0.22 (Figure 8b). Based on the temperature results from the simulations, the concepts with glazing types 0.7/0.22 and 0.7/0.29 were categorized as being the best (Figure 8c). The results of an in-depth temperature analysis showed that the concept with glazing 1.1/0.33 is quite comparable with the concept with glazing 0.7/0.29, and that the air temperature results become more scattered as the share of glazing is increased (Figure 8d). If observing the number of hours in which the air temperature limits and peak temperatures are exceeded (Figure 8d), then the results indicating the best comfort were recorded with glazing types 0.7/0.29, 0.7/0.22, and surprisingly also with glazing type 1.1/0.33.
Figure 8. (a) Legend for graphs; (b) The simulated energy of the whole model; (c) the simulated air temperatures in Office 2; and (d) the hours when the air temperature limits were exceeded in Office 2, for each type and share of glazing with venetian blinds (note: shading and window opening were not changed).
Sustainability 07 13169 g008

4.4. Shading Strategies

The simulations for energy utilization in the case of a model with different shading strategies showed interesting results. When manual shading according to Table 7 was used, the results were comparable to manual shading in the pilot offices; and the results with a shading coefficient of 0.60 caused the highest total energy utilization due to much higher energy needs for cooling (Figure 9b). For the remaining simulations, the results clearly showed that the offices with a fixed shading coefficient of 0.80 had very high energy utilization in the heating mode (Figure 9b); thus, as already been mentioned in the literature [42], they cannot be considered a good choice for winter period solar gains with southerly orientations. The performed analysis of air temperatures indicated that all concepts that took into account the temperature condition ΔT > 4 K, 3 K or 2 K demonstrated relatively large temperature deviations. Only those concepts that took into account the temperature condition ΔT > 1 K were considered acceptable for provision of adequate thermal comfort (Figure 9c). The concepts with manual shading according to Table 7, as well as those with automatic shading with the temperature condition ΔT > 1 K together with a shading coefficient 0.80, provided the best results in terms of the achieved indoor air temperatures and the number of hours when the air temperature limits were exceeded (Figure 9d).
Figure 9. (a) Legend for graphs; (b) The simulated energy of the whole model; (c) the simulated air temperatures in Office 2; and (d) the hours when the air temperature limits were exceeded in Office 2, for different shading strategies (note: glazing and window opening were not changed).
Sustainability 07 13169 g009

4.5. Window Opening Strategies

For the window opening strategies simulated in this parametric study, it was established that the results for energy utilization in the concept without window opening were very close to those corresponding to window opening in validated model (Figure 10b). A very good approximation was also achieved in the case of manual opening of windows between 8:00 a.m. and 9:00 a.m. during the cooling period in April, May, June, and September (Figure 10b). The simulations of the concepts with automatic window opening under different temperature conditions showed a significant decrease in the heating and cooling energy caused by a natural ventilation effect (Figure 10b). At the same time, the cases with automatic opening in the case of the temperature condition ΔT > 4 K showed large temperature deviations, the smallest being in the case of the concept with automatic opening which included all three temperature conditions and allows opening during non-working hours only (Figure 10c). If the number of hours when the air temperatures limits were exceeded, together with the high peak air temperatures, is taken into account as a criterion, then unfavorable results are obtained only when automatic opening occurred under the temperature condition ΔT > 4 K, whereas, in all other cases, the results were acceptable (Figure 10d).
Figure 10. (a) Legend for graphs; (b) The simulated energy of the whole model; (c) the simulated air temperatures in Office 2; and (d) the hours when the air temperature limits were exceeded in Office 2, for different window opening strategies (note: glazing and shading were not changed).
Sustainability 07 13169 g010

5. Conclusions

In this study, a detailed TRNSYS model for the simulation of the energy utilization of offices and an indoor environment was defined. The model was verified by comparisons with measurements obtained in the real case pilot offices over the period of one year. An extensive range of simulations using this model was also performed in order to evaluate the different retrofitting concepts, focusing on the transparent part of the building envelope, which have been proposed for office buildings with installed radiant ceiling systems.
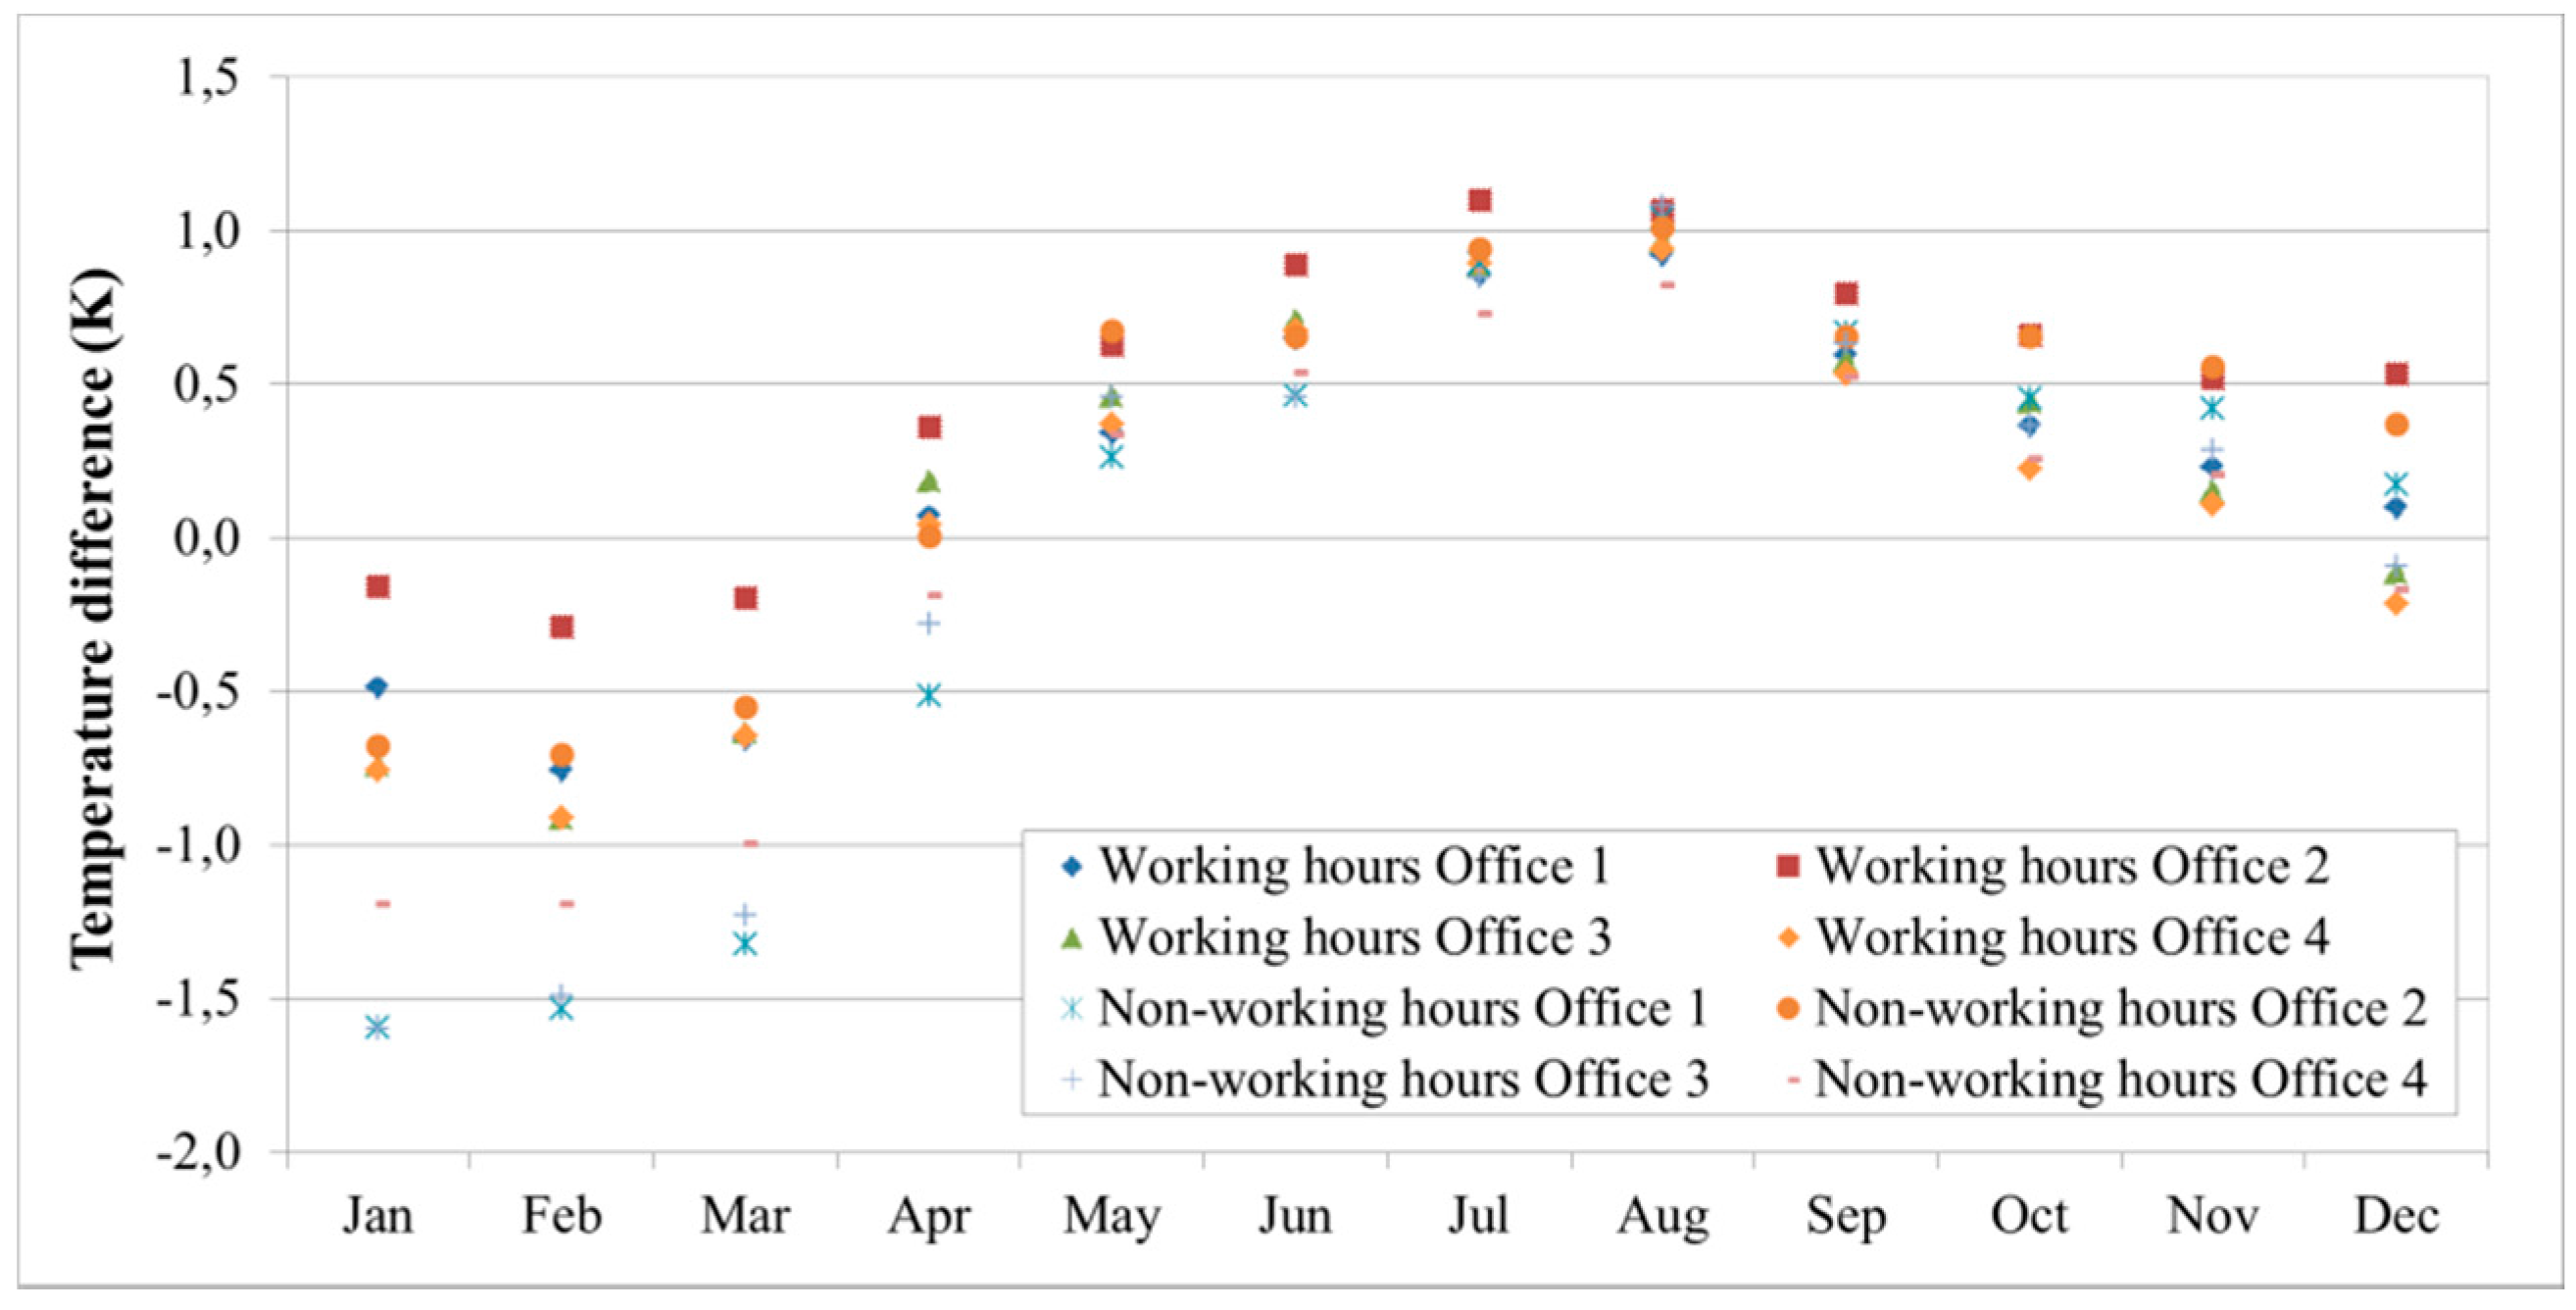
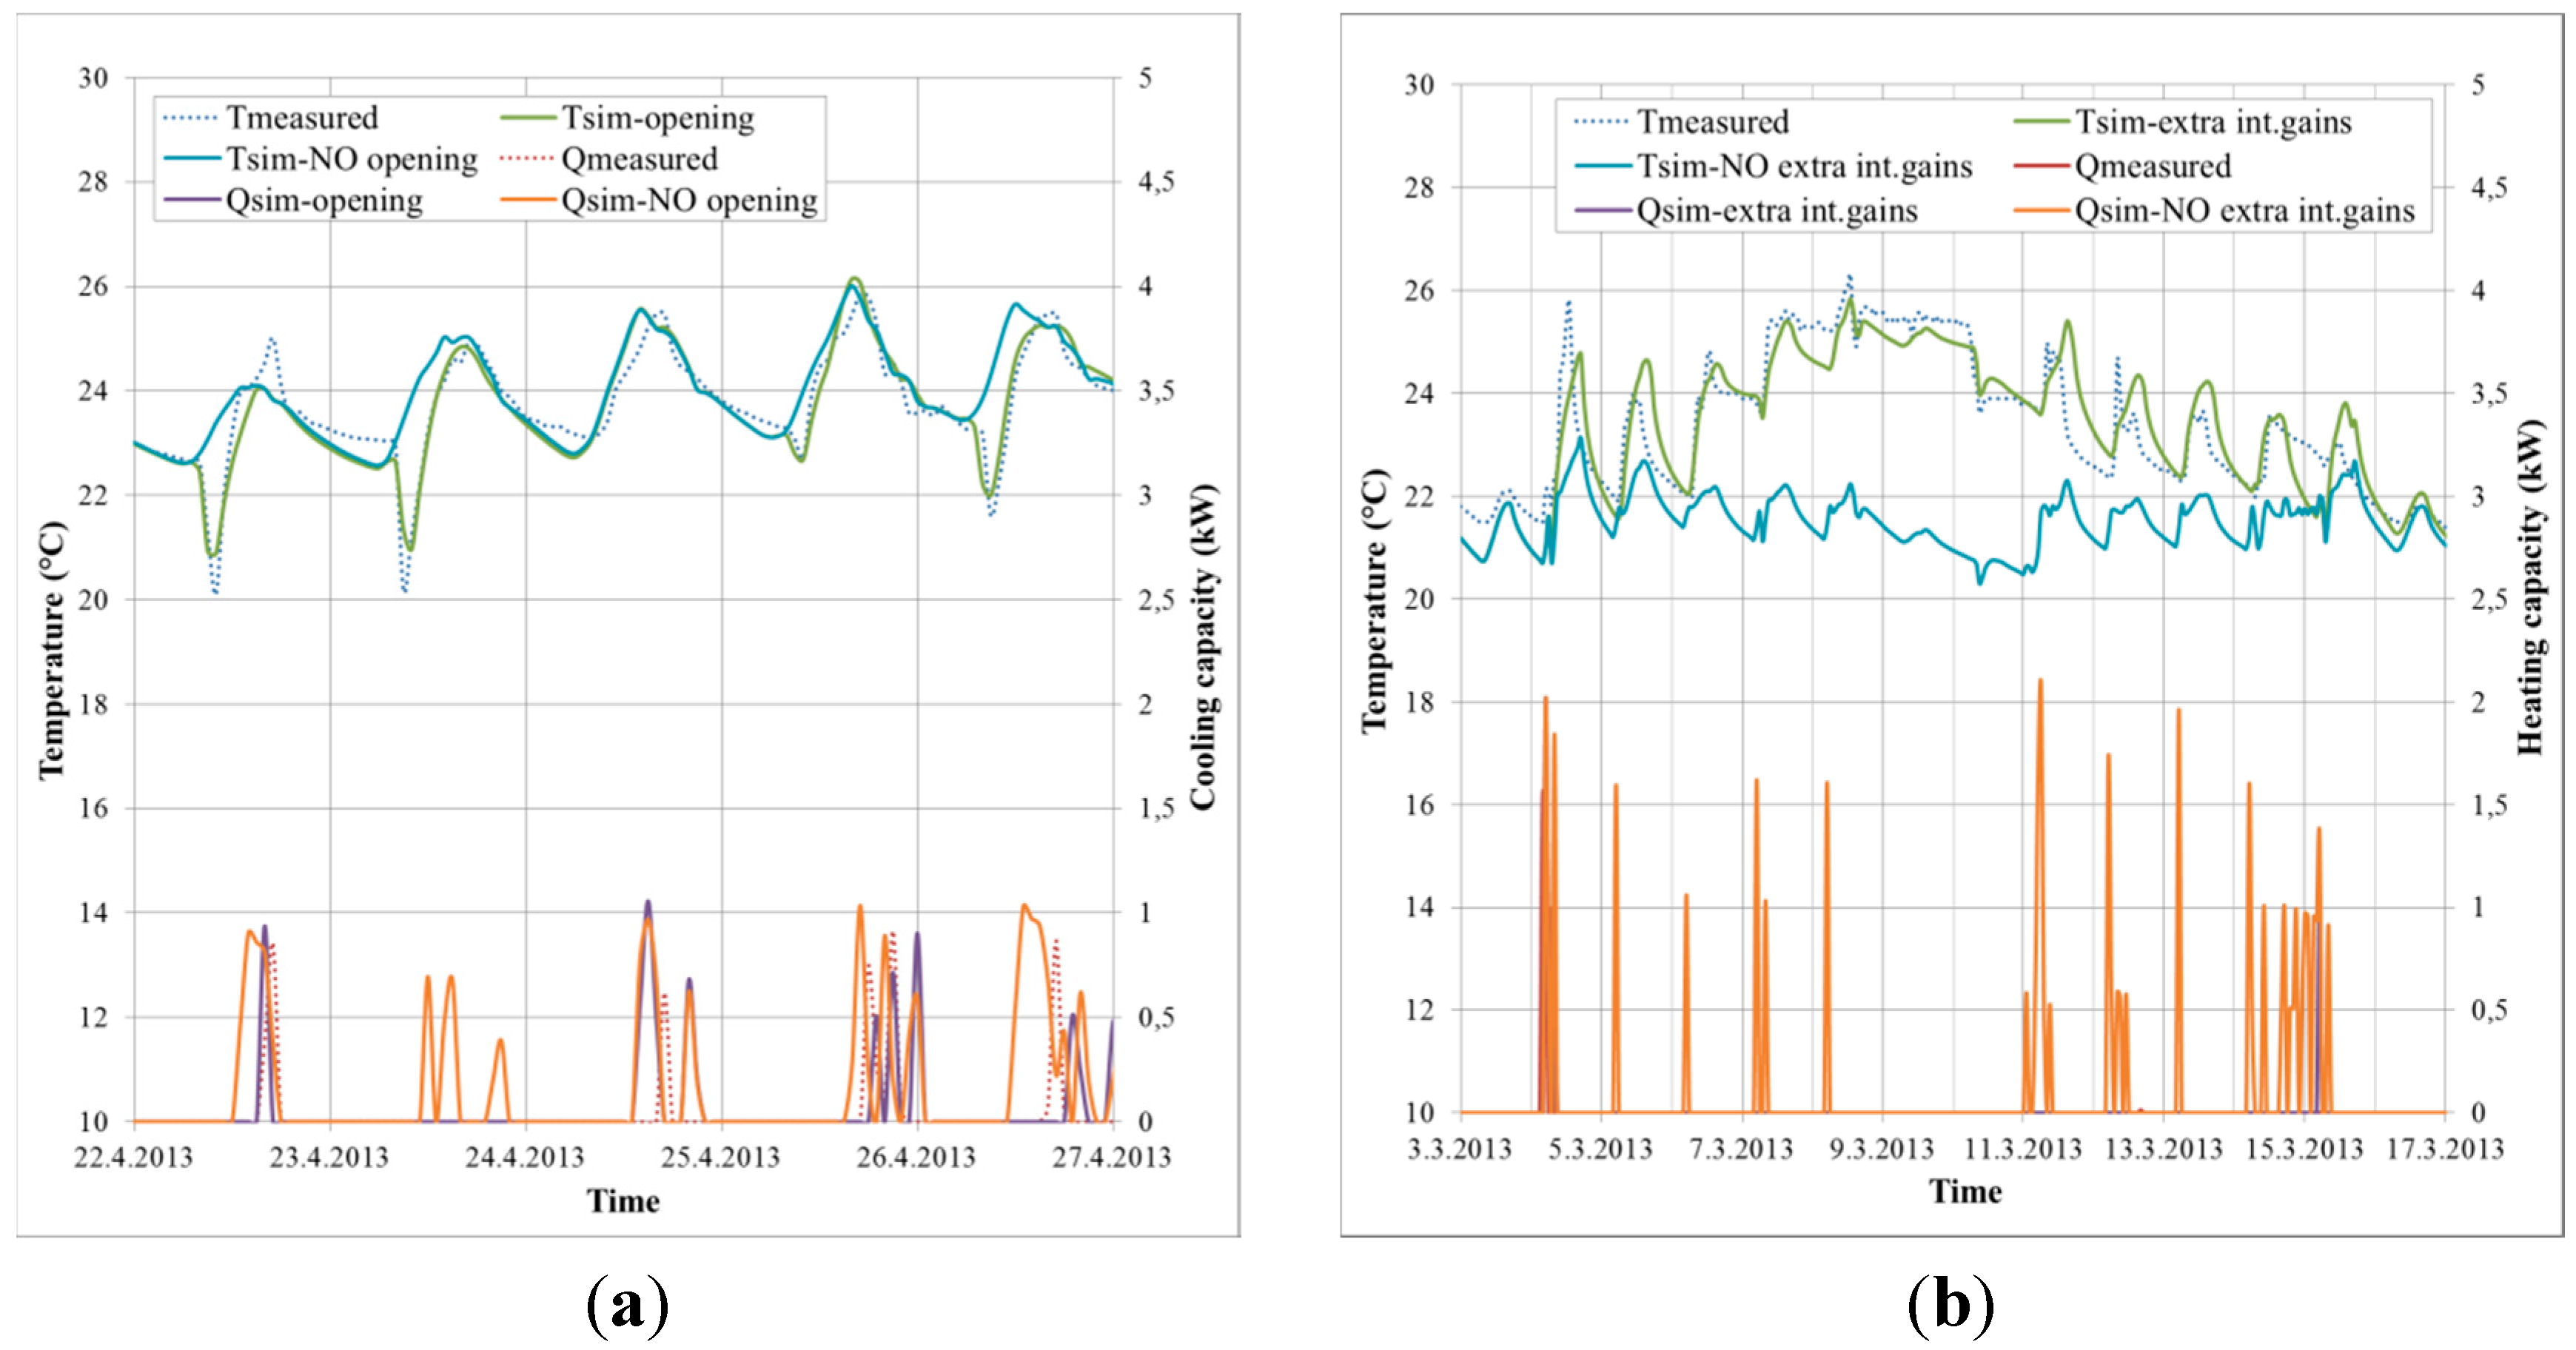
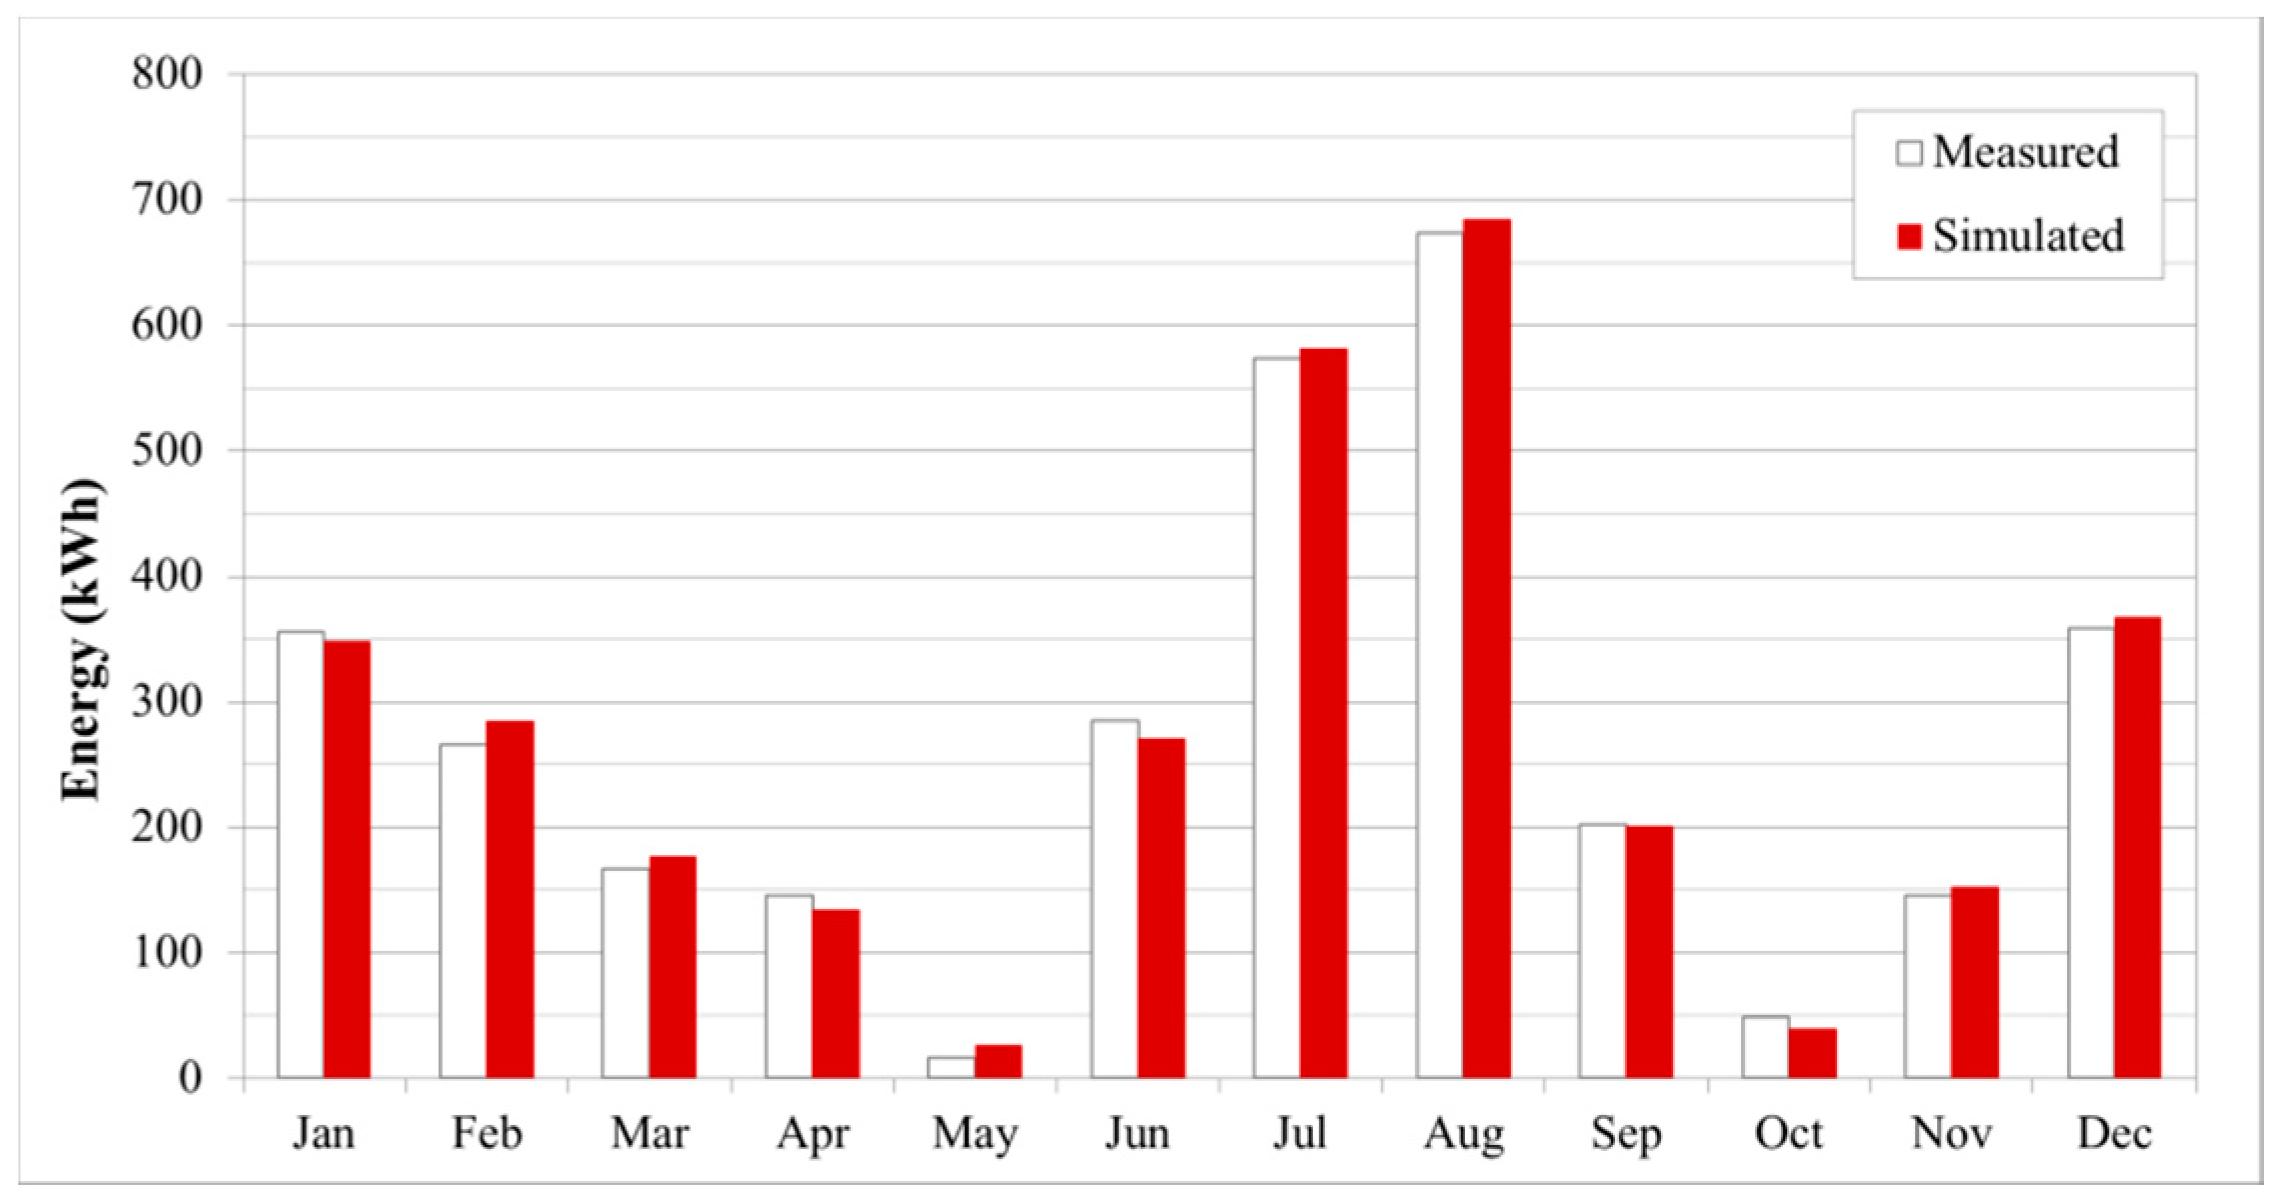
It was found that the model defined by the use of TRNSYS simulated the actual situation in the pilot offices well. Comparisons between the simulated air temperatures that were generated by the model and the air temperatures that were measured by means of temperature sensors clearly showed good correlation in both the heating and the cooling season. The average RMSE of the simulated temperature values was ±0.45 K in the heating season and ±0.58 K in the cooling season. The final MBE percentage for the simulated yearly energy from the panels was −0.8%. This means that the simulated energy was only 0.8% higher than the measured energy. Based on excellent correlation between the measured and the simulated heating and cooling energy, it can be confirmed that the model based on the use of radiant ceiling panels was indeed very accurate.
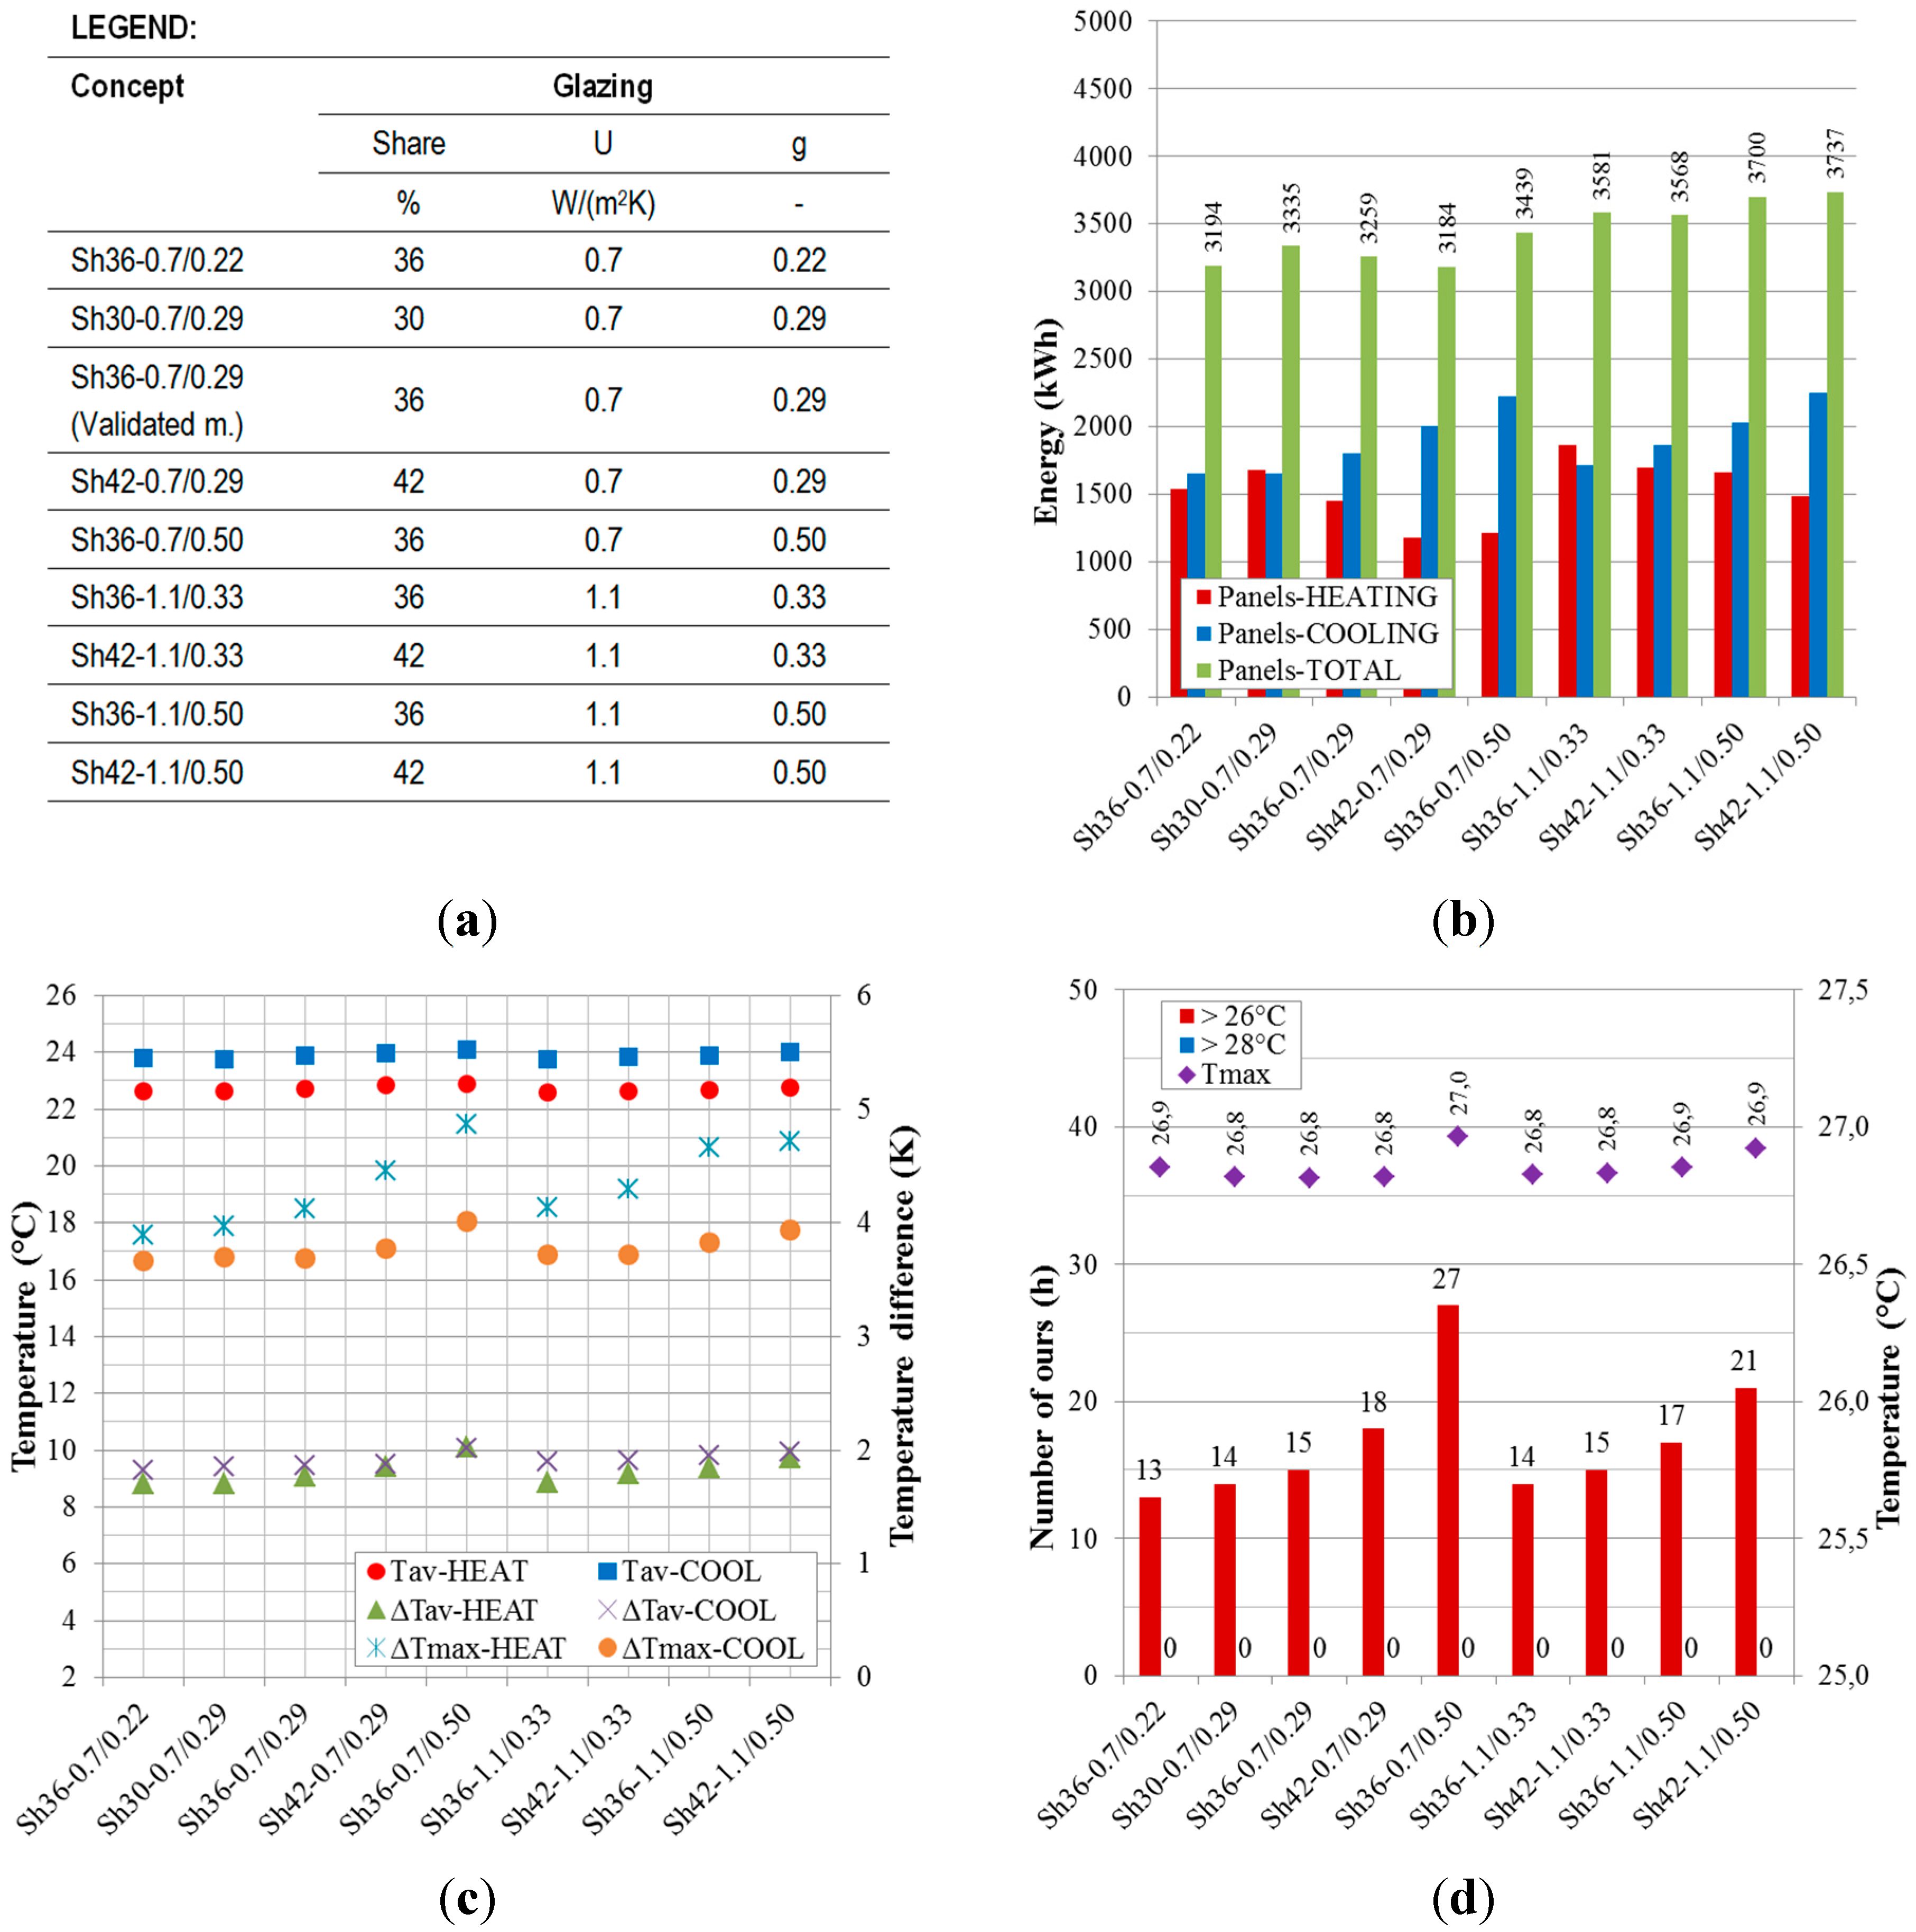
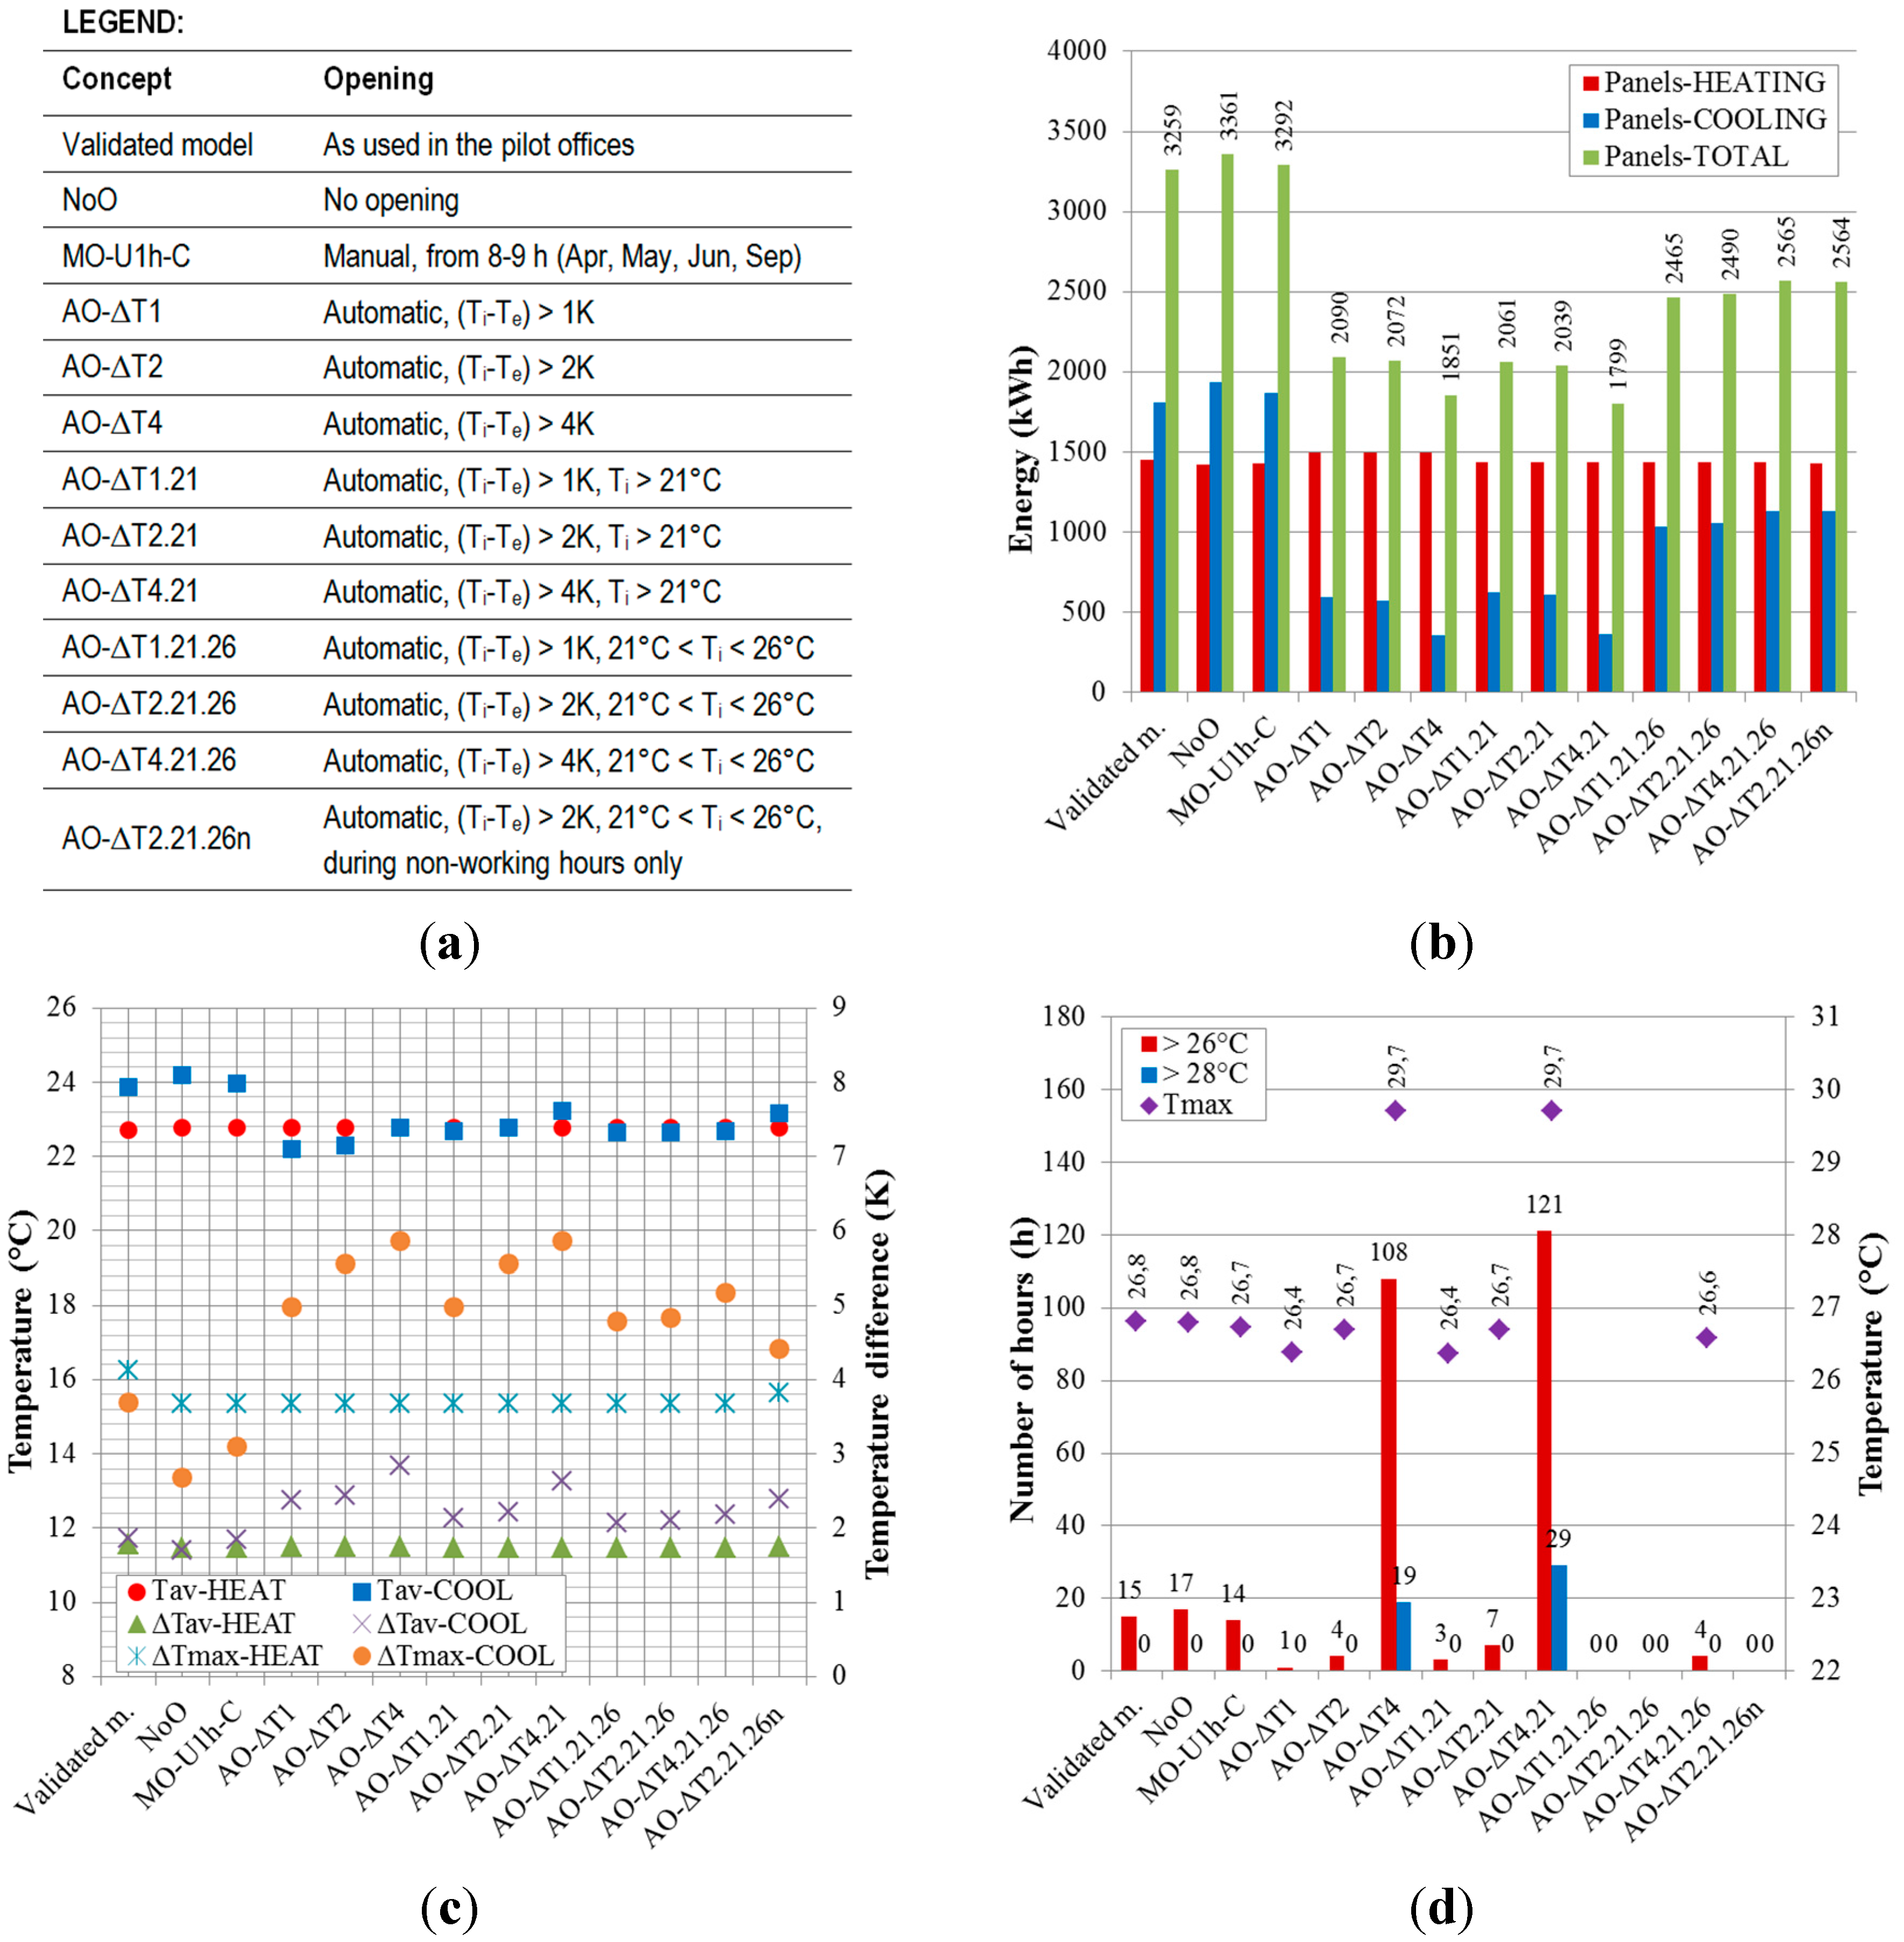
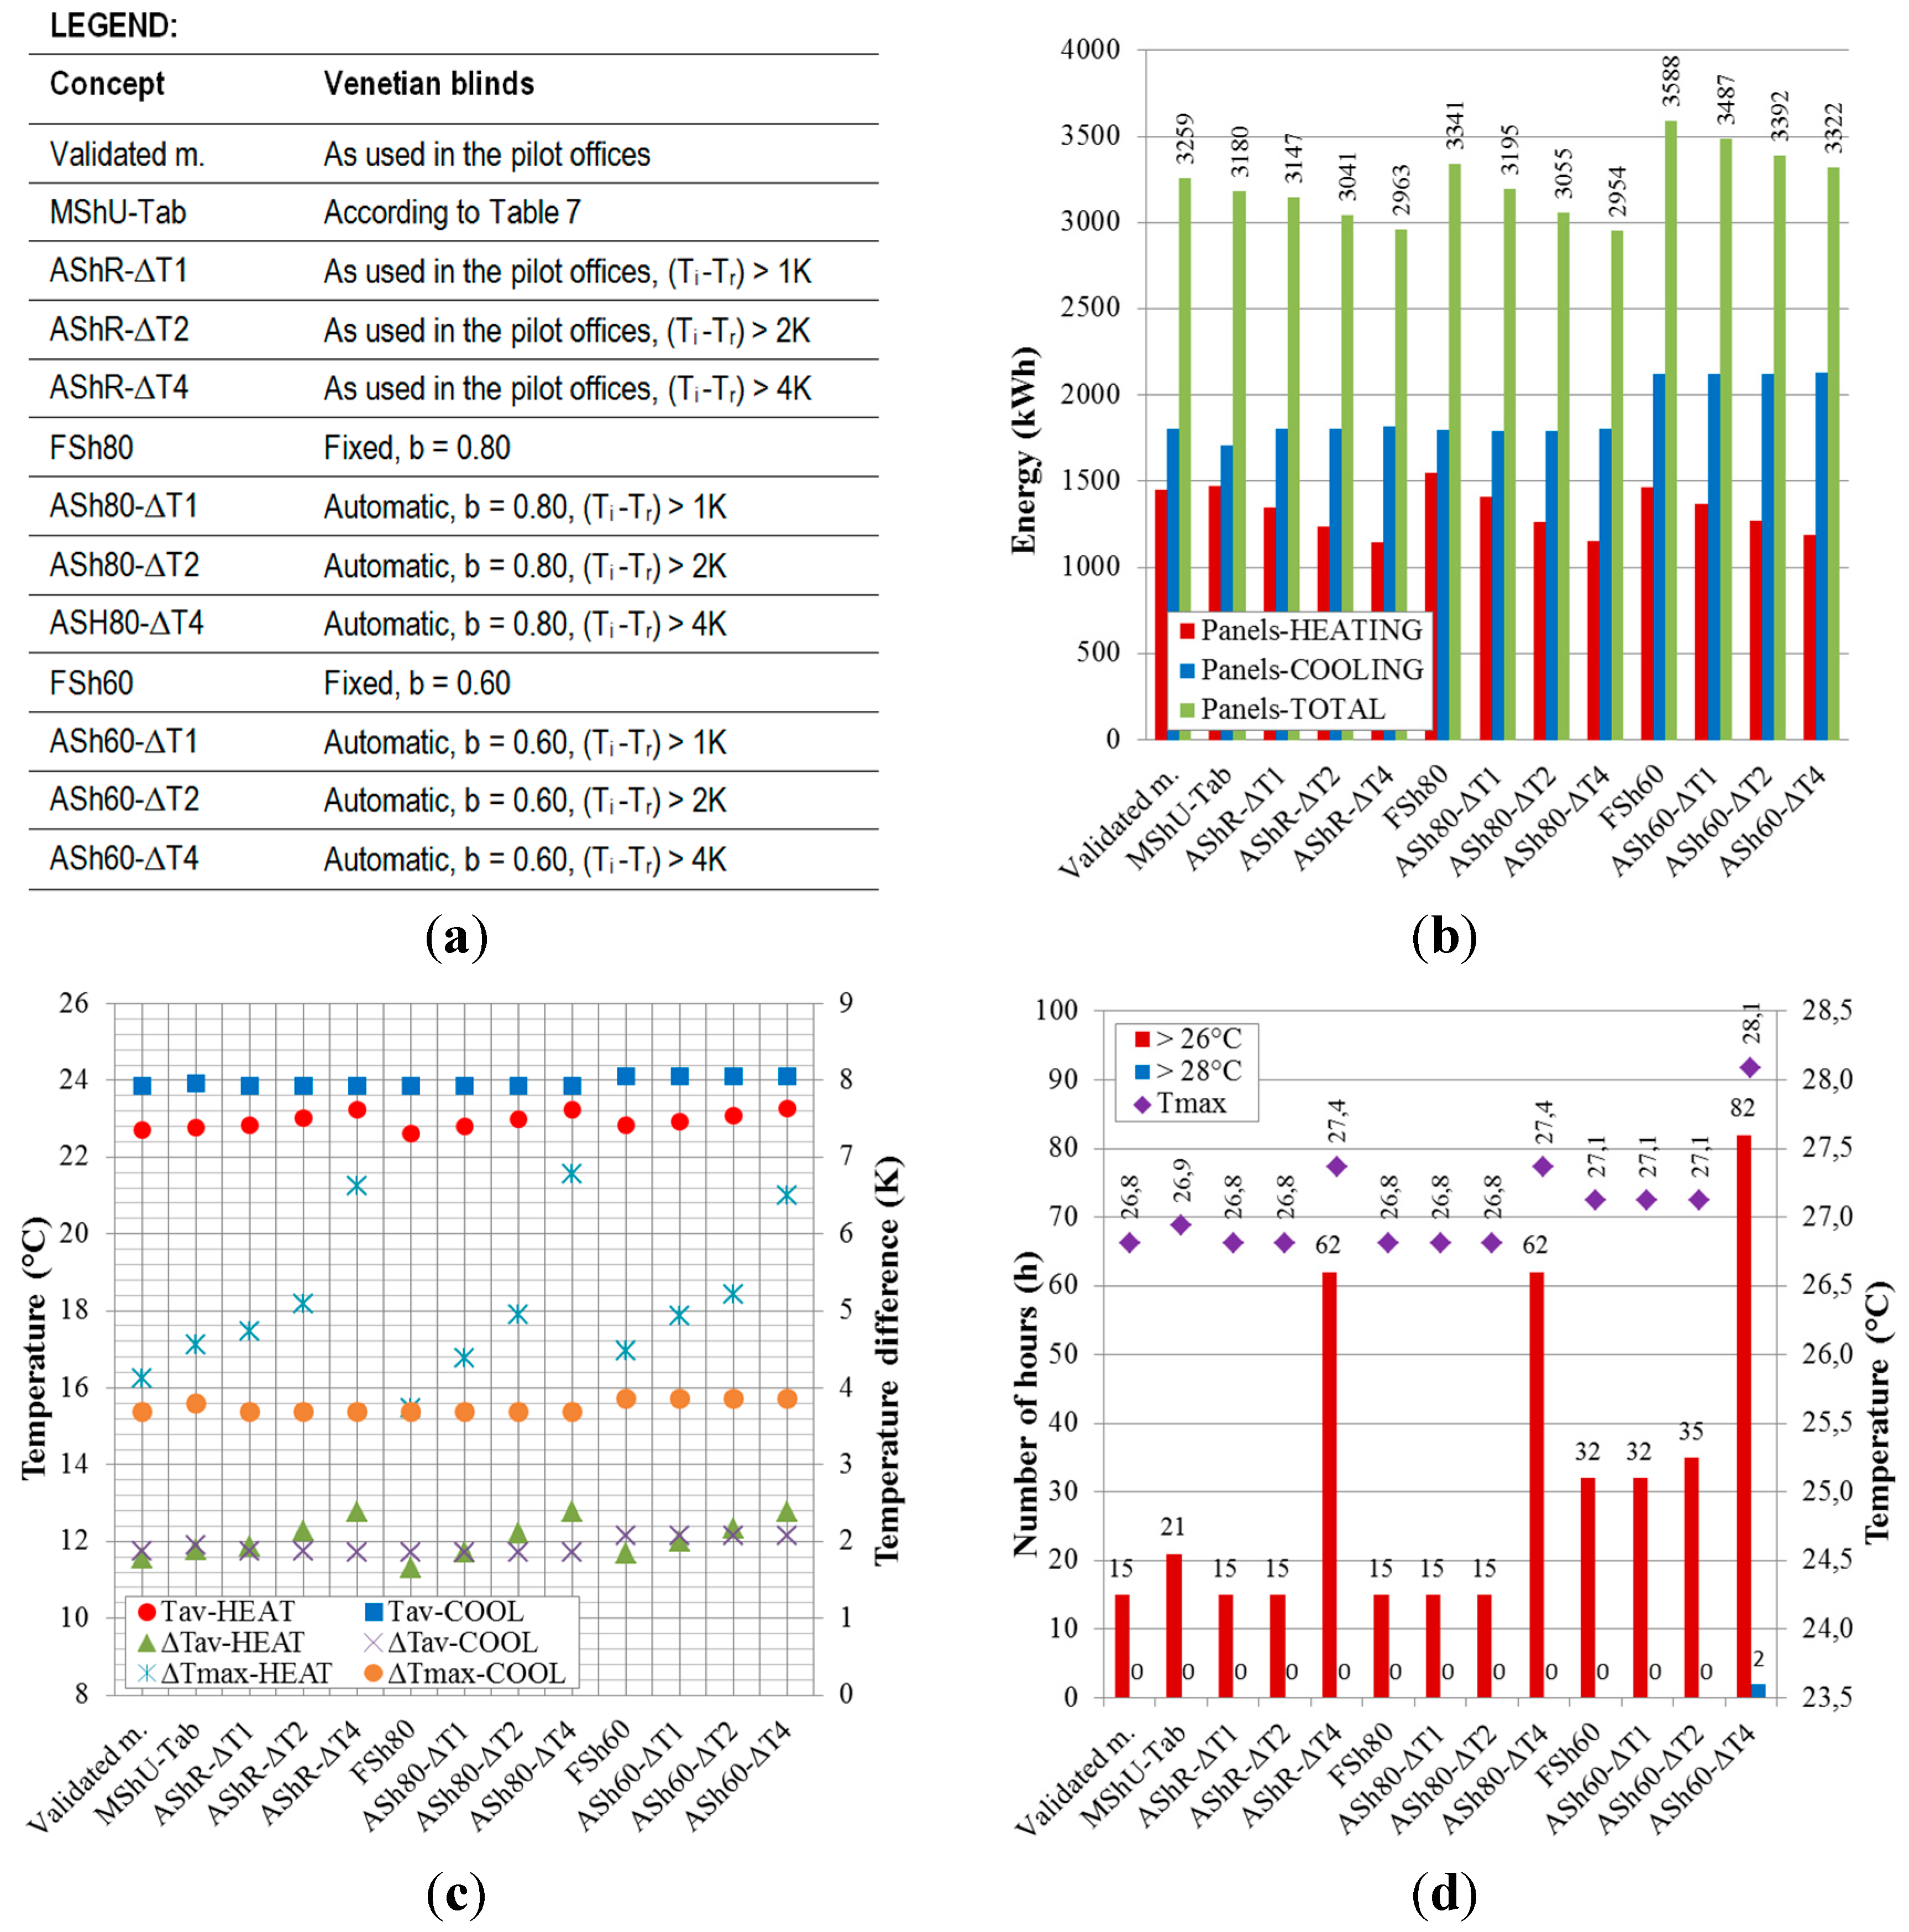
The validated model was then used for the evaluation of different retrofitting concepts for building envelopes. The results of these simulations clearly showed that, without effective shading devices (e.g., venetian blinds), the concepts with radiant ceiling panels cannot, in the case of offices, guarantee thermal comfort in the cooling season. It was therefore concluded that, for concepts of this kind, the use of adjustable shading devices is absolutely necessary, irrespective of any shading provided by a roof. Additionally, it was established that adequate thermal comfort can only be achieved if the façades provide effective shading in combination with glazing with a g-value close to 0.33 or lower. It was also concluded that the use of shading devices with a shading coefficient of less than 0.80 in the cooling season is not to be recommended. In the case of automatic shading, the criterion of 1 K for the difference between the indoor air temperature and the temperature at the room regulator proved to be the most suitable for efficient regulation, which is needed for adequate thermal comfort.
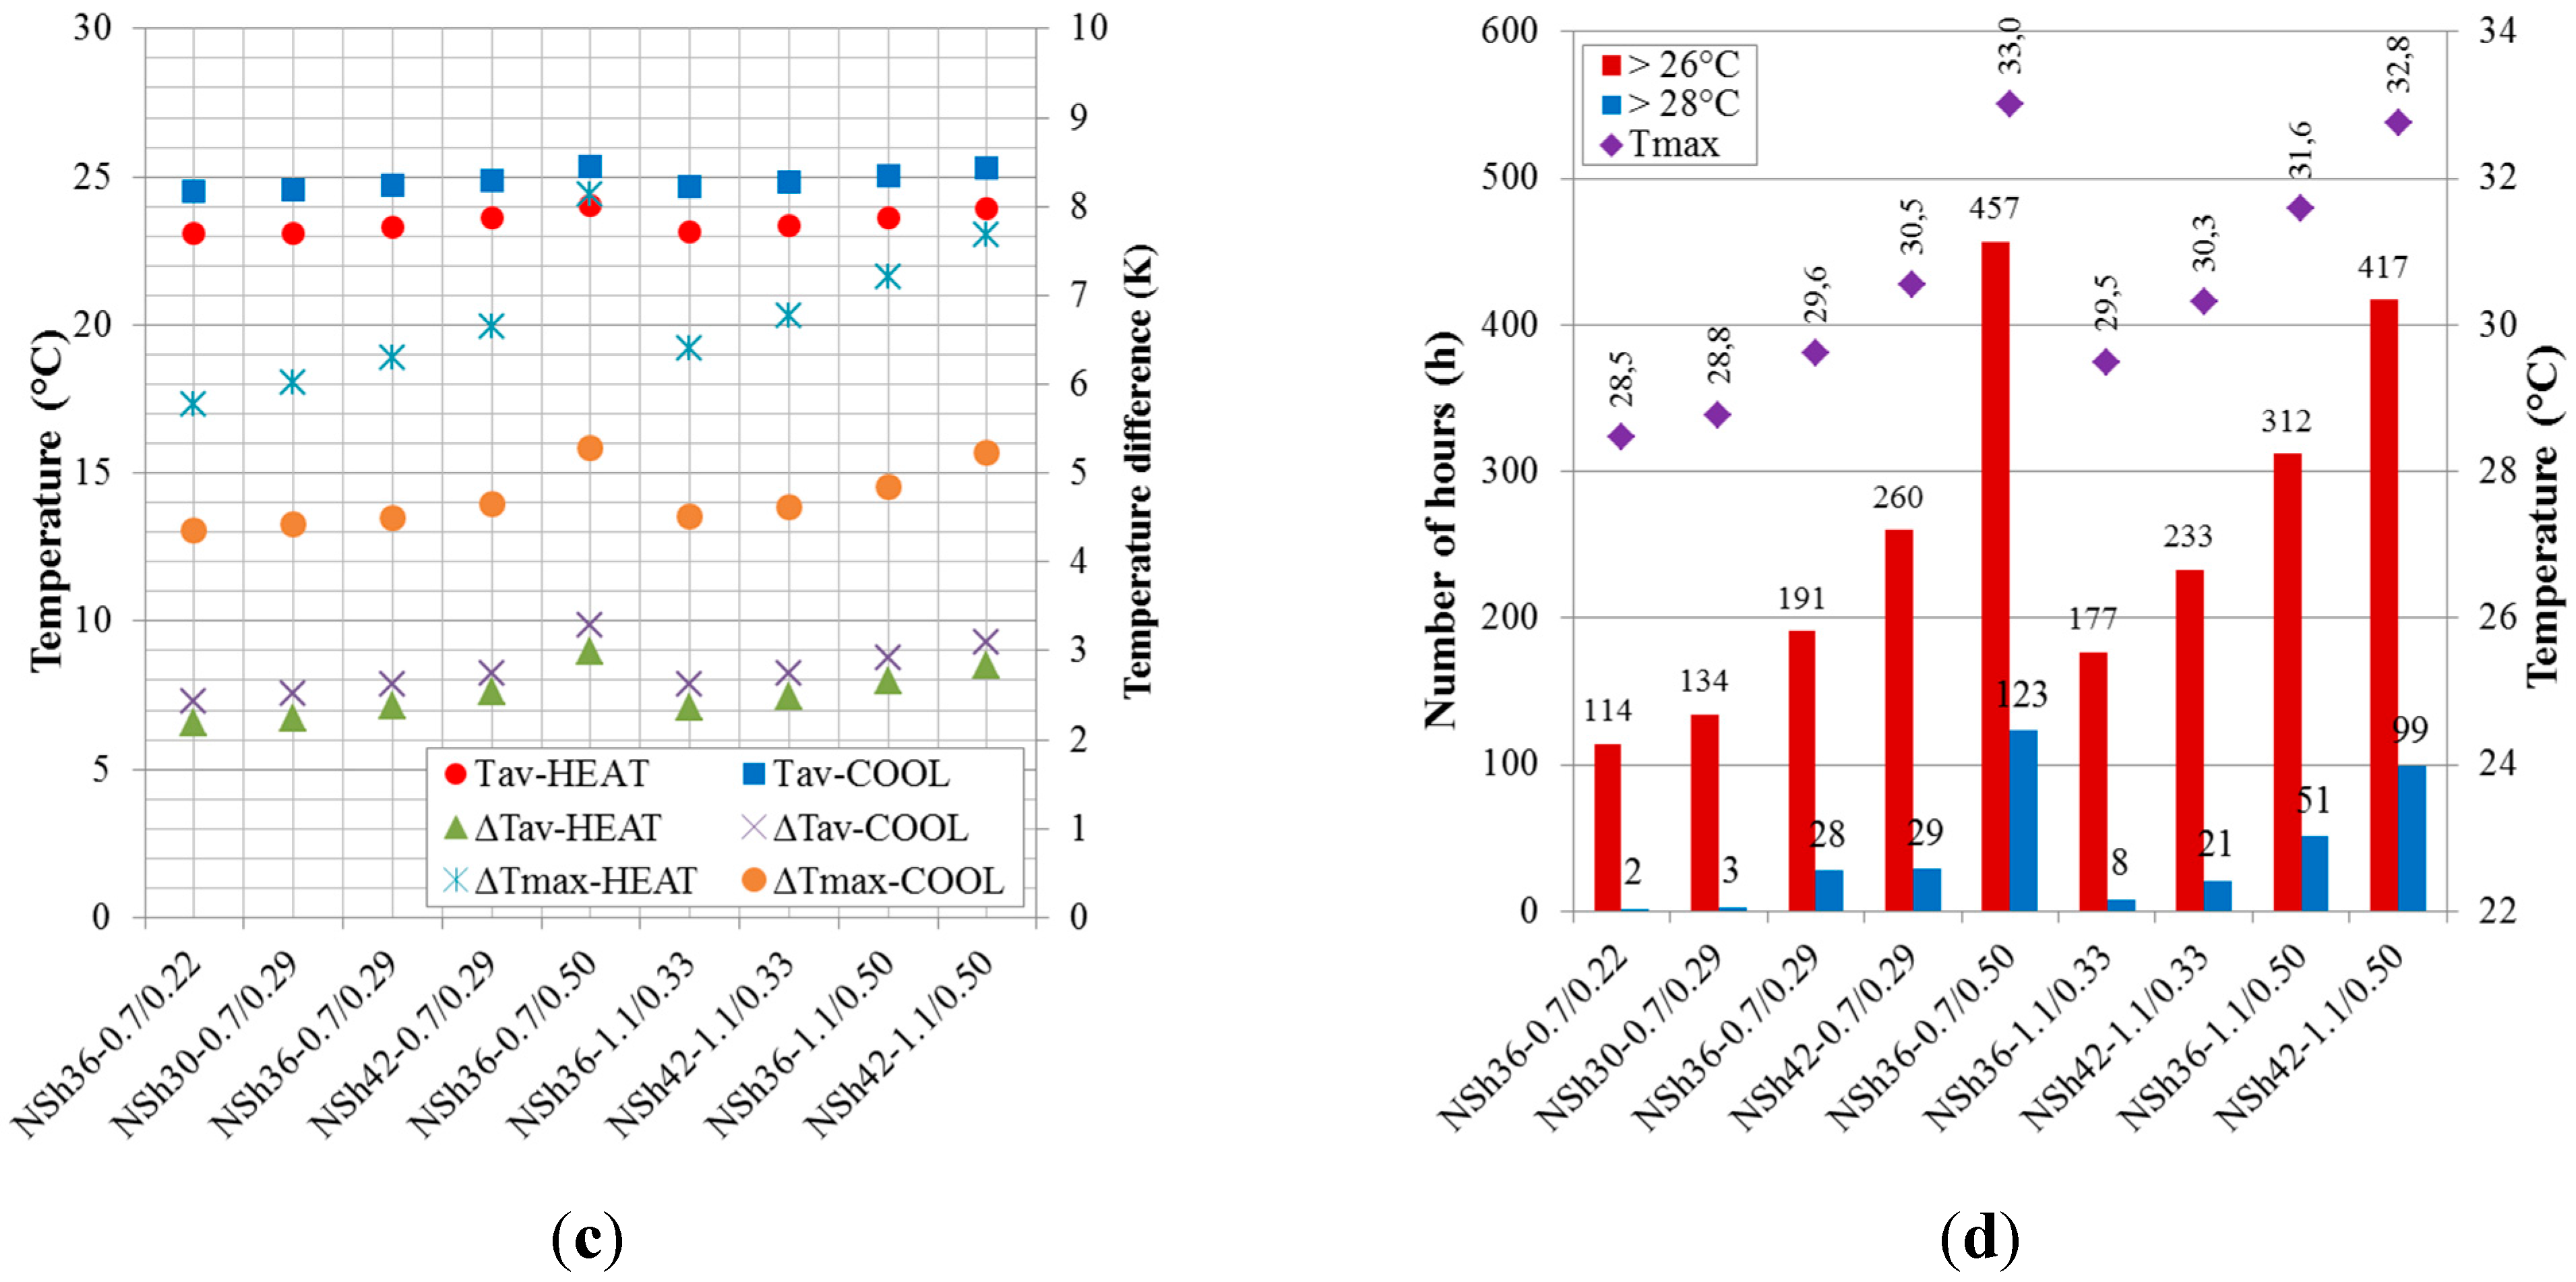
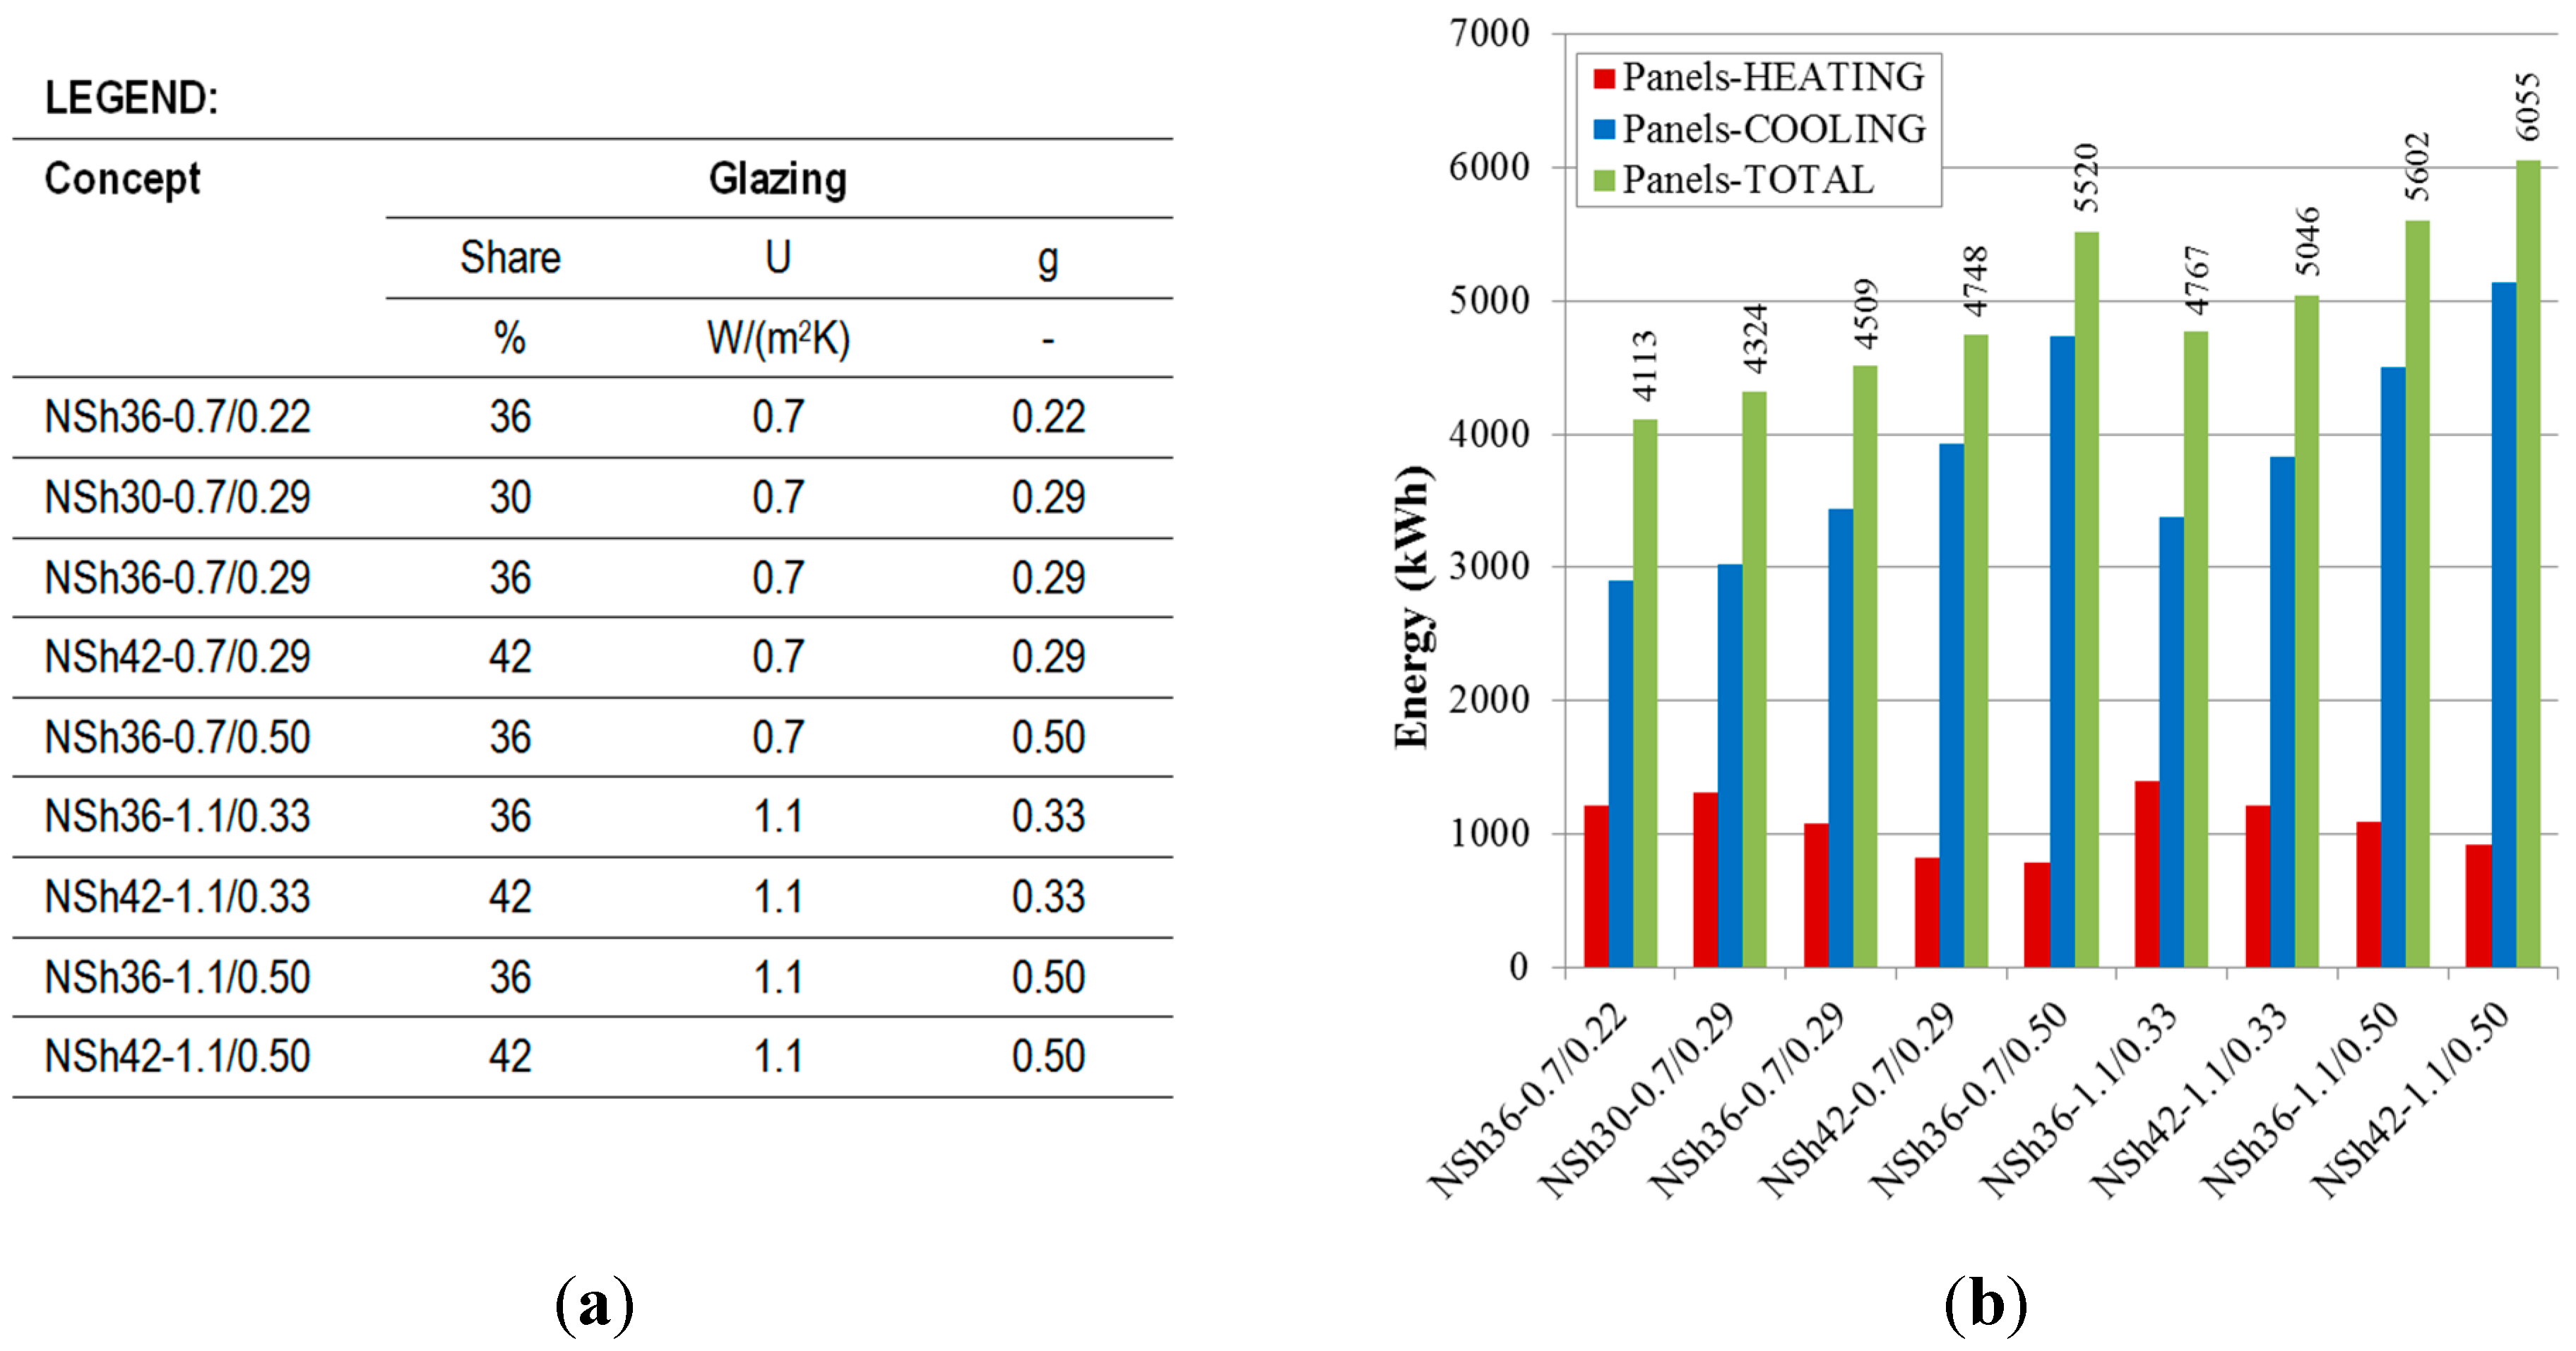
The performed simulations showed that, in terms of the heating and cooling energy use and comfortable indoor air temperatures, the optimal proportion of glazing was roughly 36% of the entire façade. Reduction of this ratio resulted in higher energy utilization for heating and cooling. In the case when the ratio was increased, higher deviations occurred in the average air temperatures, and there was also a significant increase in the air temperature fluctuations. A smaller proportion of glazing of the façade, together with lower g-values and higher shading coefficients of the glazing, would guarantee better thermal comfort in the offices. On the other hand, it is well-known that this would almost certainly reduce the penetration of daylight into such rooms. Further analysis is needed in order to be able to define the optimal combinations between the energy utilization for heating and cooling, appropriate indoor thermal conditions, and sufficient daylight illumination.
The results of the present study confirmed the validity of the hypothesis that strategies for window opening in the cooling period can considerably influence building performance in the case of the proposed retrofitting concepts. Actually, a decrease in the average air temperatures, in combination with an increase in indoor air temperature fluctuations, was detected. The analysis also revealed that these temperature fluctuations can be partly minimized when the following temperature conditions for opening the window are used: an indoor air temperature 2 K higher than the outdoor temperature, and an indoor air temperature between 21 °C and 26 °C, and opening during non-working hours only. It was also established that strategies for window opening, using such reasonable parameters, can considerably reduce the energy utilization needed for cooling.
The results of the study have also clearly showed that a comprehensive TRNSYS model can reliably evaluate various retrofitting concepts of building envelopes for offices. Dynamic simulations have reflected the indoor environment of the retrofitted offices, and have made it possible to determine the benefits and limitations of individual design concepts. It is expected that, with certain modifications, this model could be effectively applied for the evaluations of concepts that could be used in other climatic environments.

Acknowledgments

The authors are grateful for the financial support provided by the EU for the execution of the pilot offices at ZAG through the EU project Cost Effective (Resource- and Cost-Effective Integration of Renewables in Existing High-Rise Buildings, 7FP, 2008–2012).

Author Contributions

Sabina Jordan conceived and performed the research work, helped to perform the simulations, analyzed the data, and wrote the paper. Jože Hafner performed the simulations and did the data checking. Tilmann E. Kuhn provided advice during the process and contributed to the overall quality of the paper. Andraž Legat contributed through supervision of the simulations and analyses, and in helping to write and modify the paper. Martina Zbašnik-Senegačnik supervised the research work, and helped to modify the paper. All the authors revised, read, and approved the final manuscript.

Conflicts of Interest

The authors declare that they have no conflict of interest.

References

  1. Hoppe, P.; Martinac, I. Indoor climate and air quality. Int. J. Biometeorol. 1998, 42, 1–7. [Google Scholar] [PubMed]
  2. European Environment Agency. Indoor air quality, EEA Report No 5/2013 Environment and human health. 2013. Available online: http://www.eea.europa.eu/publications/environment-and-human-health (accessed on 17 July 2015).
  3. World Health Organization Regional Office Europe. The Right to Healthy Indoor Air. 2000. Available online: http://www.euro.who.int/__data/assets/pdf_file/0019/117316/E69828.pdf (accessed on 17 July 2015).
  4. European Commission, Cost-Effective. Integrated concepts—Catalogue of technical composition (WP4), 2008–2012. 2012. Available online: http://www.cost-effective-renewables.eu/includes/images/Publications/Files/946c57310919347b2ab1a1db05adec11.pdf (accessed on 17 July 2015).
  5. European Commission, Cost-Effective. Integrated concepts—Construction aspects (WP4), 2008–2012. 2012. Available online: http://www.cost-effective-renewables.eu/includes/images/Publications/Files/0791734e07bacdacbb4e2c44a7e8c77e.pdf (accessed on 17 July 2015).
  6. Praznik, M.; Butala, V.; Zbašnik-Senegačnik, M. Simplified evaluation method for energy efficiency in single-family houses using key quality parameters. Energy Build. 2013, 67, 489–499. [Google Scholar] [CrossRef]
  7. Azinović, B.; Koren, D.; Kilar, V. Principles of energy efficient construction and their influence on the seismic resistance of light-weight buildings. Open Eng. J. 2014, 8, 105–116. [Google Scholar] [CrossRef]
  8. Azinović, B.; Koren, D.; Kilar, V. The seismic response of low-energy buildings founded on a thermal insulation layer—A parametric study. Eng. Struct. 2014, 81, 398–411. [Google Scholar] [CrossRef]
  9. Jordan, S.; Hafner, J.; Zbašnik-Senegačnik, M.; Legat, A.; Knez, F. Efficient energy use and thermal comfort in the retrofitted pilot offices equipped with radiant ceiling panels. In Proceedings of 24th Scientific Conference on Energy and the Environment, Opatija, Croatia, 22–24 October 2014.
  10. Fonseca-Diaz, N. Modelling of a hydronic ceiling system and its environment as energetic auditing tool. Appl. Energy 2011, 88, 636–649. [Google Scholar] [CrossRef]
  11. Imanari, T.; Omori, T.; Bogaki, K. Thermal comfort and energy consumption of the radiant ceiling panel system: Comparison with the conventional all-air system. Energy Build. 1999, 30, 167–175. [Google Scholar] [CrossRef]
  12. Miriel, J.; Serres, L.; Trombe, A. Radiant ceiling panel heating-cooling systems: Experimental and simulated study of the performances, thermal comfort and energy consumption. Appl. Therm. Eng. 2002, 22, 1861–1873. [Google Scholar] [CrossRef]
  13. Saelens, D.; Parys, W.; Baetens, R. Energy and comfort performance of thermally activated building systems including occupant behaviour. Build. Environ. 2011, 46, 835–848. [Google Scholar] [CrossRef]
  14. Buratti, C.; Moretti, E.; Belloni, E.; Cotana, F. Unsteady simulations of energy performance and thermal comfort in non-residential buildings. Build. Environ. 2013, 59, 482–491. [Google Scholar] [CrossRef]
  15. Lehmann, B.; Guttinger, H.; Dorer, V.; van Velsen, S.; Thiemann, A.; Frank, T. Eawag Forum Chriesbach—Simulation and measurement of energy performance and comfort in a sustainable office building. Energy Build. 2010, 42, 1958–1967. [Google Scholar] [CrossRef]
  16. Buonomano, A.; Palombo, A. Building energy performance analysis by an in-house developed dynamic simulation code: An investigation for different case studies. Appl. Energy 2014, 113, 788–807. [Google Scholar] [CrossRef]
  17. Causone, F.; Corgnati, S.P.; Filippi, M.; Olesen, B.W. Solar radiation and cooling load calculation for radiant systems definition and evaluation of direct solar load. Energy Build. 2010, 42, 305–314. [Google Scholar] [CrossRef]
  18. Venko, S.; Vidal de Ventos, D.; Arkar, C.; Medved, S. An experimental study of natural and mixed convection over cooled vertical room wall. Energy Build. 2014, 68, 387–395. [Google Scholar] [CrossRef]
  19. Rahimi, M.; Sabernaeemi, A. Experimental study of radiation and free convection in an enclosure with a radiant ceiling heating system. Energy Build. 2010, 42, 2077–2082. [Google Scholar] [CrossRef]
  20. Lehmann, B.; Dorer, V.; Koschenz, M. Application range of thermally activated building systems tabs. Energy Build. 2007, 39, 593–598. [Google Scholar] [CrossRef]
  21. Andres-Chicote, M.; Tejero-Gonzales, A.; Velasco-Gomez, E.; Rey-Martinez, F. Experimental study on the cooling capacity of a radiant cooled ceiling system. Energy Build. 2012, 54, 207–214. [Google Scholar] [CrossRef]
  22. Jeong, J.W.; Mumma, S.A. Practical cooling capacity estimation model for a suspended metal ceiling radiant panel. Build. Environ. 2007, 42, 3176–3185. [Google Scholar] [CrossRef]
  23. Tian, Z.; Yin, X.; Ding, Y.; Zhang, C. Research on the actual cooling performance of ceiling radiant panel. Energy Build. 2012, 47, 636–642. [Google Scholar] [CrossRef]
  24. Fonseca-Diaz, N.; Lebrun, J.; Philippe, A. Experimental study and modelling of cooling ceiling systems using steady-state analysis. Int. J. Refrig. 2010, 33, 793–805. [Google Scholar] [CrossRef]
  25. Fonseca, N.; Cuevas, C.; Lemort, V. Radiant ceiling systems coupled to its environment part 1: Experimental analysis. Appl. Therm. Eng. 2010, 30, 2187–2195. [Google Scholar] [CrossRef]
  26. Solar Energy Laboratory. TRNSYS 17 Documentation; University of Wisconsin-Madison: Madison, WI, USA, 2012. [Google Scholar]
  27. Arcuri, N.; Bruno, R.; Bevilacqua, P. Influence of the optical and geometrical properties of indoor environments for the thermal performances of chilled ceilings. Energy Build. 2015, 88, 229–237. [Google Scholar] [CrossRef]
  28. Bonte, M.; Thellier, F.; Lartigue, B. Impact of occupants actions on energy building performance and thermal sensation. Energy Build. 2014, 76, 219–227. [Google Scholar] [CrossRef]
  29. Oxizidis, S.; Papadopoulus, A.M. Performance of radiant cooling surfaces with respect to energy consumption and thermal comfort. Energy Build. 2013, 57, 199–209. [Google Scholar] [CrossRef]
  30. Tian, Z.; Love, J.A. Energy performance optimization of radiant slab cooling using building simulation and field measurements. Energy Build. 2009, 41, 320–330. [Google Scholar] [CrossRef]
  31. European Commission, Cost-Effective. Final Publishable Summary Report (WP0), 2008–2012. 2012. Available online: http://www.cost-effective-renewables.eu/includes/images/Publications/Files/79abeb4933e416db3960d9592c938ce3.pdf (accessed on 17 July 2015).
  32. Jordan, S. Ogrevanje in hlajenje na sončno energijo-projekt ZAG/ZAG project: Heating and cooling using solar energy. Gradb. Trajnostna Grad. 2013, 2, 40–43. (In Slovenian) [Google Scholar]
  33. Jordan, S.; Kuhn, T.E. Ljubljana’s Pilot Demonstration in EU Project Cost Effective. In Proceedings of the World Engineering Forum 2012 Sustainable Construction for People, Ljubljana, Slovenia, 17–21 September 2012.
  34. SIST EN 13829. Thermal Performance of Buildings—Determination of Air Permeability of Buildings—Fan Pressurization Method, SIST; Slovenian Institute for Standardization: Ljubljana, Slovenia, 2001. [Google Scholar]
  35. Ministry RS of Environment and Spatial Planning. TSG-1-004 Učinkovita Raba Energije/Efficient Use of Energy. 2010. Available online: http://www.mzip.gov.si/fileadmin/mzip.gov.si/pageuploads/zakonodaja/graditev/TSG-01-004_2010.pdf (accessed on 3 August 2010). [Google Scholar]
  36. Official Gazette of RS No. 52/2010. Pravilnik o Učinkoviti rabi Energije PURES/Rules on Energy Efficiency PURES. 2010. Available online: http://www.uradni-list.si/1/objava.jsp?urlid=201052&stevilka=2856 (accessed on 26 November 2009).
  37. Slovenian Environment Agency. Weather Portal, Podnebje/Climate. Available online: http://www.arso.gov.si (accessed on 7 October 2014).
  38. SIST EN ISO 7730. Ergonomics of the Thermal Environment—Analytical Determination and Interpretation of Thermal Comfort Using Calculation of the PMV and PPD Indices and Local Thermal Comfort Criteria, SIST; Slovenian Institute for Standardization: Ljubljana, Slovenia, 2006. [Google Scholar]
  39. EVO. International Performance Measurement and Verification Protocol, Concepts and Options for Determining Energy and Water Savings. Available online: http://www.evo-world.org/index.php?lang=en (accessed on 6 November 2014).
  40. Webster, L.; Bradford, J. FEMP M&V Guidelines: Measurement and Verification for Federal Energy Projects, Version 3.0. 2008. Available online: http://mnv.lbl.gov/keyMnVDocs/femp (accessed on 27 August 2014). [Google Scholar]
  41. Official Gazette of RS No. 89/1999. Pravilnik o Zahtevah za Zagotavljanje Varnosti in Zdravja Delavcev na Delovnih Mestih/Rules on the Requirements for Ensuring the Safety and Health of Workers at the Workplace. 1999. Available online: https://www.uradni-list.si/1/content?id=22542 (accessed on 26 January 2015).
  42. Carletti, C.; Sciurpi, F.; Pierangioli, L. The energy upgrading of existing buildings: Window and shading device typologies for energy efficiency refurbishment. Sustainability 2014, 6, 5354–5377. [Google Scholar] [CrossRef]

