
Sustainable Urban External Service Function Development for Building the International Megalopolis in the Pearl River Delta, China

Abstract
:1. Introduction
2. Methods
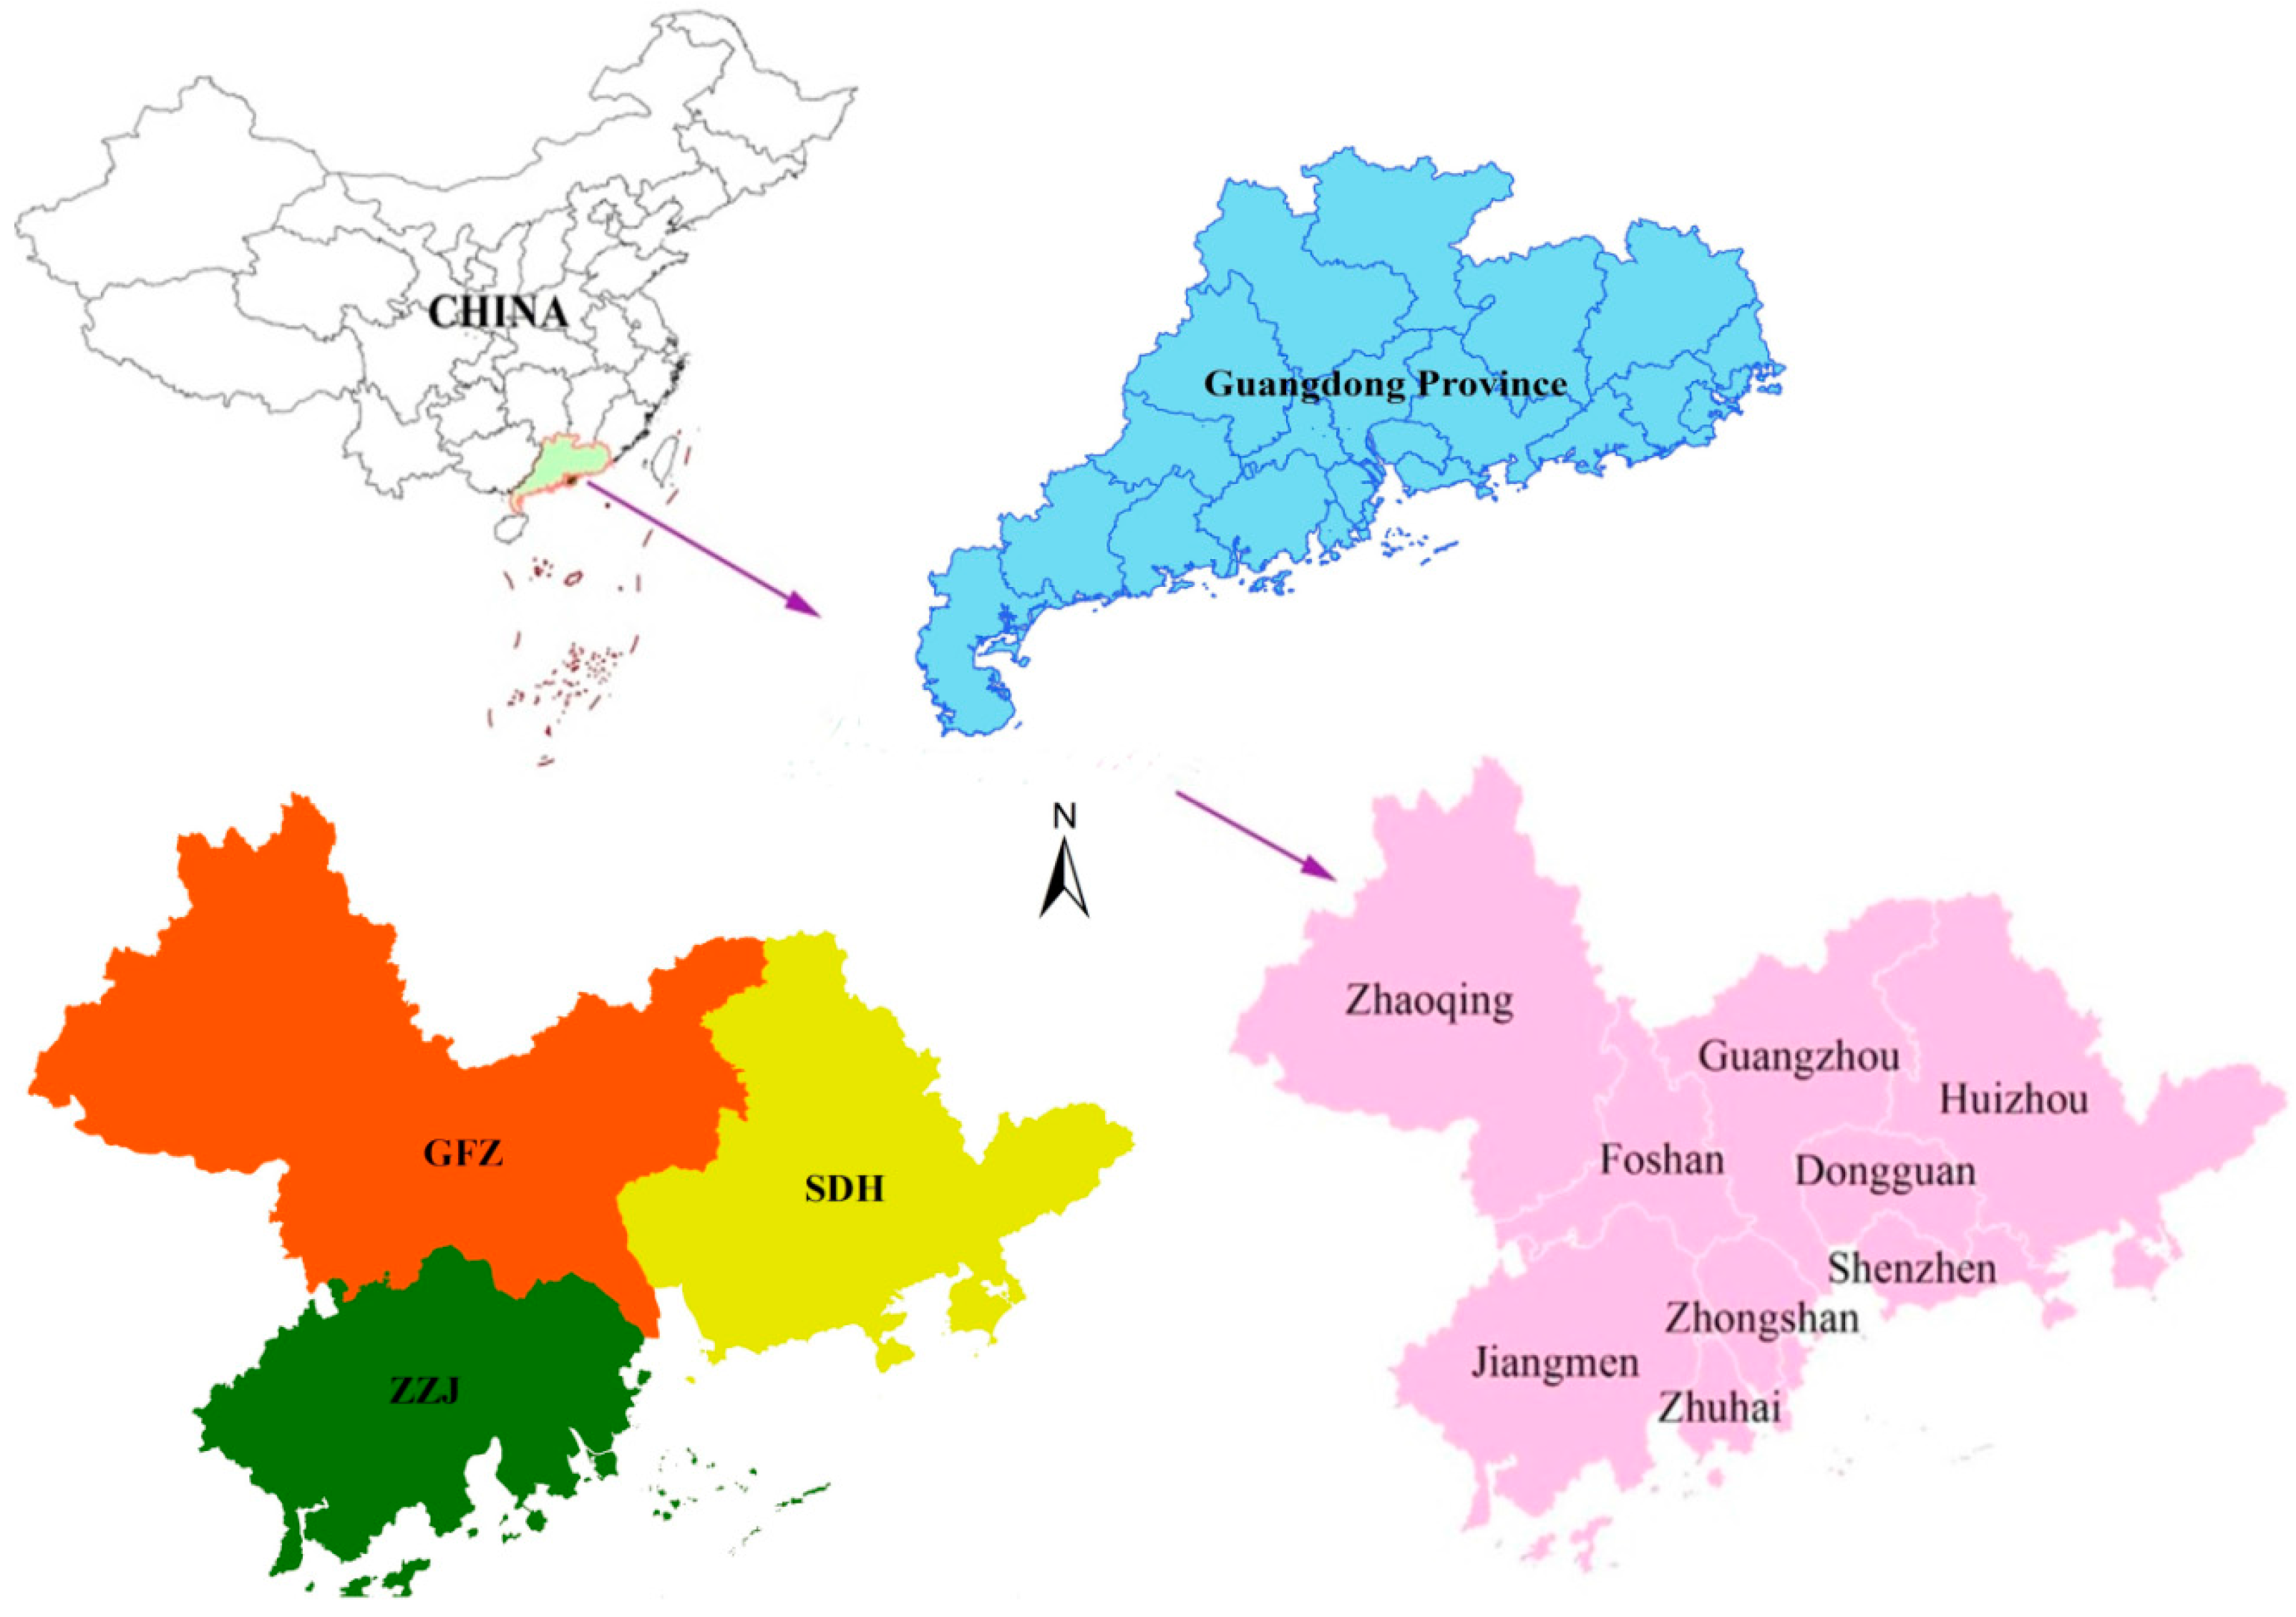
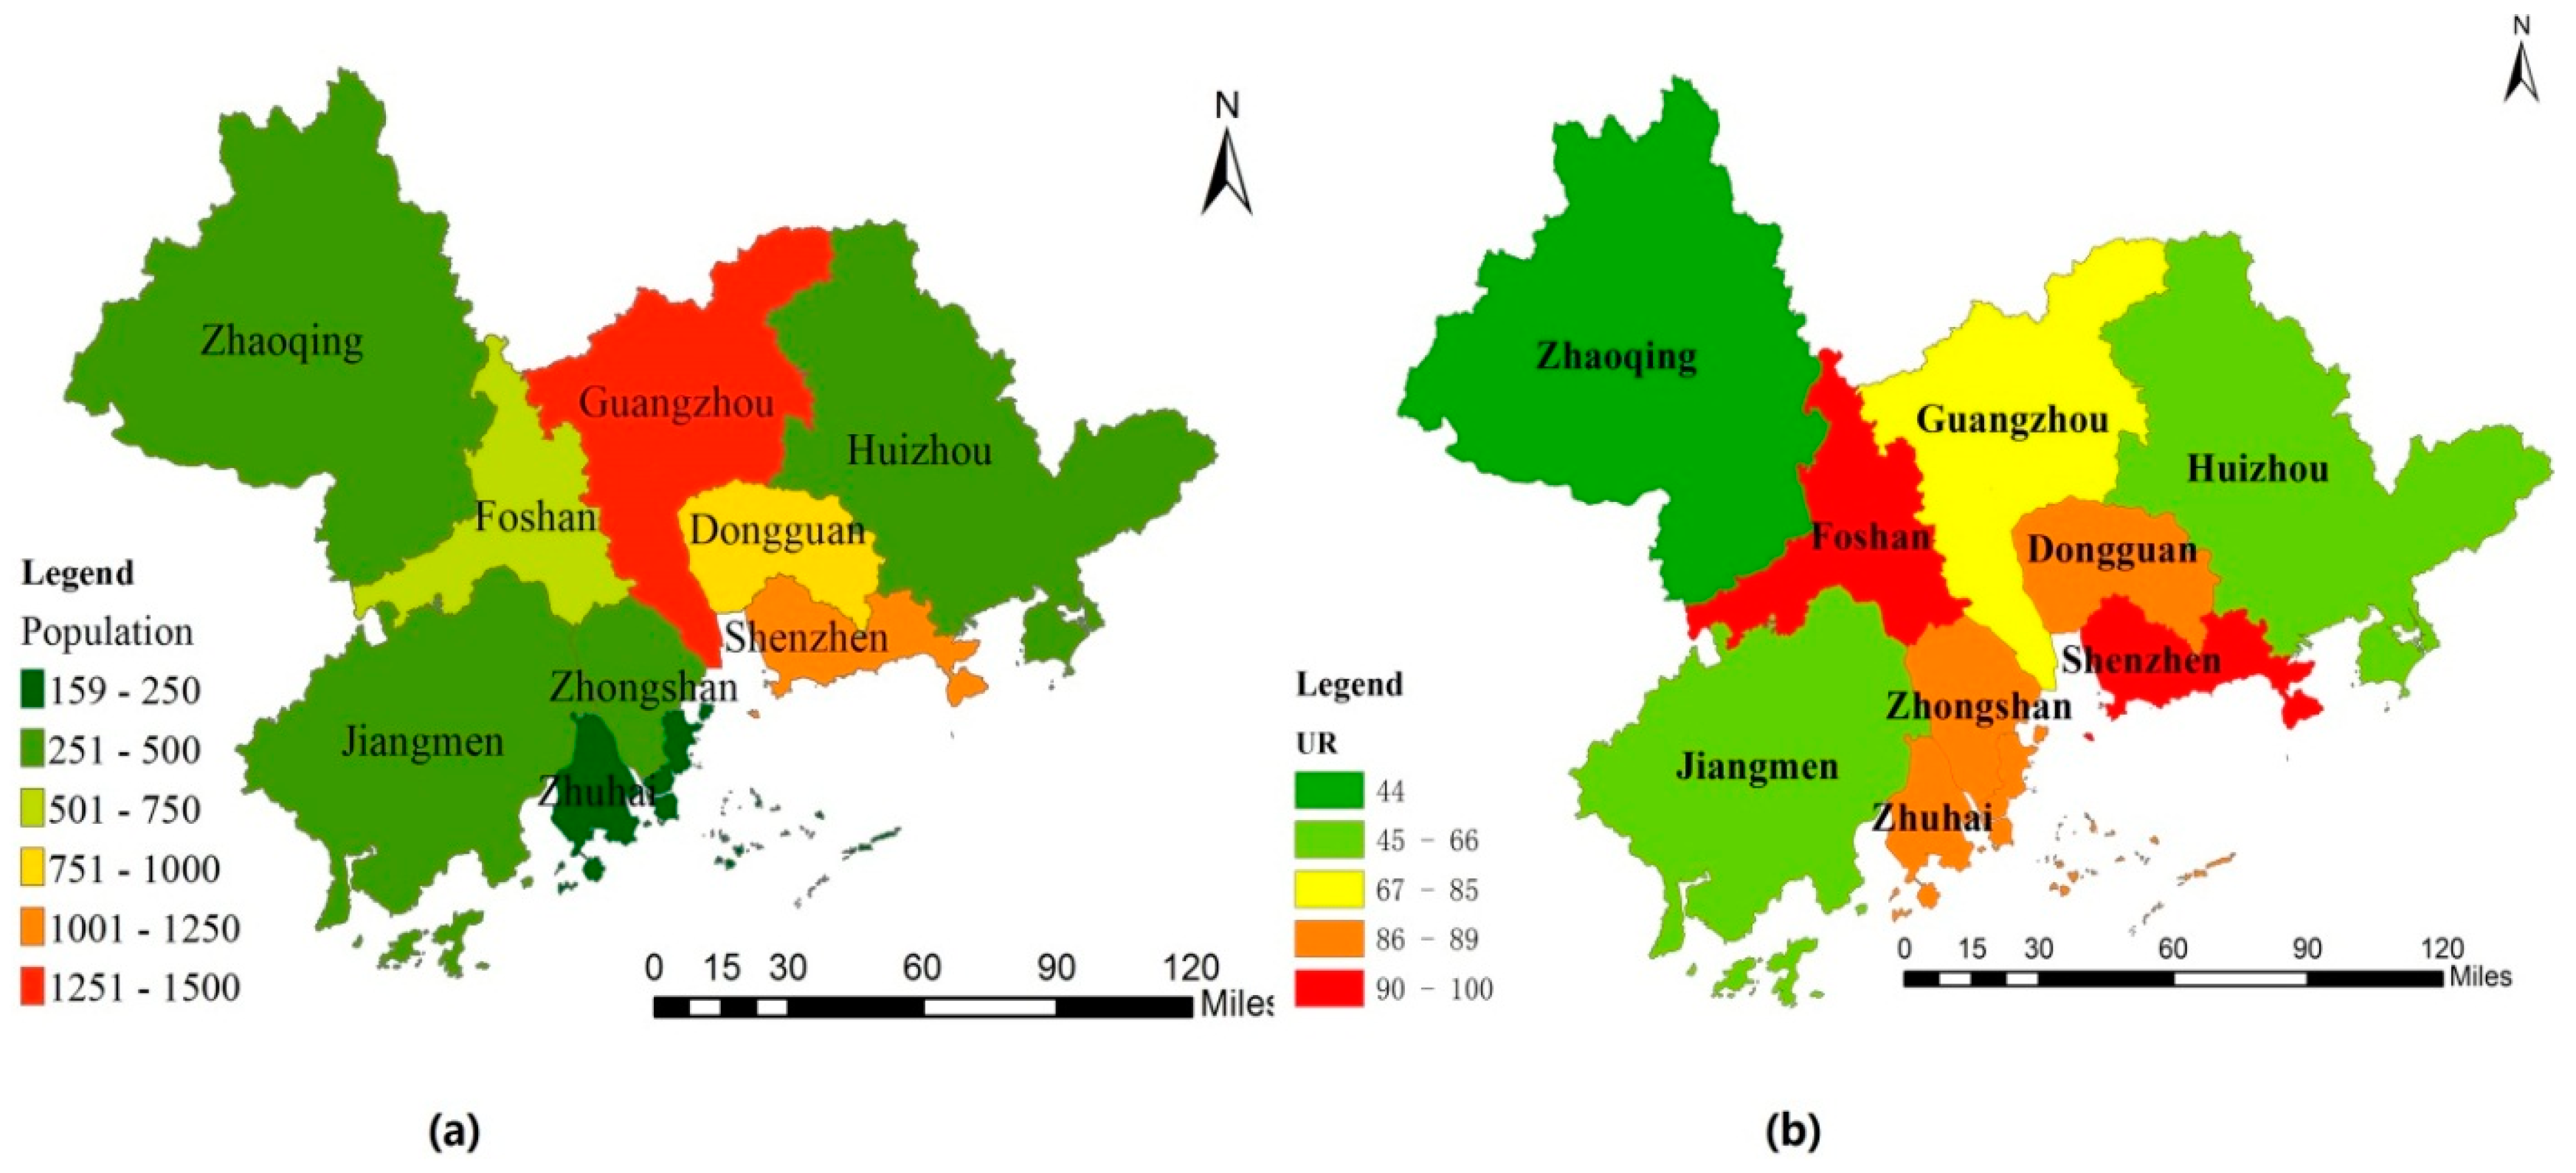
2.1. Study Area


| Urban Agglomerations | Land Area (sq.km) | Population Density (persons/sq.km) | GDP Proportion of Tertiary Industry (%) | Per Capita Disposable Income of Urban Households (Yuan) | Amount of Foreign Capital Actually Utilized (USD 10000) |
|---|---|---|---|---|---|
| Guangzhou-Foshan-Zhaoqing | 26,123 | 804.34 | 45.75 | 34,672.22 | 856,583 |
| Shenzhen-Dongguan-Huizhou | 15,800 | 875.14 | 49.1 | 41,413.03 | 1,123,981 |
| Zhuhai-Zhongshan-Jiangmen | 12,947 | 644.01 | 43.25 | 33,473.73 | 325,671 |


| Urban Clusters | Main Policies and Agreements for Cooperation |
|---|---|
| Guangzhou-Foshan-Zhaoqing (GFZ) | GFZ Economic Circle Construction Cooperation Framework Agreement GFZ Foreign Trade Cooperation Agreement GFZ Tourism Integration Cooperation Framework Agreement GFZ Economic Circle Transportation Cooperation Agreement MOU on Financial Cooperation in GFZ GFZ Urban and Rural Construction Cooperation Framework Agreement GFZ Economic Circle Development Planning (2010–2020) GFZ Industry-university-research and Technological Innovation Cooperation Agreement GFZ Transport Infrastructure Linking-up Planning (2011–2020) Overall Development Planning on GFZ (Huaiji) Economic Cooperation Zone (2013–2030) |
| Shenzhen-Dongguan-Huizhou (SDH) | Framework Agreement on Promoting Close Cooperation in Eastern Pearl River Estuary Area Framework Agreement on Promoting Planning Cooperation in Junction Area of SDH SDH Industrial Development Cooperation Agreement Cooperation Agreement on Co-construction of Regional Innovation System in SDH SDH Transportation Integration Planning |
| Zhuhai-Zhongshan-Jiangmen (ZZJ) | Framework Agreement on Promoting Close Cooperation in ZZJ ZZJ Tourism Cooperation Agreement ZZJ Regional Close Educational Cooperation Agreement ZZJ Regional Normalization Cooperation Agreement ZZJ Industry-university-research Cooperation Agreement ZZJ Regional Marine Economic Cooperation Agreement ZZJ Transport Infrastructure Integration Planning |
2.2. Urban Economic External Service Function Assessment
2.3. Data Sources
3. Results and Discussion
3.1. Location Quotient and Urban Economic External Service Function
3.1.1. Location Quotient of Major External Service Sectors of cities in PRD in 2005, 2009, 2013
| Sectors | Guangzhou | Foshan | Zhaoqing | Shenzhen | Dongguan | Huizhou | Zhuhai | Zhongshan | Jiangmen |
|---|---|---|---|---|---|---|---|---|---|
| Manufacturing | 1.23 | 1.52 | 1.27 | 1.59 | 1.27 | 2.42 | 2.32 | 2.03 | 1.59 |
| Transport, storage and postal services | 1.97 | 0.70 | 0.69 | 1.23 | 1.00 | 0.33 | 0.56 | 0.58 | 0.58 |
| Information transmission, computer services | 1.67 | 1.32 | 1.32 | 1.56 | 1.05 | 0.51 | 1.09 | 0.96 | 0.70 |
| Wholesale and retail trade | 0.98 | 0.60 | 0.58 | 1.05 | 0.47 | 0.23 | 0.51 | 0.29 | 0.41 |
| Hotels and catering services | 2.41 | 1.10 | 1.14 | 1.71 | 0.28 | 0.50 | 1.30 | 1.08 | 0.93 |
| Finance | 1.00 | 2.03 | 0.97 | 1.02 | 3.04 | 0.52 | 0.60 | 1.51 | 1.24 |
| Real estate | 1.99 | 0.87 | 0.78 | 4.12 | 0.18 | 0.89 | 1.37 | 0.46 | 0.49 |
| Leasing and business services | 1.61 | 1.01 | 0.60 | 2.24 | 0.38 | 0.50 | 0.72 | 0.61 | 0.54 |
| Scientific research, technical services | 1.36 | 0.42 | 0.54 | 0.88 | 0.42 | 0.33 | 0.23 | 0.67 | 0.43 |
| Water conservancy, environment management | 0.89 | 0.79 | 1.03 | 0.63 | 0.24 | 0.62 | 0.85 | 0.60 | 1.17 |
| Resident services and other services | 1.10 | 0.17 | 0.21 | 0.49 | 0.05 | 0.07 | 0.49 | 0.28 | 0.34 |
| Education | 0.63 | 0.87 | 1.30 | 0.26 | 0.96 | 0.49 | 0.27 | 0.69 | 0.99 |
| Health, social security and social welfare | 1.00 | 1.10 | 1.56 | 0.54 | 2.32 | 0.53 | 0.41 | 1.00 | 1.19 |
| Culture, sports and recreation | 1.38 | 0.54 | 0.99 | 0.74 | 0.67 | 0.45 | 0.76 | 0.98 | 0.45 |
| Public administration and social organizations | 0.62 | 0.81 | 1.27 | 0.52 | 1.49 | 0.58 | 0.52 | 0.61 | 0.97 |
| Sectors | Guangzhou | Foshan | Zhaoqing | Shenzhen | Dongguan | Huizhou | Zhuhai | Zhongshan | Jiangmen |
|---|---|---|---|---|---|---|---|---|---|
| Manufacturing | 1.25 | 1.62 | 1.32 | 1.66 | 1.30 | 2.48 | 2.27 | 2.05 | 1.71 |
| Transport, storage and postal services | 2.10 | 0.65 | 0.69 | 1.37 | 0.66 | 0.34 | 0.54 | 0.73 | 0.55 |
| Information transmission, computer services | 1.52 | 1.55 | 0.96 | 1.42 | 0.79 | 0.29 | 1.00 | 0.70 | 0.74 |
| Wholesale and retail trade | 1.18 | 0.53 | 0.58 | 1.33 | 0.62 | 0.33 | 0.72 | 0.22 | 0.47 |
| Hotels and catering services | 2.42 | 1.14 | 1.11 | 1.80 | 0.19 | 0.53 | 1.15 | 0.82 | 1.18 |
| Finance | 0.88 | 1.35 | 0.81 | 1.09 | 2.40 | 0.55 | 0.76 | 1.34 | 1.25 |
| Real estate | 1.96 | 0.70 | 0.52 | 3.44 | 0.14 | 0.71 | 1.46 | 0.76 | 0.43 |
| Leasing and business services | 1.76 | 0.48 | 0.58 | 2.11 | 0.44 | 0.40 | 0.70 | 0.80 | 0.32 |
| Scientific research, technical services | 1.26 | 0.42 | 0.45 | 0.89 | 0.39 | 0.26 | 0.29 | 0.33 | 0.28 |
| Water conservancy, environment management | 0.77 | 0.63 | 1.21 | 0.62 | 0.16 | 0.55 | 0.81 | 0.26 | 0.92 |
| Resident services and other services | 2.54 | 0.41 | 0.31 | 1.59 | 0.09 | 0.35 | 0.53 | 0.16 | 0.95 |
| Education | 0.62 | 1.01 | 1.45 | 0.26 | 0.95 | 0.44 | 0.31 | 0.77 | 0.89 |
| Health, social security and social welfare | 0.96 | 1.28 | 1.48 | 0.47 | 2.35 | 0.51 | 0.37 | 1.09 | 1.09 |
| Culture, sports and recreation | 1.45 | 0.33 | 0.91 | 0.75 | 0.82 | 0.40 | 0.66 | 0.80 | 0.38 |
| Public administration and social organizations | 0.61 | 0.87 | 1.23 | 0.47 | 1.64 | 0.62 | 0.46 | 0.75 | 0.89 |
| Sectors | Guangzhou | Foshan | Zhaoqing | Shenzhen | Dongguan | Huizhou | Zhuhai | Zhongshan | Jiangmen |
|---|---|---|---|---|---|---|---|---|---|
| Manufacturing | 1.03 | 2.40 | 1.57 | 1.89 | 2.75 | 2.19 | 1.81 | 2.52 | 1.79 |
| Transport, storage and postal services | 2.52 | 0.48 | 0.73 | 1.08 | 0.30 | 0.54 | 0.73 | 0.40 | 0.76 |
| Information transmission, computer services | 1.36 | 0.40 | 0.48 | 1.29 | 0.16 | 0.37 | 1.12 | 0.28 | 0.37 |
| Wholesale and retail trade | 1.59 | 0.59 | 0.63 | 0.99 | 0.47 | 0.60 | 0.75 | 0.61 | 0.72 |
| Hotels and catering services | 1.47 | 0.60 | 0.70 | 0.93 | 0.74 | 0.44 | 1.23 | 0.75 | 0.99 |
| Finance | 0.82 | 0.58 | 0.82 | 0.81 | 0.40 | 1.00 | 0.72 | 0.54 | 1.25 |
| Real estate | 2.47 | 0.81 | 0.77 | 1.71 | 0.45 | 0.93 | 1.75 | 0.89 | 0.61 |
| Leasing and business services | 2.49 | 0.44 | 0.43 | 1.93 | 0.78 | 0.42 | 0.85 | 0.43 | 0.28 |
| Scientific research, technical services | 2.06 | 0.31 | 0.35 | 0.82 | 0.21 | 0.26 | 0.52 | 0.28 | 0.27 |
| Water conservancy, environment management | 1.17 | 0.40 | 0.95 | 0.20 | 0.07 | 0.69 | 0.85 | 0.21 | 0.62 |
| Resident services and other services | 0.64 | 0.30 | 0.17 | 0.36 | 0.46 | 0.08 | 0.22 | 0.04 | 0.16 |
| Education | 0.61 | 0.57 | 1.45 | 0.23 | 0.17 | 0.65 | 0.42 | 0.39 | 0.84 |
| Health, social security and social welfare | 0.72 | 0.64 | 1.45 | 0.32 | 0.46 | 0.71 | 0.49 | 0.49 | 1.10 |
| Culture, sports and recreation | 1.41 | 0.27 | 0.60 | 0.61 | 0.39 | 0.59 | 0.60 | 0.35 | 0.45 |
| Public administration and social organizations | 0.60 | 0.38 | 1.32 | 0.39 | 0.26 | 0.84 | 0.56 | 0.33 | 0.92 |
| External Service Sectors | Guangzhou | Foshan | Zhaoqing | Shenzhen | Dongguan | Huizhou | Zhuhai | Zhongshan | Jiangmen | PRD |
|---|---|---|---|---|---|---|---|---|---|---|
| Transport, storage and postal services | 42% | 4% | 2% | 25% | 4% | 2% | 3% | 2% | 2% | 86% |
| Information transmission, computer services | 28% | 4% | 1% | 38% | 3% | 2% | 5% | 2% | 1% | 85% |
| Wholesale and retail trade | 30% | 6% | 2% | 26% | 7% | 3% | 3% | 3% | 2% | 83% |
| Hotels and catering services | 28% | 6% | 2% | 25% | 10% | 2% | 5% | 4% | 3% | 85% |
| Finance | 18% | 7% | 2% | 25% | 7% | 6% | 4% | 3% | 5% | 75% |
| Real estate | 32% | 6% | 1% | 32% | 4% | 3% | 5% | 3% | 1% | 89% |
| Leasing and business services | 35% | 3% | 1% | 38% | 8% | 2% | 3% | 2% | 1% | 92% |
| Scientific research, technical services | 47% | 4% | 1% | 27% | 4% | 2% | 3% | 2% | 1% | 90% |
| Water conservancy, environment management | 31% | 6% | 3% | 8% | 1% | 5% | 5% | 2% | 3% | 64% |
| Resident services and other services | 33% | 8% | 1% | 26% | 18% | 1% | 3% | 1% | 2% | 93% |
| Education | 15% | 7% | 4% | 8% | 3% | 4% | 2% | 3% | 4% | 50% |
| Health, social security and social welfare | 17% | 8% | 4% | 10% | 8% | 4% | 3% | 3% | 5% | 63% |
| Culture, sports and recreation | 34% | 3% | 2% | 21% | 7% | 4% | 3% | 2% | 2% | 80% |
| Public administration and social organizations | 15% | 5% | 4% | 14% | 5% | 6% | 3% | 2% | 4% | 59% |
| Manufacturing | 10% | 12% | 2% | 25% | 20% | 5% | 4% | 7% | 3% | 87% |
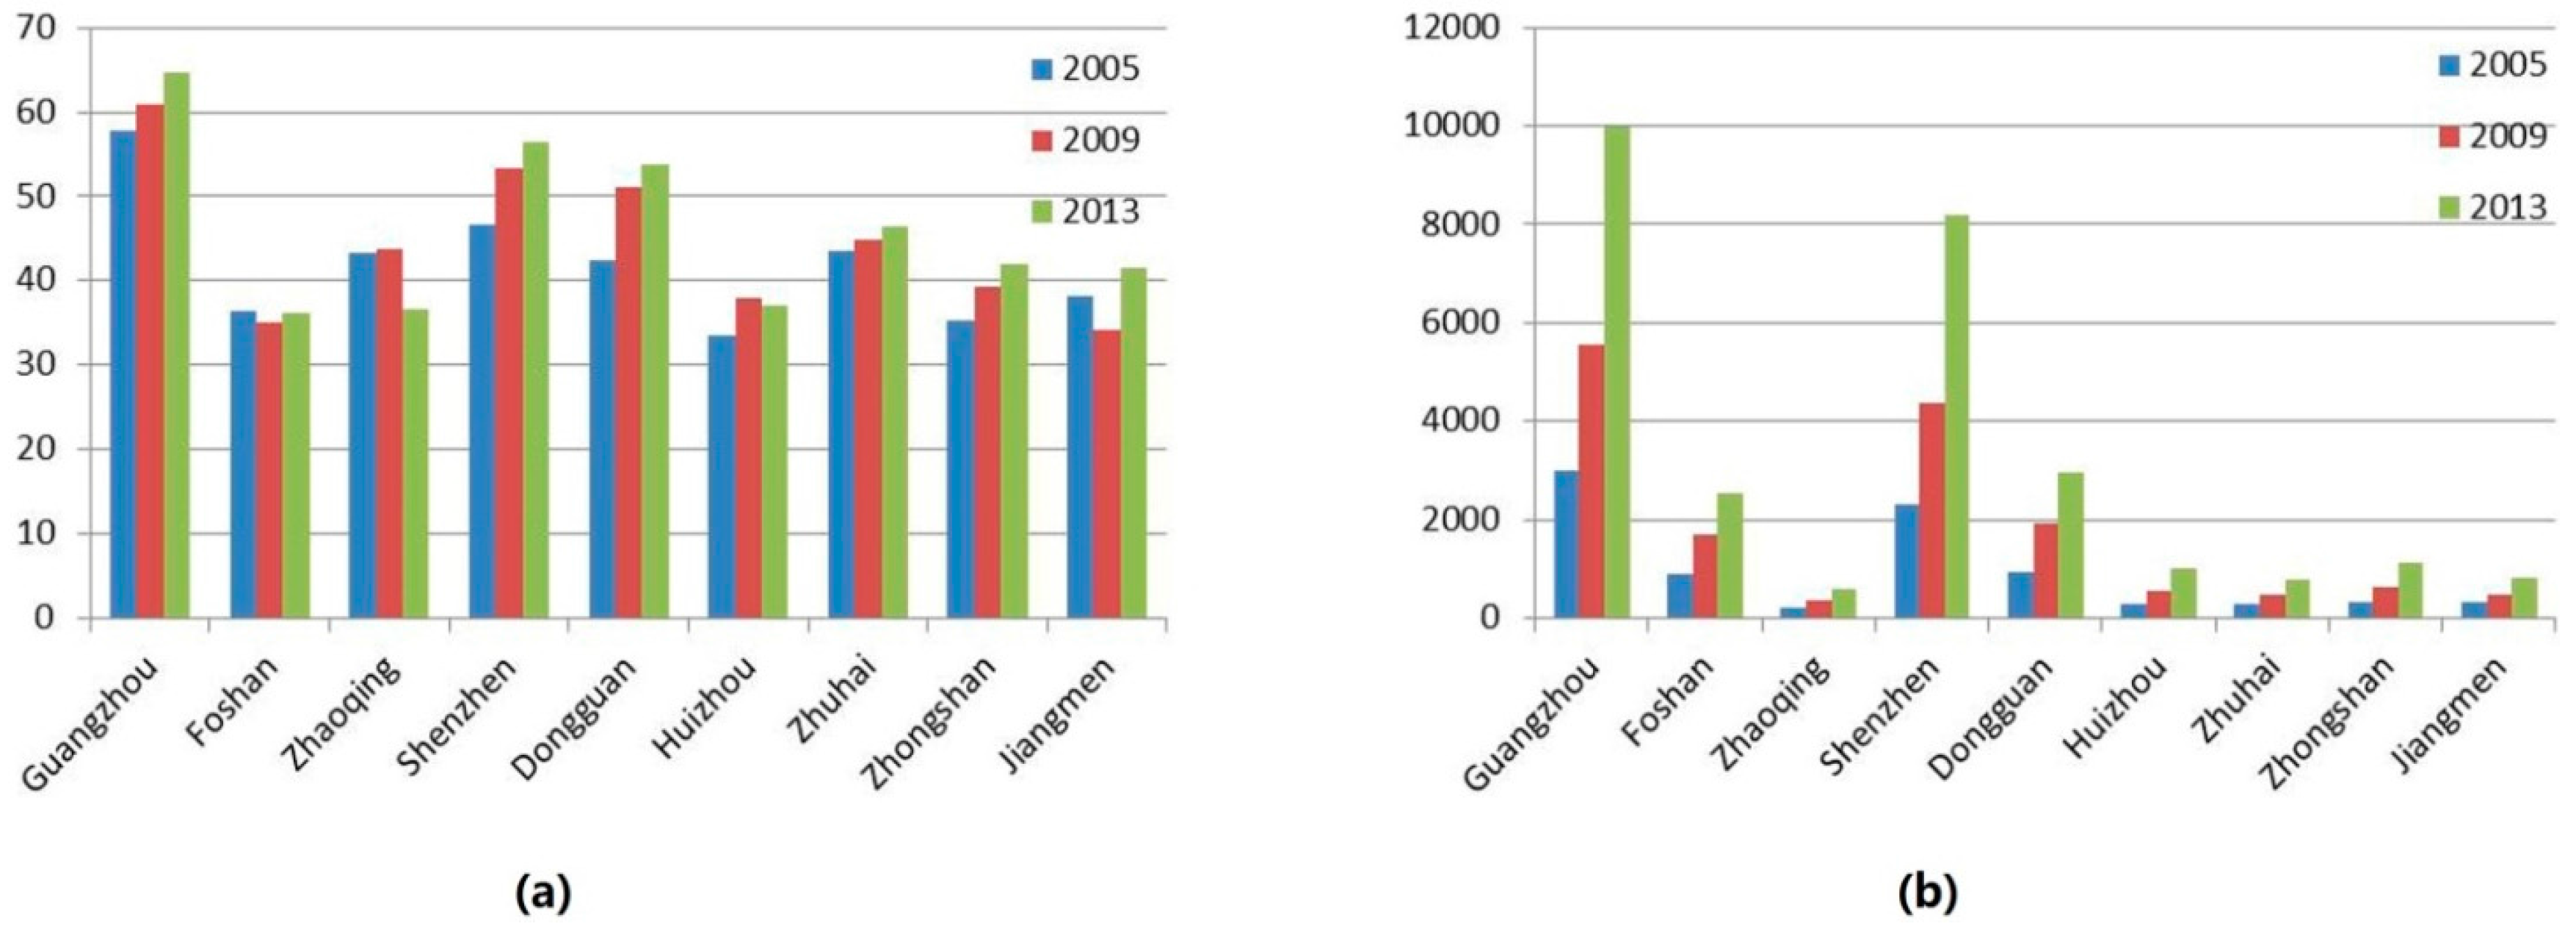
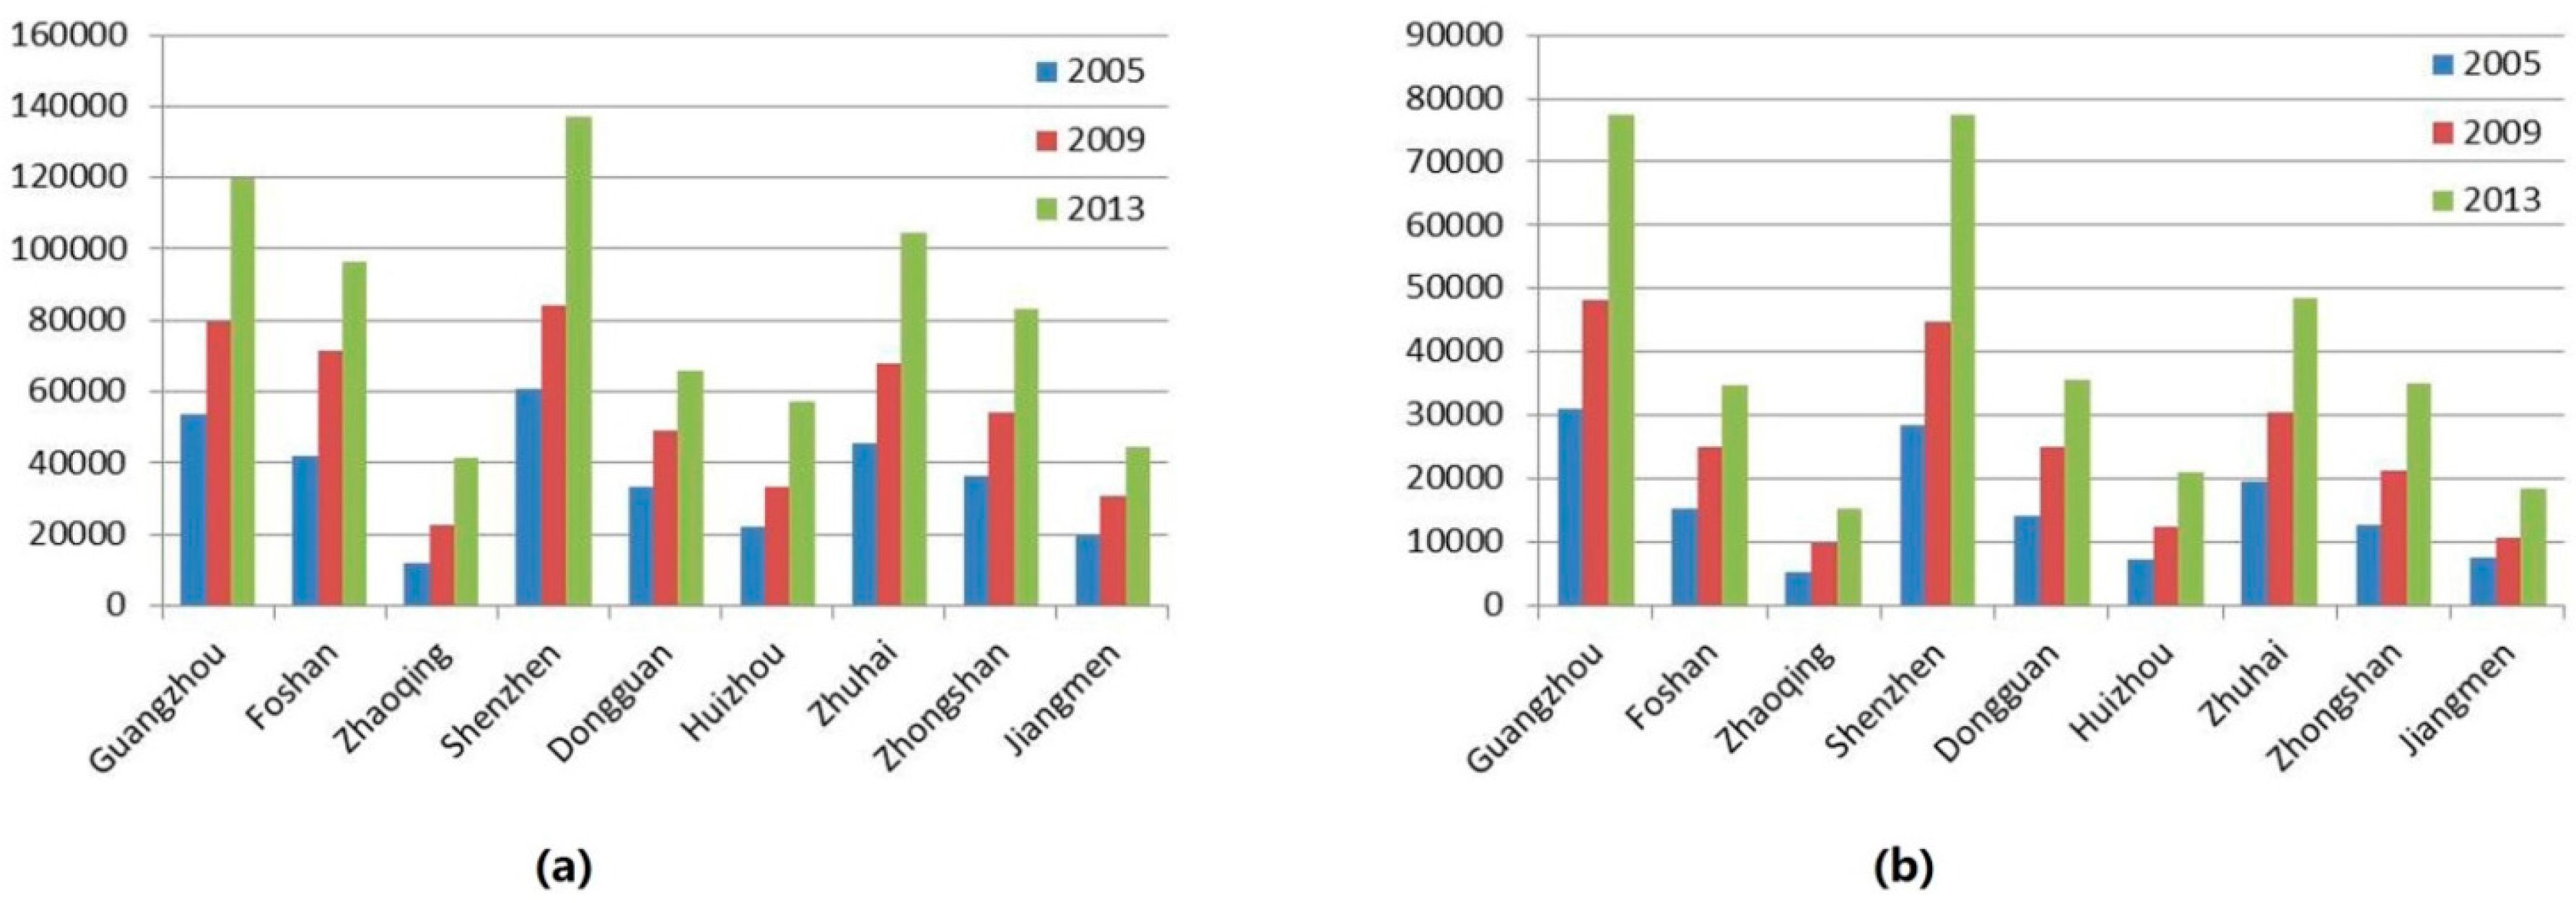
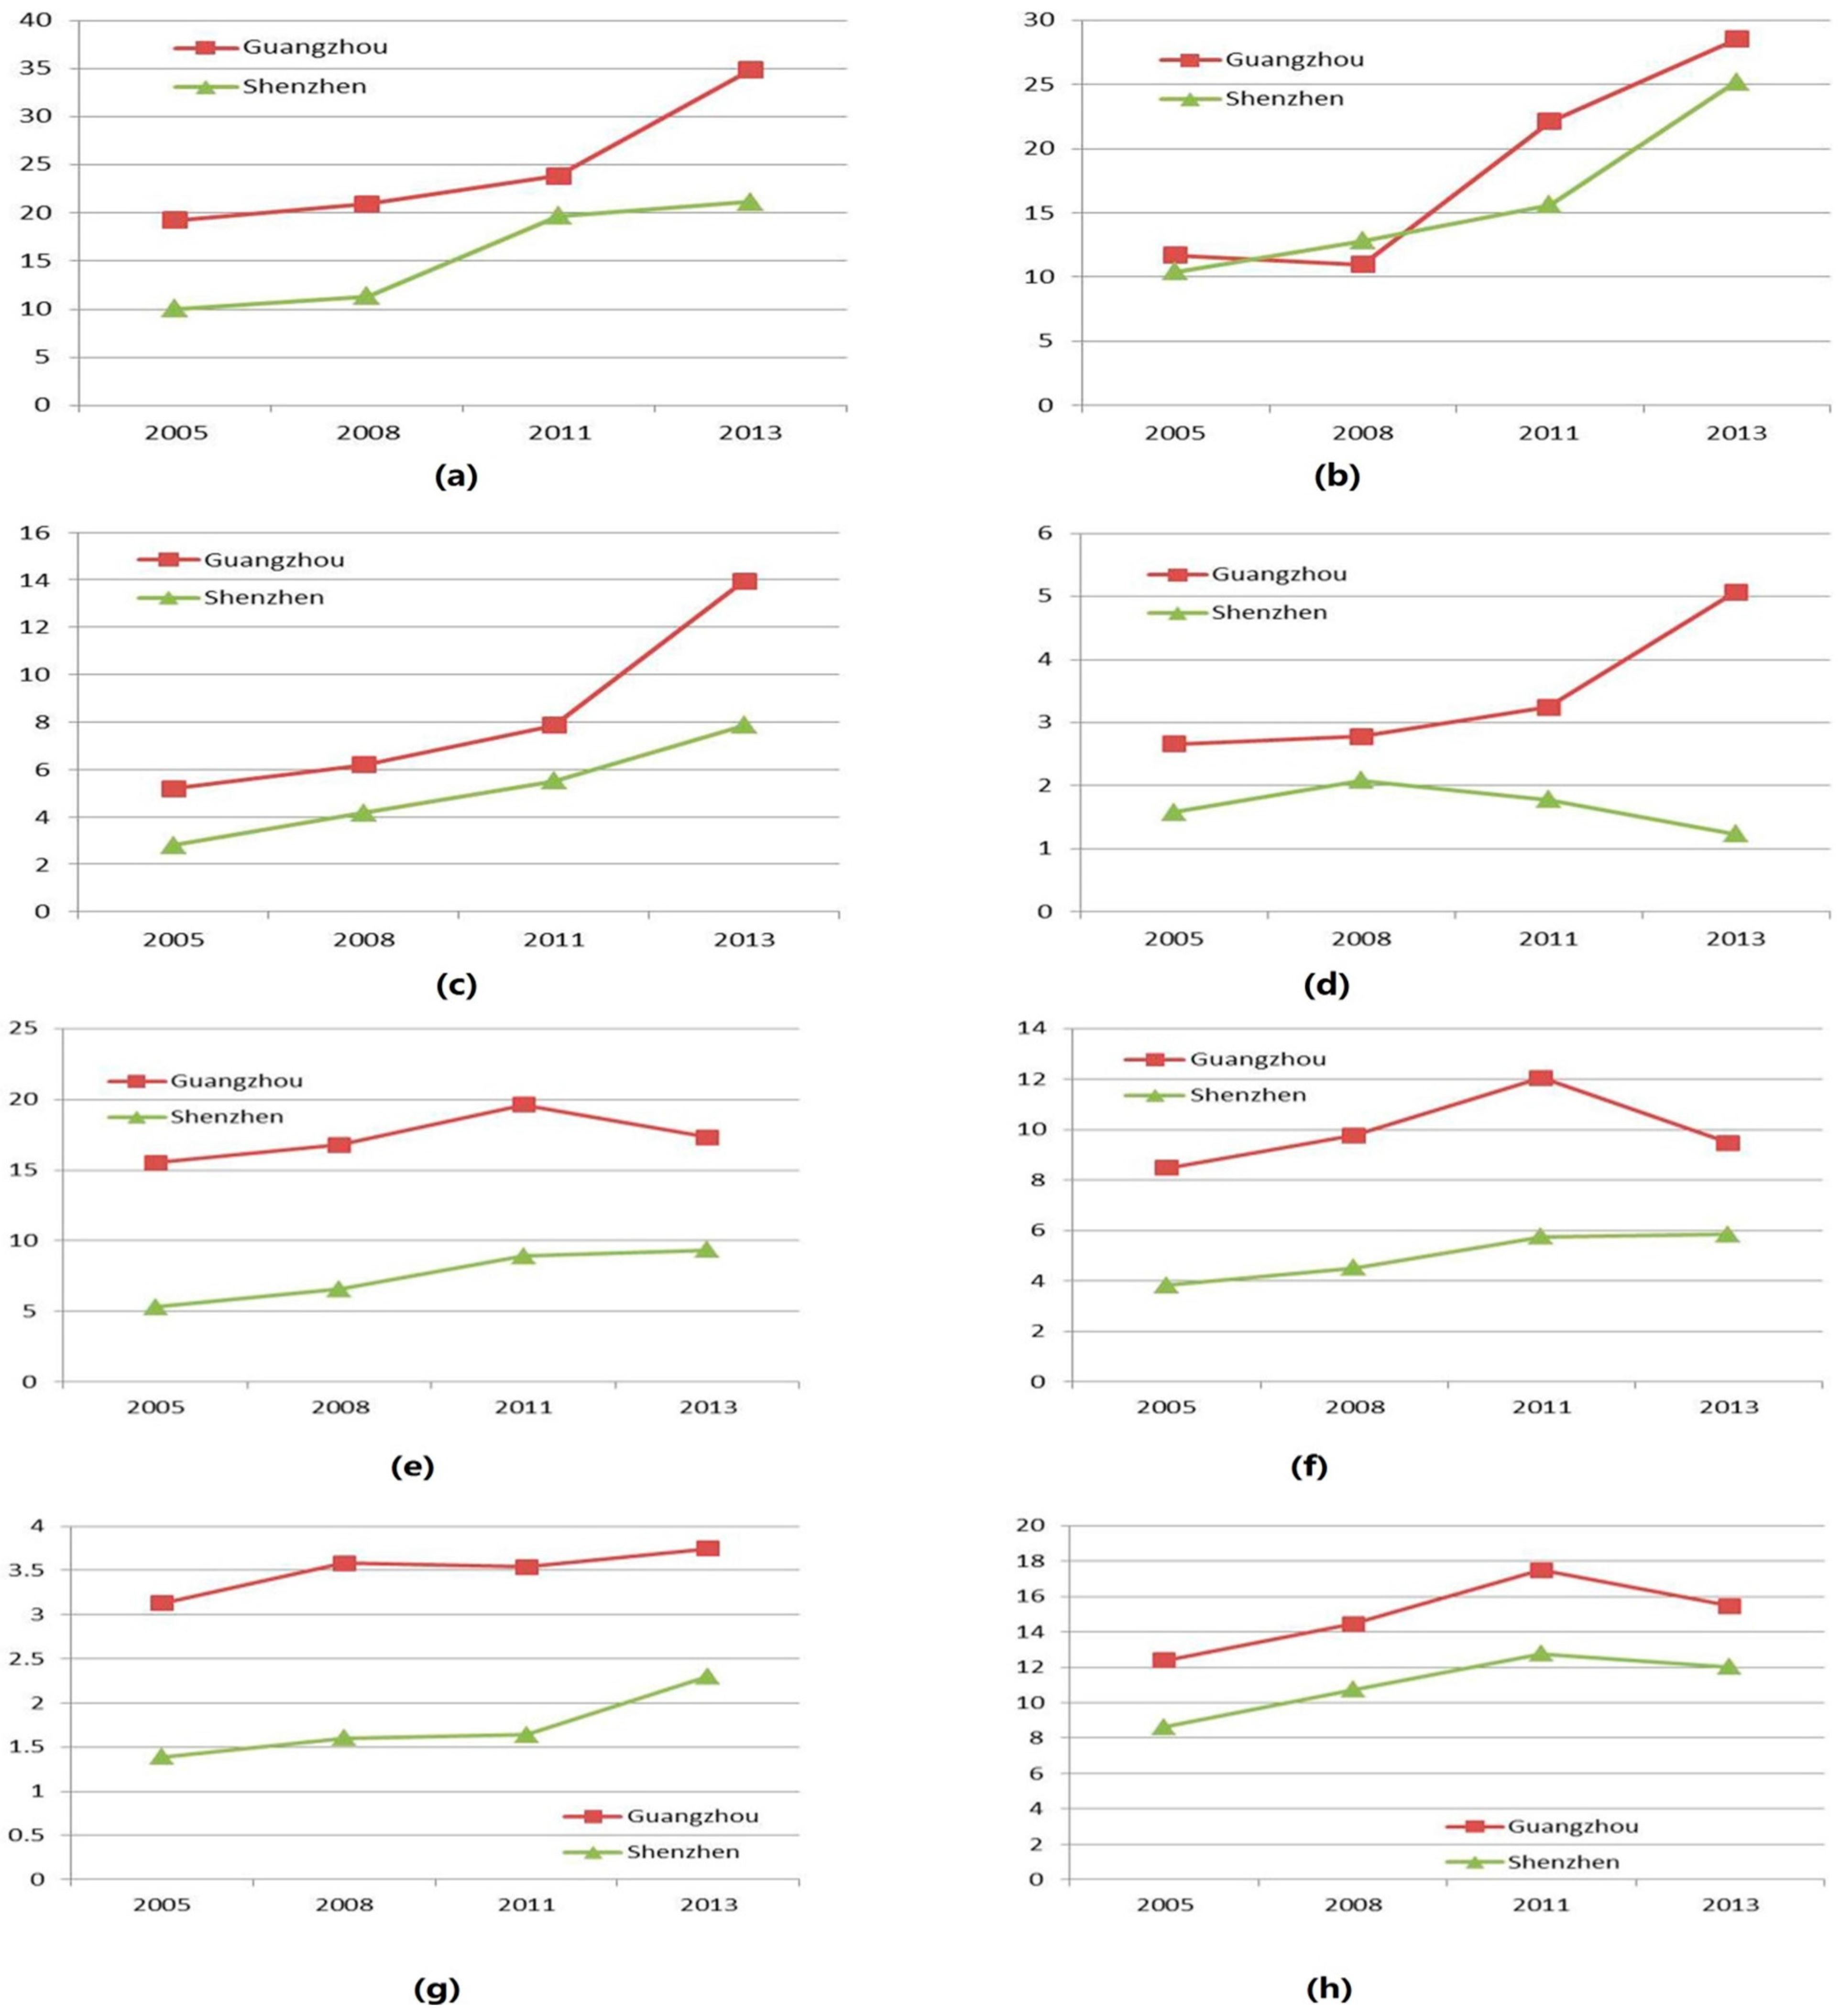
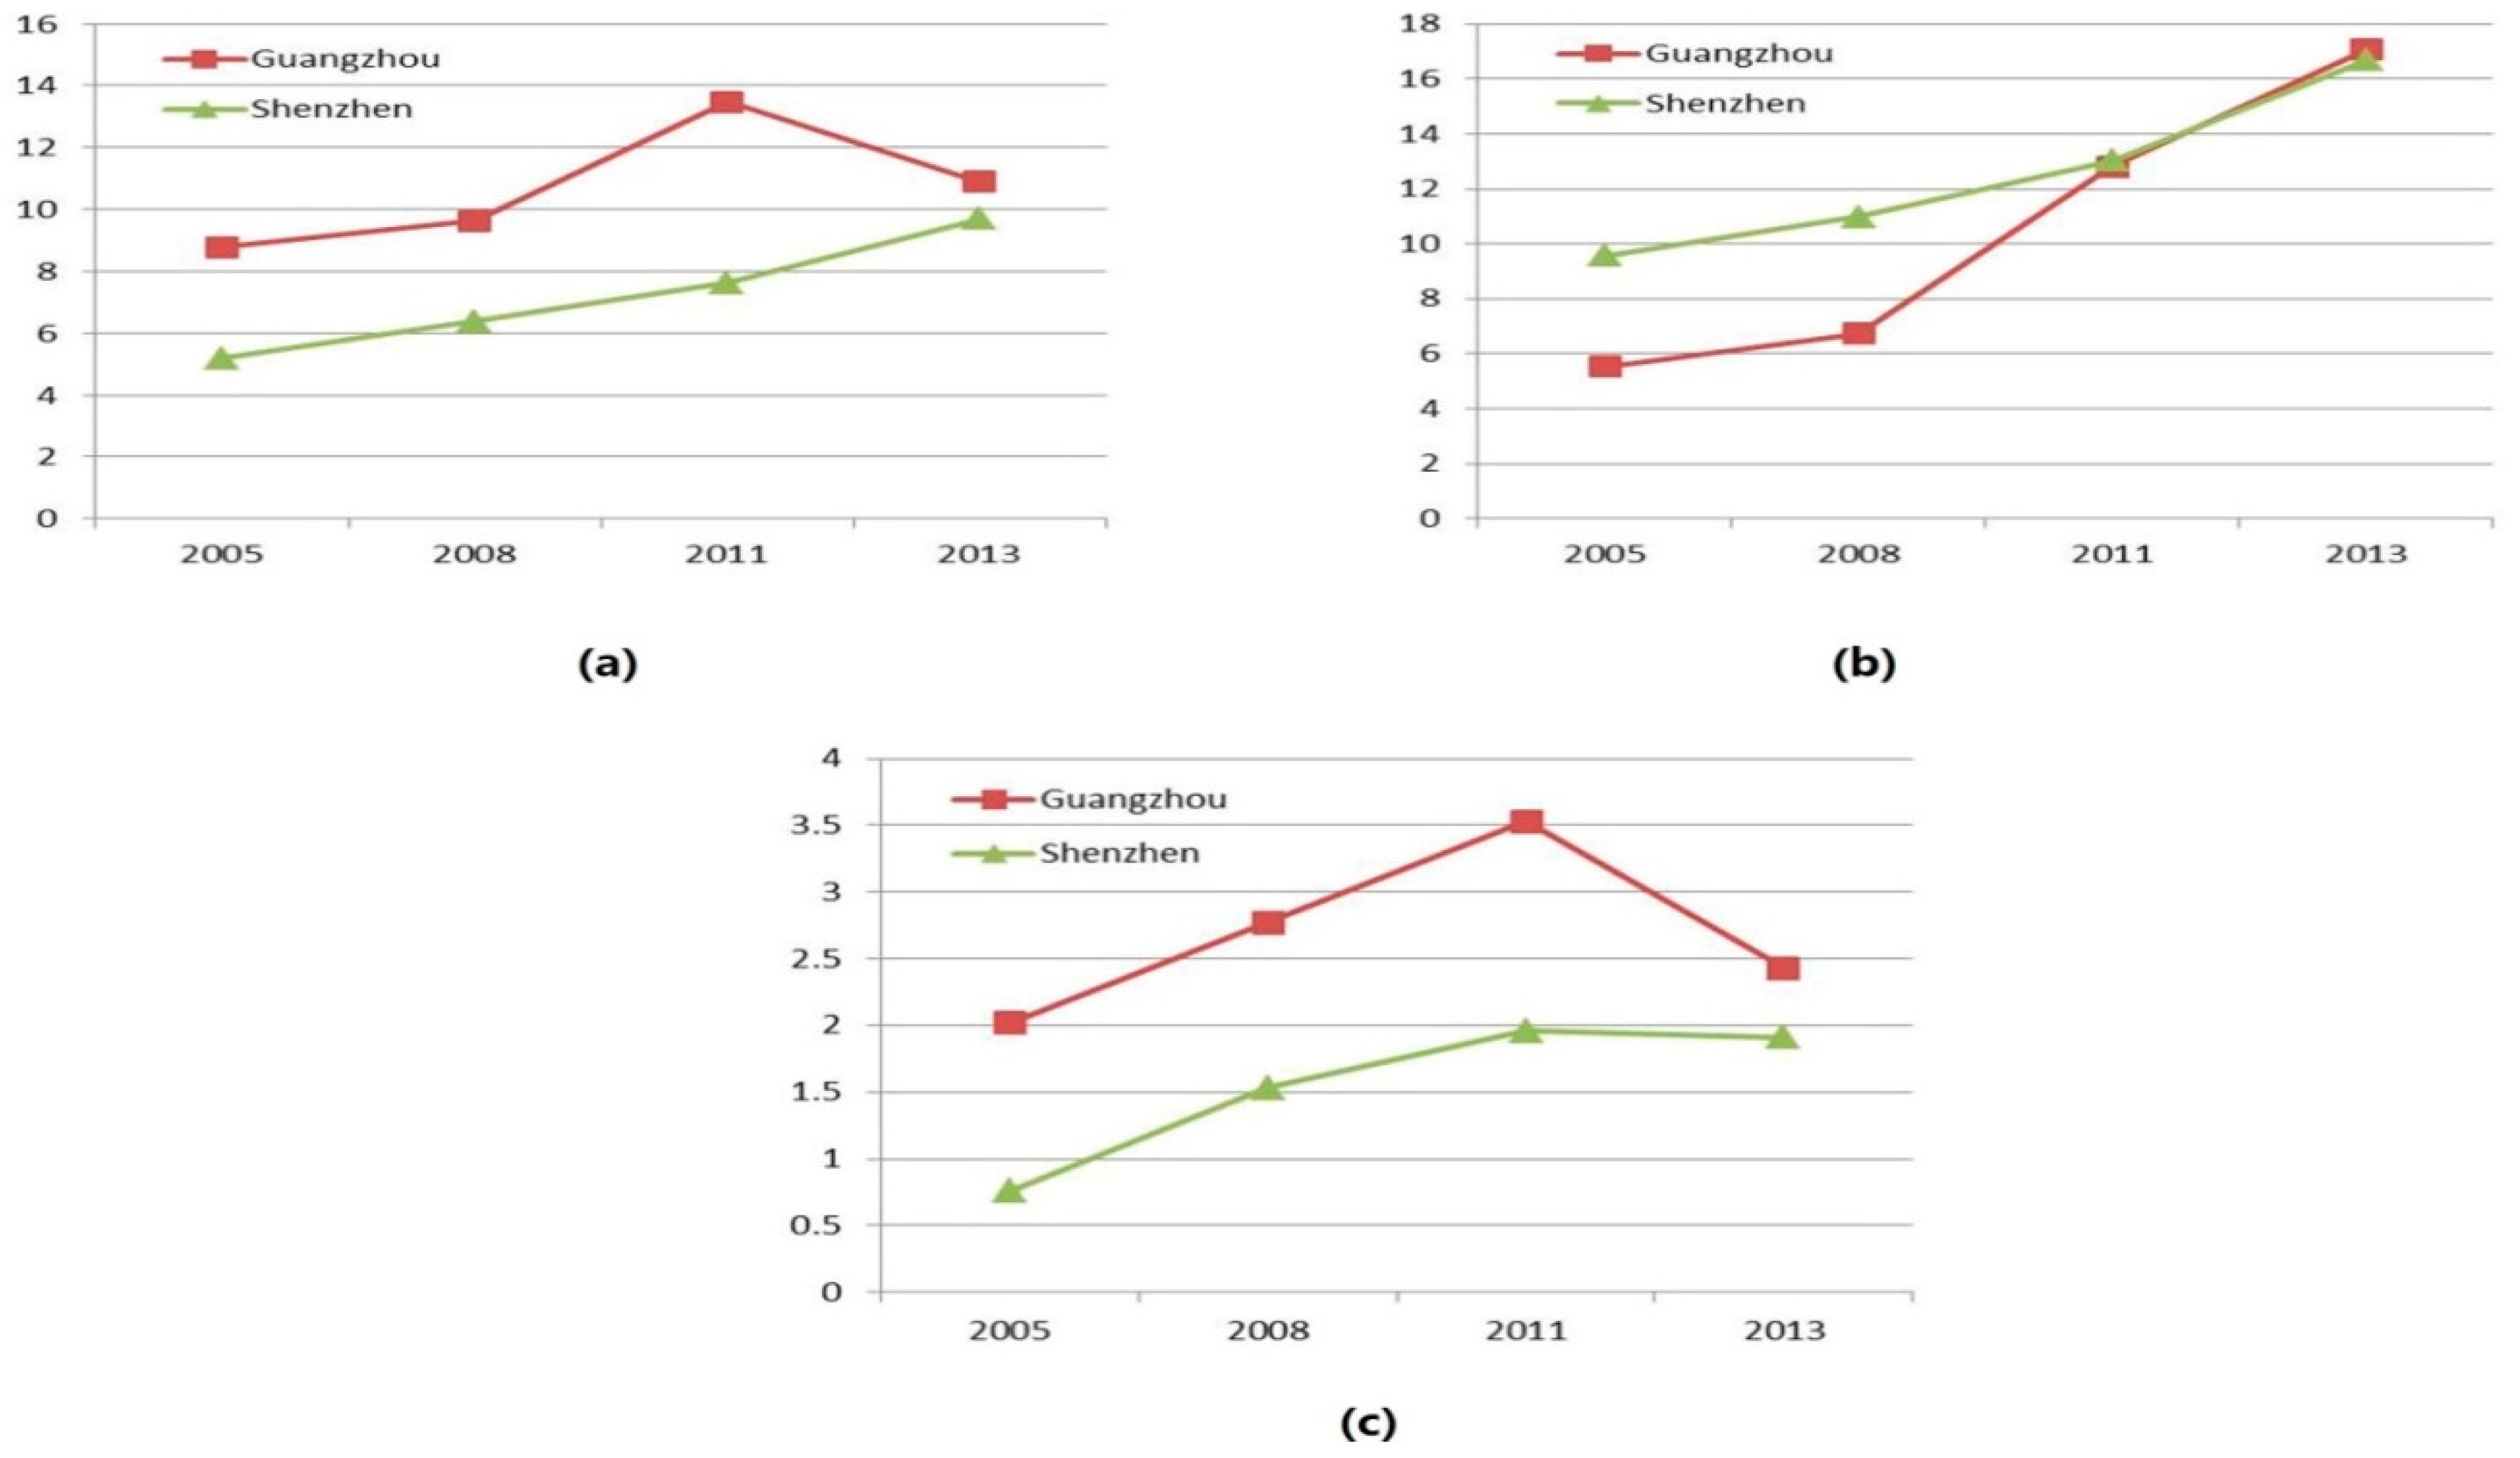
3.1.2. Comparative Analysis of the Employment Structure in Major External Service Sectors in Guangzhou and Shenzhen

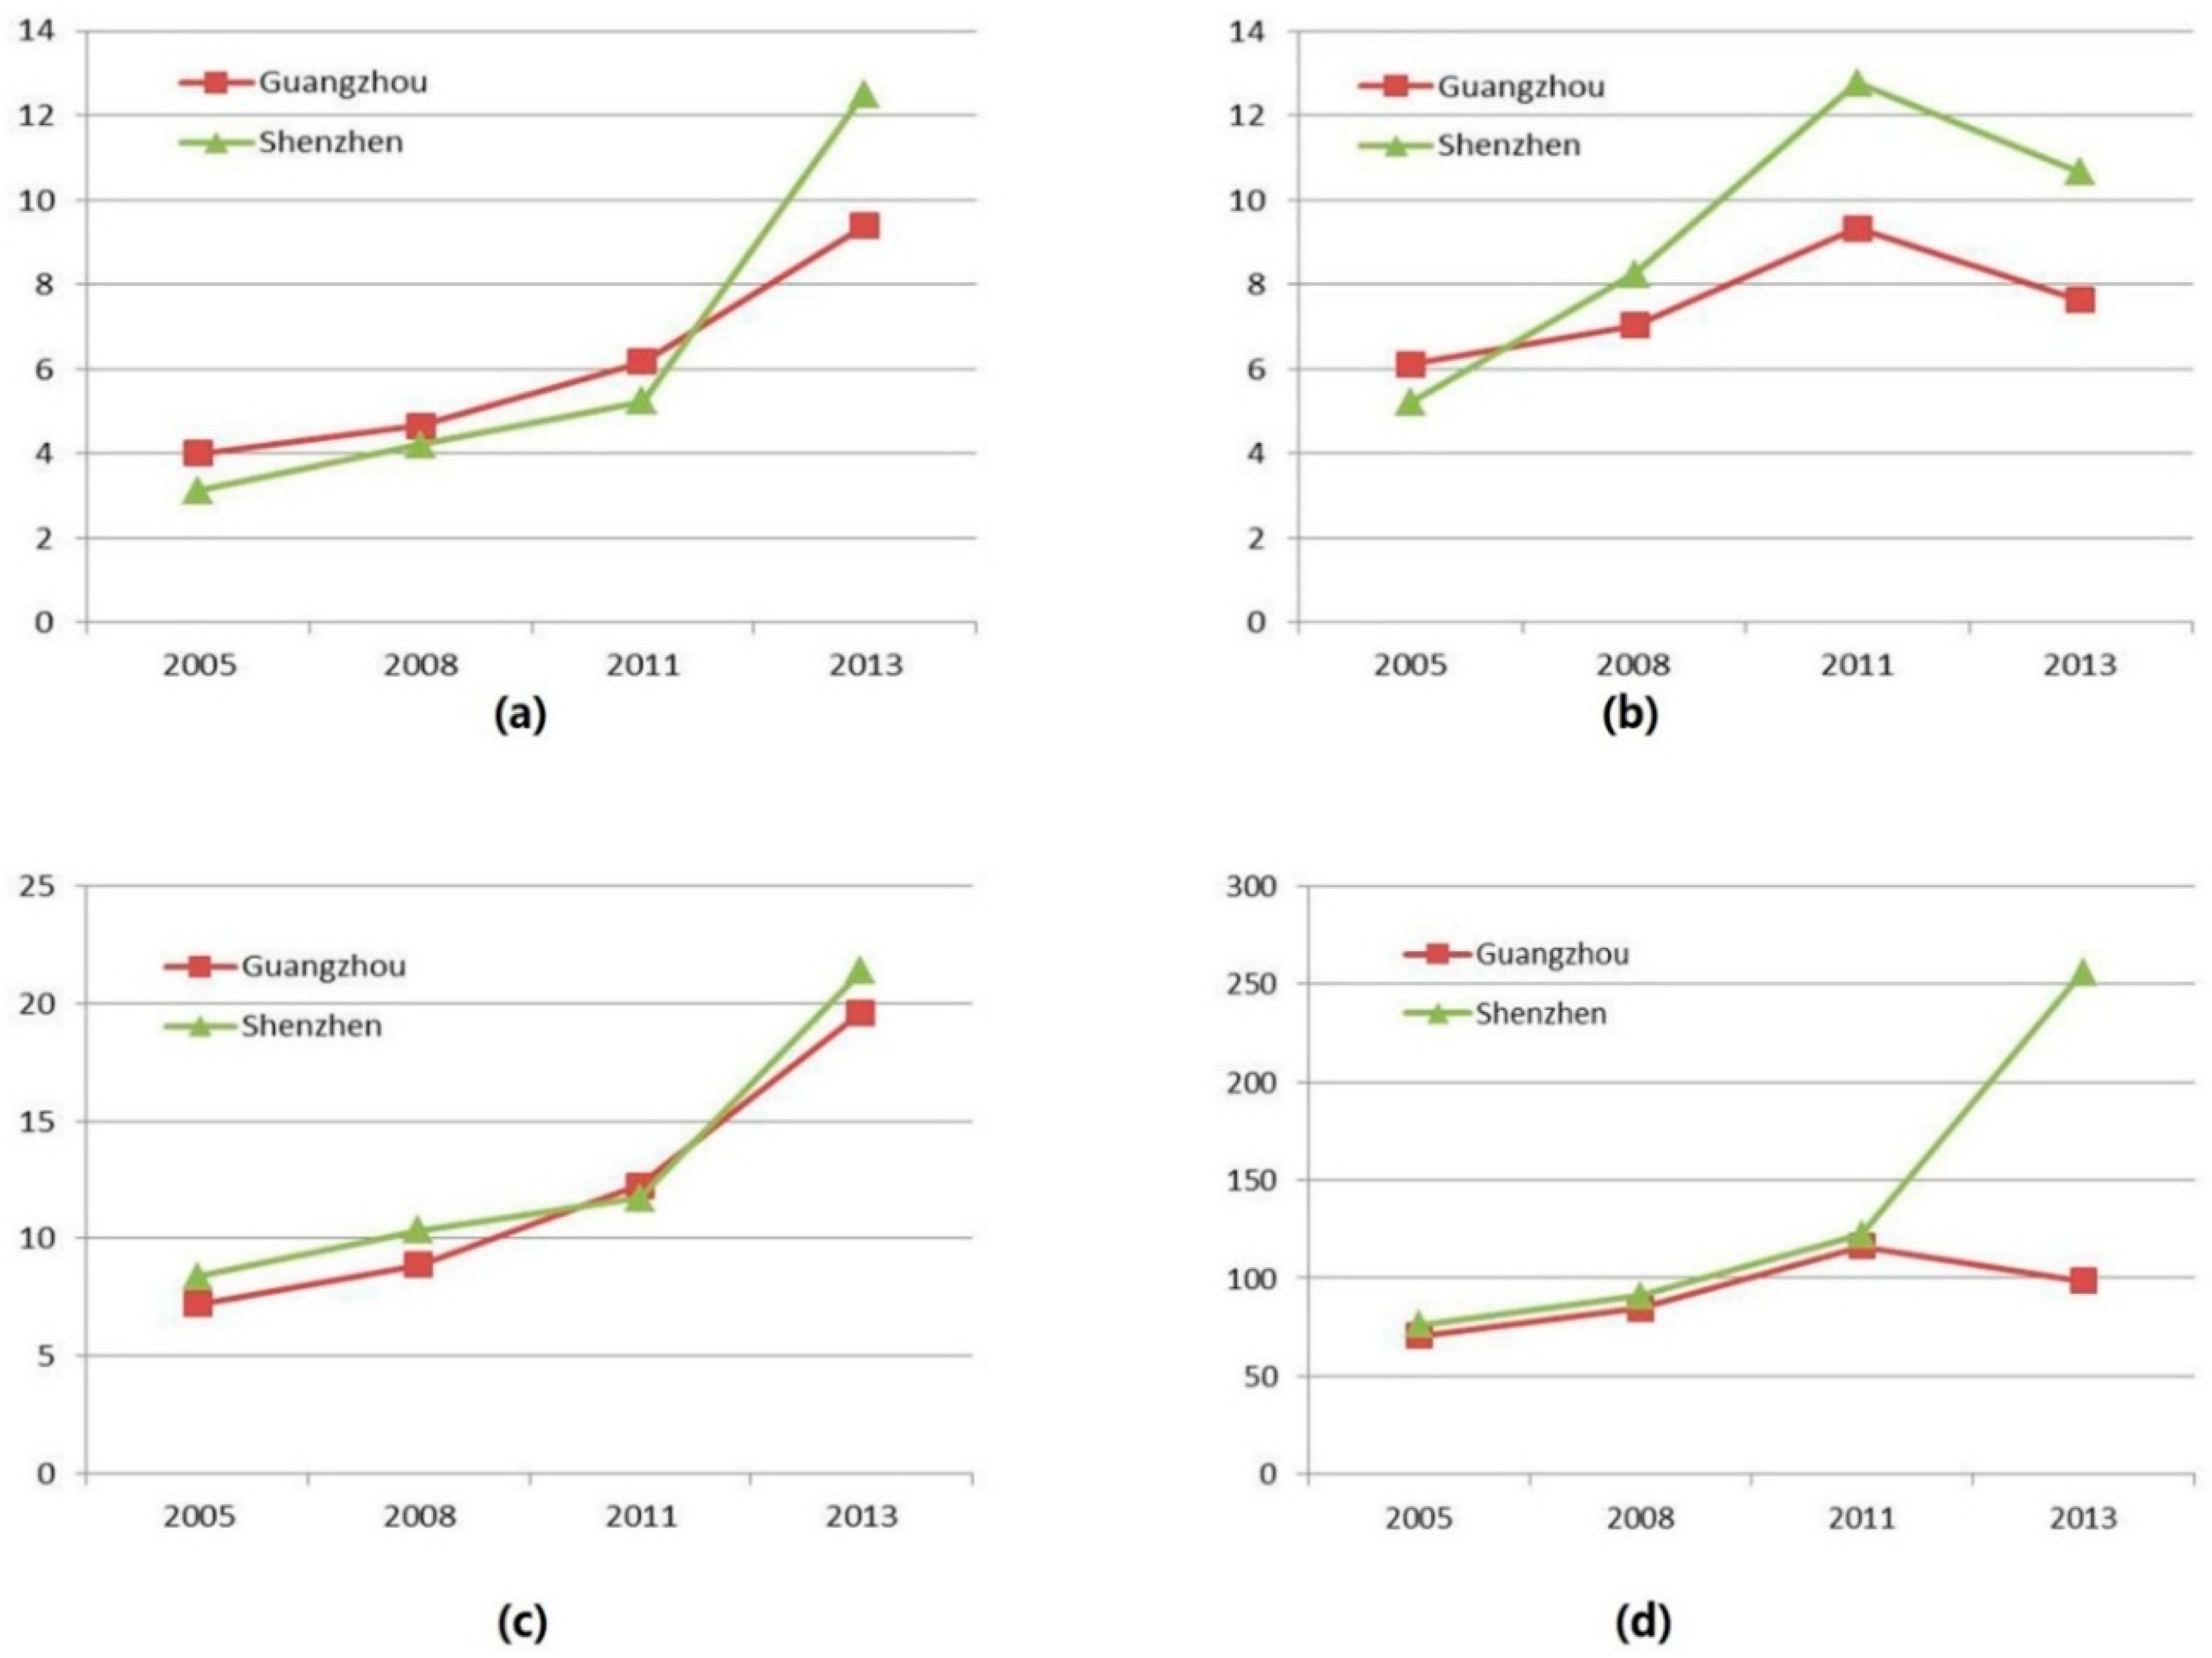
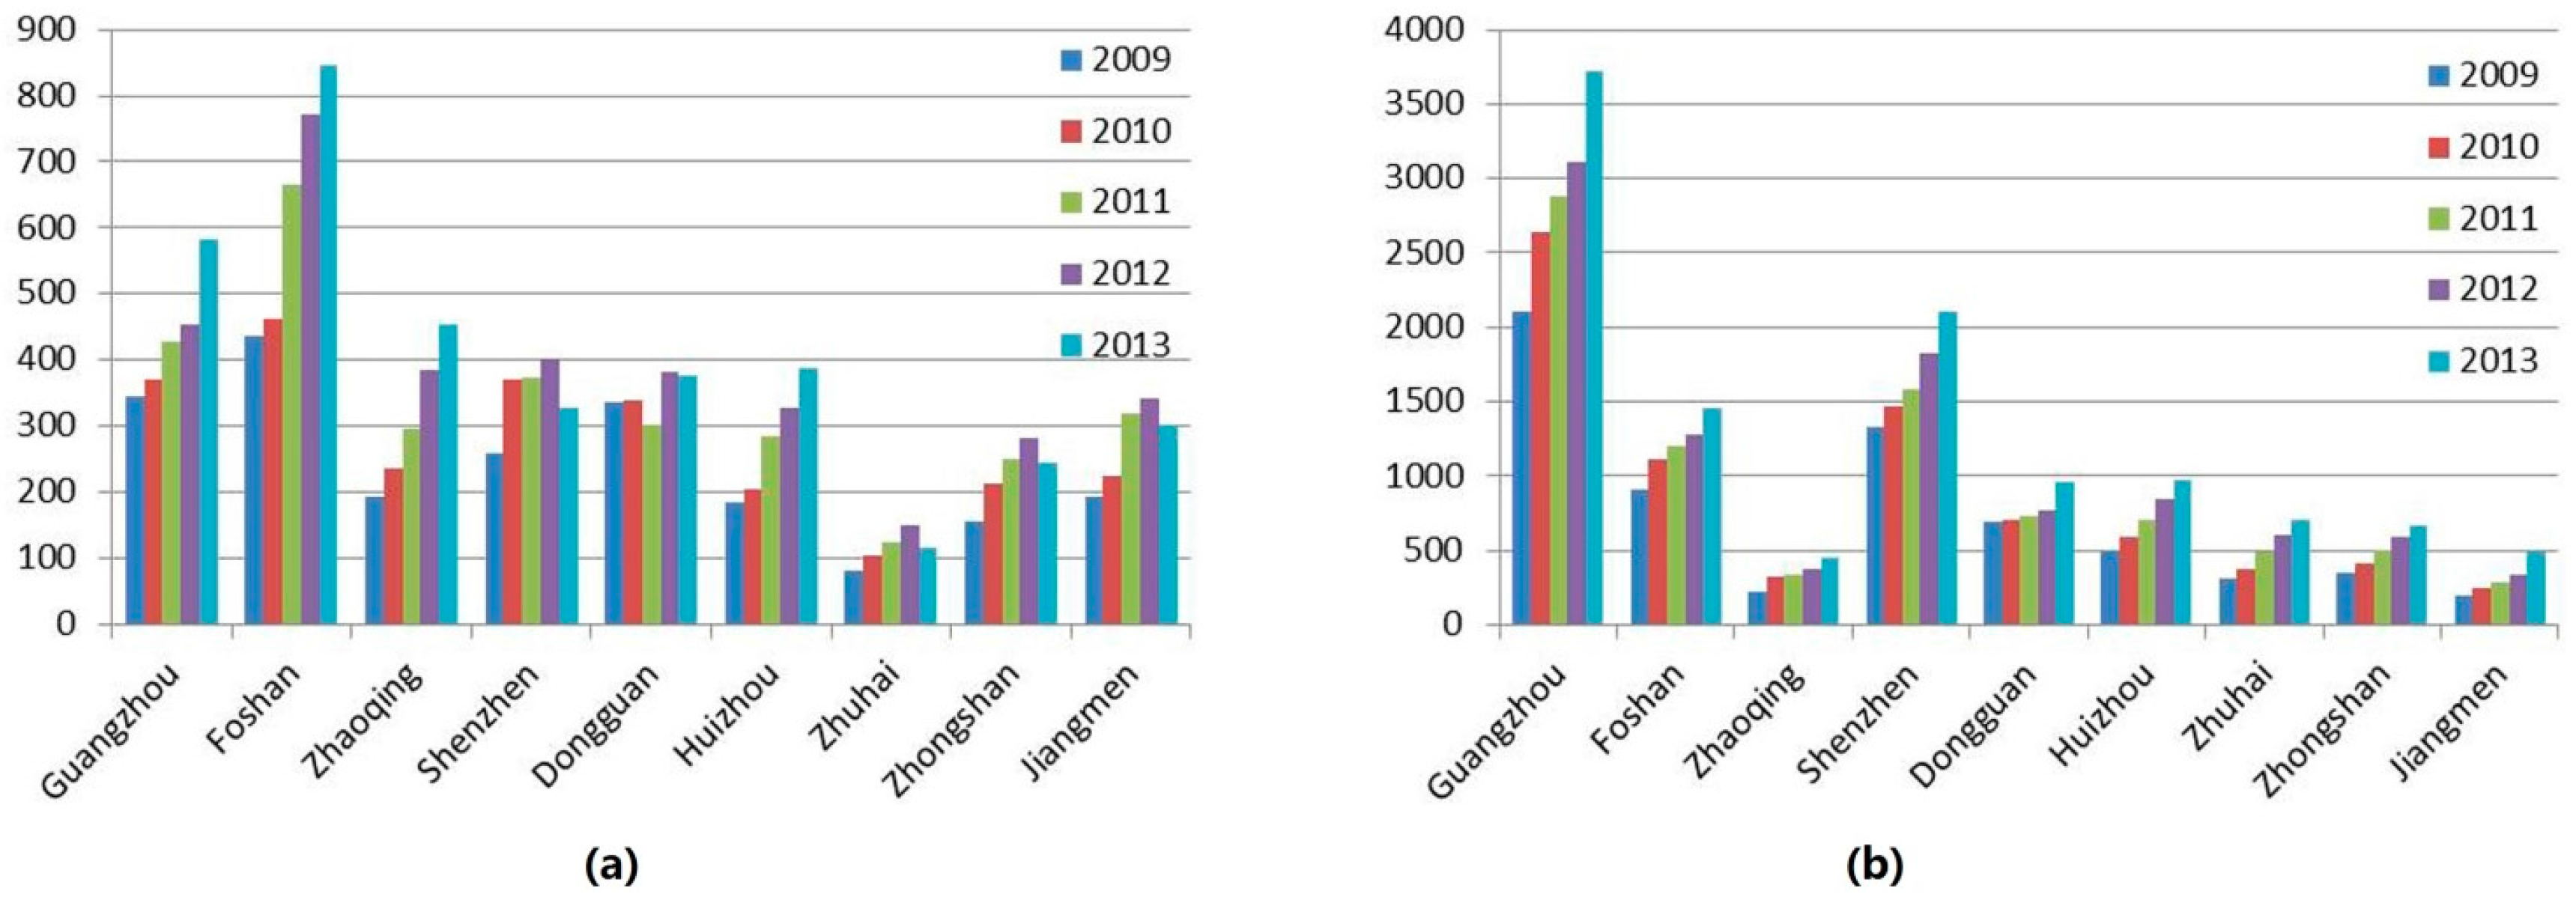
3.1.3. Development of Main Emerging Sub-Sectors of the Service Industries

| Per Capita Disposable Income and Consumption Expenditure of Urban Households by City | ||||||||||
|---|---|---|---|---|---|---|---|---|---|---|
| Disposable Income (yuan) | Consumption Expenditure (yuan) | |||||||||
| 2000 | 2005 | 2010 | 2012 | 2013 | 2000 | 2005 | 2010 | 2012 | 2013 | |
| Guangzhou | 13,621.83 | 18,287.24 | 30,658.49 | 38,053.52 | 42,049.14 | 10,988.99 | 14,468.24 | 25,011.61 | 30,490.44 | 33,156.829 |
| Foshan | 11,976.98 | 17,680.1 | 27,244.68 | 34,579.72 | 38,037.692 | 10,662.58 | 14,485.61 | 21,995.08 | 26,163.76 | 28,309.188 |
| Zhaoqing | 7300.73 | 10,097.2 | 16,832.37 | 21,754.4 | 23,929.84 | 6750.84 | 7476.65 | 12,163.85 | 15,728.7 | 17,160.012 |
| Shenzhen | 21,577.24 | 28,665.25 | 32,380.86 | 40,741.88 | 44,653.1 | 18,200.67 | 21,188.84 | 22,806.54 | 26,727.68 | 28,812.439 |
| Dongguan | 14,226.05 | 22,881.8 | 35,690.02 | 42,944.23 | 46,594.49 | 12,603.21 | 21,767.78 | 25,732.81 | 31,369.01 | 33,251.151 |
| Huizhou | 10,327.78 | 15,762.77 | 23,565.24 | 29,965.02 | 32,991.487 | 8945.02 | 12,651.95 | 19,740.5 | 22,278.9 | 24,061.212 |
| Zhuhai | 15,375.9 | 18,907.73 | 25,381.58 | 32,978.21 | 36,374.966 | 12,616.21 | 14,323.66 | 20,369.83 | 24,083.48 | 26,130.576 |
| Zhongshan | 11,876 | 17,255 | 25,356.59 | 31,129.83 | 34,273.943 | 9140 | 14,288 | 18,833.13 | 22,287.55 | 24,092.842 |
| Jiangmen | 8942 | 12,903 | 21,152.5 | 27,016.58 | 29,772.271 | - | 9985 | 15,560.79 | 18,448.45 | 19,905.878 |
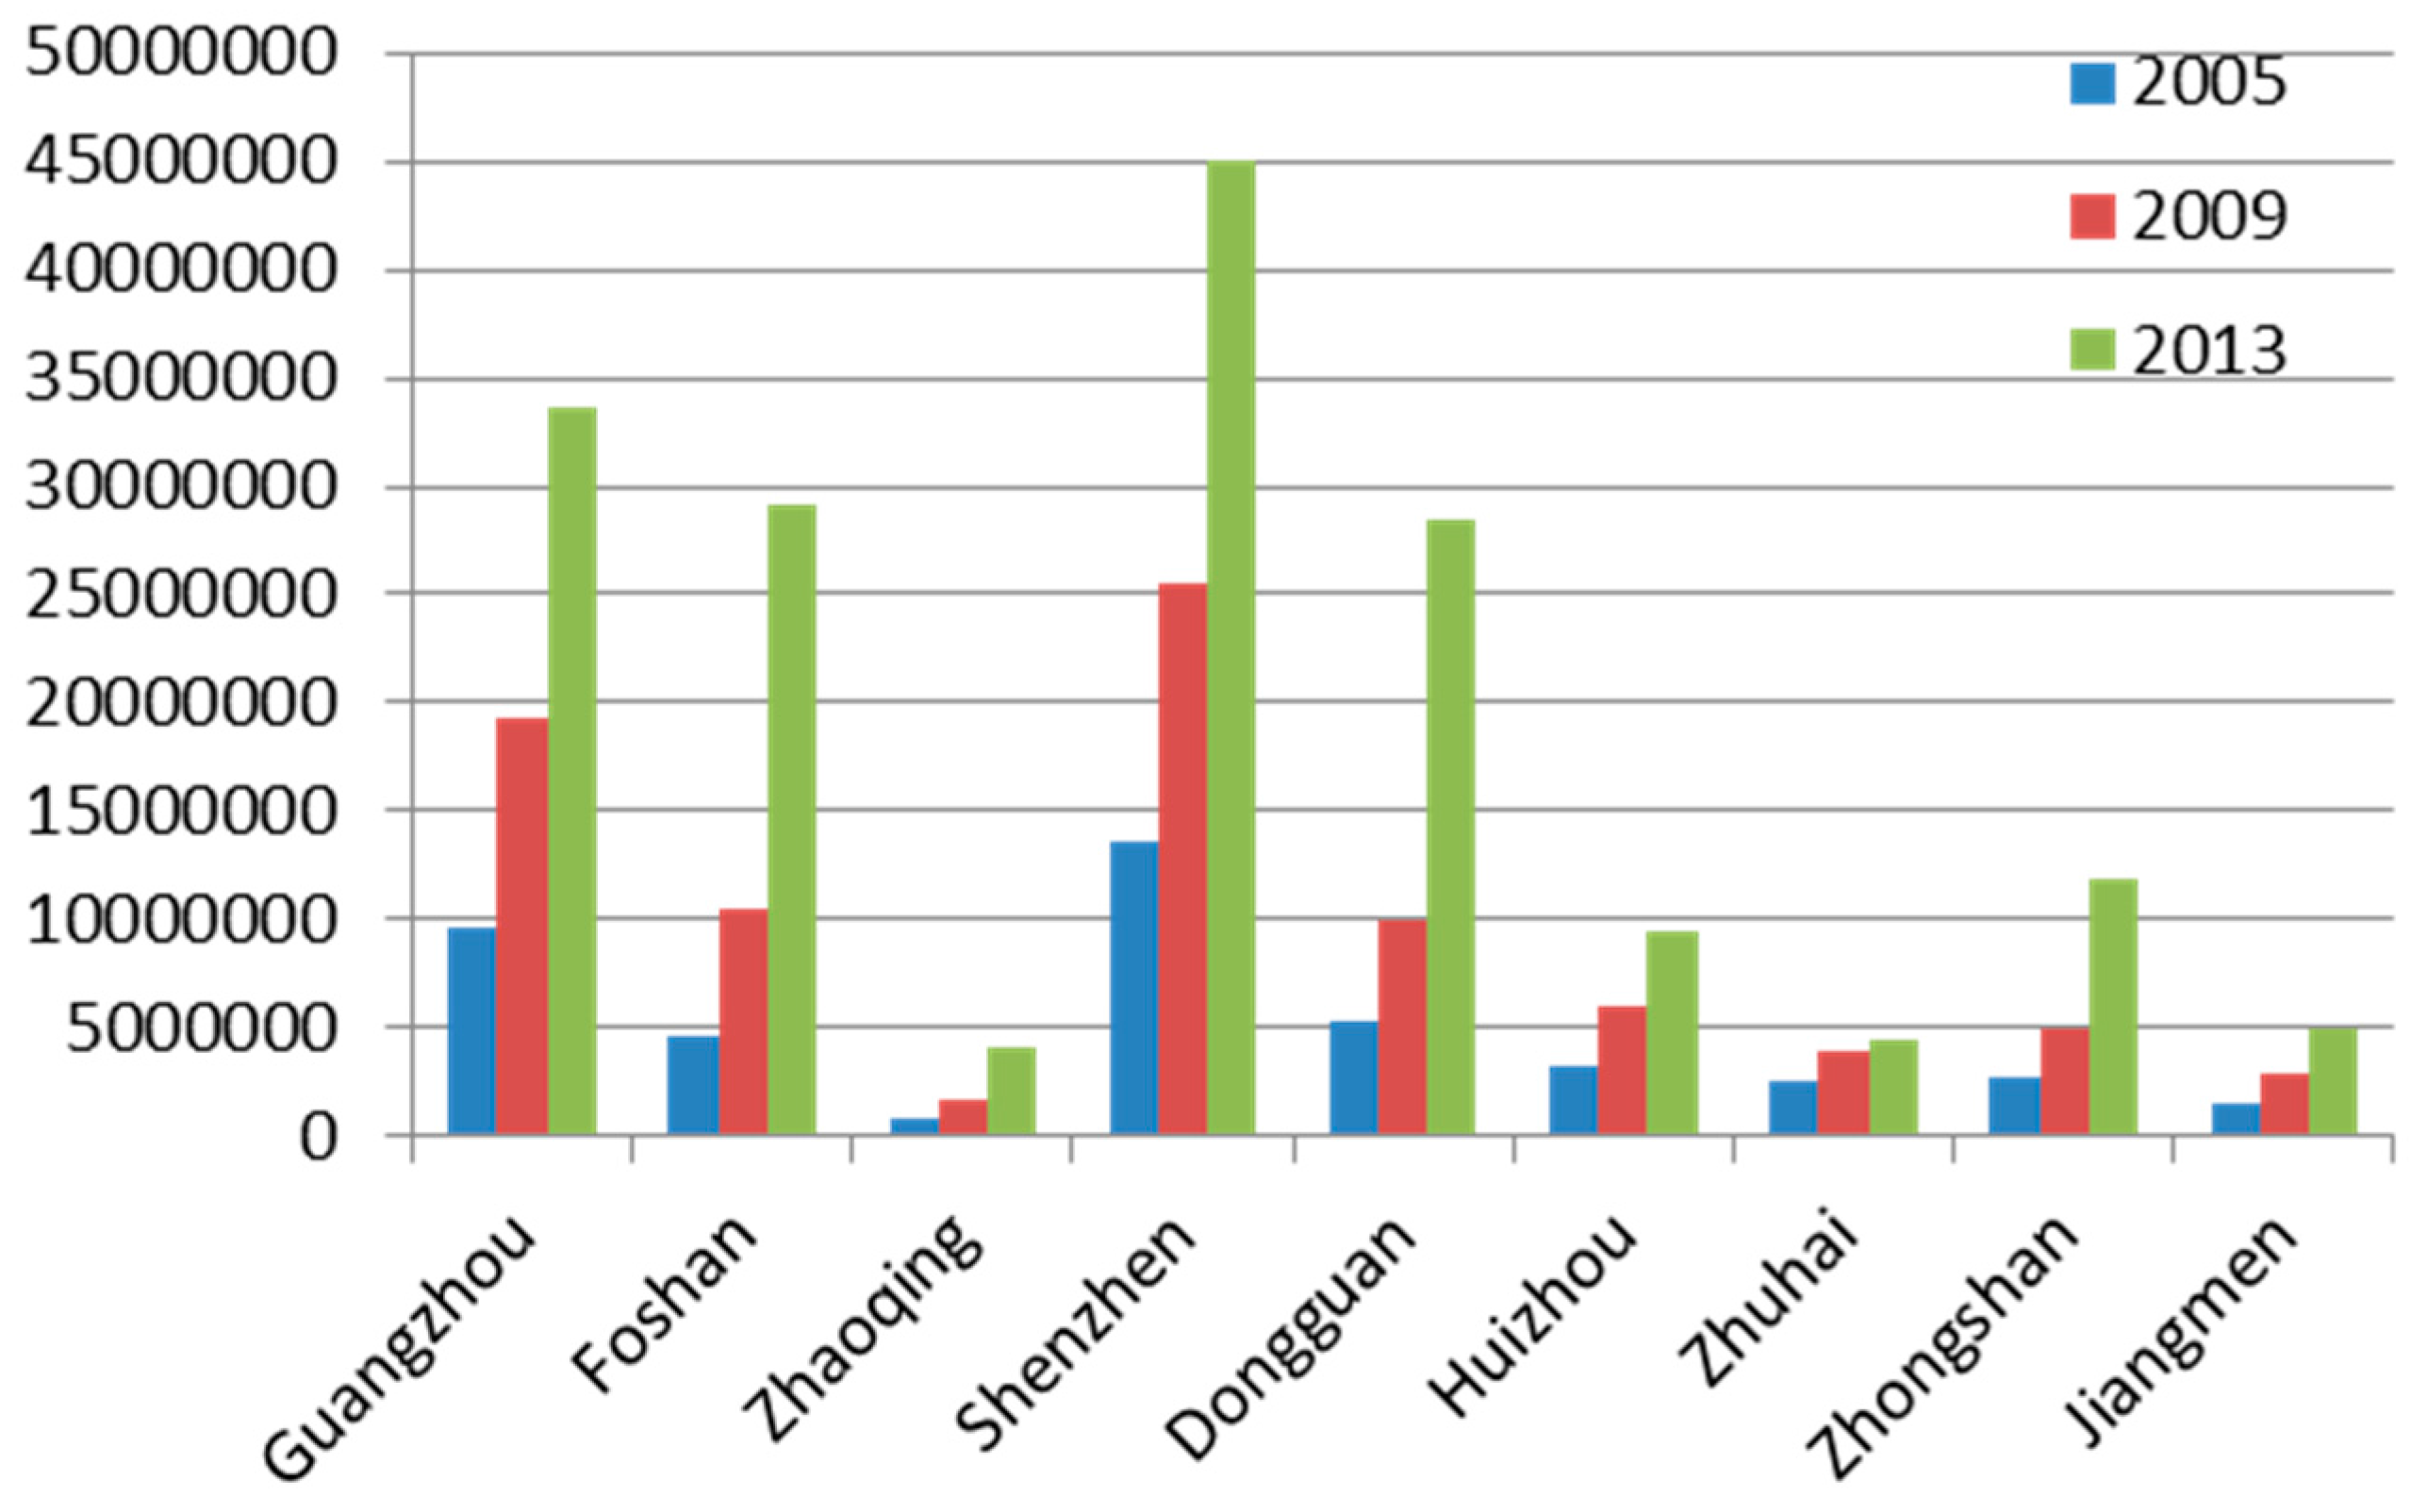
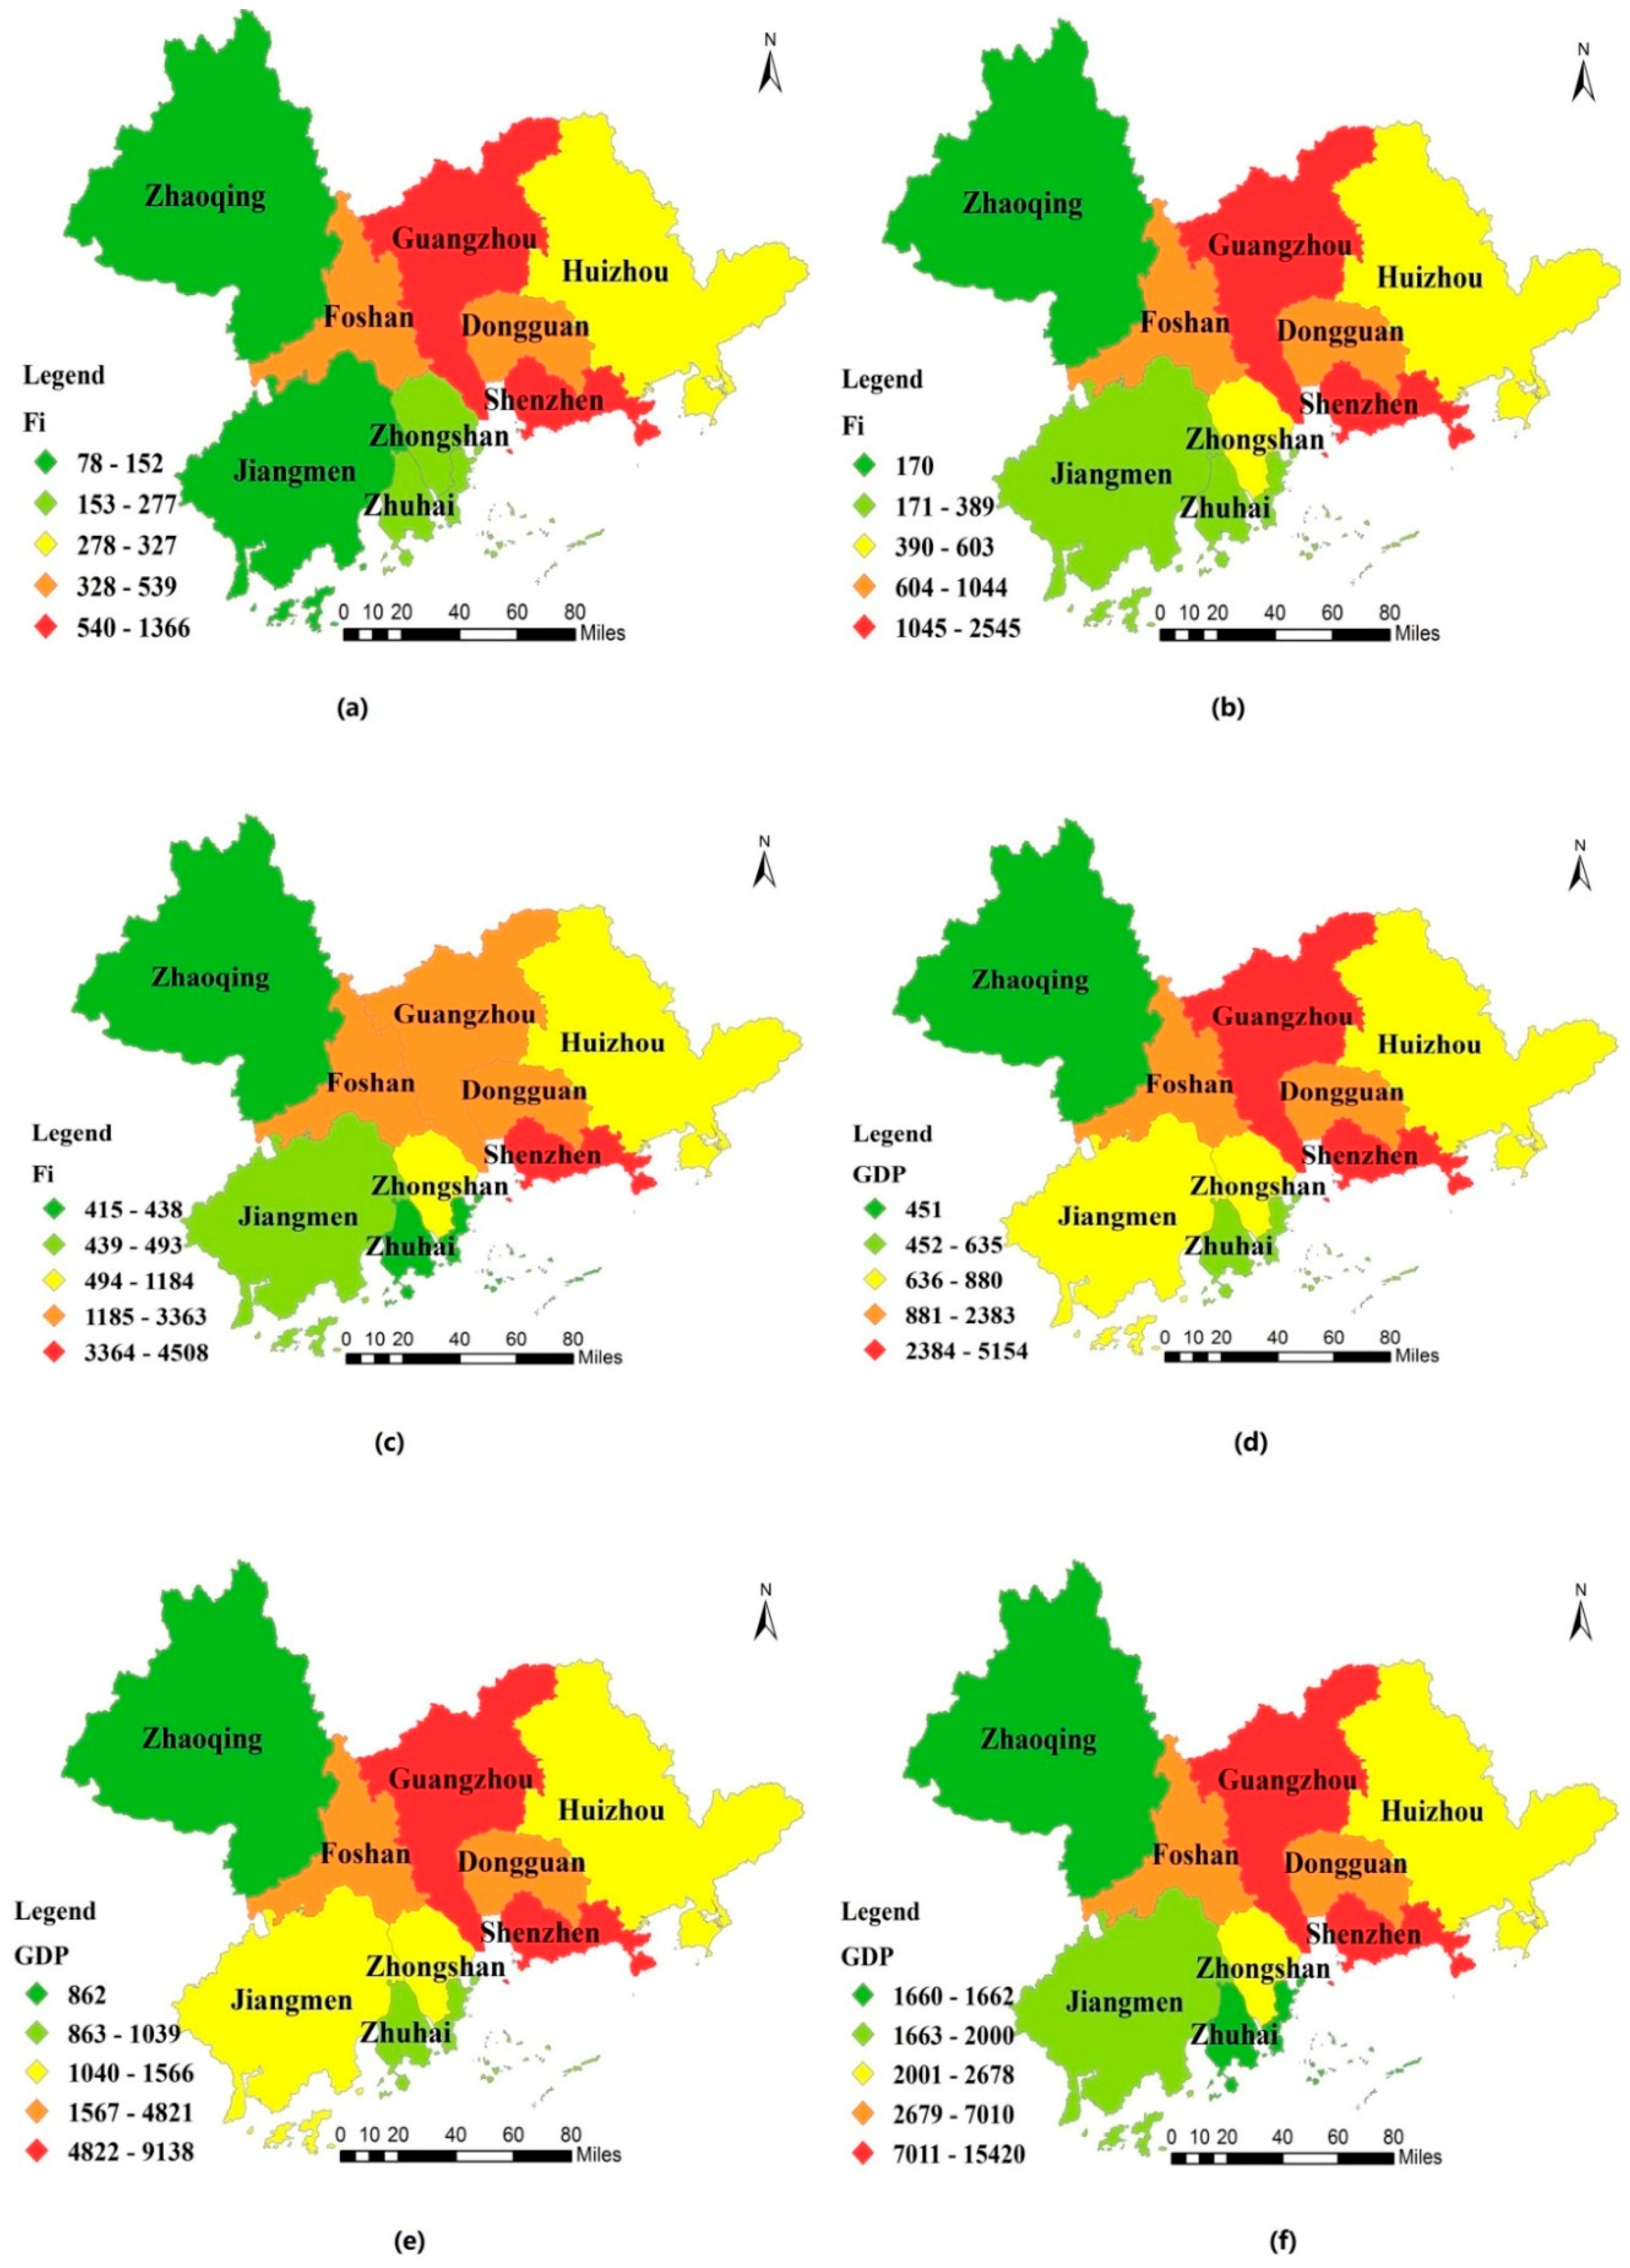
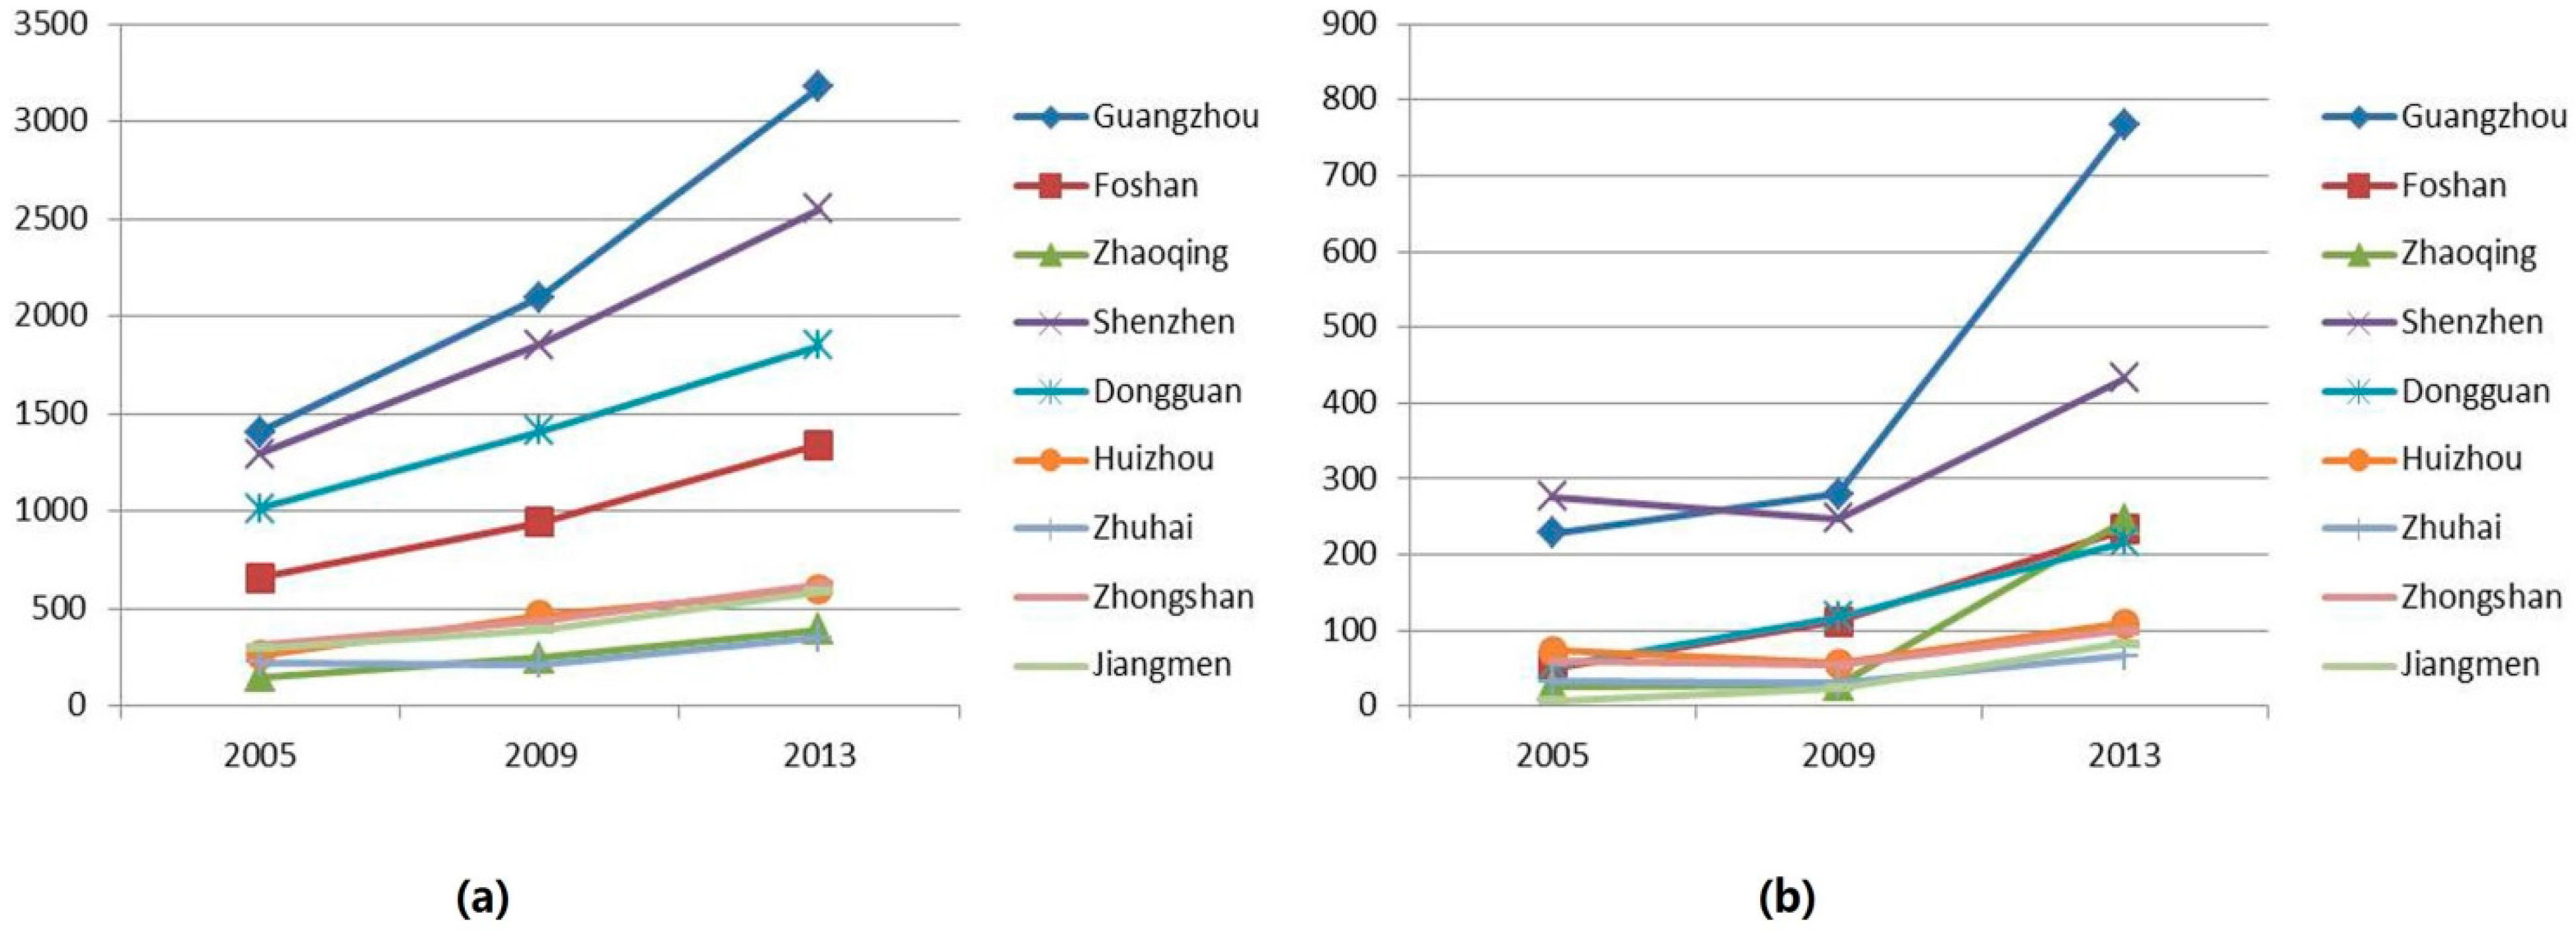
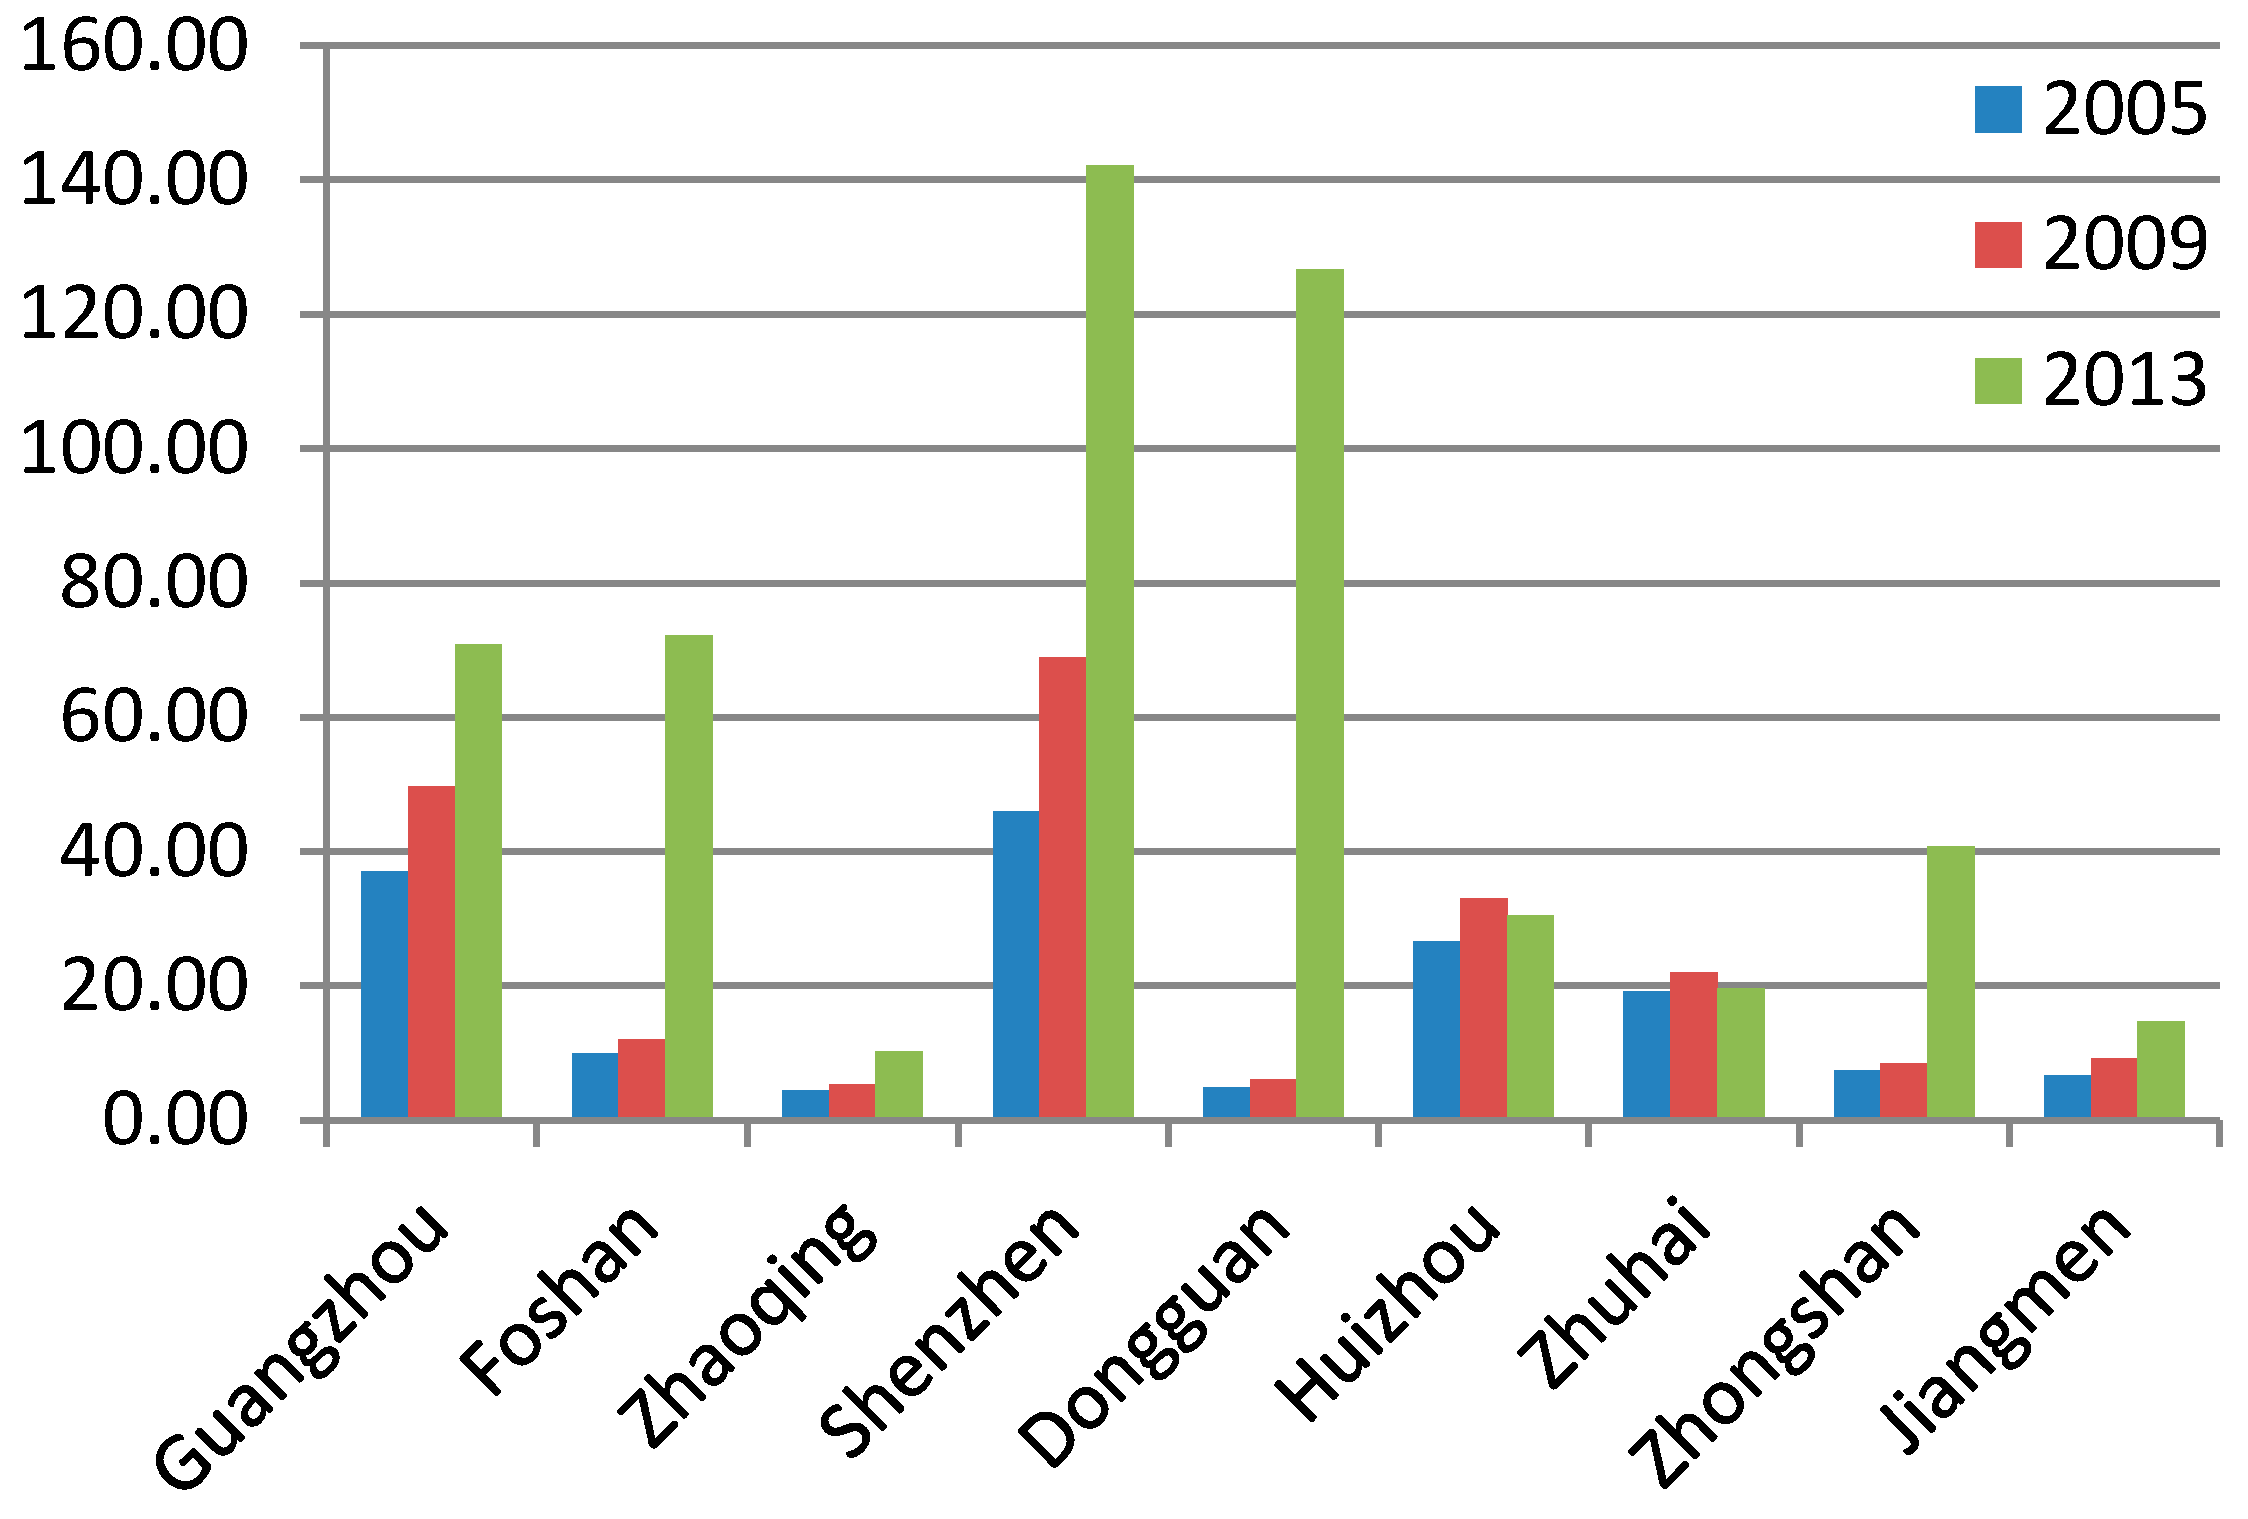
3.2. UEFC and UEFI in PRD Region
| Cities | UEFC (Ei) | UEFI (Fi) (100 million yuan) | ||||
|---|---|---|---|---|---|---|
| 2005 | 2009 | 2013 | 2005 | 2009 | 2013 | |
| Guangzhou | 37.07 | 49.71 | 70.80 | 956.58 | 1931.94 | 3363.42 |
| Foshan | 9.84 | 12.02 | 72.20 | 459.54 | 1044.29 | 2905.57 |
| Zhaoqing | 4.46 | 5.30 | 10.18 | 77.57 | 170.48 | 415.14 |
| Shenzhen | 45.99 | 68.88 | 142.19 | 1366.17 | 2544.73 | 4507.75 |
| Dongguan | 4.89 | 6.03 | 126.66 | 538.88 | 1001.27 | 2839.28 |
| Huizhou | 26.56 | 33.06 | 30.44 | 327.22 | 603.22 | 946.78 |
| Zhuhai | 19.14 | 22.05 | 19.64 | 248.40 | 389.42 | 437.72 |
| Zhongshan | 7.34 | 8.48 | 40.75 | 277.08 | 497.56 | 1184.22 |
| Jiangmen | 6.69 | 9.12 | 14.66 | 151.67 | 295.40 | 492.81 |


4. Conclusions
| Sectors | Number of Cities Whose LQ > 1 | ||
|---|---|---|---|
| 2005 | 2009 | 2013 | |
| Manufacturing | 9 | 9 | 9 |
| Transport, storage and postal services | 3 | 2 | 2 |
| Information transmission, computer services | 6 | 4 | 3 |
| Wholesale and retail trade | 1 | 2 | 1 |
| Hotels and catering services | 6 | 6 | 2 |
| Finance | 6 | 5 | 2 |
| Real estate | 3 | 3 | 3 |
| Leasing and business services | 3 | 2 | 2 |
| Scientific research, technical services | 1 | 1 | 1 |
| Water conservancy, environment management | 2 | 1 | 1 |
| Resident services and other services | 1 | 2 | 0 |
| Education | 1 | 2 | 1 |
| Health, social security and social welfare | 6 | 5 | 2 |
| Culture, sports and recreation | 1 | 1 | 1 |
| Public administration and social organizations | 2 | 2 | 1 |
Supplementary Files
Supplementary File 1Acknowledgments
Author Contributions
Conflicts of Interest
References
- Glaeser, E.; Gottlieb, J. Urban resurgence and the consumer city. Urban Stud. 2006, 43, 1275–1299. [Google Scholar] [CrossRef]
- Mayer, M. The onward sweep of social capital: Causes and consequences for understanding cities, communities and urban movements. Int. J. Urban Reg. Res. 2003, 27, 110–132. [Google Scholar] [CrossRef]
- Taylor, P.J. Leading world cities: empirical evaluations of urban nodes in multiple networks. Urban Stud. 2005, 42, 1593–1608. [Google Scholar] [CrossRef]
- Lin, X.B.; Ma, X.G.; Chao, H.; Li, G.C. Research on spatial organizational successions of the PRD mega-region by global principal component analysis method. Hum. Geogr. 2014, 29, 59–65. [Google Scholar]
- Mei, Z.X.; Xu, S.J.; Ouyang, J.; Shi, C. The spatio-temporal evolvement of spatial interaction among cities of Zhujiang River Delta in recent 20 years. Sci. Geogr. Sin. 2012, 32, 694–700. [Google Scholar]
- Xu, X.Q.; Chen, Y.H. Spatial-temporal changes of urban competitiveness in urban cluster of Pearl River Delta. Sci. Geogr. Sin. 2006, 26, 257–265. [Google Scholar]
- Yin, L.S.; Feng, B.Y. The spatial evolution of the Pearl River Delta city region. Econ. Geogr. 2012, 32, 63–70. [Google Scholar]
- Brenner, T.; Weigelt, N. The evolution of industrial clusters: Simulating spatial dynamics. Adv. Complex Syst. 2001, 4, 127–147. [Google Scholar] [CrossRef]
- Duranton, G.; Storper, M. Rising trade costs? Agglomeration and trade with endogenous transaction costs. Can. J. Econ. 2008, 41, 292–319. [Google Scholar] [CrossRef]
- Storper, M.; Venables, A.J. Buzz: Face-to-face contact and the urban economy. J. Econ. Geogr. 2004, 4, 351–370. [Google Scholar] [CrossRef]
- Scott, A.J.; Storper, M. The Nature of Cities: The Scope and Limits of Urban Theory. Int. J. Urban Reg. Res. 2015, 39, 1–15. [Google Scholar] [CrossRef]
- Henderson, J.V. Cities and Development. J. Reg. Sci. 2010, 50, 515–540. [Google Scholar] [CrossRef] [PubMed]
- McFarlane, C. The comparative city: knowledge, learning, urbanism. Int. J. Urban Reg. Res. 2010, 34, 725–742. [Google Scholar] [CrossRef]
- Robinson, J. Cities in a world of cities: the comparative gesture. Int. J. Urban Reg. Res. 2011, 35, 1–23. [Google Scholar] [CrossRef]
- Shearmur, R.; Alvergne, C. Intra metropolitan patterns of high-order business service location: A comparative study of seventeen sectors in Ile-de-France. Urban Stud. 2002, 39, 1143–1163. [Google Scholar]
- Lundmark, M. Computer Services in Sweden: Markets, labour qualifications and patterns of location. Geogr. Ann. Ser. B 1995, 77, 125–139. [Google Scholar] [CrossRef]
- Pandit, N.R.; Cook, G.A.S.; Swann, G.M.P. A comparison of clustering dynamics in the British broadcasting and financial services industries. Int. J. Econ. Bus. 2002, 9, 195–224. [Google Scholar] [CrossRef]
- Sealte, G.H. Changes in producer services location, Sydney: Globalization, technology and labor. Asia Pac. Viewp. 1998, 39, 237–255. [Google Scholar]
- Jaakko, S. Regional Externalities in the Dynamic System of Three Regions. Pap. Reg. Sci. 2006, 85, 421–442. [Google Scholar]
- Neffke, F.; Henning, M. How Do Regions Diversify over Time? Industry Relatedness and the Development of New Growth Paths in Regions. Econ. Geogr. 2011, 87, 237–265. [Google Scholar] [CrossRef]
- Márguez, M.A.; Hewings, G.J.D. Geographical Competition between Regional Economies: The Case of Spain. Ann. Reg. Sci. 2003, 37, 559–580. [Google Scholar] [CrossRef]
- Wu, F.L.; Fang, C.L.; Zhao, Y.P. The Progresses of Urban Industrial Agglomeration Dynamic Mechanism and Patterns. Prog. Geogr. 2010, 29, 1201–1208. [Google Scholar]
- Kirn, T.J. Growth and change in the service sector of the U. S.: A spatial perspective. Ann. Assoc. Am. Geogr. 1987, 77, 353–372. [Google Scholar] [CrossRef]
- Allen, J. Services and the UK space economy: Regionalization and economic dislocation. Trans. Inst. Br. Geogr. 1992, 17, 292–305. [Google Scholar] [CrossRef]
- Coe, N.M.; Townsend, A.R. Debunking the myth of localized agglomerations: The development of a regionalized service economy in South-East England. Trans. Inst. Br. Geogr. 1998, 23, 385–404. [Google Scholar] [CrossRef]
- Grover, D. The South East of England: Global region without a global city? Reg. Sci. Policy Pract. 2012, 4, 65–81. [Google Scholar] [CrossRef]
- Krapohl, S.; Meissner, K.L.; Muntschick, J. Regional Powers as Leaders or Rambos? The Ambivalent Behaviour of Brazil and South Africa in Regional Economic Integration. J. Common Mark. Stud. 2014, 52, 879–895. [Google Scholar] [CrossRef]
- Bishop, P.; Gripaios, P. Spatial externalities, relatedness and sector employment growth in Great Britain. Reg. Stud. 2010, 44, 443–454. [Google Scholar] [CrossRef]
- Barrios, S.; Bertinelli, L.; Stroble, E.; Teixeira, A.C. The dynamics of agglomeration: Evidence from Ireland and Portugal. J. Urban Econ. 2005, 57, 170–188. [Google Scholar] [CrossRef]
- Deutz, P.; Ioppolo, G. From Theory to Practice: Enhancing the Potential Policy Impact of Industrial Ecology. Sustainability 2015, 7, 2259–2273. [Google Scholar] [CrossRef]
- Ioppolo, G.; Heijungs, R.; Cucurachi, S.; Salomone, R.; Kleijn, R. Urban Metabolism: Many open questions for future answers. In Pathways to Environmental Sustainability: Methodologies and Experiences; Salomone, R., Saija, G., Eds.; Springer International Publishing AG: Dordrecht, The Netherlands, 2014; pp. 23–32. [Google Scholar]
- Kennedy, C.A.; Pincetl, S.; Bunje, P. The study of urban metabolism and its applications to urban planning and design. Environ. Pollut. 2011, 159, 1965–1973. [Google Scholar] [CrossRef] [PubMed]
- Ioppolo, G.; Cucurachi, S.; Salomone, R.; Saija, G.; Ciraolo, L. Industrial Ecology and Environmental Lean Management: Lights and Shadows. Sustainability 2014, 6, 6362–6376. [Google Scholar] [CrossRef]
- Van Berkel, R.; Fujita, T.; Hasimoto, S.; Fjuii, M. Quantitative assessment of urban and industrial symbiosis in Kawasaki Japan. Environ. Sci. Technol. 2009, 43, 1271–1281. [Google Scholar] [CrossRef] [PubMed]
- Zhang, W.Q. Study on Urban Development in Longhai-Lanxin Zone; China Building Industry Publishing House: Beijing, China, 1994; pp. 299–315. [Google Scholar]
- Wang, S.; Song, Y.; Feng, Z.; Jiang, L. Pattern and Progress of Large Urban Agglomerations and Urban Flows Intensity in Northeast China. Sci. Geogr. Sin. 2011, 31, 287–294. [Google Scholar]
- Liu, J.; Gao, S. The Research of Beijing-Tianjin-Hebei Urban Agglomerations’ Spatial Connection Based on Urban Relation Intensity and Urban Flow. Areal Res. Dev. 2013, 32, 57–61. [Google Scholar]
- Zhang, L.; Gao, S. Analysis on Spatial Connection in Beijing-Tianjin-Hebei Metropolitan Region from the Perspective of Polycentricity. Urban Dev. Stud. 2014, 21, 49–54. [Google Scholar]
- Zhu, H.; Jiang, Z. The Inherent Functional Relations of Mid-Zhejiang Urban Cluster Based on the Urban flow and its Policy Response. Urban Dev. Stud. 2008, 15, 16–20. [Google Scholar]
- Liu, H.; Yang, Q.; Yang, B.; Feng, J. Study on Inner Mongolia City Development from Perspective of Urban Flow. Resour. Dev. Mark. 2014, 30, 1239–1242. [Google Scholar]
- Ke, W.; Lu, Y.; Yu, Z.; Wang, H.; Chen, W.; Ma, Y. Spatio-temporal Evolution Patterns of External Service Capabilities of Chinese Central Cities Based on Urban Flow Intensity. Sci. Geogr. Sin. 2014, 34, 1305–1312. [Google Scholar]
- Dong, H.; Zhang, Y.; Shi, P. Analysis and its Policy Response on the Intensity of Urban Flow in the Lanzhou-Xining-Yinchuan Urban Corridor. J. Arid Land Resour. Environ. 2011, 25, 27–32. [Google Scholar]
- Han, Z.; Guo, J.; Yang, D. The Spatial Relationship between Coastal Economic Belt in Liaoning Province and its Hinterland and Interaction Strategy. Econ. Geogr. 2011, 31, 741–747. [Google Scholar]
- Statistics Bureau of Guangdong Province. Guangdong Statistical Yearbook 2014. Available online: http://www.gdstats.gov.cn/tjsj/gdtjnj/ (accessed on 10 April 2015).
- Mora, T.; Moreno, R. Specialization changes in European regions: the role played by externalities across regions. J. Geogr. Syst. 2010, 12, 311–334. [Google Scholar] [CrossRef]
- Editorial Board. China City Statistical Yearbook 2014; China Statistics Press: Beijing, China, 2015; pp. 1–477.
- Gomez-Herrera, E.; Martens, B.; Turlea, G. The Drivers and Impediments for Cross-Border E-Commerce in the EU. Inf. Econ. Policy 2014, 28, 83–96. [Google Scholar] [CrossRef]
- Erdal, A.; Burcu, K.S. The Relationship between Globalization and E-Commerce: Turkish Case. Procedia Soc. Behav. Sci. 2014, 150, 1267–1276. [Google Scholar]
- Statistics Bureau of Guangdong Province. Post and Telecommunications Performed Positive Growth Trend in Guangdong in the first half of 2015. Available online: http://www.gdstats.gov.cn/tjzl/tjkx/201507/t20150722_310004.html (accessed on 22 July 2015).
- Dongguan Municipal Postal Administration. Running Condition of the Postal Industry in Dongguan in May, 2015. Available online: http://gddg.spb.gov.cn/xytj_7842/tjxx/201506/t20150616_515414.html (accessed on 16 June 2015).
- Zhongshan Municipal Postal Administration. Running Condition of the Postal Industry in Zhongshan in May, 2015. Available online: http://gdzs.spb.gov.cn/xytj_7938/tjxx/201506/t20150619_518339.html (accessed on 19 June 2015).
- Jiangmen Municipal Postal Administration. Running Condition of the Postal Industry in Jiangmen in May, 2015. Available online: http://gdjm.spb.gov.cn/xytj_7970/tjxx/201506/t20150616_515442.html (accessed on 16 June 2015).
- Li, X.; Wen, F.H.; Xu, X.Q. Urban size structure and fractal characteristics of PRD since implementing the reform& open policy. Trop. Geogr. 2007, 27, 239–244. [Google Scholar]
- Tsekeris, T.; Vogiatzoglou, K. Public infrastructure investments and regional specialization: empirical evidence from Greece. Reg. Sci. Policy Pract. 2014, 6, 265–289. [Google Scholar] [CrossRef]
- Bickenbach, F.; Bode, E. Disproportionality measures of concentration, specialization, and localization. Int. Reg. Sci. Rev. 2008, 31, 359–388. [Google Scholar] [CrossRef]
- Chatman, D.G.; Noland, R.B. Do public transport improvements increase agglomeration economies? A review of literature and an agenda for research. Transp. Rev. 2011, 31, 725–742. [Google Scholar] [CrossRef]
- Hanson, G.H. Market potential, increasing returns and geographic concentration. J. Int. Econ. 2005, 67, 1–24. [Google Scholar] [CrossRef]
- Gregory, B.; Vicente, G. Regional industrial growth in Mexico: Do human capital and infrastructure matter? J. Policy Model. 2013, 35, 228–242. [Google Scholar]
© 2015 by the authors; licensee MDPI, Basel, Switzerland. This article is an open access article distributed under the terms and conditions of the Creative Commons Attribution license (http://creativecommons.org/licenses/by/4.0/).
Share and Cite
Wang, M.; Kuang, Y.; Huang, N. Sustainable Urban External Service Function Development for Building the International Megalopolis in the Pearl River Delta, China. Sustainability 2015, 7, 13029-13054. https://doi.org/10.3390/su71013029
Wang M, Kuang Y, Huang N. Sustainable Urban External Service Function Development for Building the International Megalopolis in the Pearl River Delta, China. Sustainability. 2015; 7(10):13029-13054. https://doi.org/10.3390/su71013029
Chicago/Turabian StyleWang, Meng, Yaoqiu Kuang, and Ningsheng Huang. 2015. "Sustainable Urban External Service Function Development for Building the International Megalopolis in the Pearl River Delta, China" Sustainability 7, no. 10: 13029-13054. https://doi.org/10.3390/su71013029