1. Introduction
Over the last 110 years, the annual consumption of energy resources in the world has increased 20 times from 0.6 in 1900 to 12.4 billion tons of oil equivalent (toe) in 2012 [
1,
2]. During the same time period, the structure of consumption of energy resources has changed significantly. The proportion of coal has been reduced from 90% in 1900 to 30% in 2012; and, at the same time, the proportion of oil and gas has increased to 33% and 24%, respectively. Together, coal, oil and gas, in the structure of the consumption of primary energy resources, are about 87%.
Oil and gas are considered non-renewable energy resources, which means that there will be a peak, and after peak production the availability of these resources will start to decrease. Many articles and books have been written in the last decade about peak oil, and the likelihood is that the world’s production of traditional oil is now at a peak, with a maximum level of 75 million barrels a day [
3]. It is known that hydrocarbons are produced for the purpose of obtaining energy and therefore, in line with data on volumes of production, it is important to know the EROI for production of those volumes. The energy return on investment (EROI) is the ratio of how much energy is gained from an energy production process compared to how much of that energy (or its equivalent from some other source) is required to extract, grow,
etc. [
4].
A large percentage of the research dedicated to the calculation of energy efficiency of production of various energy resources was published in recent years. In this regard, it should be noted that the Swiss online scientific journal Sustainability, in 2011, published 21 articles dedicated to the EROI. That issue posted the results of research and calculations of the EROI of oil and gas:
Oil production in California from 1955 to 2005 [
5];
Oil and gas production in the USA. In 2007, the EROI for oil and gas production was about 11:1 [
6];
Production of ultradeep-water oil and natural gas in the Gulf of Mexico. In 2007, at the well-head the EROI ranged from 7–22:1 [
7];
Oil production in Norway. In later half of last the decade the EROI was about 40:1 [
8];
Preliminary calculation of the EROI for Oil Shale including internal energy is 2:1 [
9];
Oil production on the Daqing field, China. In 2009, the EROI was about 6.5:1 [
10]
Russia is the largest oil-producing country and therefore it is important to calculate the energy efficiency of oil production in Russia.
The Federal bill No. 261 “On Energy Saving and Enhanced Energy Efficiency” was adopted in Russia at the end of 2009. The focus was “on energy saving and on the increase of energy efficiency”. This bill talked about the need for an energy audit in industrial enterprises, including oil and gas production and processing. Therefore, oil companies that had not been keeping a systematic account of the consumed energy were now being compelled to account for the consumption of energy in all production sectors: exploration and production, logistic, processing, and sales. Some companies provided data on energy consumption in their annual reports, and based on that data, there is now an opportunity to calculate the EROI for oil production in Russia.
The purpose of this article is to calculate the EROI of oil production in Russia. For this purpose, the data published in official annual reports of the oil producing companies have been used.
2. Data for the EROI Calculation
2.1. Hydrocarbon Production and Energy Consumption in Russia
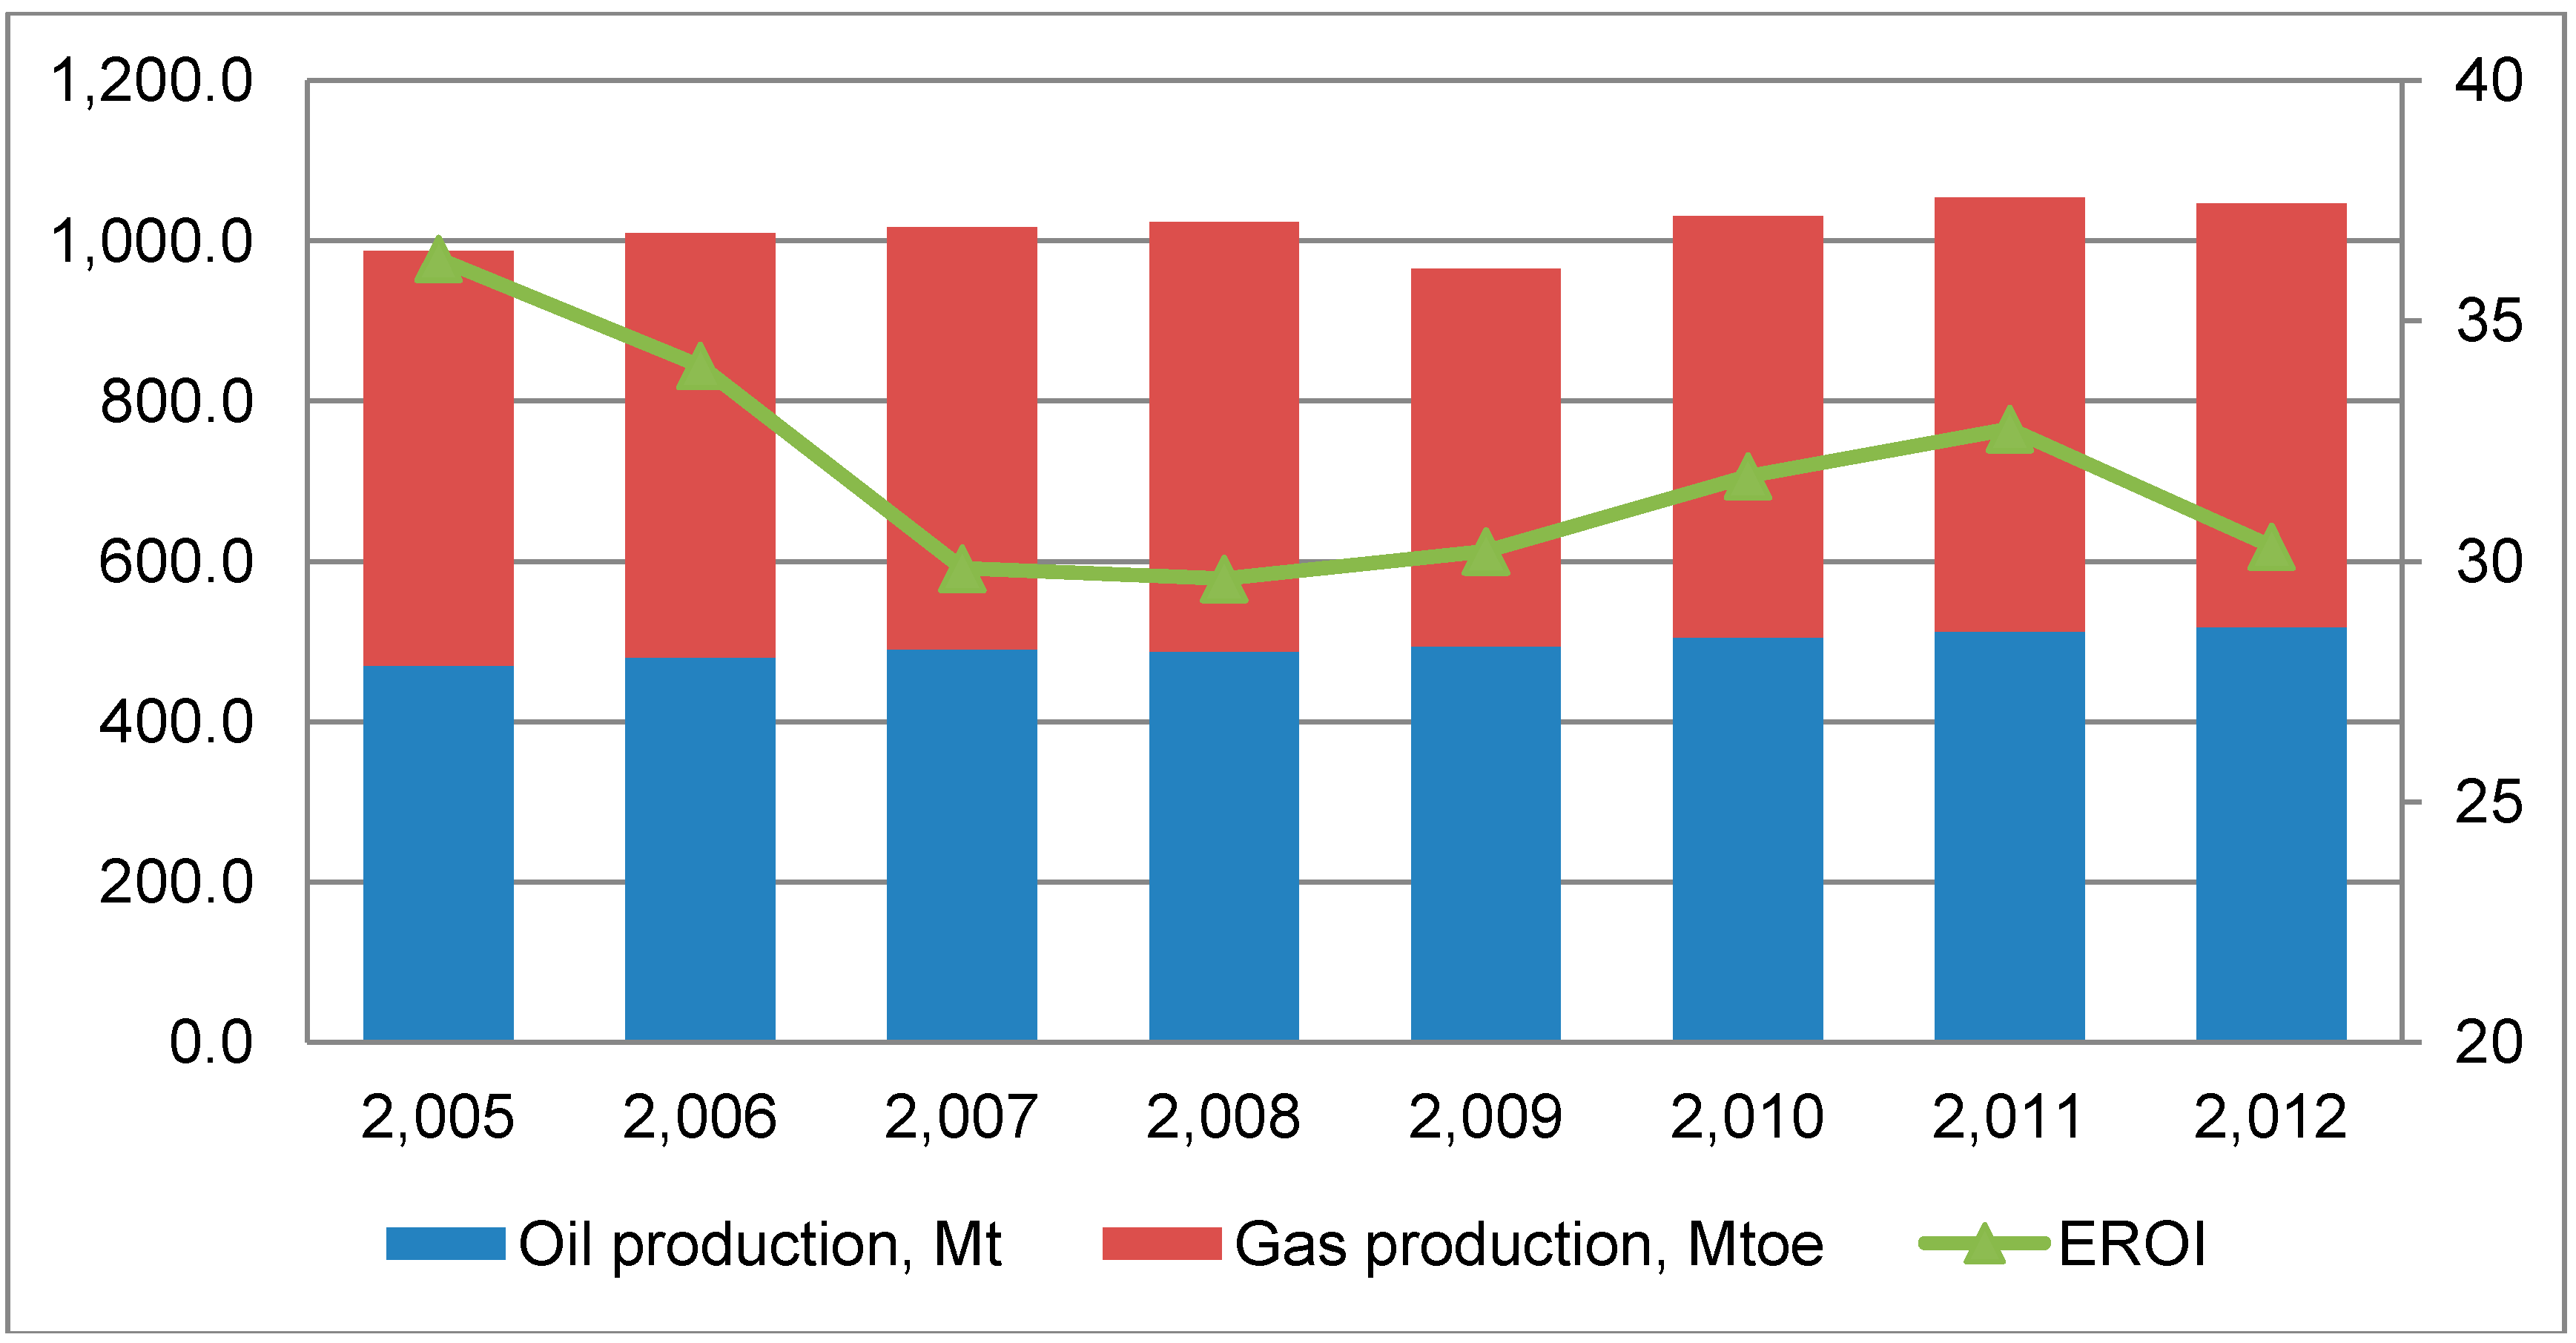
The Russian statistics agency provides data on hydrocarbon production and energy consumption for production and transportation of oil and gas. Open access data is available since 2005 (
Table 1) [
11].
Rosstat collects all the necessary information and forms an energy balance. On the balance sheet, there is data about oil and gas production as well as the total energy consumption for production of oil and gas combined.
Table 1.
Hydrocarbon production in Russia.
Table 1.
Hydrocarbon production in Russia.
| No. | Title | 2005 | 2006 | 2007 | 2008 | 2009 | 2010 | 2011 | 2012 |
|---|
| 1 | Production |
| 1.1 | Oil production, Mt. | 470.0 | 480.3 | 490.7 | 487.8 | 494.1 | 505.1 | 512.2 | 518.5 |
| 1.2 | Gas production, Mtoe | 516.9 | 529.4 | 525.5 | 535.6 | 471.0 | 525.4 | 541.1 | 528.1 |
| 1.3 | Total production, Mtoe | 986.9 | 1009.6 | 1016.2 | 1023.4 | 965.0 | 1030.5 | 1053.3 | 1046.6 |
| 2 | Consumption |
| 2.1 | Energy resource, Mtoe | 8.9 | 8.9 | 13.1 | 12.3 | 9.5 | 9.1 | 8.5 | 10.1 |
| 2.1.1 | Gas | 8.8 | 8.7 | 12.7 | 11.7 | 9.2 | 8.7 | 8.3 | 10.0 |
| 2.1.2 | Oil | 0.1 | 0.1 | 0.4 | 0.6 | 0.3 | 0.3 | 0.1 | 0.1 |
| 2.2 | Fuels, Mtoe | 1.6 | 1.9 | 1.6 | 1.5 | 1.1 | 1.5 | 0.8 | 0.7 |
| 2.3 | Electricity, Mtoe | 14.2 | 16.4 | 17.1 | 18.5 | 18.9 | 19.7 | 20.8 | 21.7 |
| 2.4 | Thermal Energy, Mtoe | 2.4 | 2.5 | 2.2 | 2.2 | 2.4 | 2.2 | 2.1 | 2.0 |
| 2.5 | Total consumption, Mtoe | 27.2 | 29.6 | 34.0 | 34.5 | 31.9 | 32.4 | 32.2 | 34.5 |
Energy consumption includes:
Energy for drilling and construction;
Energy for extraction and primal processing;
Energy for transportation of hydrocarbons.
Unfortunately, there is no data on the energy consumption separated for each activity sector, as there is no data on embodied energy consumption. In the future, Rosstat’s methodology of calculation energy consumption should be revisited and developed to show more data.
2.2. Oil Producing Companies
Not all Russian oil companies provide data on energy consumption in annual reports. The companies that do provide information on energy consumption are “Rosneft”, “Bashneft”, “Tatneft”, “Gazprom Neft”, and “TNK-BP” (which in 2013 merged with “Rosneft”).
The companies that do not provide information on energy consumption are “Surgutneftegas”, “Russneft”, “Slavneft”, and “Lukoil”.
In Russia, there is no independent organization that makes an estimation of energy consumption in oil and gas companies. Therefore, it is hard to give any estimation about quality of data given in reports. At the moment, the data in reports is a black box and for the purpose of a deep analysis of the EROI we need to open it in order to understand how and what data is related to collecting, methodology, etc. Right now, we don’t have access to that information. For the purpose of a preliminary calculation, we should trust this data (as far as we trust any information given in reports in general).
2.2.1. OJSC Open Joint Stock Company “Gazprom Neft” (OJSC “Gazprom Neft”)
“Gazprom Neft” is a vertically integrated oil company. Its main activities are the exploration, development, production and sale of oil and gas, as well as the production and sale of petroleum products. Proved reserves according to SPE (PRMS) at the end of 2012 were more than 1.2 Gtoe. The company operates in major oil and gas regions of Russia: Khanty-Mansi and Yamal-Nenets region, Tomsk, Omsk, Orenburg regions. “Gazprom Neft” has several projects outside of Russia, for example in Iraq and Venezuela.
“Gazprom Neft” in its annual reports provides data on the amount of consumed electricity and heat in sectors “exploration and production” and “processing” (
Table 2) [
12]. Data on material consumption is not published.
Table 2.
Data from annual reports of OJSC “Gazprom Neft”.
Table 2.
Data from annual reports of OJSC “Gazprom Neft”.
| No. | OJSC “Gazprom Neft” | 2010 | 2011 | 2012 |
|---|
| 1 | Production figures | | | |
| 1.1 | Oil production, Mt. | 31.1 | 31.5 | 32.9 |
| 1.2 | Gas production, Gm3 | 3.6 | 7.3 | 8.7 |
| 1.3 | Oil processing in Russia, Mt. | 35.1 | 38.1 | 39.2 |
| 1.4 | The yield of light products | 63% | 60% | 59% |
| 1.5 | Wells commissioned | 765 | 760 | 708 |
| 1.6 | Average oil flow rate of existing wells, t/day | | 15.2 | 14.3 |
| 2 | Energy consumption by sector | | | |
| | Exploration and production | | | |
| 2.1 | Electricity, GWh | 4886 | 4577 | 4902 |
| 2.2 | Thermal energy, Tcal | 26.6 | 20.5 | 29.1 |
| | Processing, transportation and distribution | | | |
| 2.3 | Electricity, GWh | 2.88 | 2.99 | 3.12 |
| 2.4 | Thermal energy, Tcal | 3597 | 3895 | 4025 |
2.2.2. OJSC “Bashneft”
OJSC “Bashneft” is a vertically integrated company engaged in production and processing of oil in Russia, which sells crude oil and petroleum products in the domestic and foreign markets. Proved reserves according to SPE (PRMS) classification at the end of 2012 increased to 2 billion barrels of oil. The main production region is the Republic of Bashkortostan.
Table 3.
Data from annual reports of OJSC “Bashneft”.
Table 3.
Data from annual reports of OJSC “Bashneft”.
| No. | OJSC “Bashneft” | 2010 | 2011 | 2012 |
|---|
| 1 | Production figures | | | |
| 1.1 | Oil production, Mt. | 14.1 | 15.1 | 15.4 |
| 1.2 | Gas production, Gm3 | 0.41 | 0.45 | 0.42 |
| 1.3 | Oil processing in Russia, Mt. | 21.2 | 21.1 | 20.8 |
| 1.4 | The yield of light products | 61.8% | 59.9% | 59.7% |
| 1.5 | Wells commissioned | 148 | 98 | 42 |
| 1.6 | Average oil flow rate of existing wells, t/day | 2.5 | 2.8 | 2.9 |
| 2 | Energy consumption by sector | | | |
| | Exploration and production | | | |
| 2.1 | Electricity, GWh | | 2821 | 2886 |
| 2.2 | Thermal energy, Tcal | | 260 | 388 |
| | Processing, transportation and distribution | | | |
| 2.3 | Electricity, GWh | | 2790 | 2893 |
| 2.4 | Thermal energy, Tcal | | 7086 | 7288 |
Annual reports since 2011 provide data on energy consumption by sector of activity (
Table 3) [
13]. Data on material consumption is not published.
2.2.3. OJSC “Rosneft”
“Rosneft” is the largest oil producing company in Russia. After the merger with “TNK-BP”, “Rosneft” has become one of the largest companies in the world. The geography of “Rosneft” in sector “exploration and production” covers the major oil and gas provinces of Russia, Western Siberia, Southern and Central Russia, Timan-Pechora, Eastern Siberia, the Far East and the Arctic offshore. The company also has projects in Kazakhstan, Algeria, Venezuela and in the United Arab Emirates. Proved reserves according to PRMS classification at the end of 2012 increased to 2.5 Gt.
The company’s annual report provides a significant amount of data but, unfortunately, little attention is paid to issues of energy consumption. The reports only published the value of energy consumption for the whole company without a separation by sector of activity (
Table 4) [
14]. Data on material consumption is not published.
Table 4.
Data from annual reports of OJSC “Rosneft”.
Table 4.
Data from annual reports of OJSC “Rosneft”.
| No. | OJSC “Rosneft” | 2010 | 2011 | 2012 |
|---|
| 1 | Production figures | | | |
| 1.1 | Oil production, Mt. | 115.8 | 118.7 | 122 |
| 1.2 | Gas production, Gm3 | 12.34 | 12.79 | 16.39 |
| 1.3 | Oil processing in Russia, Mt. | 50.5 | 50.5 | 50.9 |
| 1.4 | The yield of light products | 55.8% | 56.6% | 56.7% |
| 1.5 | Wells commissioned | 871 | 1053 | 1183 |
| 1.6 | Average oil flow rate of existing wells, t/day | 14.9 | 15.2 | 18.2 |
| 2 | Total energy consumed, ktoe. | 6069.7 | 6304.9 | 6641.6 |
2.2.4. OJSC “TNK-BP”
In 2013, the merger of “Rosneft” and “TNK-BP” was completed; and subsequently “TNK-BP” does not exist anymore. Nevertheless; we can make an EROI calculation based on the published 2012 annual report.
“TNK-BP” had been in the top three among Russian oil companies. At the end of 2012, “TNK-BP” had oil reserves of 9.8 billion barrels. Production units of the company located in Western and Eastern Siberia and the Volga-Urals region. Note that “TNK-BP” was developing one of the largest oil fields in the world, the Samotlor oil field.
In the report for 2012, as in the case with “Rosneft”, data is provided on the energy consumption for the whole company, without separation by sectors (
Table 5). Data on material consumption is not published [
15].
Table 5.
Data from annual report of OJSC “TNK-BP”.
Table 5.
Data from annual report of OJSC “TNK-BP”.
| No. | OJSC “TNK-BP” | 2010 | 2011 | 2012 |
|---|
| 1 | Production figures | | | |
| 1.1 | Oil production, Mt. | 73.8 | 74.6 | 74.9 |
| 1.2 | Gas production, Gm3 | 12.8 | 14.1 | 14.8 |
| 1.3 | Oil processing in Russia, Mt. | 24.3 | 24.5 | 25 |
| 1.4 | The yield of light products | 57% | 54% | 54% |
| 1.5 | Wells commissioned | 580 | 651 | 527 |
| 1.6 | Average oil flow rate of existing wells, t/day | | | 12.8 |
| 2 | Energy consumption | | | |
| 2.1 | Electricity, GWh | | | 12,742 |
| 2.1 | Thermal energy, Tcal | | | 1271 |
| 2.3 | Fuel, kt | | | 116.2 |
| 2.4 | Gas, Gm3 | | | 1.3 |
2.2.5. OJSC “Tatneft”
The company “Tatneft” is a Russian oil and gas company. The main reserve is historically located in the territory of the Republic of Tatarstan. In addition, the company outside Tatarstan operates in Samara, Orenburg, Ulyanovsk region, Nenets Autonomous Okrug, and the Republic of Kalmykia. Proved reserves at the end of 2012 increased to 869 Mt.
Unlike other companies, “Tatneft” provides a specific consumption of energy per 1 ton of crude oil production [
16]. The consumption of heat energy is not available as well as data on material consumption (
Table 6).
Table 6.
Data from annual report of OJSC “Tatneft”.
Table 6.
Data from annual report of OJSC “Tatneft”.
| No. | OJSC “Tatneft” | 2010 | 2011 | 2012 |
|---|
| 1 | Production figures | | | |
| 1.1 | Oil production, Mt. | 25.8 | 25.9 | 26.005 |
| 1.2 | Gas production, Gm3 | 0.77 | 0.79 | 0.84 |
| 1.4 | Wells commissioned | 331 | 309 | 326 |
| 1.5 | Average oil flow rate of existing wells, t/day | | 3.8 | 3.8 |
| 1.6 | Specific energy consumption, kwh/t. oil | 118.5 | 117.7 | 116.5 |
We have to say that very little data is given on energy consumption and no data on material consumption, equipment purchasing. Because of that, we cannot perform an in-depth EROI analysis. It can be performed with the following additional data:
- (1)
Separate data on energy consumption by sectors: drilling, construction, oil extraction, transportation, and processing;
- (2)
Data on material consumption: steel and cement for wells and on-field pipeline;
- (3)
Data on field equipment.
At this moment, we only can give an estimation of the steel and cement used to complete wells. There is no data in the public domain on the purchasing of on-field equipment for each company. The only way to get this data and calculate embodied energy is to cooperate with companies’ representatives. It can be done in the future. In this article, we will not do any estimation on equipment issue because this estimation will be too speculative.
3. EROI Methodology
There are three approaches to calculating EROI [
4], which have been repeatedly spoken of in previously published articles. The first consists of calculating the energy spent for production which is expressed in energy units (kWh, Gcal, fuel tons,
etc.) and then relating it to an extracted volume of energy. However, it often happens that there is no data on the consumption of energy. In this case, it is possible to utilize the second approach, and calculate EROI through energy intensities. The second approach is used more often as it often appears too difficult to obtain data on consumption of energy and materials. The third way is to use a combined approach.
In this article, we will focus on first method.
3.1. EROI Methodology for Oil Production
As it was written in previous articles, definition and general formula of the EROI calculation for life time of any energy project is following [
17]:
where
Eg—energy gained;
Ec—energy input to construction;
Eop—energy required to operate and maintain the project;
Ed—energy required for decommissioning.
The most difficult question is what to consider as “energy input” for each project`s stage? There are 5 boundaries for energy inputs and for each boundary special EROI is determined:
- (1)
Direct energy and material inputs (EROI1,d);
- (2)
Direct and indirect energy and material inputs (EROIstnd);
- (3)
Direct and indirect energy and material inputs and indirect labor consumption (EROI1,lab);
- (4)
Direct and indirect energy and material inputs, indirect labor consumption and auxiliary services consumption (EROI1,aux);
- (5)
Direct and indirect energy and material inputs, indirect labor consumption, auxiliary services consumption and environmental (EROI1,env).
In this article, we will calculate the EROI
1,d, but first we must specify all energy inputs for the oil field development project. The energy and materials inputs for following activities will be considered as “direct”:
- (1)
Construction:
Drilling rig mobilization, site prep, demobilization;
Well drilling;
Well completion;
Steel for well casing;
Concrete for well casing;
On-site engines and similar equipment;
Steel and construction for associated necessary pipelines.
- (2)
Operation
Electricity used for oil extraction;
Electricity used for oil primary processing;
Thermal energy used for heating;
Energy and materials for additional drilling and construction;
Energy and materials for repairs.
- (3)
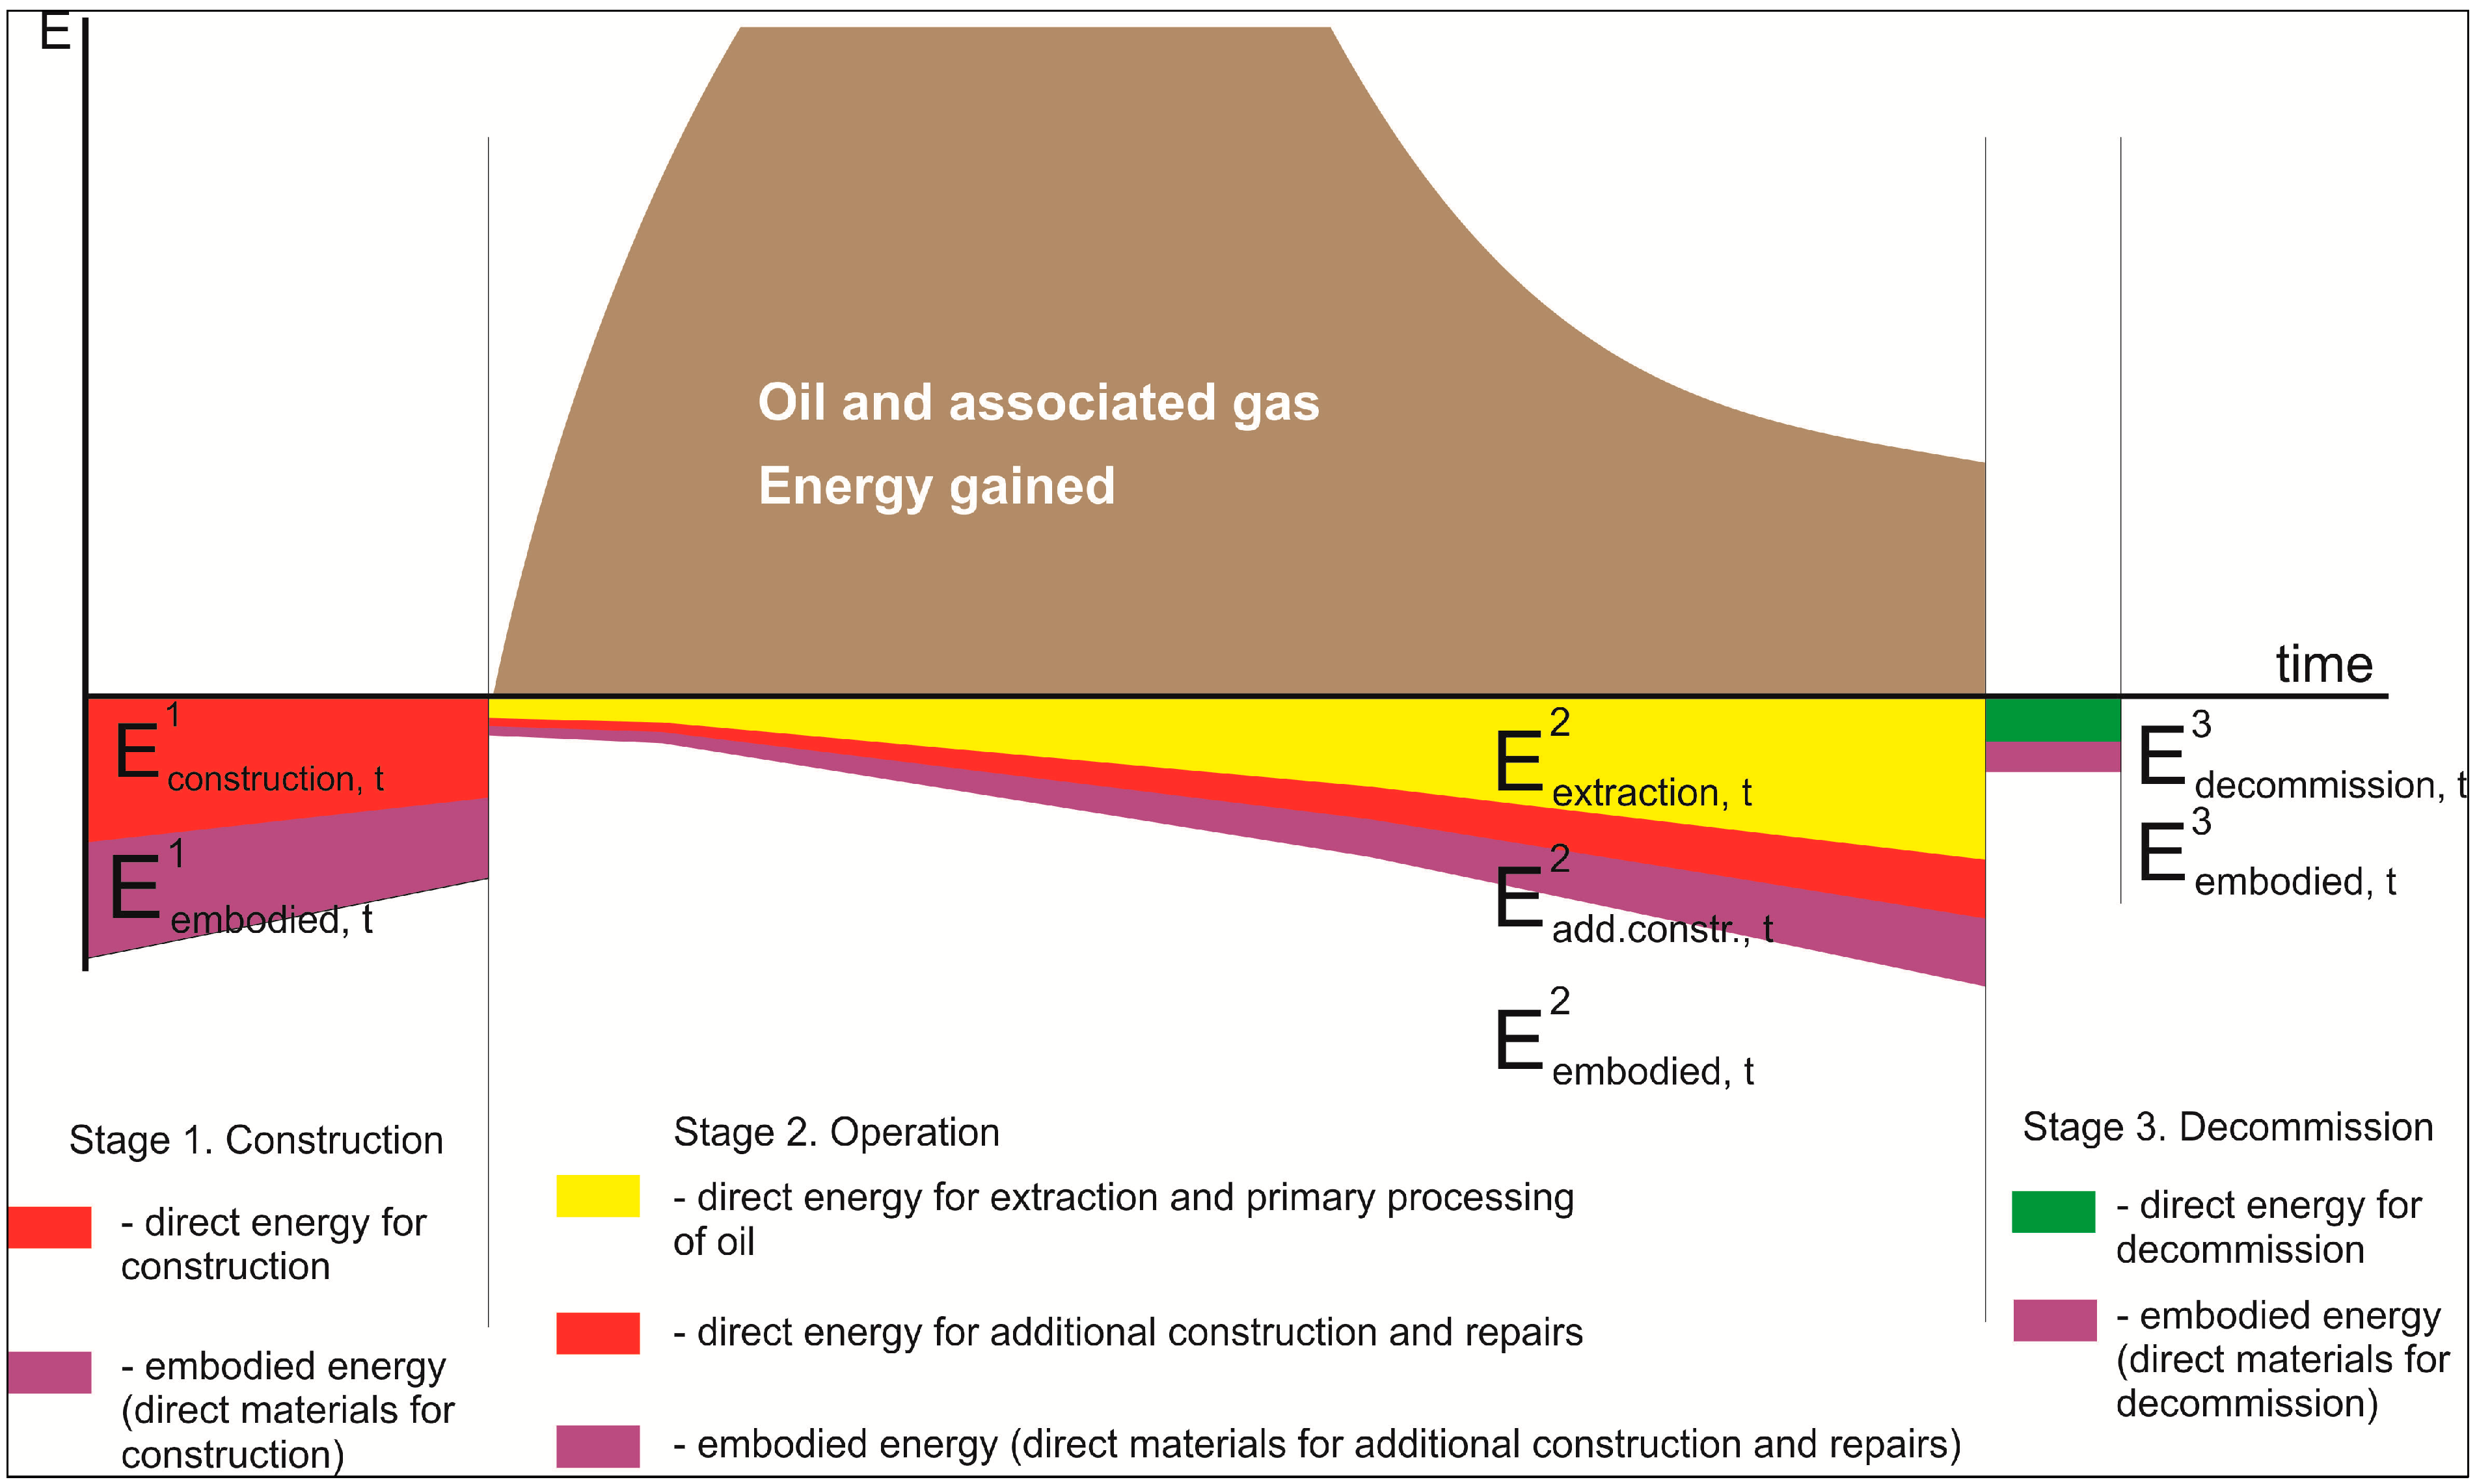
All activities can be divided in three stages of oil field development project (
Figure 1).
Figure 1.
Energy input and output from an oil field development project.
Figure 1.
Energy input and output from an oil field development project.
Base on the scheme we can specify EROI formulas for oil production:
- (1)
EROI for extraction in one year:
EROIextr (t) shows the impact of reserves depletion on energy profitability of project. It can be very useful to exclude all additional energy which is needed to drill new wells etc., to see how reserves depletion influences on energy efficiency.
- (2)
EROI for field development per year:
EROIdev (t) shows the impact of reserves depletion and intensity of additional construction on energy profitability of project. Depending on drilling and construction intensity it can significantly vary from year to year.
- (3)
EROI final for all life time (or for certain years of project’s life)
where
- (1)
∑Е1 = ∑Е1construction + ∑Е1embodied
- (2)
∑Е2 = ∑Е2extraction + ∑Е2add.constr. + ∑Е2embodied
- (3)
∑Е3 = ∑Е3decomm. +∑Е3embodied
EROIfinal shows energy result for life time of project. It should be noted that decommission energy costs can be calculated during project operation time.
3.2. EROI Methodology for Production of Oil Light Products
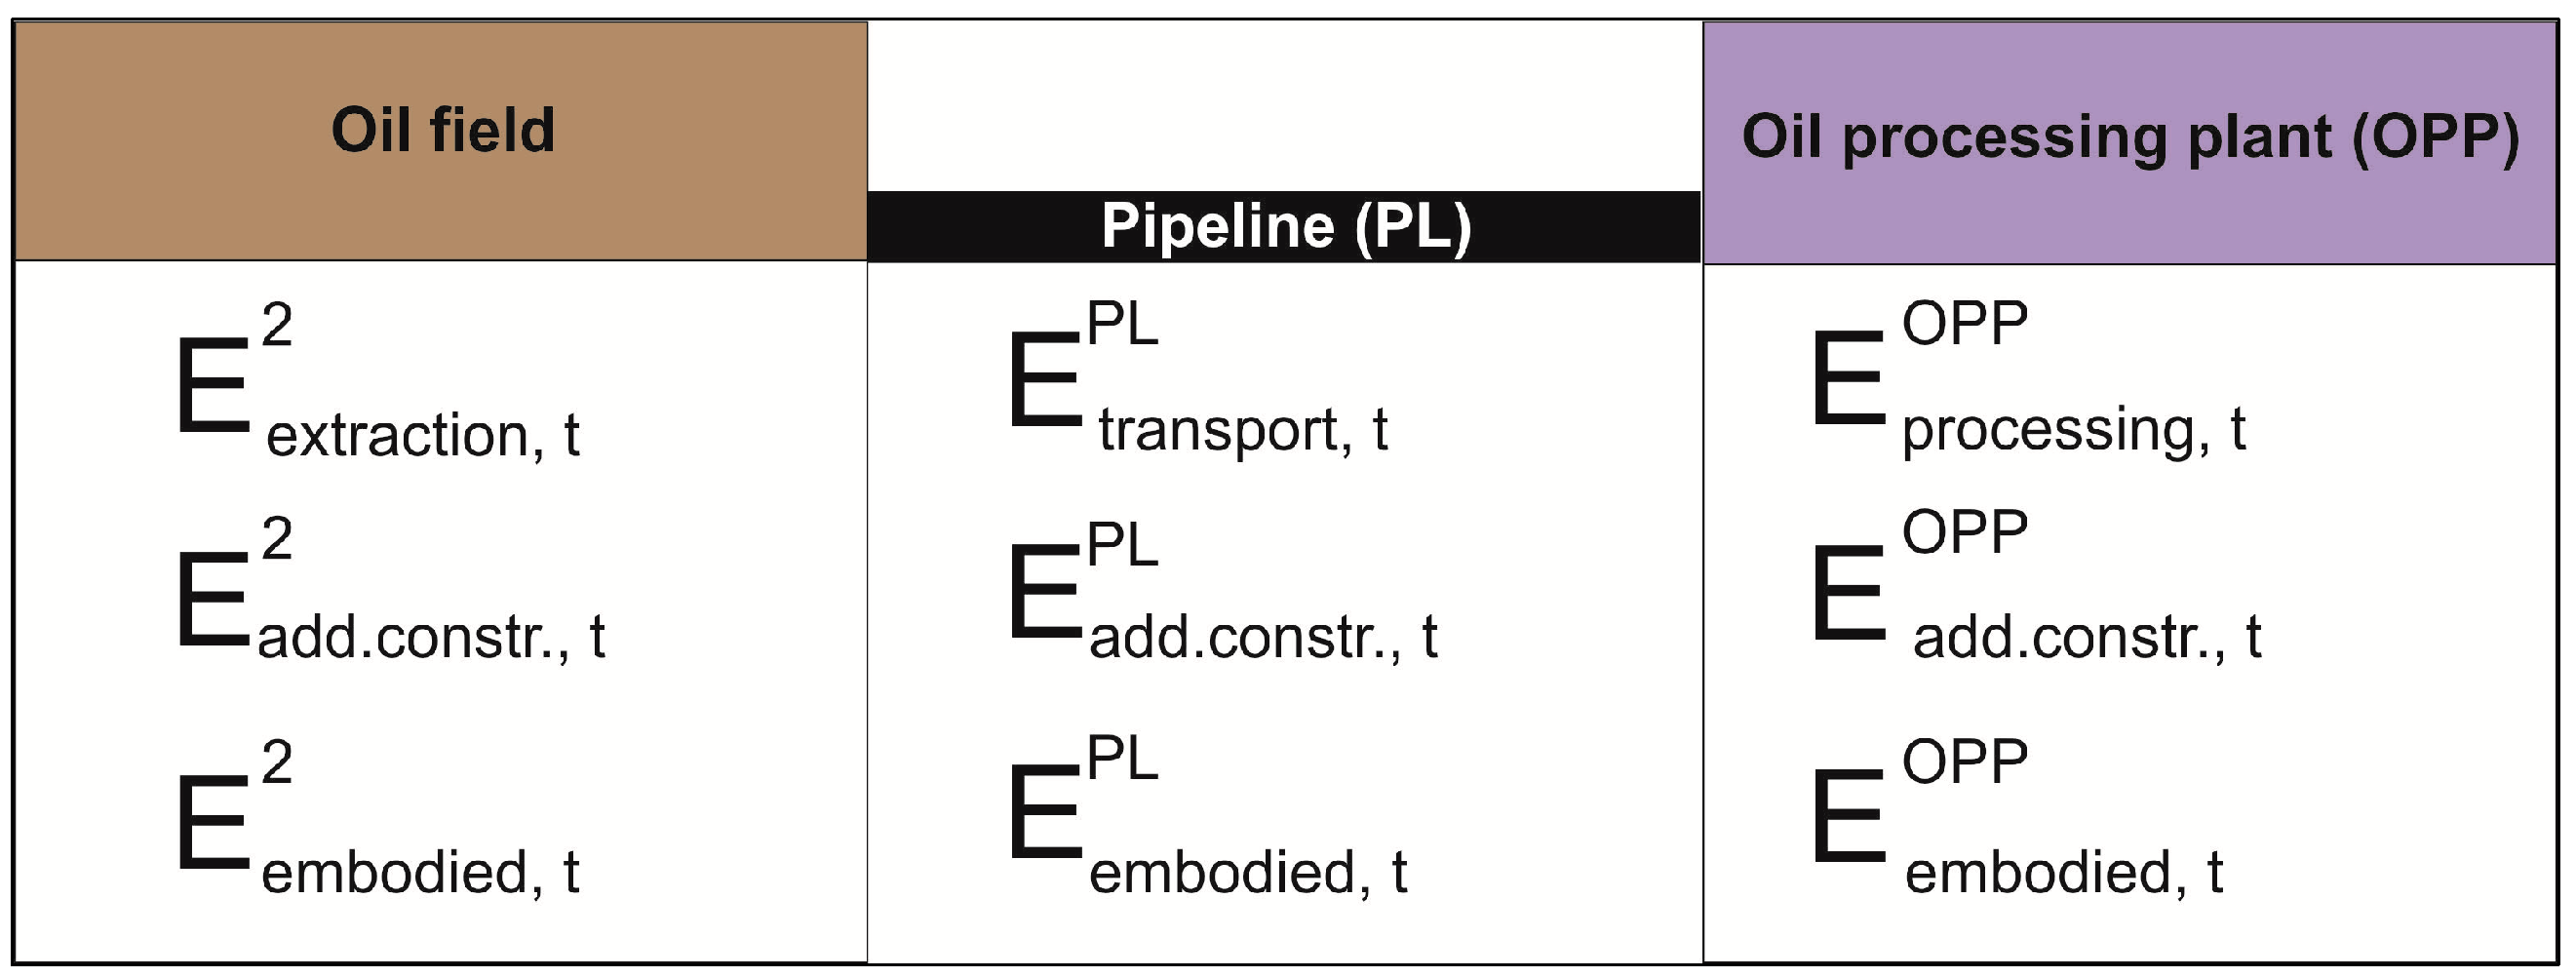
In order to calculate EROI for production of oil light products we must add to energy consumed for oil extraction energy for transportation and processing (
Figure 2).
Figure 2.
Operational energy input and output from an oil light products development project.
Figure 2.
Operational energy input and output from an oil light products development project.
Base on the scheme we can specify EROI formulas for production of oil light products:
- (1)
EROI without costs for additional construction and materials:
Calculation of EROIbasic can be useful for comparison production process of same or different motor fuels: corn ethanol, GTL, CTL.
- (2)
EROI with all energy and material costs.
where
E2(t) = E2extr(t) + E2add.const.(t) + E2embodied(t)
Epl(t) = Epltransp(t) + Epladd.const.(t) + Eplembodied(t)
Eopp(t) = Eoppprocess(t) + Eoppadd.const.(t) + Eoppembodied(t)
EROIfull can be useful for comparison of different technologies for different motor fuels.
In order to calculate the EROI, the following conversion factors will be used (
Table 7).
Table 7.
Conversion factors.
Table 7.
Conversion factors.
| Entity | MJ | Tons of Oil Equivalent |
|---|
| 1 ton of oil | 41,868 | 1 |
| 1000 m3 of natural gas | 36,000 | 0.86 |
| For producing of 1 MWh are used | - | 0.209 |
| For producing of 1 Gcal are used | - | 0.992 |
| For production of 1 t of steel are used | 31,250 | 0.746 |
| For production of 1 t of cement are used | 5000 | 0.119 |
It is necessary to note that comparisons of consumed electric power, thermal energy and an energy equivalent of fossil fuels is a very important issue. In Russia, the widespread practice of an assessment of the production efficiency of electric power and thermal energy is specific to the fuel consumption in the production of 1 kWh and 1 Gcal. In our calculations, we will use the actual values of the consumption of fuel for production electric power and heat energy at OJSC “Tatneft” enterprises. The data is displayed in table above.
Data on the energy consumption for the production of steel and cement are taken from the report of British scientists from the University of Bath [
18].
3.3. Auxiliary Methodology
There three special issues concerning the EROI calculation in this particular article which should be noted.
First, for Rosneft and TNK-BP we don’t have data on energy consumption separate by activity sectors. This means in order to calculate the EROI we must perform separation as follows:
- (1)
Assume that the energy efficiency of oil processing in Rosneft and TNK-BP equals that of Gazprom Neft.
- (2)
Calculate the specific energy consumption for processing 1 ton of oil in Gazprom Neft. It is 10.2 kg of oil equivalent per ton of oil processed.
Knowing the volume of oil processing by company and the specific energy consumption for processing of 1 ton of oil, we can calculate the amount of energy consumed in oil processing sector. After that, we can calculate the amount of energy consumed in oil production sector by subtracting energy consumed in processing sector from the amount of total energy consumed. Then we can calculate the EROI of hydrocarbon production and the EROI of production of light oil products.
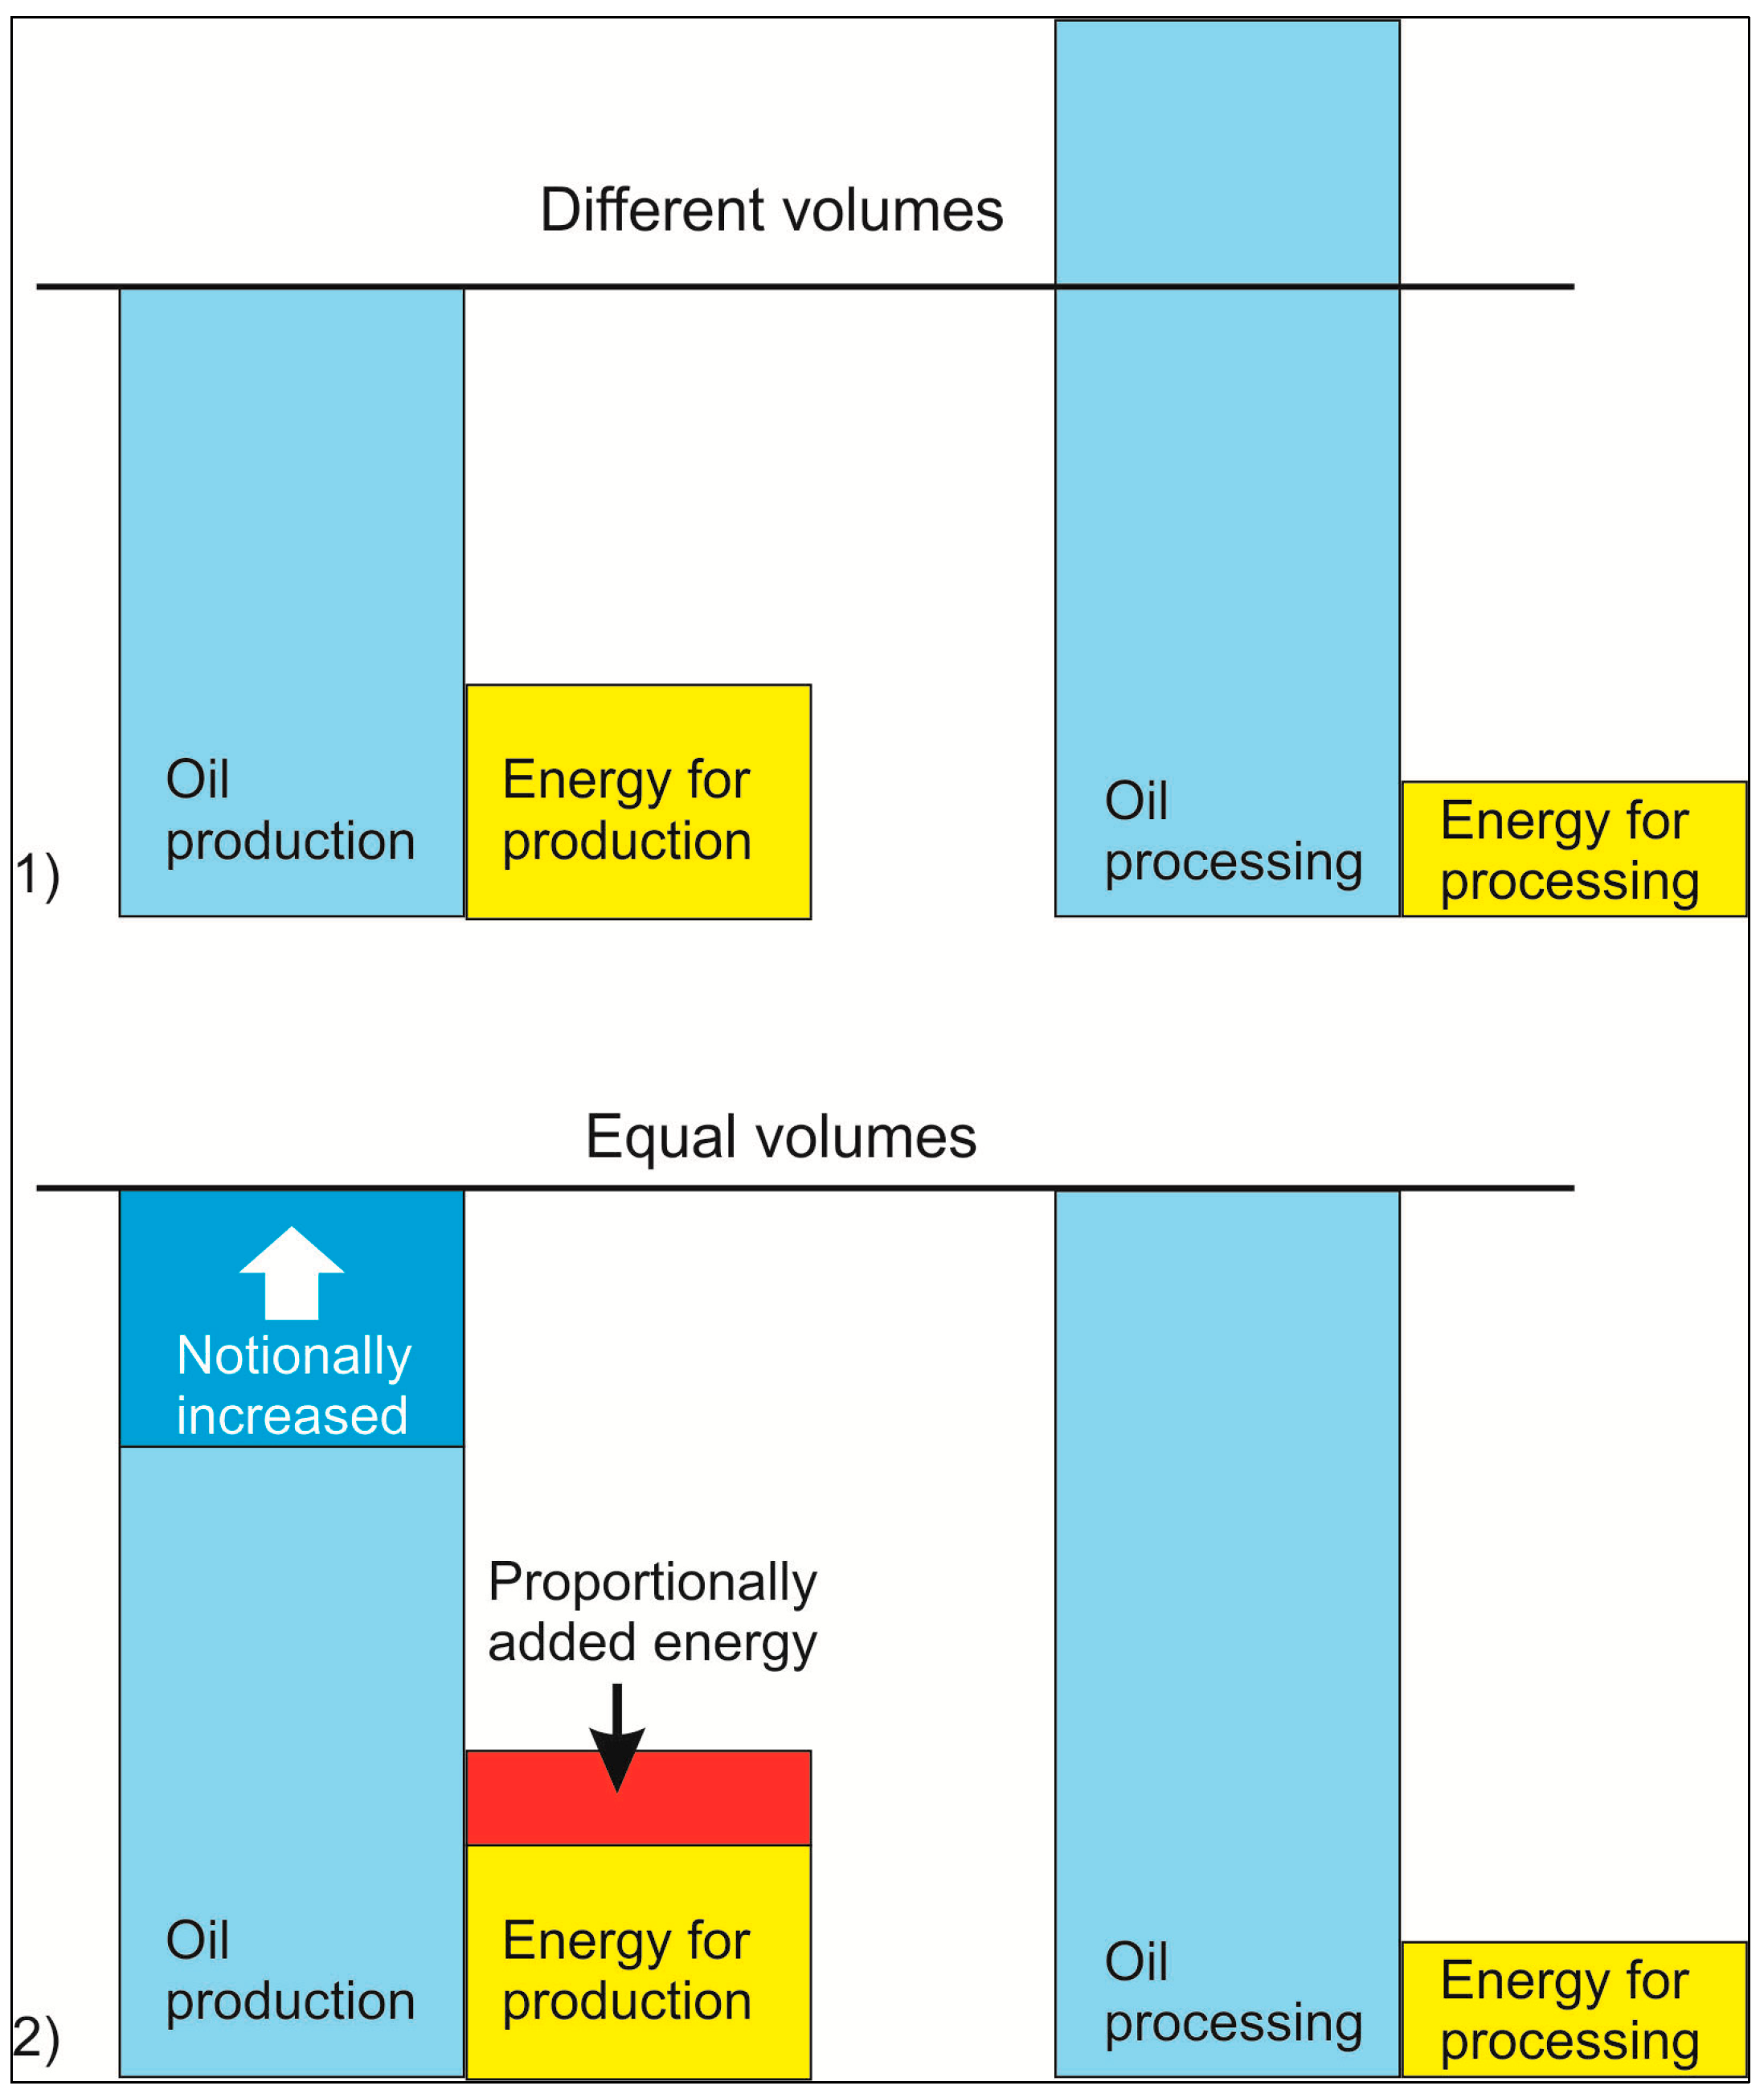
Second, as it has been shown in above tables, volumes of oil produced are not equal to volumes oil processed. However, in order to perform the EROI for oil light we must take into calculation equal volumes. We will proceed as follows (
Figure 3):
- (1)
Equalize volumes by notionally increasing or decreasing oil production.
- (2)
Proportionally change energy cost for production.
- (3)
Calculate the EROI for oil light products.
The following products of oil processing will be considered as oil light products:
Gasoline;
Diesel fuel;
Aviation fuel.
Figure 3.
Scheme of the energy return on investment (EROI) calculation for oil light products.
Figure 3.
Scheme of the energy return on investment (EROI) calculation for oil light products.
In this article because the lack of data formula of the EROI
basic for oil light products will be modified:
Third, unfortunately, we do not have data on material consumption for oil production in the public domain. We only can give an estimation of steel and cement consumption basing on quantity of commissioned wells. We will count that each well requires about 180 mt of steel and 200 mt of cement. For accurate calculations, of course, we need official data. All companies have such data and it can be given in annual reports along with energy consumption.
In this article, we will not give an estimation of embodied energy, which is connected with additional on-field equipment because there is no data in public domain and assumptions as was said above will be very speculative.
5. Discussion and Conclusions
According to the calculations, hydrocarbon production EROI over the past three years increased in the companies “Gazprom neft”. In other companies, despite all efforts to increase the energy efficiency of production, EROI has decreased (
Table 14 and
Table 15). It is an objective trend caused by the fact that most developing fields are in the third and fourth stage when production rates are decreasing and the water cut is rising. We can say that no company can escape the decrease of the EROI in oil production, it is inevitable. Companies can only focus their efforts on reducing the rate of decline, and we must say, Russian companies are successful in that.
Table 14.
EROIdev for hydrocarbon in Russia.
Table 14.
EROIdev for hydrocarbon in Russia.
| No. | Company Name | 2010 | 2011 | 2012 |
|---|
| 1 | Gaspromneft | 29.9 | 35.0 | 35.4 |
| 2 | Bashneft | - | 24.5 | 24.3 |
| 3 | Rosneft | 22.2 | 21.8 | 21.6 |
| 4 | TNK-BP | - | - | 22.8 |
| 5 | Tatneft | 38.5 | 39.0 | 39.3 |
| 6 | EROIdev and transp for hydrocarbon according to Rosstat’s data | 32 | 33 | 30 |
Table 15.
EROIbasic mod for light oil products in Russia.
Table 15.
EROIbasic mod for light oil products in Russia.
| No. | Company Name | 2010 | 2011 | 2012 |
|---|
| 1 | Gaspromneft | 13.5 | 13.7 | 13.3 |
| 2 | Bashneft | | 5.8 | 5.6 |
| 3 | Rosneft | 9.2 | 9.1 | 8.9 |
| 4 | TNK-BP | - | - | 8.5 |
| 5 | Tatneft | - | - | - |
Another aspect that requires a further study is the EROI of oil light products. By our calculations, it has been decreasing in all companies. To analyze it we need additional data for various technological processes of oil refining. There isn’t such data in the public domain.
By itself, Russia’s average EROIdev and transp of hydrocarbon production is high due to the high EROI of gas production. Therefore, taken together, the oil and gas EROI is at 30–33. While taken separately, the EROI of oil production is about 20–25, and gas is above 33.
When comparing our results with the average value of hydrocarbon production EROI in Russia, it should be noted that only the “Gazprom neft” values are higher than the average. Values for “Tataneft” are high only because there is no data on full energy consumption including thermal energy. However, the average EROI includes production and transportation energy costs and with adding transportation cost the EROI of “Gazprom neft” will be lower than 30.
When the light oil reserves run out and the extraction of heavy oil previously considered as unprofitable, we should pay special attention to the energy efficiency of hydrocarbon production. Calculating the EROI for oil and gas companies should be the same standard as the calculation of economic efficiency, ROI. The EROI calculations will tell us about the efforts that were made to improve the energy efficiency of production. It is not enough to say that the company in the reporting year saved a certain amount of energy, it is necessary to make a comparative estimation, and show how this saving has affected to the company’s operations in general. The basis for such calculations have already been made by Russian companies.
In the future, it will be necessary to speak about the full energy audit, and this must become common practice, like a tax audit. Currently, companies do not provide enough data for a full energy audit. The following data should be published for an energy audit:
Energy consumption by different sectors: exploration and production, refining, transportation and sales;
Energy consumption by different processes within sectors;
The material consumption, purchased equipment.
For an in-depth analysis, the energy and material consumption must be given separately for every production region and even field by field.
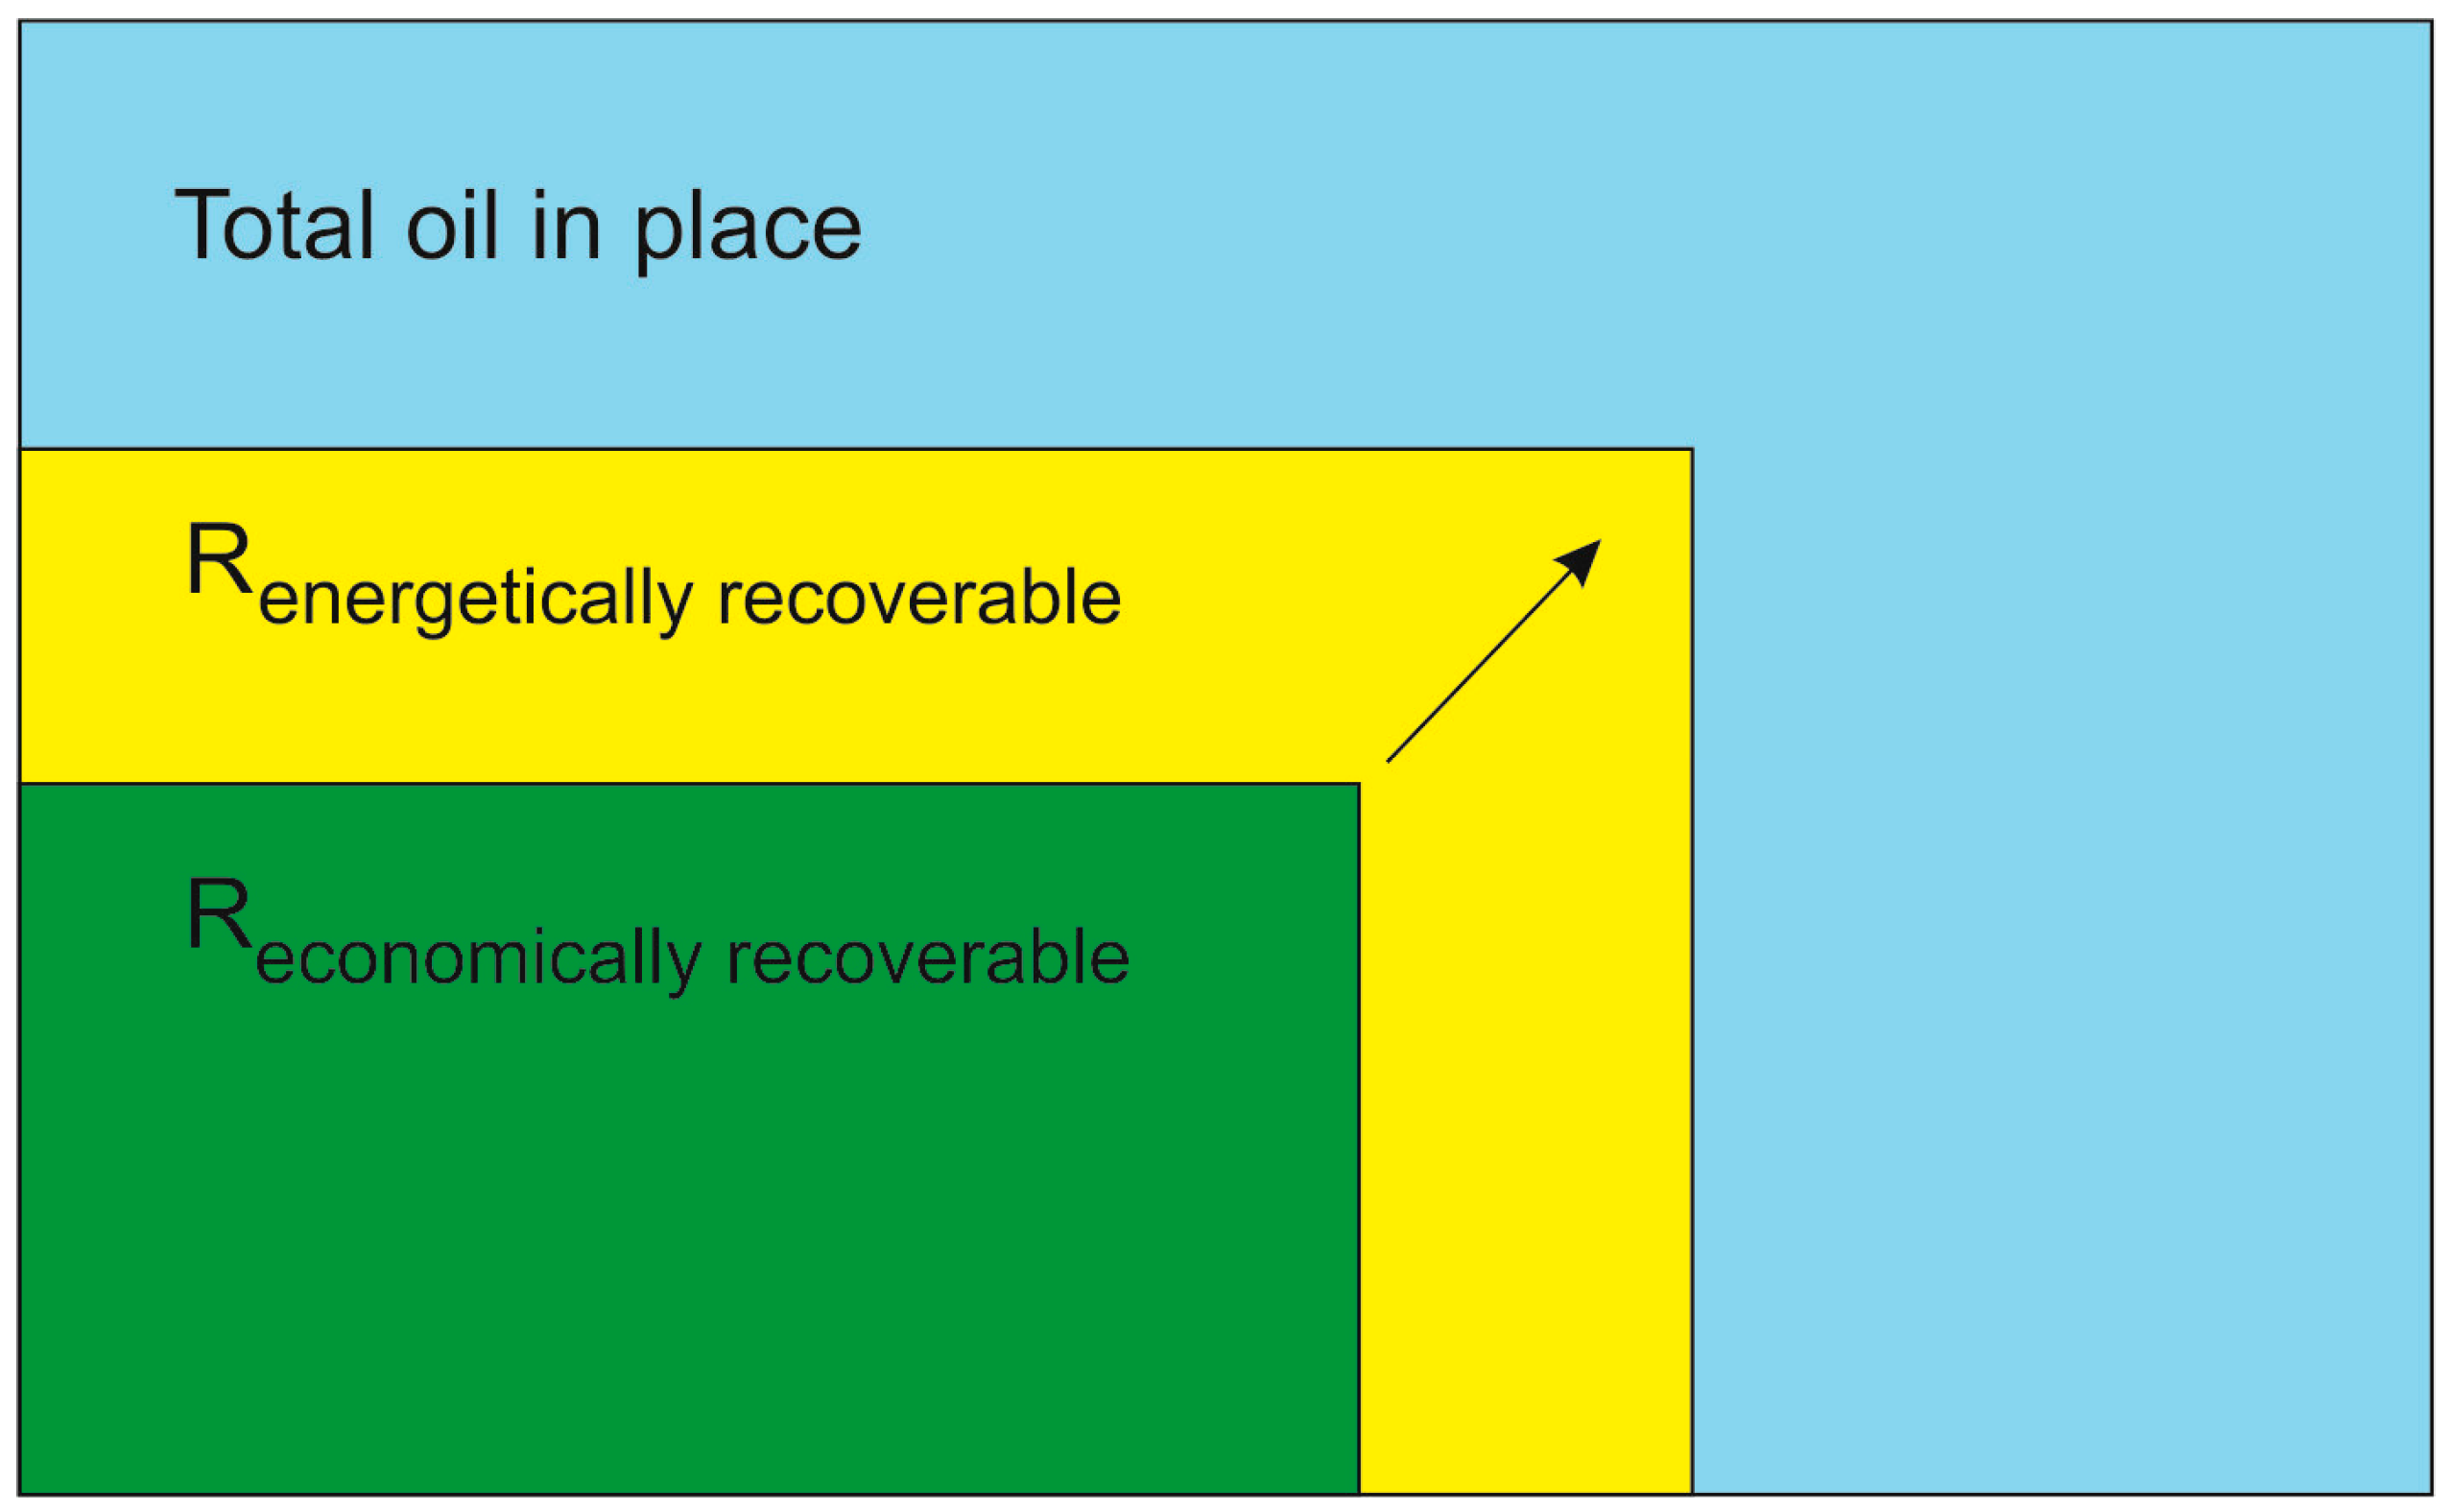
Furthermore, the introduction of energy-based calculation of recoverable reserves should be considered. Currently, recoverable reserves are calculated on the basis of economic profitability, along with this should be a calculation on the basis of recoverable reserves of energy profitability (
Figure 5) [
19].
Figure 5.
Geological reserves, energetically and economically recoverable oil reserves ratio.
Figure 5.
Geological reserves, energetically and economically recoverable oil reserves ratio.
In this case, we will have two estimates of recoverable reserves: the economically and energetically profitable. Then, we should develop an economic mechanism that would stimulate companies to produce hydrocarbons to the energy efficiency limit. Thus, the principle of rational oil and gas production will be realized.


