Article

Sustainability Reporting: An Approach to Get the Right Mix of Theory and Practicality for Local Actors

by
Michelle L. M. Graymore
Wimmera Research Group, Federation University Australia, Horsham VIC 3400, Australia
Sustainability 2014, 6(6), 3145-3170; https://doi.org/10.3390/su6063145
Submission received: 1 April 2014 / Revised: 8 May 2014 / Accepted: 13 May 2014 / Published: 26 May 2014
(This article belongs to the Special Issue Proceedings of the 3rd International Sustainability Conference)

Abstract

:
Many local government or regional plans have “a sustainable future for our community” as a goal. However, few local or regional governments have a sustainability reporting tool in place that enables them to understand how far along the pathway to sustainability their community is. There are a range of reasons for this, including current sustainability indicators and indices not matching the needs or capacity of local actors. This paper argues that a collaborative approach to developing sustainability reporting tools, that involves sustainability experts and local actors working together, will be more successful at developing a tool that has a theoretical basis with locally relevant indicators, which is practical for informed decision making. This process will also build the sustainability reporting capacity of local actors. This collaborative approach was tested in South West Victoria, Australia, resulting in a locally relevant, practical and theoretically sound sustainability reporting tool that met the needs of local actors. This outcome shows that a collaborative approach can overcome some of the barriers to sustainability reporting for local actors; however, further testing is required.

1. Introduction

Many local government or regional plans have “a sustainable future for our community” as a goal or vision. This has been driven in part by Local Agenda 21, which puts a focus on the role of local authorities on sustainable development of their communities. Yet few local governments or regions have any mechanisms in place to report on or understand how sustainable their community is, particularly in Australia. This is despite the myriad of sustainability indicators, indices and frameworks available in the literature (for example Sustainable Cities Index [1], Wellbeing Assessment [2], Ecological Footprint [3], An Index of Regional Sustainability (AIRS) [4,5], Environmental Sustainability Index [6] and many others).
There are many reasons that local governments are not using sustainability reporting, including issues of capacity of local government [7,8,9,10,11], commitment to sustainability [7,11,12,13,14], coordination of council departments, policy, tiers of government and agencies [7,15,16,17], community support for sustainability [7,9,11,12,18] and specific issues related to sustainability reporting [19,20,21,22,23] (see Table 1). Local governments are overstretched and under resourced, particularly those in rural areas [7], and they lack the expertise, skills and knowledge to carry out sustainability initiatives including reporting [7,11]. Many also lack commitment to sustainability from senior managers and councilors, and thus there is little budget or support for sustainability or environment officers to implement sustainability reporting [7,11]. For rural local governments particularly, issues of economic development and service provision are seen to be of more concern, and sustainability initiatives are seen as a luxury [7]. Furthermore, there is a fear of “radical approaches” such as sustainability or climate change policy in Australian many communities [7,12]. On top of this, there are a range of issues with sustainability reporting tools and their implementation including the contested nature of some indices (i.e., Ecological Footprint), no agreed process or guide on how to report on sustainability, lack of locally relevant indicators, and the complexity and lack of transparency of some indices [19,23]. Another challenge for local governments wanting to take up sustainability reporting is the lack of access to comprehensive databases of environmental and social indicators at the local level to act as benchmarks [8,11].
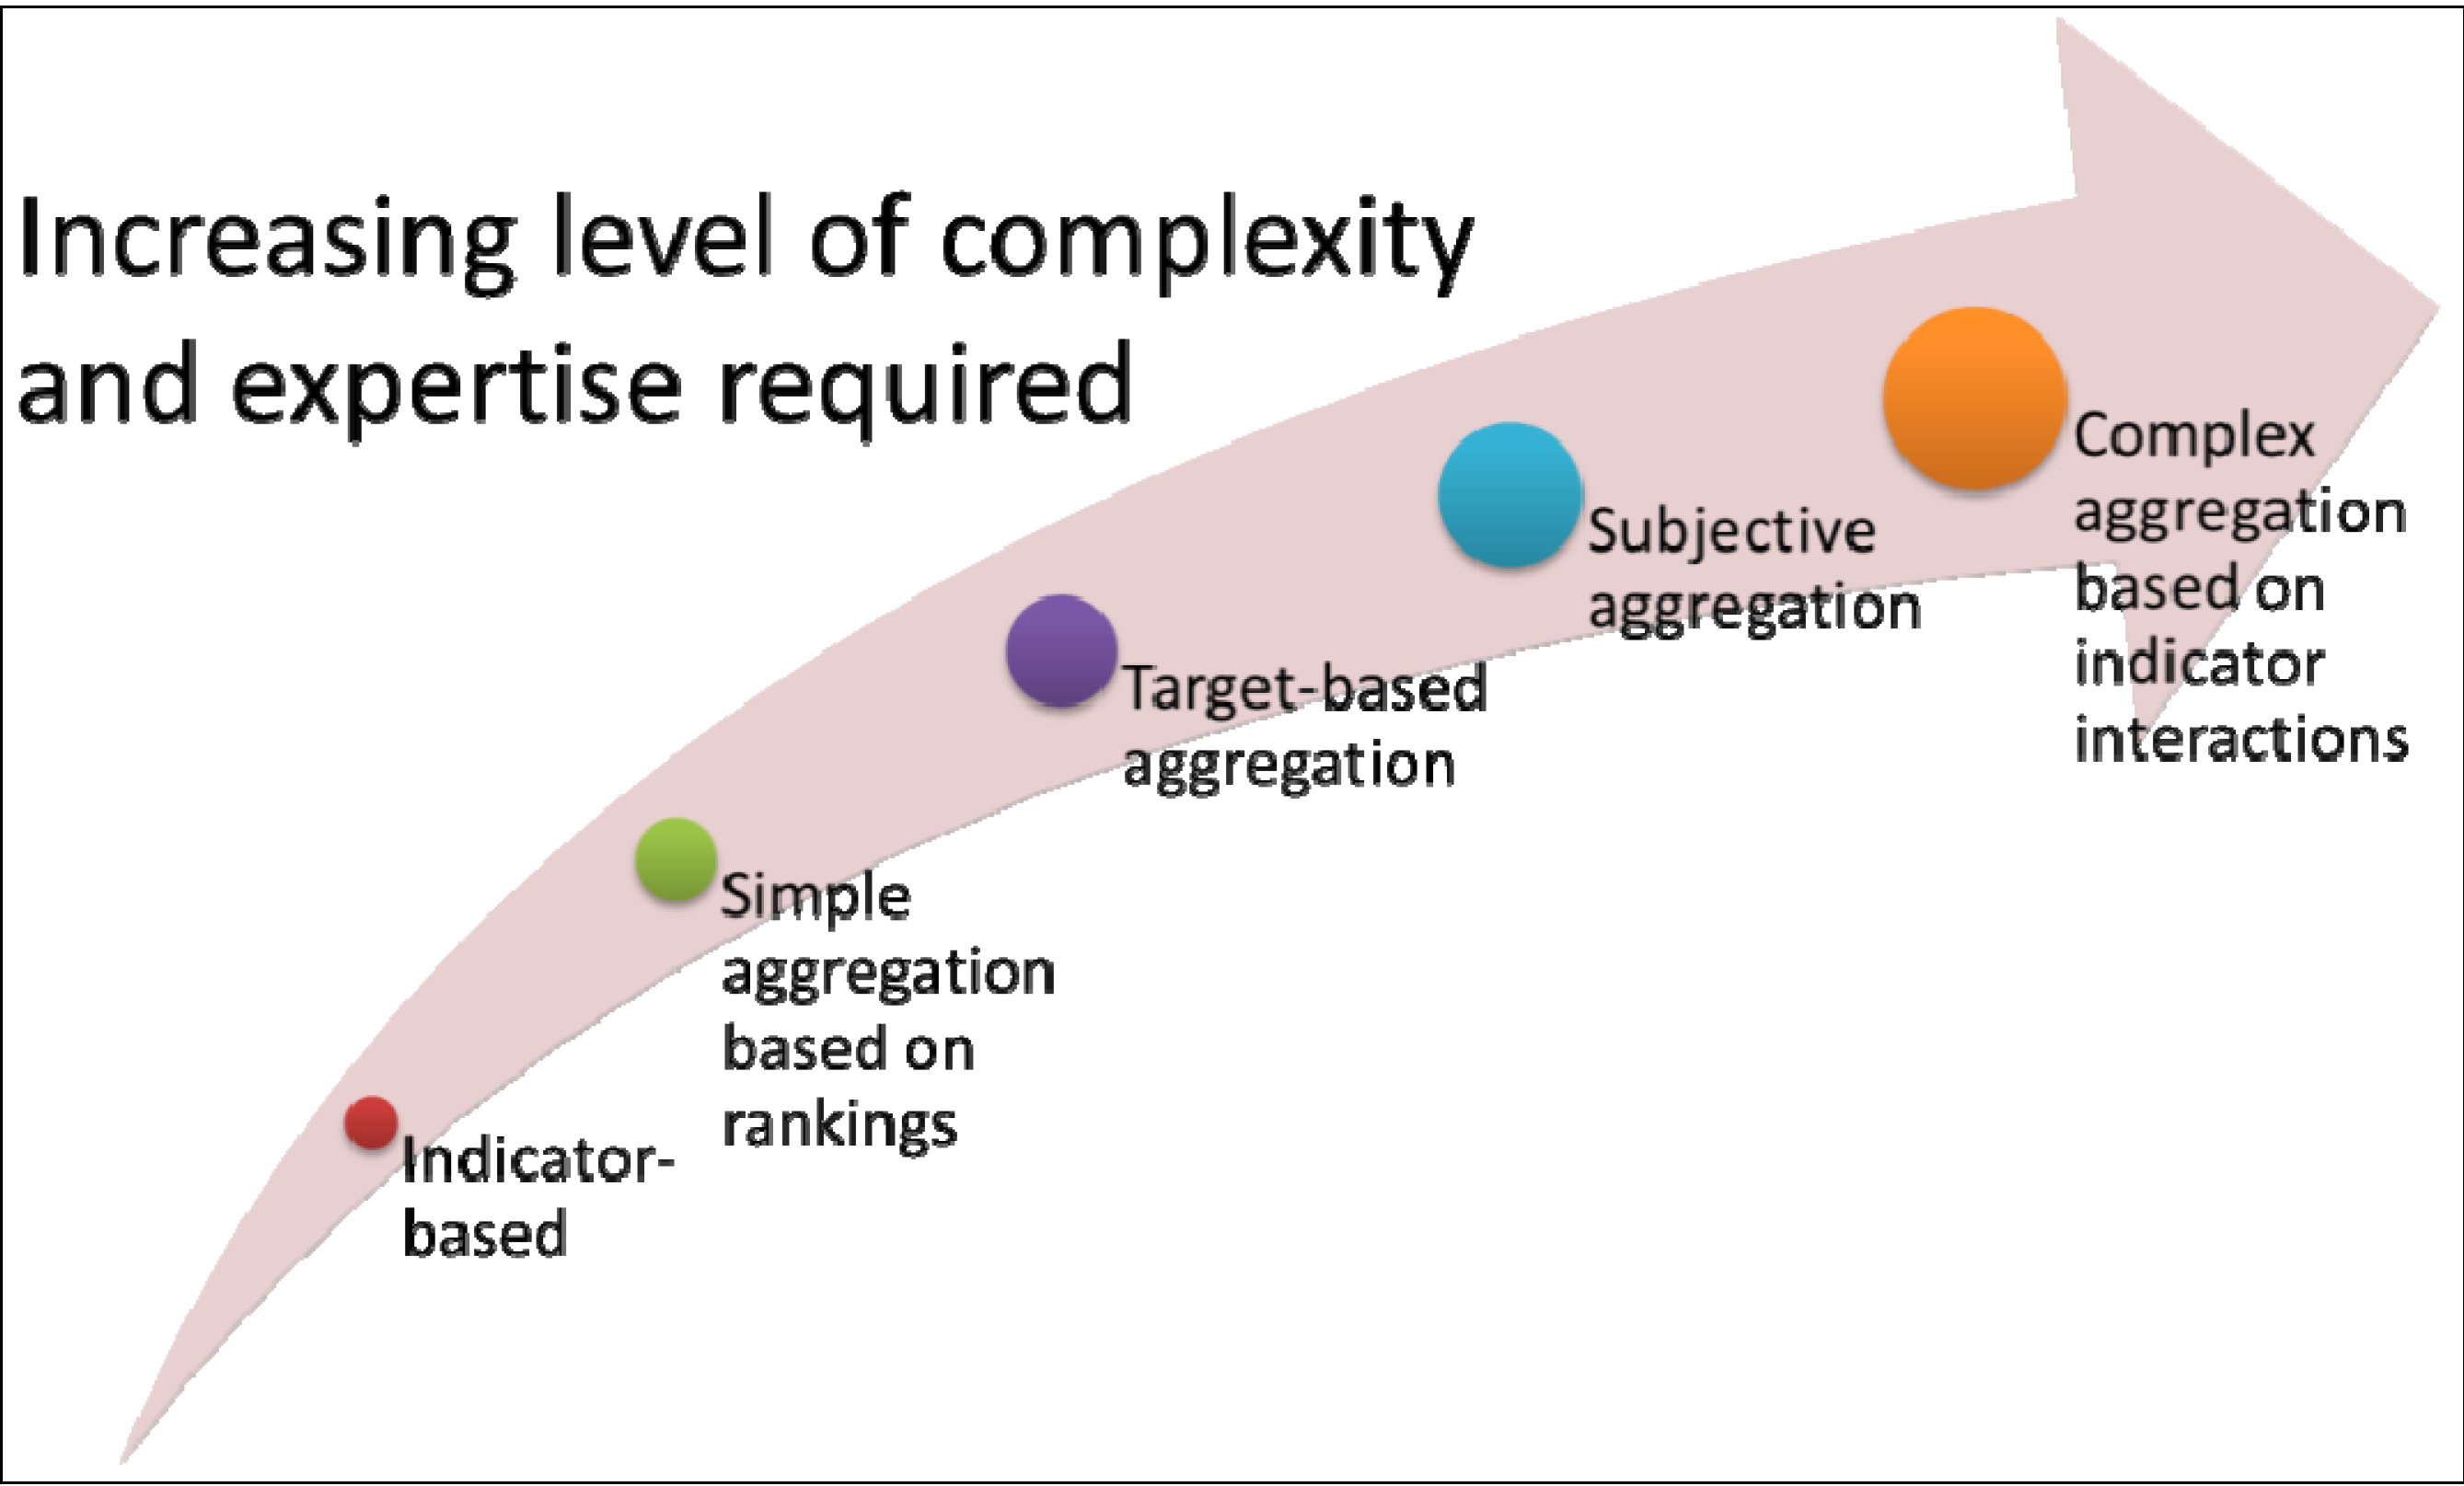
One issue for local actors (i.e., decision makers and other stakeholders including local community) is the complexity and usability of current sustainability reporting tools. As our understanding of sustainability and how to measure it increases, sustainability reporting mechanisms have become increasing complex (Figure 1), from simple indicator based reporting to complex indices based on statistical analysis of the indicators’ interactions and impact on sustainability. However, the local government staff and other regional managers responsible for enhancing community sustainability have limited capacity for sustainability reporting. This means that simple indicator-based reporting mechanisms are more suitable for local government sustainability reporting. Particularly where sustainability reporting is to be used to inform decision making, as more detailed information on key aspects of the community are required rather than knowledge about the overall sustainability of the community. This helps direct investment to areas that need the most attention to enhance the community’s sustainability.
Table 1. Australia local governments’ barriers to implementing sustainability (adapted from [7]).
ThemeBarriersReferences
CapacityLack of financial resources;
Lack of expertise, skills and training;
Limited readily accessible data on ecosystem & community wellbeing;
Limited political and legislative power of local government;
Short political cycles making planning problematic and funding sporadic;
Increase devolution of responsibilities from State and federal governments to Local Governments;
High workloads and portfolios of staff
[7,8,9,10,11]
CommitmentOther priorities seen as more important (i.e., economic and service priorities);
Pro-development ethos of councils;
Lack of support from key staff such as mayor, CEO or senior management;
Lack of support from critical mass of councilors;
Narrow definition of sustainability (i.e., environment focus);
Lack of understanding about the link between health of environment & economic wellbeing;
Small to no budgets for sustainability;
Environmental/sustainability officers not placed in key positions in organizational hierarchy;
Temporary and ad-hoc nature of grants;
Development of a Sustainability/Environmental Strategy seen as the end point
[7,11,12,13,14]
CoordinationPoor coordination between three tiers of government;
Variable coordination and collaboration between regional and local institutions;
Lack on integration between agencies;
Lack of coordination between council departments;
Lack of understanding of the multiple roles of local government;
Fragmentation of policy making and implementation
[7,15,16,17]
CommunityLack of interest in sustainability in community;
Competing priorities for community;
Fear of change and approaches seen to be radical;
Limited resources for community engagement (i.e., time, money, expertise);
Limited understanding of the need for and benefits of community engagement by council staff and elected members;
Increased work demand on rural people due to factors such as agricultural restructuring and drought means less time for community involvement
[7,9,11,12,18]
Issues with current sustainability reporting toolsComplexity of sustainability;
No agreed or consistent approach to development of locally relevant tools;
Complex measuring process;
Contested nature of some sustainability tools;
Existing tools not locally relevant;
Lack of transparency in some sustainability tools;
No practical tools that can be used to direct policy and decision making;
Lack of ownership;
Confusion with performance indicators;
Undefined aggregation methods
[4,19,20,21,22]
One issue for local actors (i.e., decision makers and other stakeholders including local community) is the complexity and usability of current sustainability reporting tools. As our understanding of sustainability and how to measure it increases, sustainability reporting mechanisms have become increasing complex (Figure 1), from simple indicator based reporting to complex indices based on statistical analysis of the indicators’ interactions and impact on sustainability. However, the local government staff and other regional managers responsible for enhancing community sustainability have limited capacity for sustainability reporting. This means that simple indicator-based reporting mechanisms are more suitable for local government sustainability reporting. Particularly where sustainability reporting is to be used to inform decision making, as more detailed information on key aspects of the community are required rather than knowledge about the overall sustainability of the community. This helps direct investment to areas that need the most attention to enhance the community’s sustainability.
Figure 1. The increasing complexity of sustainability reporting mechanisms.
Sustainability 06 03145 g001
Yet, sustainability is more complex than a simple indicator-based tool can portray. The need to develop a tool that reflects the holistic and integrated nature of sustainability has led experts to develop indices for monitoring sustainability (e.g., [4,5]) These indices integrate a range of social, economic, environmental and institutional indicators based on the indicators impact on sustainability using statistical methods to produce a holistic assessment of a community’s sustainability that is based on the current understanding of sustainability. However, these attempts to produce a holistic integrated sustainability index have produced indices that are increasing complex, lack transparency in how the index is produced, and fail to provide information on the community’s sustainability in a way that is useful for informing decision making. For example, An Index of Regional Sustainability [4,5] which was based on locally relevant indicators, a scientifically robust multi-criteria analysis and embedded in sustainability theory, yet 6 years after it was developed it has not been adopted by local actors [22]. This means that these indices, although embedded in sustainability theory and scientifically sound, are not practical for use by local actors to determine what areas are in most need of change to improve the community’s sustainability.
Some local governments have attempted to develop sustainability reports for their communities [23,24,25,26] and others. These are mainly indicator-based reports, similar to performance reports, which provide information on progress to targets in the local plan. For example, Frankston City in Victoria, Australia has developed a State of City report card using indicators based on the targets from their local plan [26]. Since the targets in local plans are not usually based on what will make the community sustainable, this type of sustainability report may be telling local actors little about the sustainability of their communities. They also have limited ability to inform decision making for sustainability. As such, this pragmatic approach to sustainability reporting is also of little use for enhancing community sustainability.
Thus, there is an urgent need to provide local actors with a sustainability reporting tool that is theoretically sound, locally relevant and practical for informing decision making. Yet, there is little agreement amongst sustainability scientists on the best approach to do this. A recent review of 31 sustainability reporting projects from around the world provided some insight into why some approaches produce tools that are adopted by local actors [19]. The most commonly adopted sustainability reporting tools were simple indicator-based frameworks that involved local actors in indicator development to ensure local relevance [19]. To increase the rate of adoption of sustainability reporting by local governments and regions while still ensuring that the tools used produce information about community sustainability, simple indicator-based tools with locally relevant indicators that are embedded in sustainability theory are needed.
With this in mind, the aim of this paper is to argue for and test a collaborative approach to the development of a sustainability reporting tool for local governments where local actors and sustainability experts work together to produce a reporting tool. The input of local actors will provide the local knowledge (i.e., in-depth information about the local area) required to ensure local relevance, and the insight to ensure that the tool is practical for them to use for decision making. While sustainability experts will be able to ensure that the tool is based on sustainability theory. By having local actors involved in all stages of the development of the sustainability reporting tool, this approach will also build the sustainability reporting capacity of local actors. As such, this approach will go some way to overcome a number of the issues currently stopping local governments from adopting sustainability reporting. The next section of this paper describes the collaborative approach.

2. The Collaborative Approach to Developing Sustainability Reporting Tools
Based on the findings of the review of the sustainability reporting projects above [19] and building on the experience of developing AIRS and the experiences of other authors such as Reed and colleagues [27], Bell and Morse [28], Getting Started: A guide to developing regional sustainability indicators in Victoria was produced to fill the gap of a lack of guidelines on how to produce a sustainability reporting tool [29]. This guide was designed to help guide local governments and regions to develop their own sustainability reporting mechanism. Getting Started [30] recommends a collaborative approach be used where local actors are involved at a number of points in the development of the sustainability report, from developing the vision for the community, to agreeing to the criteria (i.e., key issues for the region) and the indicators, and the evaluation and review of the resulting tool. It also recommends involving sustainability experts, such as people who have experience using sustainability reporting tools, at each stage of the development to ensure that the tool developed is firmly embedded in sustainability theory and scientific knowledge.
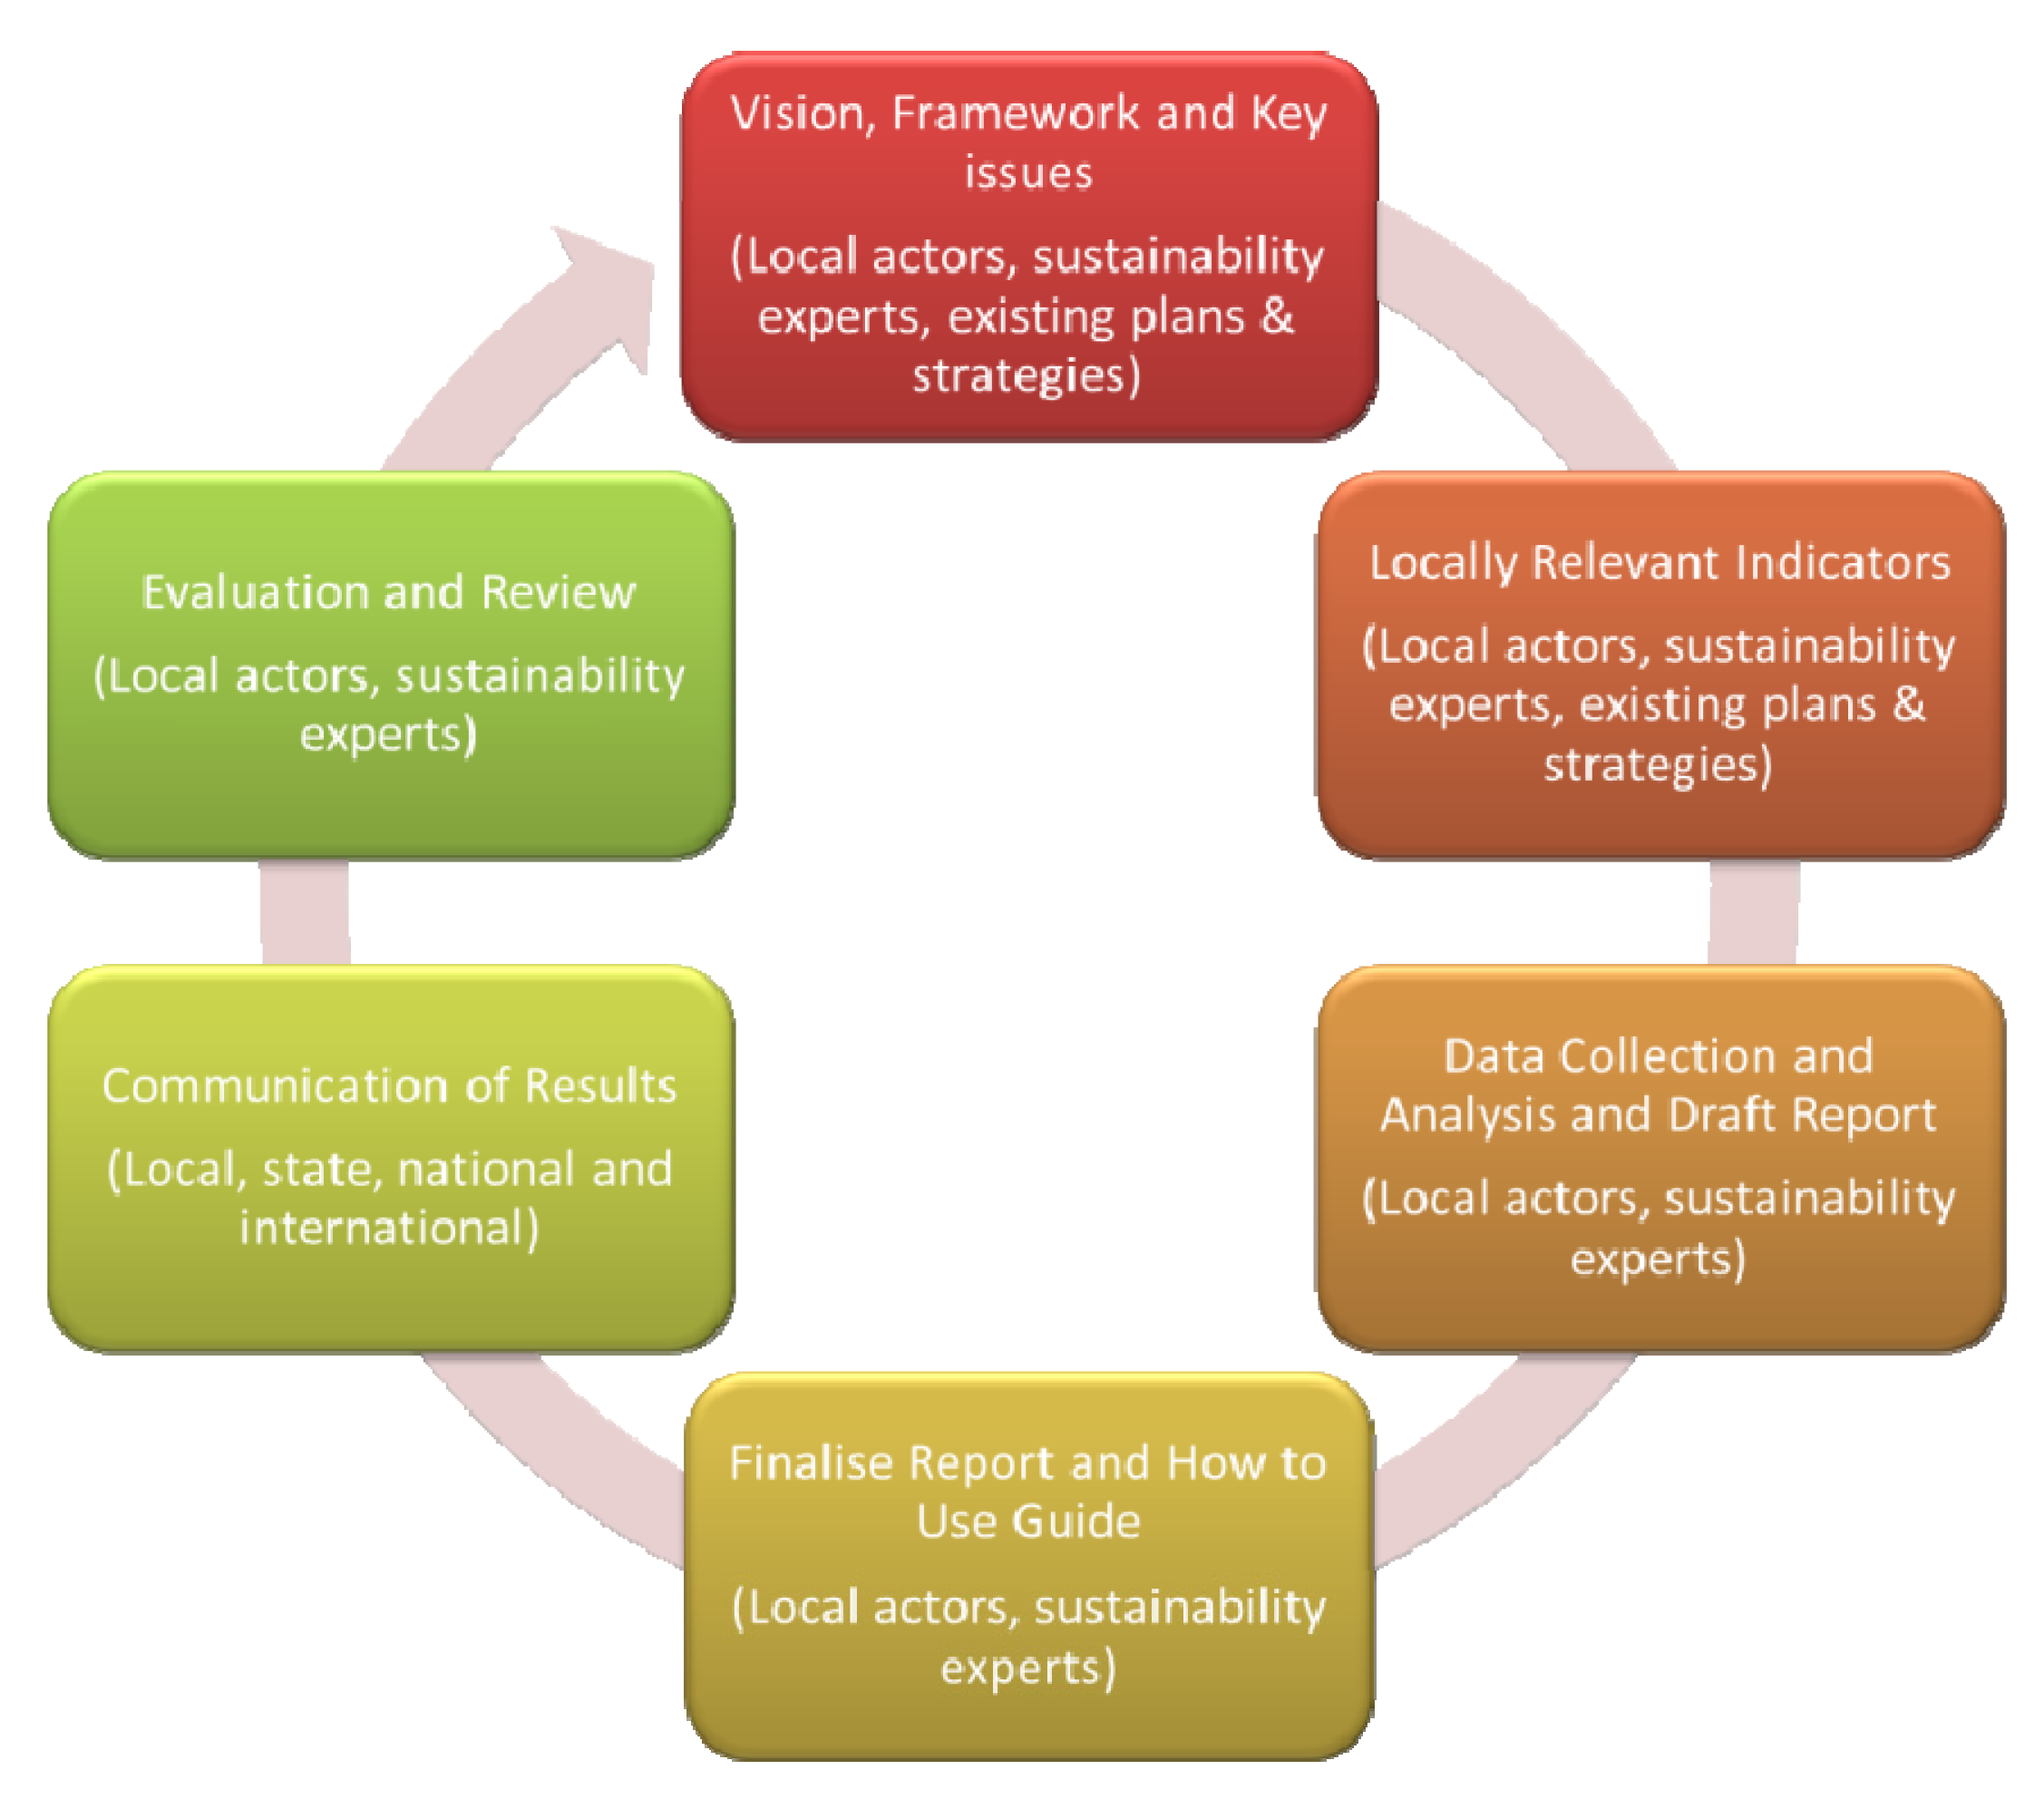
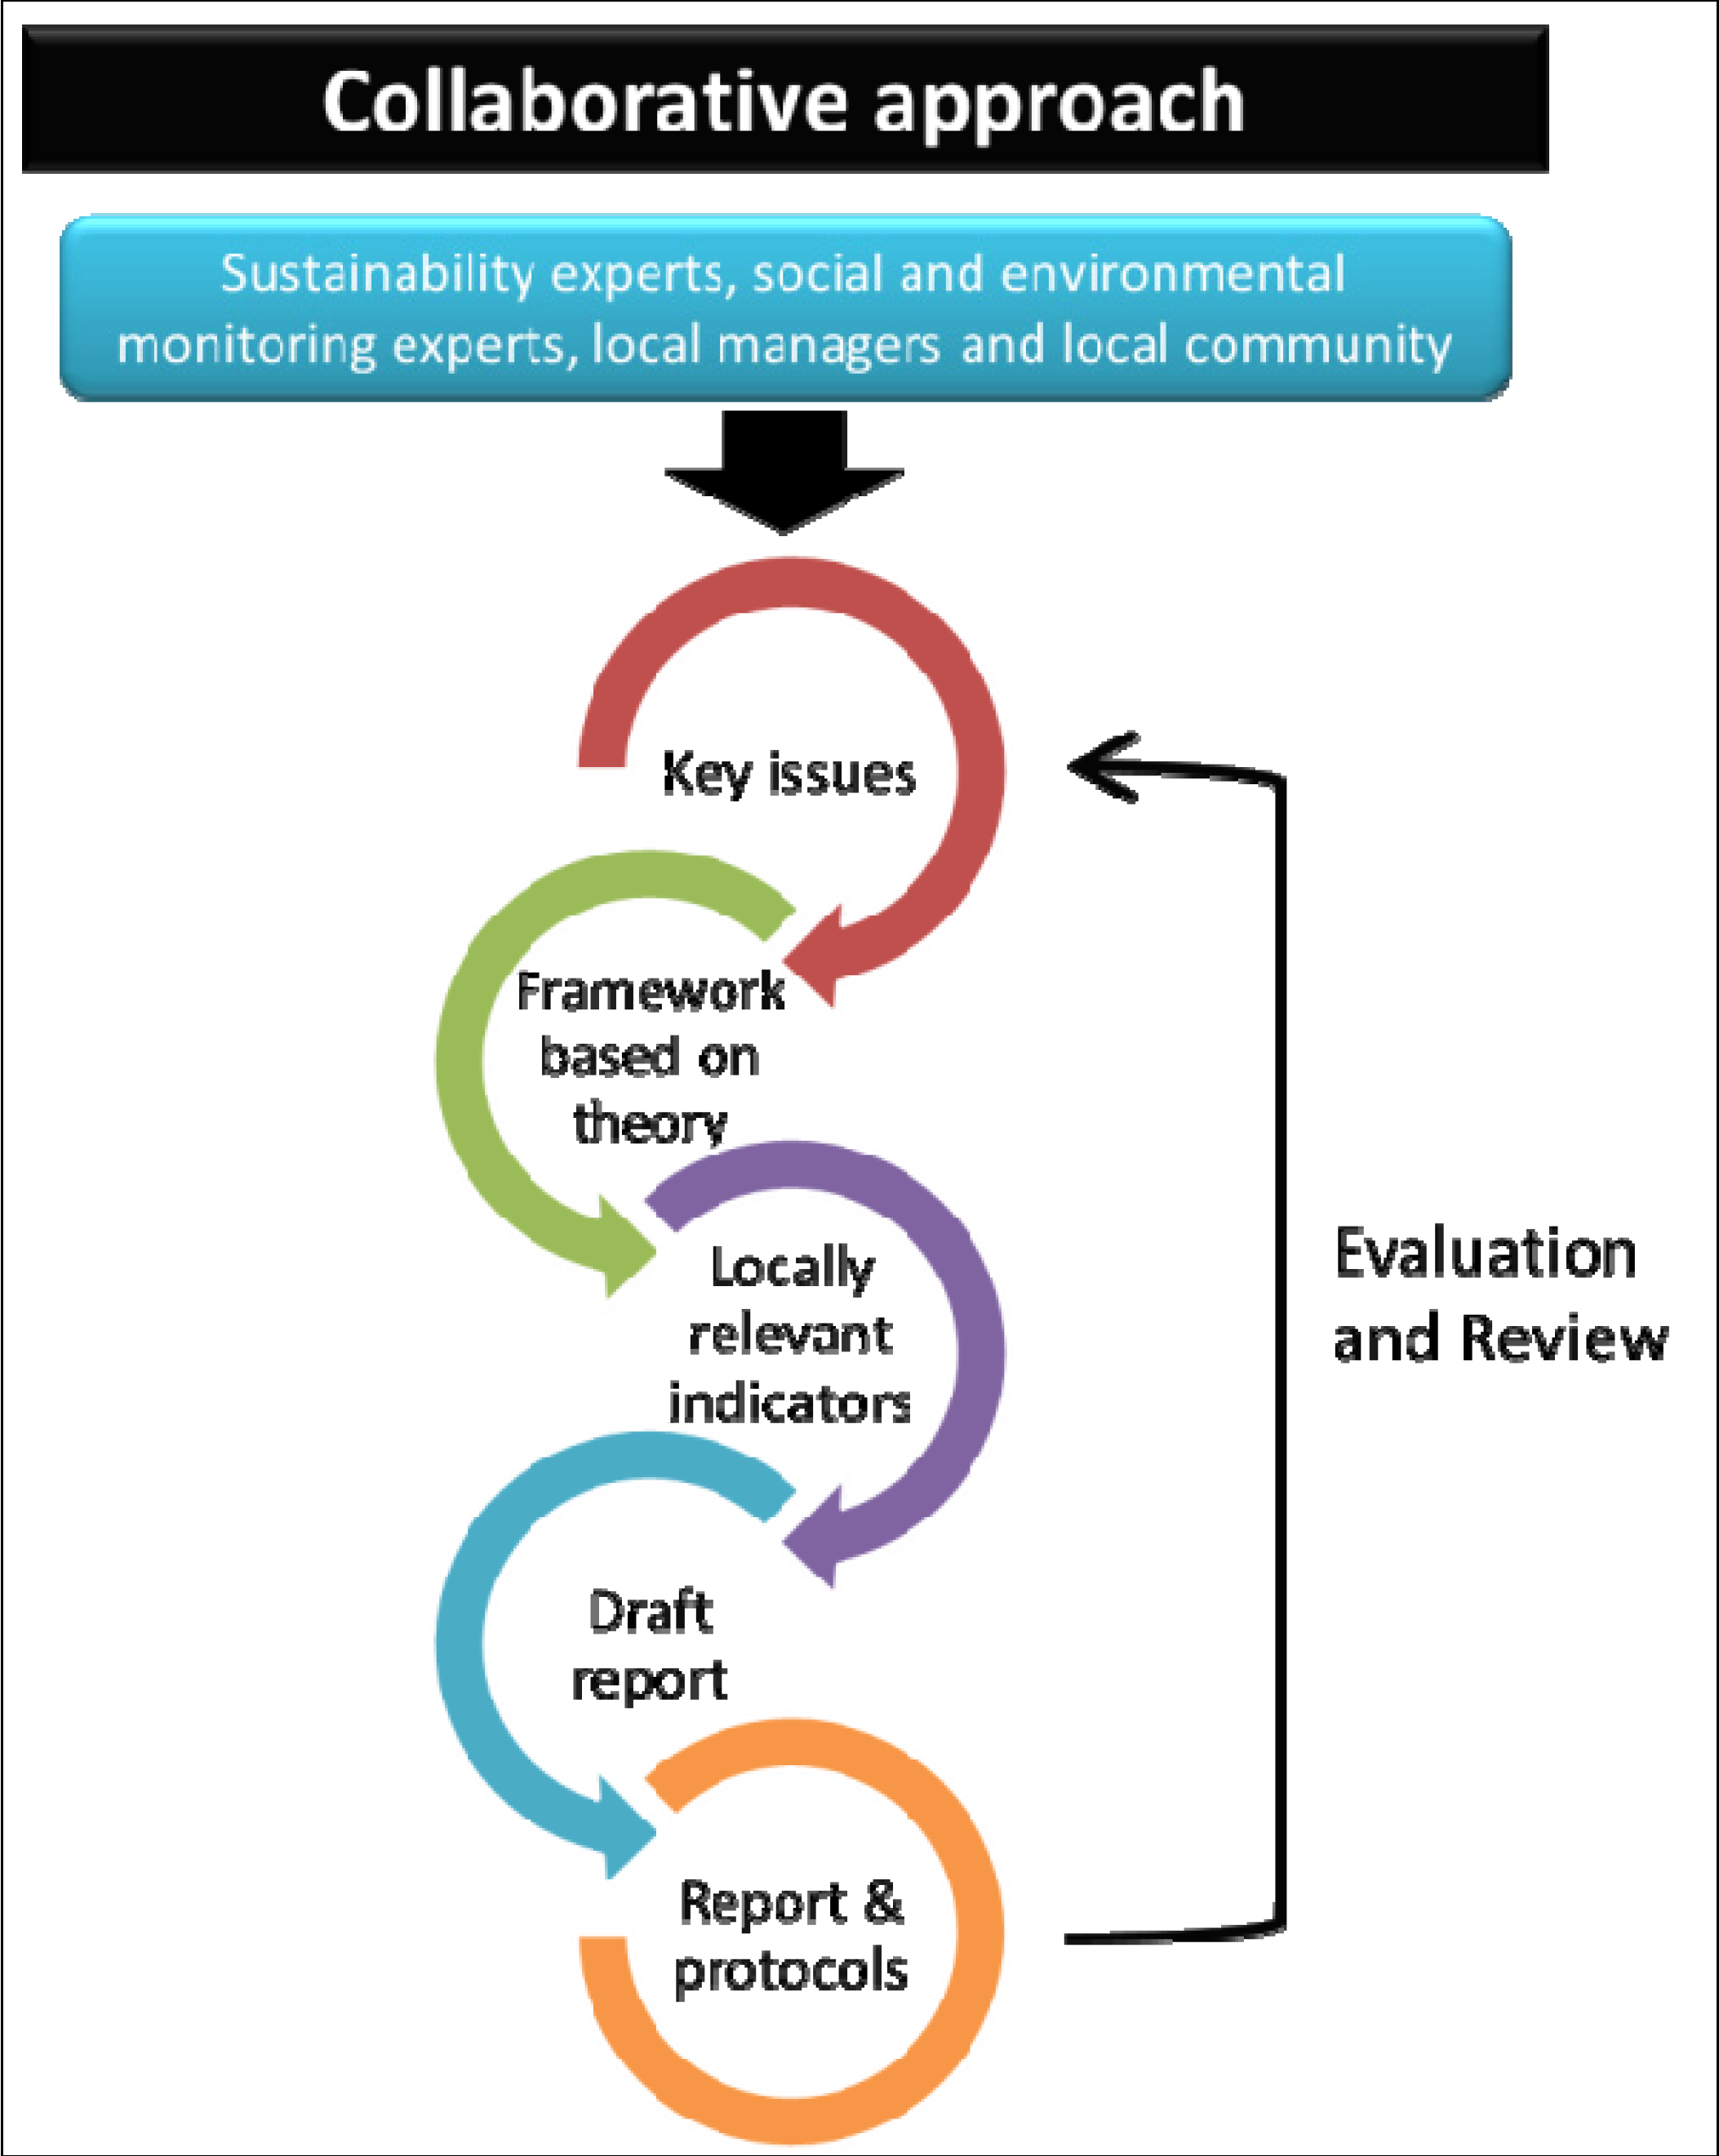
However, this paper argues that to ensure the tool developed meets the needs of local actors, local actors also need to be involved in the development of the framework for assessment and the report (see Figure 2 for the collaborative approach suggested here). By having them involved in this stage local actors can direct how the assessment is carried out and reported so that the information produced by the tool provides them with the information they need for decision making. In addition, a “how-to-use” guide needs to be produced to provide local actors with instructions on how to carry out ongoing sustainability monitoring using the tool produced. This will help to overcome the barrier of lack of sustainability reporting capacity of local actors, and make it more likely that ongoing reporting will be implemented.
To determine if this collaborative approach is useful for guiding the development of sustainability reporting tools that are locally relevant, theoretically sound and practical, it was tested in South West Victoria, Australia, in the Regional Sustainability Indicators Framework for South West Victoria project.
Figure 2. The collaborative approach to developing sustainability reporting tools.
Sustainability 06 03145 g002

3. Regional Sustainability Indicators Framework for South West Victoria

In 2010 six local governments, the local water authority, catchment management authority and a local university came together to develop a sustainability report card for the South West region of Victoria, Australia. The project, called Regional Sustainability Indicators Framework for South West Victoria, aimed to review, establish and communicate an agreed set of sustainability indicators and a framework to deliver them for South West Victoria, Australia. The collaborative approach shown in Figure 3 was used to guide the development of the sustainability reporting tool (called the Great South West Community Report Card) for local government, other stakeholders in the region, including the community, to inform change to enhance the sustainability of the region.

3.1. Study Area—South West Victoria

South West Victoria is located in the south western corner of Victoria in south eastern Australia (Figure 3). The region covers an area of 26,306 square kilometers with a diverse range of landscapes from rugged coastline to the Great Dividing Range, and Grampians and Otway Ranges, Ramsar listed wetlands to the western volcanic plains and the Glenelg river system [31]. The population was 122,202 in 2011, with small rural towns declining and the major towns of Warrnambool, Portland and Hamilton are growing [32]. The region’s economy is dominated by agriculture worth $2 billion in gross revenue a year and employing more than twenty percent of the region’s workforce [31]. Recently, changes in the types of agricultural activities occurring in the region have seen increases in cropping, dairying and timber production. The region’s environment is heavily impacted by land use practices including agriculture, industry and urbanization, with a range of issues including soil degradation, poor water quality, dryland salinity, loss of biodiversity and ecosystem functioning. This is an issue for the economic sustainability of the region due to its dependence on agriculture which requires a healthy functioning natural resource base [33]. The region has some commitment to sustainability, with the region’s stakeholders, including local government, formed the South West Sustainability Partnership to establish a culture of sustainability through management of the environmental, economic, social, cultural and heritage resources of the South West [33].
Figure 3. Map of South West Victoria, Australia.
Sustainability 06 03145 g003

3.2. Method

The collaborative approach in Figure 2 was used where staff from local government, catchment management authorities, water authority, state government agencies and a local university worked together to develop the Great South West Community Report Card. Representatives from each organization were on the project executive group, which had decision making and reporting responsibilities. A project reference group, made up of experts from a range of areas including environmental and community indicator reporting and levels of government, provided expert advice at each stage of the development of the tool. There were eight stages of the tool’s development.

3.2.1. Sustainability Reporting Tool Framework

A literature review on sustainability theory, sustainability reporting methods, and the key issues for sustainability for the region was carried out. This was presented at a half day workshop involving local government, state agency, water authority and catchment management authority staff and sustainability experts. Then consensus decisions were made based on this literature review, expert advice and local actor needs about the vision for South West Victoria, the purpose and audience for the Community Report Card, the sustainability model that forms the basis of the Community Report Card, the boundary for the assessment and the type of data analysis and reporting. Agreement on the key issues listed in the literature review was also sort. This then formed the framework for the sustainability report card.

3.2.2. Agreed Indicator Set

Indicators were chosen through a series of stakeholder and community engagement processes including an online survey for stakeholders, a telephone survey for community, and a workshop with potential end users including local government, regional managers and state government [34].
The stakeholder and community surveys were largely identical, with both asking participants about their understanding of sustainability and what things they felt should be used to measure the sustainability of the region (see [34] for further details). The stakeholder survey was sent to a list of the region’s stakeholders who were known to the researcher or had been involved in the recent regional planning process. Fifty-three completed surveys were received from stakeholders from a wide range of sectors. The community survey was carried out by telephone using a random sample of phone numbers in south west region. There were 286 responses from across the region this produced a margin of error for the results of ±5.8 percentage points with a 95% confidence level, which means the results represent the views of the population 19 times out of 20.
The data from both surveys were analyzed using descriptive statistics to determine the measures most commonly suggested by both groups of respondents. A list of most commonly suggested indicators was produced. This was sent to sustainability experts and the project reference group to provide advice to the local actors about the suitability of the indicators.
A half day workshop was then held with local actors to come to an agreement on the indicators. The list of commonly suggested indicators, the feedback from experts and the project reference group, and the indicators recommended in Getting Started to be included in all indicator sets to enable comparisons between areas, were considered for inclusion. Consensus decisions were made about the inclusion of each indicator based on its fit into the framework’s sustainability model to make sure the indicator set would actually measure sustainability and the following list of criteria for sustainability indicators from Getting Started ([29], pp. 47–48):
(1)
Is the indicator:
  • Relevant and valuable to the region (i.e., tells us about a key issue)?
  • Easily understood by the average person?
  • Appropriate for the regional/local government scale?
(2)
Will the indicator:
  • Flag dangerous or irreversible problems?
  • Measure progress to achieving our sustainability vision?
  • Provide information in the future?
(3)
Can the indicator be:
  • Acted on by regional community or authorities?
  • Easily measured?
  • Measured repeatedly with confidence in the result?
  • Fit with other reporting in the region (such as State of the Environment reporting)?
(4)
What are the indicators main limitations?

3.2.3. Evaluation of Indicators

Each of the indicators in the agreed list was evaluated for use for monitoring the region’s sustainability. This included determining:
  • An appropriate measure for the indicator
  • Whether data was available for the measure for all Council areas in the region
  • If the methods used for data collection were valid and reliable methods
  • Whether the data was comparable across data collection years (i.e., were the same methods used for each year?)
  • If and when the next data collection will be carried out
  • Methods for data analysis based on sustainability theory, including methods for new indices where no current measures or methods were available
Then a method for aggregation of the indicator data that was transparent, easy to understand and based on sustainability theory was developed for the Community Report Card. Data aggregation was requested by the local actors to enable comparisons of relative sustainability across the local government areas. Also, to fully understand the sustainability of a community a holistic integrated assessment is required [35]. To produce a holistic integrated index of relative sustainability it was decided that an aggregation method based on the Wellbeing Assessment [2] should be developed, as this method directly related to the sustainability model chosen for the framework for this tool. In addition, it would further embed the assessment in sustainability theory producing a holistic integrated index of sustainability. However, to do this indicator weightings need to be developed based on current scientific understanding of the most important indicators for the region’s sustainability or by using statistical methods. Time and resource constraints prevented this step from occurring, but it has been flagged for future editions of the Community Report Card. Instead a simple ranking system was used where the local government area with the best condition for a particular indicator was given a score of 6 and the local government area with the worst was given a score of 1. This only included indicators that had data available for all six local government areas, and “double-counting” of indicators was avoided. Similar to the Wellbeing Assessment, the ranks were summed for the indicators of the two systems identified in the framework’s sustainability model—the human and ecosystem—to produce a Human Wellbeing and Ecosystem Wellbeing score. These “scores” were then added together to produce the Overall Score, which forms a relative sustainability index.

3.2.4. Draft Reports

Three report versions were developed based on what the local actors had described during the framework workshop (Stage 1) and based on a review of how others have reported on sustainability indicators [36]. The draft reports were then presented to the local actors at a workshop for direct feedback, and sent to all stakeholders identified in Stage 2 with an online feedback form. All feedback on the look, analysis and information contained in the draft reports was collated for Stage 4.

3.2.5. Finalization of the Reports

The feedback from Stage 4 was used to refine and change the draft reports to produce the final Community Report Card.

3.2.6. How-to-Use Guide

A how-to-use guide was developed to provide step-by-step instructions on how to use the sustainability monitoring tool for ongoing monitoring. Templates, data analysis methods and links to data custodians were included to make it as easy as possible for local actors to adopt the tool.

3.2.7. Communication Locally, Statewide and Nationally

The findings of the Community Report Card were communicated locally, statewide and nationally using a range of tailored communication types, including a launch of the Community Report Card to the local community, conference presentations and seminar presentations to local and state government.

3.2.8. Evaluation of the Tool and the Project

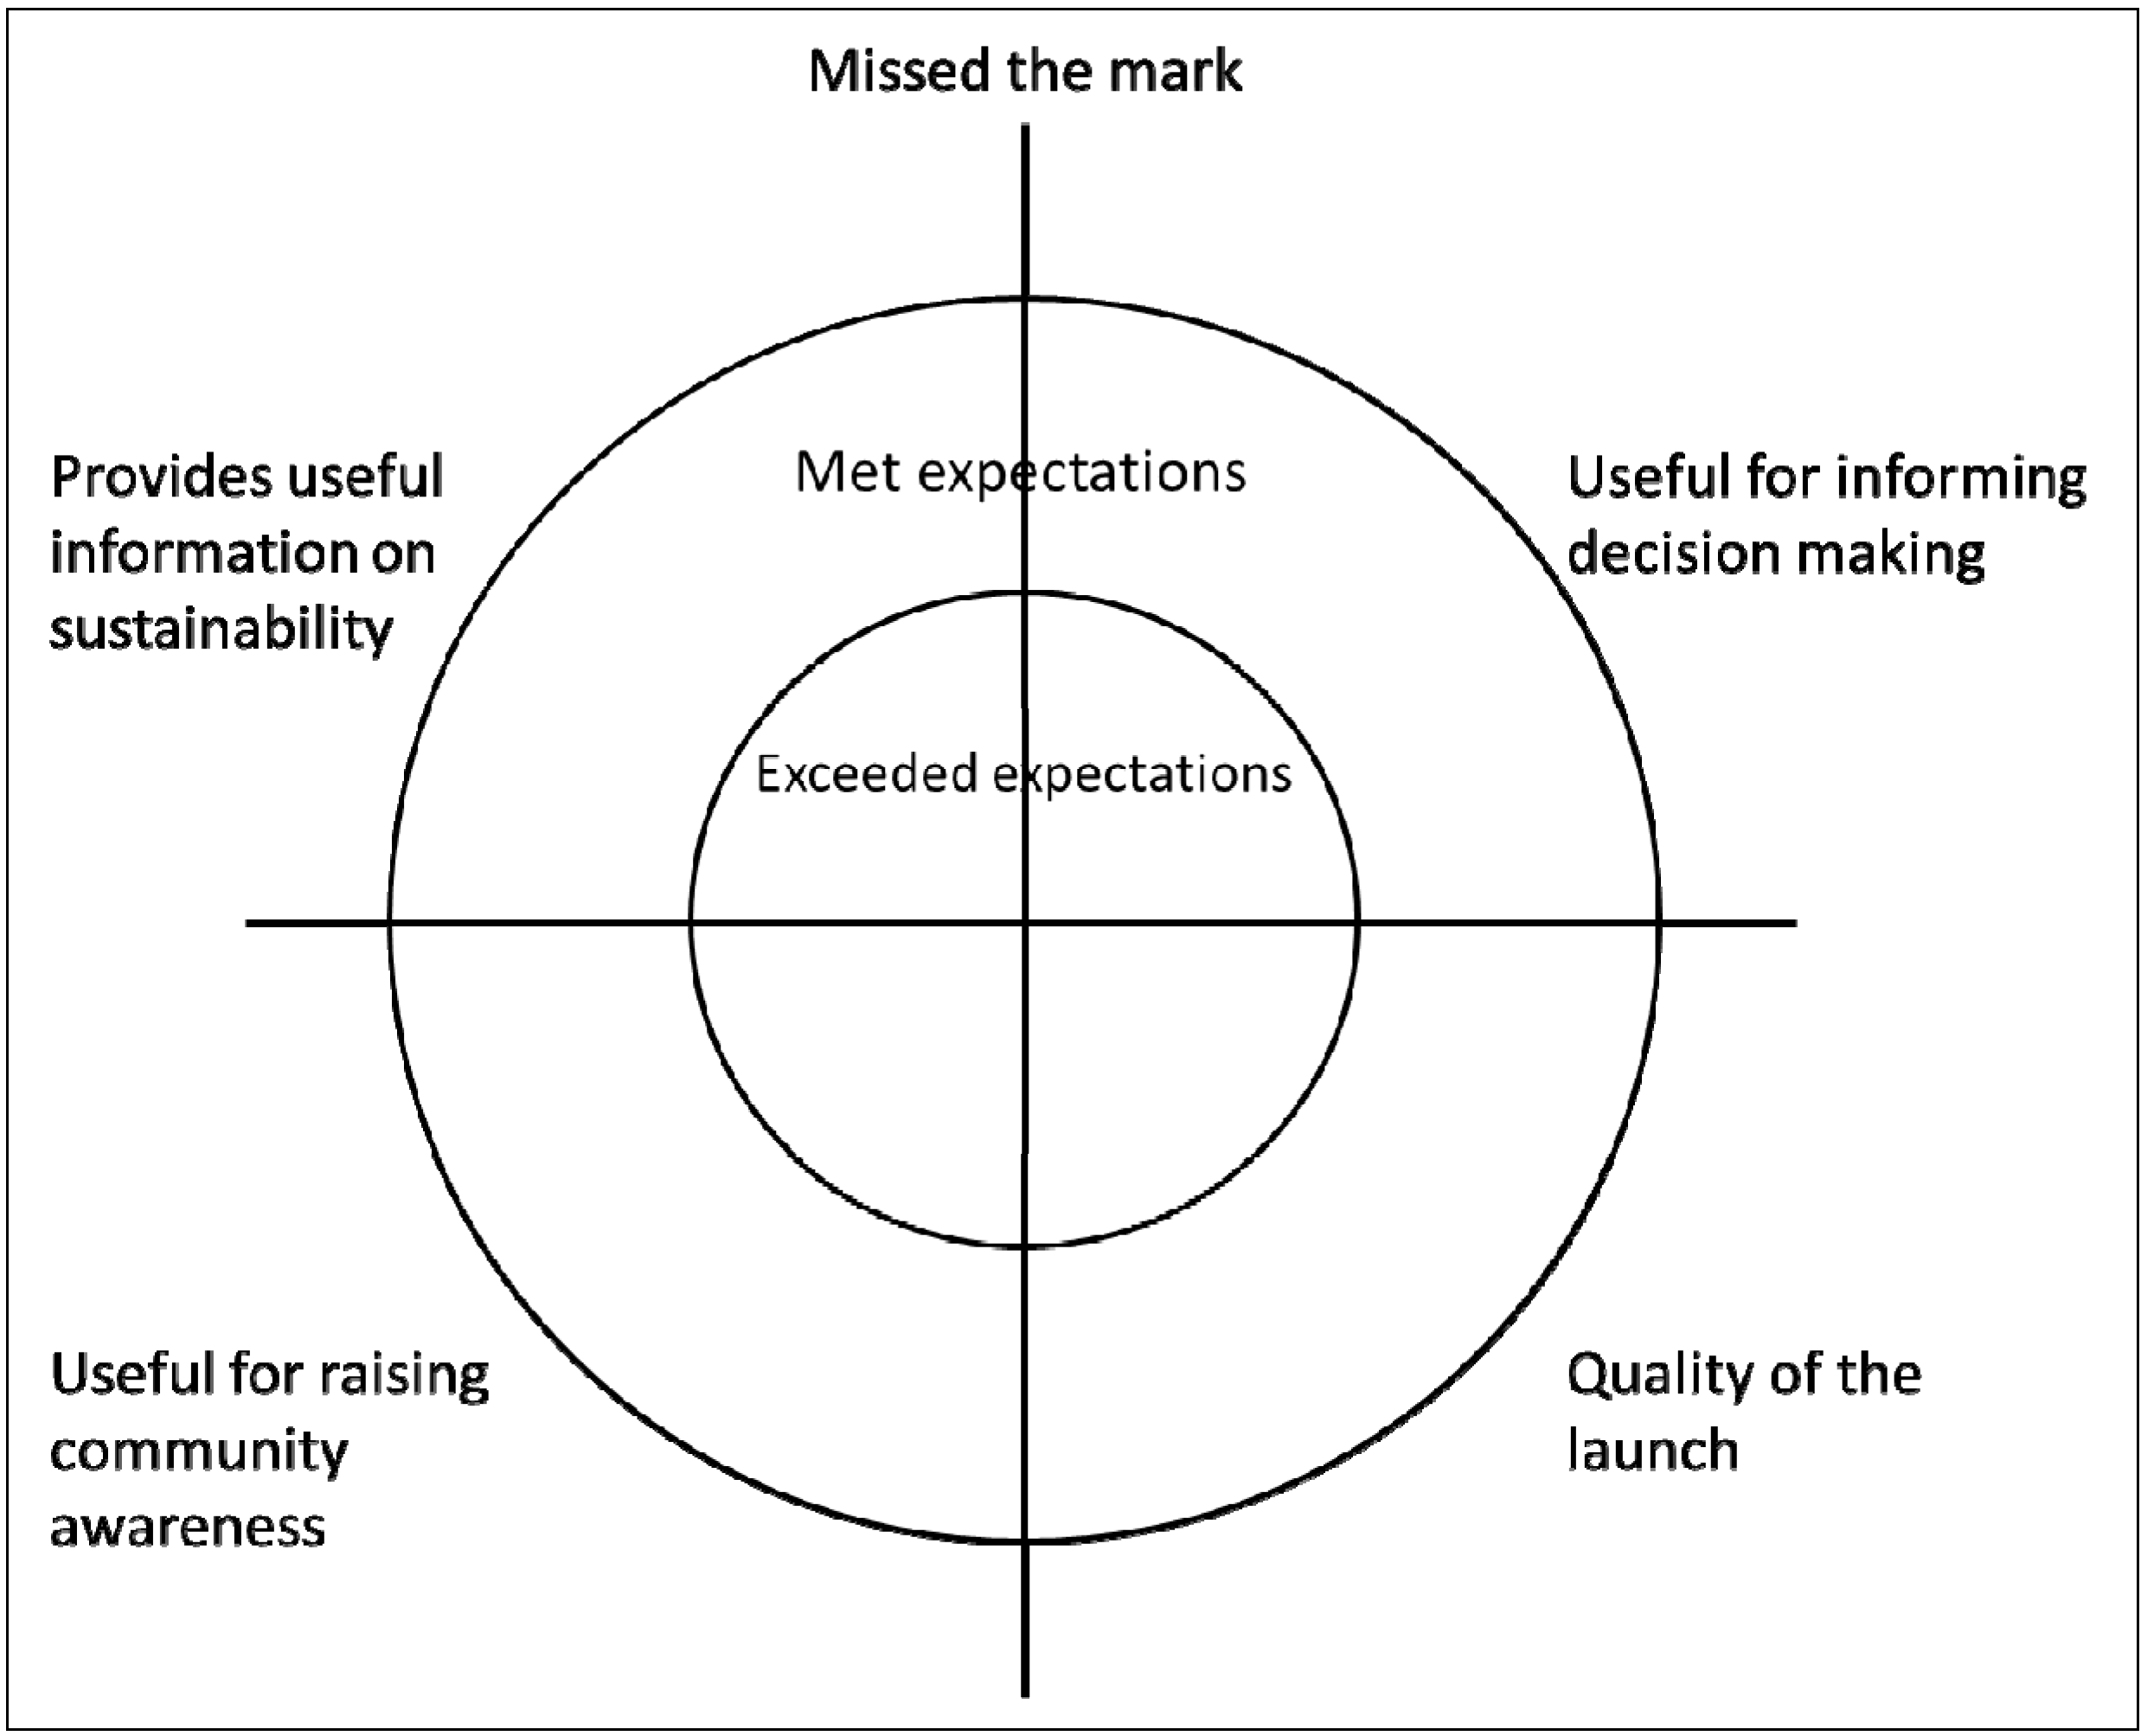
The Great South West Community Report Card was evaluated by local actors in two processes. At the Launch of the Community Report Card using a “dartboard evaluation” where participants were asked to stick dots on the “dartboard” in the area that reflects their thoughts on each criterion to be evaluated (i.e., “missed the mark” on the outside of the dartboard, “met expectations” inside the first circle and “exceeded expectations” on the inside circle—see Figure 4). The criteria used for this dartboard were:
  • Provides useful information on sustainability
  • Useful for informing decision making
  • Useful for raising community awareness
  • Quality of the launch
In addition to the dashboard evaluation, an online survey was carried out to evaluate the project and the Community Report Card. The survey was emailed to all stakeholders identified in Stage 2 and those who had been involved in the project. The survey asked a range of questions about the quality and usefulness of the Community Report Card and its potential for use in the region in the future (see [37] for further details). Twenty people participated in the dartboard and survey evaluation. Data was analyzed using thematic analysis for qualitative data and descriptive statistics for quantitative data.
Figure 4. Dartboard for evaluation of the Great South West Community Report Card [37,38].
Sustainability 06 03145 g004

4. Results: The Great South West Community Report Card

This section describes the results of the collaborative approach in terms of the framework developed, agreed indicators, Great South West Community Report Card, and the evaluation of the Community Report Card and the overall project.

4.1. Framework for the Great South West Community Report Card

In Stage 1, the local actors agreed to the framework for the Great South West Community Report Card, including the vision, purpose, audience, sustainability model, boundary for assessment, data analysis and aggregation, reporting styles and key issues. The vision for South West Victoria was based on the visions already included in the region’s local government environment or sustainability strategies and the regional plan. The vision adopted for the Great South West Community Report Card was:
The Great South West is a great place to live, work and visit with great lifestyle choices. We are happy, healthy and well educated, and engaged in a thriving, multifaceted and resilient economy with a focus on ‘clean green’ goods. We value our environment and act together to ensure a healthy and beautiful environment for our community, and its visitors, to enjoy now and into the future”
[39]
The purpose for the Great South West Community Report Card was:
“To report on the sustainability of the region to Local Governments, local organizations, industry and community enabling informed decision making to enhance the region’s sustainability”.
As such, the Community Report Card will be a tool to inform all stakeholders about the sustainability of the region, at the indicator scale and overall sustainability scale, with links into local government and regional planning. It will highlight aspects of the region that need attention to achieve the region’s vision of sustainability to inform decision making and drive change in the region.
The primary audience identified for the sustainability report card is local governments and the region’s management group (called the Great South Coast Group). The secondary audience is the region’s institutions and managers including water and catchment managers, industry and businesses, and state government. The tertiary audience is the community of South West Victoria.
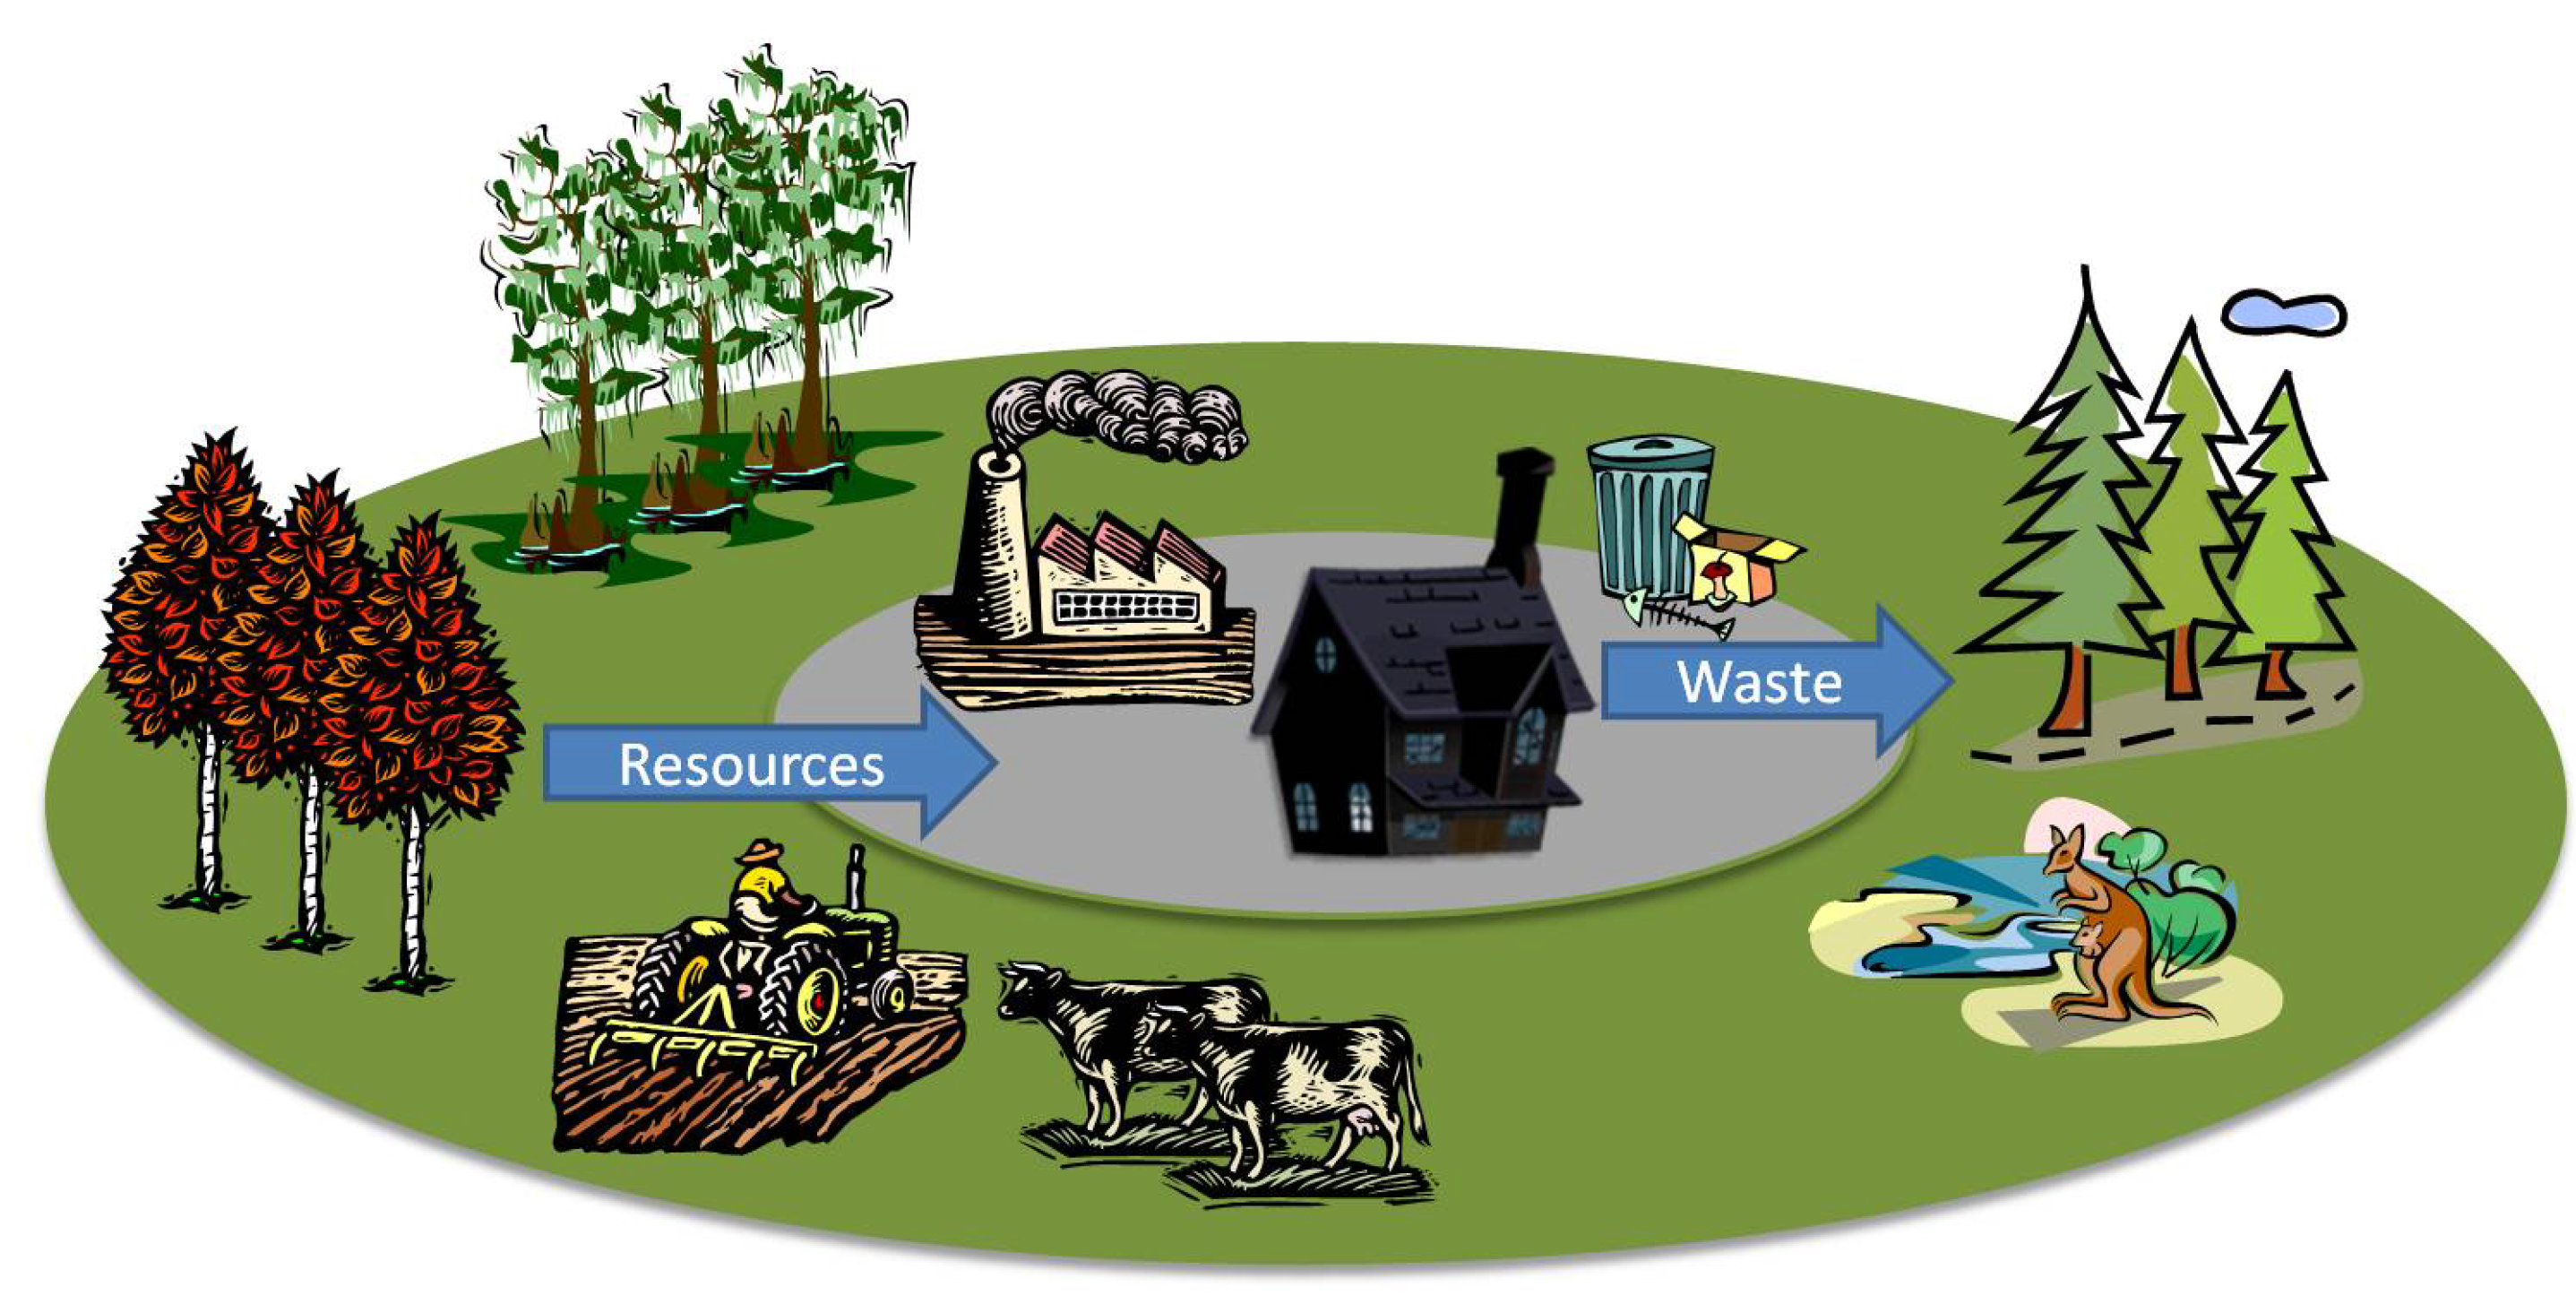
The sustainability model chosen by local actors to underpin the framework for the sustainability report card is the human-ecosystem linked model [40] (Figure 5). This model was chosen to represent sustainability in South West Victoria as it describes sustainability as the “continuous support of human quality of life within a region’s [or local area’s] ecological carrying capacity” ([40], p. 511) demonstrating the dependence of the human system on the natural system and the interaction between the two systems. This model helps the community visualise and understand their role in the sustainability of their community.
Figure 5. Human-ecosystem linked model of sustainability, the basis of the framework for South West Victoria (adapted from [40]).
Sustainability 06 03145 g005
The boundary for the sustainability report was defined as the boundary of the six local governments that make up the South West region of Victoria (called here Great South West): Glenelg Shire Council, Southern Grampians Shire Council, Moyne Shire Council, Warrnambool City Council, Corangamite Shire Council and Colac Otway Shire Council (Figure 3). The sustainability assessment was reported at the local government scale.
Comparisons between local government areas can push competition and drive change, as has been seen with the Sustainable Cities Index in the United Kingdom (UK) where communities aim to improve their ranking in the index (i.e., Newcastle) [1]. The stakeholders agreed that the Great South West Community Report Card should include an index similar to that of AIRS [4] previously developed for the region and the Wellbeing Assessment [2]. However, as already stated, an index based on the ranking of local government areas for each indicator was used for the first edition of the Community Report Card.
It was decided that there will be three reporting styles for the Community Report Card, each with a different purpose. These are:
  • A report card called The Great South West Community Report Card designed to provide a quick snapshot of the sustainability of the region
  • A technical report containing all the data and analysis, including trend and condition, as well as information on the links to sustainability and the key issues of the region to provide an evidence base for decision makers
  • An online interactive indicator report with all the indicator data which can be updated when new data becomes available for up-to-date information.
The key issues for the region were identified from the regional plan, local government plans and the AIRS assessment. These were presented to the local actors for confirmation with the agreed list shown in Table 2.
Table 2. The key issues for the Great South West community [39].
Key Issues
Degradation of natural ecosystems health and functioning;
Changes in population;
Impacts on economic wellbeing including labor and skills shortages and ability to retain staff;
Community wellbeing issues such as violent crime, family violence, health and resilience;
Climate change impacts on the region;
Services and infrastructure provision issues;
Lack of strong regional planning and resultant land use change impacts;
Resource issues including water, green energy, organic waste, food security, community capacity and education

4.2. Indicators for the Great South West Community Report Card
The local actors agreed to 27 indicators for inclusion in the Great South West Community Report Card. These indicators, presented in Table 3, cover human and ecosystem health and wellbeing based on the sustainability model, and the key issues for the region.
Table 3. Indicators, measures and notes on further investigation required for the Great South West Community Report Card [41].
System/key issueIndicatorMeasure
Ecosystem wellbeing
Ecosystem health and functioningCondition of parks and reservesNo data available
Condition of native vegetationRatio of land with high to low natural values
Health of waterwaysIndex of Stream Condition: percent good to excellent ratings
Health of waterwaysIndex of Wetland Condition: percent good to excellent ratings
Health of waterwaysIndex of Estuarine Condition
Soil HealthSusceptibility to water erosion (% land area)
Status of flora and faunaAverage number of threatened flora species
Status of flora and faunaAverage number of threatened fauna species
Climate ChangeAverage streamflows compared to historical averageAverage streamflow: percent of historical streamflow
Household energy useEnergy use per household (GJ)
Vulnerability Index to climate changeVulnerability of Communities Index
(includes dependence on agriculture, number of dependent/vulnerable people and exposure to climate change impacts such as high temperatures, changed rainfall patterns, frosts and sea level rise)
Vulnerability Index to climate change impactsBiodiversity vulnerability: Number of high to very high risk ratings
Waste managementWaste to landfill from householdsWaste generated per household (kg)
Waste recycling rate of householdsPercent waste recycled
Human Wellbeing
Community WellbeingCommunity Wellbeing IndexCommunity Strength Index
(includes amenity, ability to get help, community participation and selected outcomes, e.g., safety, diversity and feeling valued by society)
Volunteer ratePercent of people who volunteer
Education levels attainedPercent 25+ year olds with a non-school qualification
Demographic changeNet migration
Demographic changePopulation change (%)
Demographic changeChange in age structure (%)
Participation rates of young peoplePercent of 15–19 year olds fully engaged in work or study (%)
Participation rates of young peoplePercent of 15–19 year olds not engaged in work or study (%)
Participation rates of young peoplePercent of 15–19 year olds employed full-time
Participation rates of young peoplePercent of 15–19 year olds studying or part-time work
Number of cultural, sporting, recreation, arts and craft events and local food marketsParticipated in Arts and Related Activities in the Last Month (%)
Number of cultural, sporting, recreation, arts and craft events and local food marketsOpportunities to Participate in Arts and Related Activities (%)
Violent crime ratesCrimes against the person rate per 100,000 population
Economic wellbeingUnemployment ratePercent of labour force unemployed
Employment diversityNumber of sectors with 5% of workforce
Healthy lifestylesHealth IndexHealth Index
(includes smoking, psychological distress, alcohol consumption, obesity, consumption of fruit and vegetables and physical activity)
An index of sustainable lifestylesSustainable Lifestyles Index
(includes shower time, plastic bag use packaging choice, power use, buying local, growing own food, red meat consumption, composting, and transport use)
Regional planningLand use change vs. land suitabilityNo method or data available
Implementation of environmental/sustainability strategy actionsNo data available
Roads and transportAccess to public transportPercent who live close to public transport
Road condition and maintenanceNo data available
Access to servicesAccess to healthcareAccess to hospital services in local area (self-sufficiency)
Access to healthcareGeneral practitioners per 1,000 population
AffordabilityHousing affordabilityPercent households with housing costs 30% or more of gross income
Housing affordabilityPercent of renters with renting costs 30% or more of gross income
Housing affordabilityPercent purchasers with mortgage costs 30% or more of gross income
VAMPIRE IndexVAMPIRE Index: vulnerability to mortgage, oil and inflation stress
(includes percent people working who undertook a journey to work by car; percent households with 2 or more cars; median weekly household income; and percent dwellings being purchased)
An extensive search was carried out to find data for all indicators; however some of the indicators had no appropriate measures with data available. As such they were not included in the 2011 Community Report Card. These indicators were the condition of parks and reserves, Index of Estuarine Condition, road condition and maintenance, land use compared to suitability and implementation of environmental strategies. They have been flagged for further investigation for future Community Report Cards.
Due to limited data available, a number of indicators, including status of flora and fauna, soil health, and number of cultural, sporting, recreation, arts and craft events and local markets have been based on measures that are not the most ideal for that indicator. That is, they only provide part of the story about the indicator’s condition. They were included in the full report to provide some insight into the condition of the indicator. These indicators have also been flagged for further investigation.
The validity of using the indicators for measuring sustainability was checked via both the use of sustainability experts to assist in choosing indicators for the region as well as a review of whether the indicators had been used for sustainability reporting previously. Each of the indicators in the Community Report Card was being used in other sustainability, environmental and wellbeing assessments in Victoria, Australian and around the world. Only using indicators that sustainability experts agreed were valid for sustainability reporting that have also been used in other sustainability reports ensured the indicators were based on current sustainability knowledge providing validity to the indicators used in the Community Report Card. The reliability of indicators was checked through the data collection process, including examining the method used for collection, the boundaries used year to year and the pre-existing arrangements to continue to collect indicator data. Only indicators that had reliable data were included.

4.3. The Great South West Community Report Card

The Great South West Community Report Card assesses the sustainability of the six Local Government areas in South West Victoria using the agreed indicators (Table 3). Current condition and trend data, where available, was collected for each indicator. The most recent data were compared across the local government areas, and to the average for South West Victoria and the Victorian average, where available. Trends were also described, using graphs, for those indicators that had data available over multiple years. A target was set for each indicator from the literature, current policy or the benchmark of the most recent data for Victoria, if no other target was available.
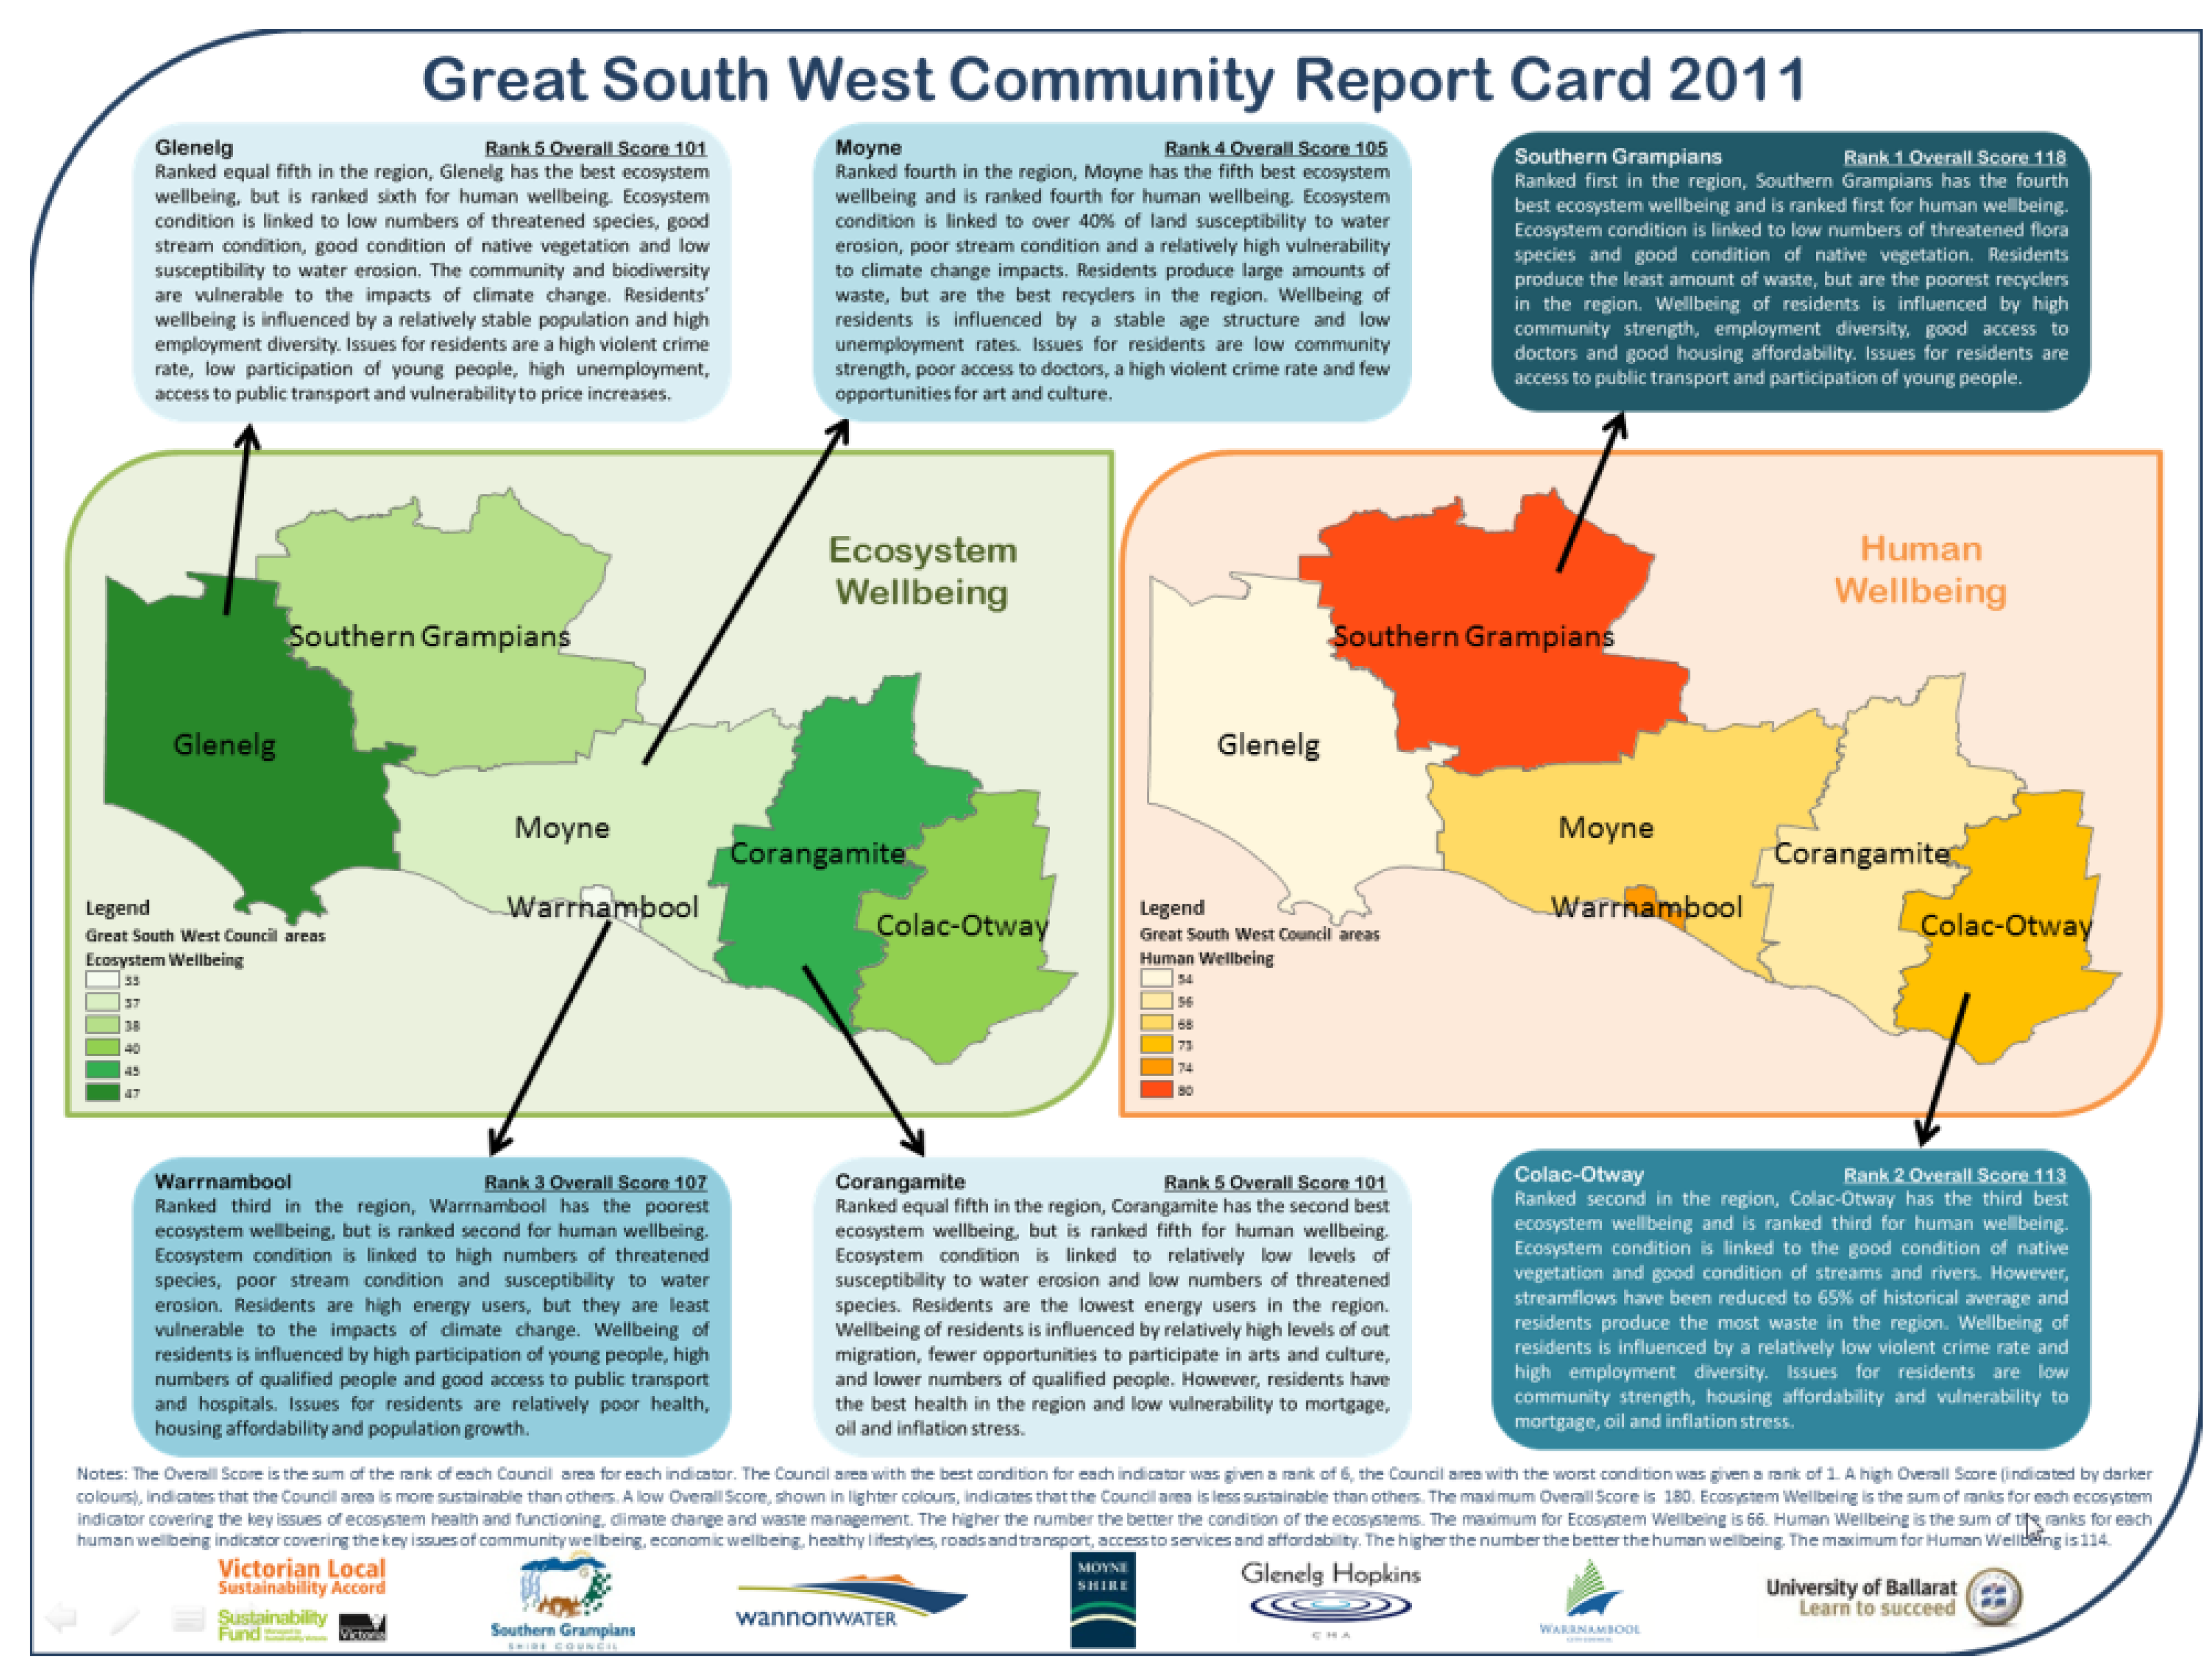
The current condition of each indicator for each local government area was ranked against the condition of the other local government areas to produce an Ecosystem Wellbeing, Human Wellbeing and Overall Score for each local government. These scores were then used to make comparisons across the local government areas. The Ecosystem Wellbeing and Human Wellbeing scores were mapped to show how the six local government areas compare, where darker colours (green for Ecosystem Wellbeing and orange for Human Wellbeing) indicate a higher score and a more sustainable area. Narratives of each local government area’s condition based on indicator condition and Overall Score were then developed to tell a story of the area’s condition.
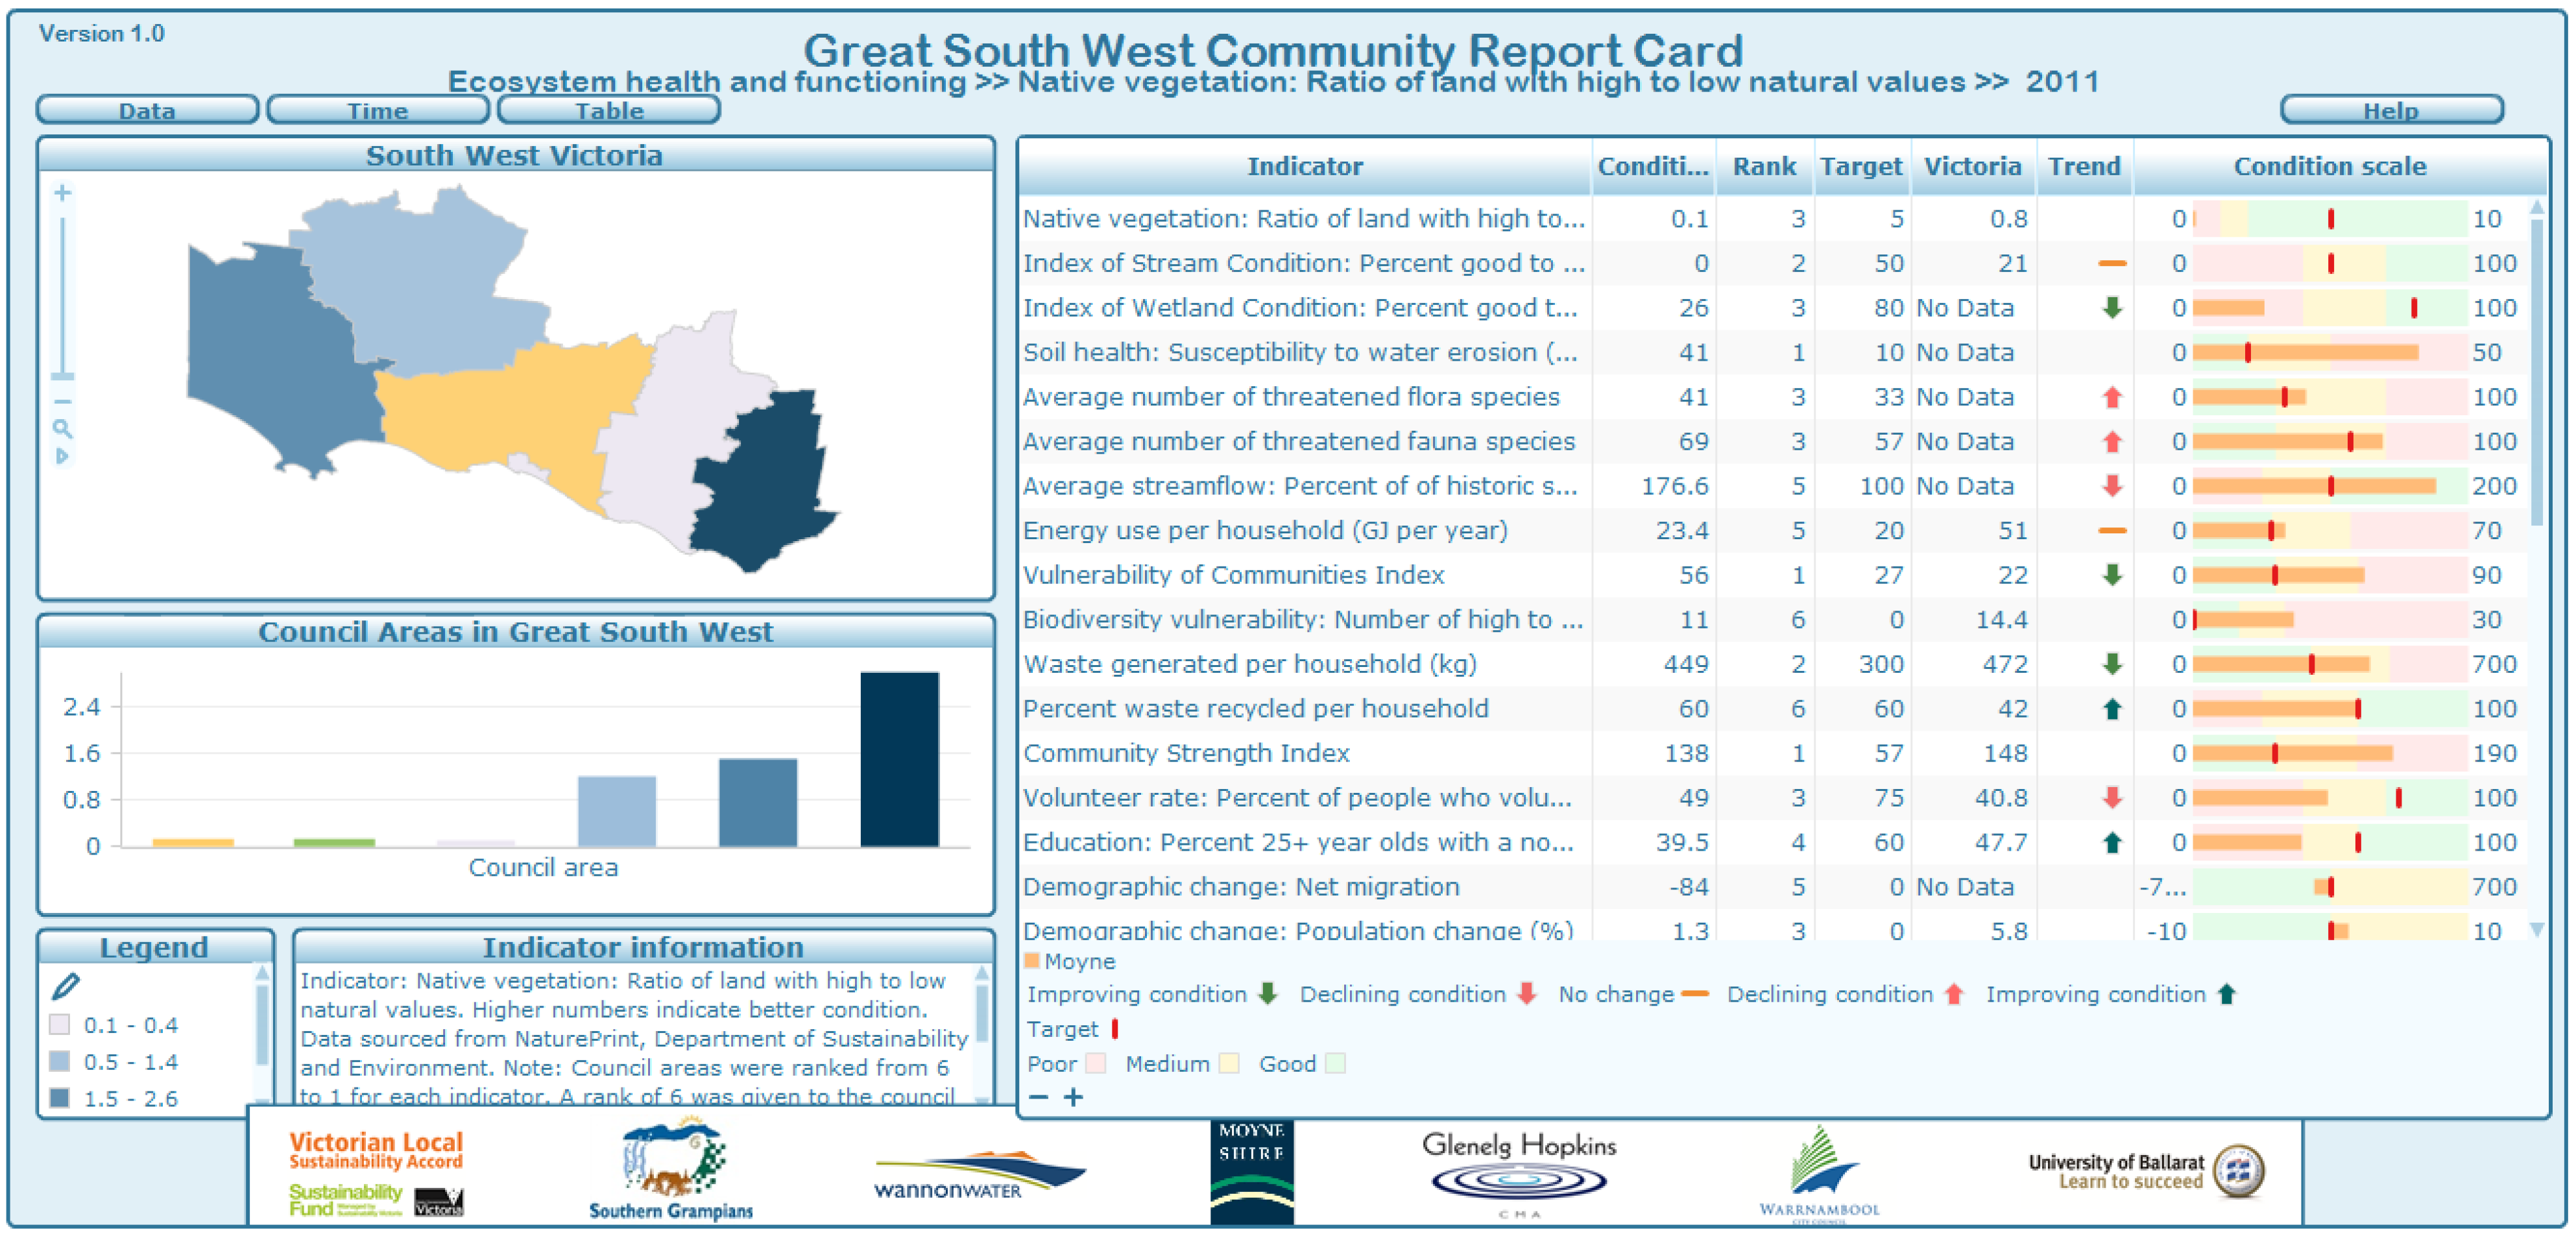
This information was then used to produce the three versions of the Great South West Community Report Card. The Technical Report contains all indicator data at the local government and regional scale including trends, current condition, comparisons across local governments and with the Victorian average and target (see Figure 6). It also includes detailed information about the indicator, such as its relation to the key issue and sustainability, the data source, and methods used to collect and analyze the data. The technical report provides all the information decision makers need about each indicator to inform their decision making.
The two page Community Report Card shows maps of the ecosystem and human wellbeing, based on the current condition of each indicator, for each Local Government area with the narratives on the front page (see Figure 7). The back page of the Community Report Card has a table of the indicator condition and rank for each local government area, providing a quick comparison of each local government area’s condition. The Online Community Indicator Report (Figure 8—see [30]) includes the indicator condition across the local government areas in a map, bar graph and time series graph using InstantAtlas software. A table also displays indicator condition, rank, target, Victorian average, trend (where data was available) and a condition scale showing poor, medium and good condition based on literature, where available, or the Victorian average. The Online Community Indicators Report is interactive enabling comparisons of indicator condition across the Council areas in South West Victoria.
Figure 6. Example of the Technical Report Card [41].
Sustainability 06 03145 g006
Figure 7. Great South West Community Report Card 2011 [42].
Sustainability 06 03145 g007
Figure 8. Online Community Indicators Report [30].
Sustainability 06 03145 g008
A Guide to the Community Report Card was also developed which includes the process for updating the Community Report Card annually or biannually, and how to use it to inform decision making. This Guide is designed to provide all the information needed to ensure the Community Report Card becomes a useful tool for the community of the South West, including data sources, templates, and instructions for data analysis [36]. It has five parts as shown in Figure 9.
Figure 9. The five parts of the Guide to the Community Report Card [36].
Sustainability 06 03145 g009

4.4. Evaluation of the Great South West Community Report Card

The dartboard evaluation from the Launch of the Great South West Community Report Card 2011 showed that the majority of people felt that the Community Report Card “exceeded expectations” in terms of its ability to provide useful information about sustainability, for decision making and raising community awareness. Comments from local actors that demonstrate this positive response to the Community Report Card were, “visuals are useful—graphs, maps and tables”, “the Community Report Card is great” and it is a “quick stats reference”.
The survey evaluation also found that the majority of people felt that the Community Report Card could be a useful tool for the region for reporting on sustainability, raising community awareness about sustainability and informing decision making to enhance the region’s sustainability, with one person stating that it provides “a comparative resource to discuss community and environmental wellbeing between participating shires”. The usefulness and practicality of the Community Report Card is summed up by this participant’s comment:
“The Report Card brings together a range of valuable indicative information not otherwise normally conveniently available in one place. While there are no empirical absolutes about many of the measures their value will assume greatest value for sustainability when the data collection is repeated annually or biannually over an extended period of time. An evaluation 5 to 10 times over, say, a 10 year period (when the impact of minor annual variability will start to fade) will be of great value in identifying successful and/or problem areas of both environmental and social sustainability.”
The things people liked about the Community Report Card included “the simplicity of the final one page report and the comprehensive final document covering findings and methodology”, “the accessibility of the information”, “the repeatability of the assessment”, “provides an accessible report tool that doesn't require a high level of technical knowledge by reading audiences”, its usefulness in directing regional strategy and the public profile that could be created using the Community Report Card results.
However, one person felt that the Community Report Card was “not a holistic representation of the Great South West”. There was also some criticism about the ranking aggregation method used in the Community Report Card. One person felt that it is “meaningless to aggregate” ecosystem and human wellbeing indicators, while others felt that the ranking method did not add any useful value to the Community Report Card and that the comparative ranking did not produce “a fair assessment”. However, some people felt that the comparative ranking could motivate local governments to improve areas where they are underperforming. As such, further investigation is required to determine the impact that the ranking has on local government action.
To gauge the early adoption of the Community Report Card around the region, participants were asked if they or their organization have, or will, use the Community Report Card to inform decision making or planning. One organization plans to use the Community Report Card for future funding applications, while the majority of respondents were unsure, or have not used it yet. Only one person said “No” suggesting that most participants felt that they could use it in the future, even if they were not sure how they would use it. There was also some concern that there would not be ongoing implementation of the Community Report Card and that there is a need for “great effort put in to regional planning” in the region of which this would form the basis. However, further evaluation is required to determine the level of adoption and use.

5. Implications of Using a Collaborative Approach to Develop a Sustainability Reporting Tool
The ability to monitor the sustainability of your community is vital for decision makers at the local and regional scale to provide them with an evidence base for policy and programs designed to enhance the community’s sustainability or address key sustainability issues. Despite the number of sustainability indicators, tools and indices available, few have been adopted at the local or regional scale ([19] and others). This is due to a number of issues, including capacity of local governments, local government and community’s commitment to sustainability, lack of coordination between tiers of government or policy, and a range of issues with sustainability reporting tools. This paper tested a collaborative approach designed to overcome some of these issues, including lack of capacity of staff, lack of local relevance of the off-the-shelf sustainability tools and indicators, and the lack of practicality of many sustainability monitoring tools for informing decision making. The approach included local actors and sustainability experts working together to develop a sustainability reporting tool. The idea being that by working together, local actors can learn more about sustainability and sustainability reporting from the experts whose sustainability knowledge provides the theoretical basis for the tool. Also, the local actors provide their knowledge of the local system, its community and environment, which is invaluable to making the sustainability reporting locally relevant [43]. Furthermore, the input from local actors makes sure the tool is practical for them to use for informing decision making.
For South West Victoria, this approach worked to produce a locally relevant tool that local actors felt was practical for their use, as it provided information about the key issues for the sustainability of the region. Both the community and stakeholder surveys and the workshop where agreement was gained on the indicators were key steps for achieving this local relevance. This process made sure indicators were relevant to the region and could provide valuable information about the key issues for the sustainability of the region. The importance of community consultation throughout the process of developing a sustainability reporting tool, such as that used here, is well documented in the literature. Not only is local actor input at the indicator development stage essential to produce a locally relevant sustainability reporting tool [19,28], it also produces a sense of ownership of the tool, and provides credibility, transparency and robustness to the tool [20]. This makes it more likely that the tool produced will be accepted and used by the local actors [44].
The input of local actors throughout the process was invaluable for making the tool practical, as their input into the methods used for aggregation and reporting made sure the tool was practical for them to use for decision making. For example, local actors expressed their need for a sustainability report that provided information on individual indicator performance to direct decision making in their community, as such the condition and trend for each indicator were presented in the Community Report Card. Thus, the collaborative approach helped ensure that the tool was practical for local actors’ purposes.
The use of experts in this process kept the focus on sustainability throughout the process, ensuring that each indicator would provide some information about the sustainability of the region and that the assessment was based on the sustainability model in Figure 5. As such, the use of experts ensured the tool was embedded in sustainability theory producing a holistic sustainability tool that assesses both human and ecosystem wellbeing. The methods used for data analysis and aggregation were based on methods developed and used by others ([2,45,46] and others), while the indicators used have also been used by others for understanding sustainability, community or ecosystem wellbeing. Further, the targets used to provide a benchmark for understanding the region’s sustainability were based on literature and expert opinion. All of this means that the tool is not only locally relevant but also embedded in sustainability theory and scientifically robust.
By involving local actors in the development of the sustainability tool, the sustainability reporting capacity of local decision makers increases. This was demonstrated here where the evaluation survey showed that participants of the project had increased their understanding and knowledge of sustainability indicators and reporting [37]. This was to be expected with many authors (such as [27,28]) also finding that by having the local actors involved in the process, their knowledge of sustainability and sustainability reporting increased. As such, the results of this study suggest that a collaborative approach, like the one used here, will increase the sustainability reporting capacity of local actors helping them overcome one of the barriers to adoption of sustainability reporting.
Therefore, this study has shown that a collaborative approach that involves local actors at all stages in the tool development and focuses on developing a sustainability monitoring tool that matches the capacity of the local actors is able to produce a tool that is locally relevant, practical and theoretically sound (see Figure 10). However, the success of using this approach in South West Victoria may have been contributed to in part by the fact that the region has had a sustainability focus for over a decade. There was also support from local actors for the development of a sustainability reporting tool for the region (see [47]). If this approach was used elsewhere, it may not be as successful without some local actors passionate about sustainability and sustainability reporting and an environment open to the use of sustainability reporting in local and regional management. As such, the approach needs to be tested in other contexts to verify the results of this study.
There are a number of limitations to this approach for developing a sustainability reporting tool. There needs to be some level of support and commitment from the local actors, including the local government, its staff, councilors and senior management, and other local or regional management organizations for a project to develop a sustainability reporting tool to begin. Also, as the process takes time (i.e., this project took 2 years to complete) and effort, there needs to be some people passionate about sustainability reporting involved to ensure the project produces a sustainability reporting tool. In addition, where the capacity of local actors is low (due to being time, knowledge or resource poor) and there is a large turnover of staff the ability to run such a collaborative approach may be limited. This was demonstrated in this study where there was difficulty getting people involved due to lack of time, and staff turnover meant that the person involved in the project from certain organizations changed a number of times during the life of the project.
Figure 10. The collaborative approach to developing practical and theoretically sound.
Sustainability 06 03145 g010
Furthermore, without the support of state or federal government funding, local actors will continue to lack the funding to ensure that any sustainability reporting tool developed can be used for ongoing monitoring. This is because many local actors, particularly those in regional and rural areas, have limited funds to spread across a range of services, and sustainability is still not seen as a priority, particularly for local governments who would be one of the best custodians for a sustainability reporting tool. This is because concerns about economic development are more immediate and pressing for local governments, and there is little support from communities for sustainability [7,9].
Across the world, many local and regional governments are implementing policy and programs to address key issues in their community to improve the community’s sustainability. However, without a sustainability monitoring tool that provides trend and condition information on the key issues for the sustainability of the community, it is difficult to determine if any of the policies and programs are having a positive impact on community sustainability. However, due to a range of issues, many local and regional governments do not have ongoing sustainability monitoring. This paper has demonstrated that a collaborative approach to the development of a sustainability reporting tool that involves local actors and sustainability reporting experts working together is able to overcome some of the challenges for sustainability reporting. In doing so, it is able to produce a locally relevant, practical and theoretically sound sustainability monitoring tool when there is support from local actors for sustainability reporting.

Acknowledgments

This project was funded by the Victorian Government’s Sustainability Fund under the Victorian Local Sustainability Accord. The author would like to acknowledge the support and contributions from Southern Grampians Shire Council, Wannon Water, Glenelg Hopkins Catchment Management Authority, the Department of Sustainability and Environment, Warrnambool City Council, Moyne Shire Council, Glenelg Shire Council, Corangamite Shire Council and Colac-Otway Shire Council.

Conflicts of Interest

The author declares no conflict of interest.

References

  1. Forum for the Future. In Sustainable Cities Index 2007; Forum for the Future: London, UK, 2007.
  2. Prescott-Allen, R. The Wellbeing of Nations: A Country-by-Country Index of Quality of Life and the Environment; Island Press: Washington, DC, USA, 2001. [Google Scholar]
  3. Wackernagel, M.; Rees, W.E. Our Ecological Footprint: Reducing Human Impact on the Earth; New Society Publishers: Gabriola Island, BC, Canada, 1996. [Google Scholar]
  4. Graymore, M.L.M.; Wallis, A.M.; Richards, A.J. An Index of Regional Sustainability: A GIS-based multiple criteria analysis decision support system for progressing sustainability. Ecol. Complex. 2009, 6, 453–462. [Google Scholar] [CrossRef]
  5. Richards, A.J.; Wallis, A.M.; Graymore, M.L.M. An Index of Regional Sustainability (AIRS): Incorporating system processes into sustainability assessment. In Presented at the 2007 ANZSEE Conference, Re-inventing Sustainability: A climate for change. Noosa Lakes, Queensland, Australia, 3–6 July 2007.
  6. Esty, D.C.; Levy, M.; Srebotnjak, T.; de Sherbinin, A. Environmental Sustainability Index: Benchmarking National Environmental Stewardship; Yale Center for Environmental Law & Policy: New Haven, CO, USA, 2005. [Google Scholar]
  7. Pini, B.; Wild River, S.; Haslam McKenzie, F.M. Factors Inhibiting Local Government Engagement in Environmental Sustainability: Case studies from rural Australia. Aust. Geogr. 2007, 38, 161–175. [Google Scholar] [CrossRef]
  8. Graymore, M.L.M.; Sipe, N.G.; Rickson, R.E. Regional Sustainability: How useful are current tools of sustainability assessment at the regional scale? Ecol. Econ. 2008, 67, 362–371. [Google Scholar] [CrossRef]
  9. Wild River, S. Enhancing the sustainability efforts of local governments. Int. J. Innov. Sustain. Dev. 2005, 1, 46–64. [Google Scholar] [CrossRef]
  10. Tanguay, G.A.; Rajaonson, J.; Lefebvre, J.-F.; Lanoie, P. Measuring the sustainability of cities: An analysis of the use of local indicators. Ecol. Indic. 2010, 10, 407–418. [Google Scholar] [CrossRef]
  11. Mercer, D.; Jotkowitz, B. Local Agenda 21 and Barriers to Sustainability at the Local Government Level in Victoria, Australia. Aust. Geogr. 2000, 31, 163–181. [Google Scholar] [CrossRef]
  12. Keen, M.; Mercer, D. Environmental planning at the local level: The example of local conservation strategies in Victoria, Australia. Environmentalist 1993, 13, 83–95. [Google Scholar] [CrossRef]
  13. Lane, M.B.; McDonald, G. Community based environmental planning: Operational dilemmas, planning principles and possible remedies. J. Environ. Plan. Manag. 2005, 48, 709–731. [Google Scholar] [CrossRef]
  14. Christoff, P. Degreening government in the garden state: Environment policy under the Kennett government, 1992–1997. In Environ. Plan. Law J.; 1998; 15, pp. 10–32. [Google Scholar]
  15. Sauvage, J.; Smith, G. Organisational change in Sutherland Shire Council-methods and techniques using sustainability training. In Proceedings of the Effective Sustainability Education-What Works? Why? Where Next? Linking Research and Practice, University of NSW, Sydney, Australia, 18–20 February 2004.
  16. Morrison, T.H.; McDonald, G.T.; Lane, M.B. Integrating natural resource management for better environmental outcomes. Aust. Geogr. 2004, 35, 243–58. [Google Scholar] [CrossRef]
  17. Keen, M.; Mahanty, S.; Sauvage, J. Sustainability assessment and local government: Achieving innovation through practitioner networks. Local Environ. 2006, 11, 201–216. [Google Scholar] [CrossRef]
  18. Keen, M.; Mercer, D.; Woodfull, J. Approaches to environmental management at the Australian local government level: Initiatives and limitations. Environ. Polit. 1994, 3, 43–67. [Google Scholar] [CrossRef]
  19. Byrne, S.; Wallis, A.M.; Graymore, M.L.M.; O’Toole, K. Regional Sustainability Program. Indicators Guide—Victoria: Background Report; Deakin University: Warrnambool, Australia, 2010. [Google Scholar]
  20. Ramos, T.B.; Caeiro, S. Meta-performance evaluation of sustainability indicators. Ecol. Indic. 2010, 10, 157–166. [Google Scholar] [CrossRef]
  21. Wallis, A.; Richards, A.; O’Toole, K.; Mitchell, B. Measuring regional sustainability: Lessons to be learned. Int. J. Environ. Sustain. Dev. 2007, 6, 193–207. [Google Scholar] [CrossRef]
  22. Wallis, A.M.; Kelly, A.R.; Graymore, M.L.M. Assessing sustainability: A technical fix or a means of social learning? Int. J. Sustain. Dev. World Ecol. 2010, 17, 67–75. [Google Scholar]
  23. Swinburne University Centre for Regional Development. Cardinia Compass: Indicators of Community Sustainability; Prepared for the Cardinia Shire Council by Centre for Regional Development at Swinburne University: Melbourne, Australia, 2006. [Google Scholar]
  24. Jacksonville Community Council Inc. Quality of Life in Jacksonville: Indicators for Progress. City of Jacksonville: Jacksonville, FL, USA, 2001. [Google Scholar]
  25. City of Tucson. The Livable Tucson Vision Program. Available online: http://cms3.tucsonaz.gov/livable (accessed on 27 March 2010).
  26. Frankston City Council. State of the City Report 2009. Frankston City Council: Frankston, Australia, 2010. [Google Scholar]
  27. Reed, M.S.; Fraser, E.D.G.; Dougill, A.J. An adaptive learning process for developing and applying sustainability indicators with local communities. Ecol. Econ. 2006, 59, 406–418. [Google Scholar] [CrossRef]
  28. Bell, S.; Morse, S. Experiences with sustainability indicators and stakeholder participation: A case study relating to a “Blue Plan” project in Malta. Sustain. Dev. 2004, 12, 1–14. [Google Scholar] [CrossRef]
  29. Byrne, S.; Wallis, A.M.; Graymore, M.L.M.; O’Toole, K. Getting Started: A Guide to Developing Regional Sustainability Indicators in Victoria; Deakin University: Warrnambool, Australia, 2010. [Google Scholar]
  30. Graymore, M.L.M. Great South. West. Online Community Indicators Report. Available online: http://www.GSWreportcard.org (accessed on 31 January 2013).
  31. Bennetto, L.; Martin, R.; Nichols, J.; Riddle, L.; Worland, R. The Great South. Coast Regional Strategic Plan; Barwon South West Regional Management Forum and Regional Development Australia: Geelong, Australia, 2010. [Google Scholar]
  32. Australian Bureau of Statistics. Census of Population and Housing. Available online: http://www.abs.gov.au/census (accessed on 31 January 2013).
  33. South West Sustainability Partnership. South. West. Sustainability Blueprint; South West Sustainability Partnership: Hamilton, Australia, 2001. [Google Scholar]
  34. Graymore, M. Regional Sustainability Indicators Framework for South West Victoria: Milestone 3b Report: Agreed Set of Indicators; Horsham Campus Research Precinct, University of Ballarat: Horsham, UK, 2011. [Google Scholar]
  35. Hardi, P.; Zdan, T. Assessing Sustainable Development: Principles in Practice; International Institute for Sustainable Development: Winnipeg, MB, Canada, 1997. [Google Scholar]
  36. Graymore, M.L.M. Great South West Community Report Card: Guide to the Community Report Card; Horsham Campus Research Precinct, University of Ballarat: Horsham, UK, 2012. [Google Scholar]
  37. Graymore, M. Regional Sustainability Indicators Framework for South West Victoria—Milestone 6 Report: Final Project Report; Horsham Campus Research Precinct, University of Ballarat: Horsham, UK, 2013. [Google Scholar]
  38. University of Swinburne. Evaluation Toolbox. Available online: http://www.evaluationtoolbox.net.au (accessed on 1 October 2012).
  39. Graymore, M. Regional Sustainability Indicators Framework for South West Victoria—Milestone 3a: Workshop 1—Defining the Framework Outcomes; Horsham Campus Research Precinct, University of Ballarat: Horsham, UK, 2011. [Google Scholar]
  40. Wackernagel, M.; Yount, J.D. The ecological footprint: An indicator of progress toward regional sustainability. Environ. Monit. Assess. 1998, 51, 511–529. [Google Scholar] [CrossRef]
  41. Graymore, M.L.M. Great South West Community Report Card: Technical Report; Horsham Campus Research Precinct, University of Ballarat: Horsham, UK, 2012. [Google Scholar]
  42. Graymore, M.L.M. Great South. West. Community Report Card 2011; Horsham Campus Research Precinct, University of Ballarat: Horsham, UK, 2012. [Google Scholar]
  43. Wallis, A.M.; Graymore, M.L.M.; Richards, A.J. Significance of environment in the assessment of sustainable development: The case for south west Victoria. Ecol. Econ. 2011, 70, 595–605. [Google Scholar] [CrossRef]
  44. Coelho, P.; Mascarenhas, A.; Vaz, P.; Beja, I.; Dores, A.; Ramos, T.B. A methodological framework for indicators of sustainable development at the regional scale: The case of a Portuguese region (Algarve). In Proceedings of the 12th Annual International Sustainable Development Research Conference, Hong Kong, China, 6–8 April 2006.
  45. Dodson, J.; Sipe, N. Shocking the Suburbs: Urban Location,Housing Debt and Oil Vulnerability in the Australian City; Urban Research Program Griffith University: Brisbane, Australia, 2006. [Google Scholar]
  46. Sietchiping, R. Applying an index of adaptive capacity to climate change in north-western Victoria, Australia. Applied GIS 2007, 3, 16.1–16.28. [Google Scholar] [CrossRef]
  47. Natural Assets Alliance of the South West Sustainability Partnership. In Towards Environmental Sustainability in the South West: Priorities Direction Statement 2010–2012; South West Sustainability Partnership: Hamilton, ON, Canada, 2010.