1. Introduction
Deforestation is one of the most serious current environmental problems. During the period of 2000–2010, approximately 130,000 km
2 of forest have been lost around the world each year [
1]. In response, the efforts to support and promote the recovery of forest ecosystems have increased [
2]. One of the most comprehensive approaches to forest restoration is the Forest Landscape Restoration (FLR) [
3]. FLR is defined as a process of restoration of goods, services and ecological processes that forests can provide at a broader landscape level. It fosters restoration, based on the better assets for both people and the environment, focusing on regaining the ecological integrity and enhancing human well-being [
4].
FLR provides a framework to implement large-scale and long-term restoration attempts with the incorporation of diverse dimensions within them. It is a collaborative process that involves a wide range of actors since the planning stage [
5]. Important issues that arise in restoration planning are where to restore first and where we should focus the available resources and efforts. The decision should come from consensus among stakeholders to identify priorities and the most preferable sites for restoration. This is clearly related to concerns of an economic kind and the awareness that the available resources should be directed to areas and actions that are likely to provide the greatest benefits to both nature and people. However, actors’ opinions are often in conflict with each other, and economic and technical restrictions limit the land available for restoration planning [
5]. Hence, the problem is complex, involving different components (e.g., environmental, socioeconomic) and views (e.g., local people, experts), and has a clear spatial dimension. Dealing with similar problems requires the application of proper tools to provide robust and informed decisions.
Multicriteria Decision Analysis (MCDA) encompasses a set of techniques to support decision-making processes [
6]. It provides a framework to integrate multiple opinions and evaluation criteria, to weight them according to their importance, and select the most suitable courses of action. Malczewski [
6] documented the increase in use of MCDA in synergy with the capabilities of the geographical information systems (GIS) in the last two decades. This occurred in a broad range of applications, such as water management [
7,
8], land use planning [
9], transportation infrastructure [
10,
11], waste disposal [
12,
13,
14], urban planning [
15], environmental planning [
16,
17], and forest restoration [
18,
19,
20,
21].
This paper presents a spatial MCDA-based method for identifying priority areas for forest landscape restoration that considers environmental and socioeconomic criteria and evaluates them according to the opinion of different participant groups, as obtained through a survey.
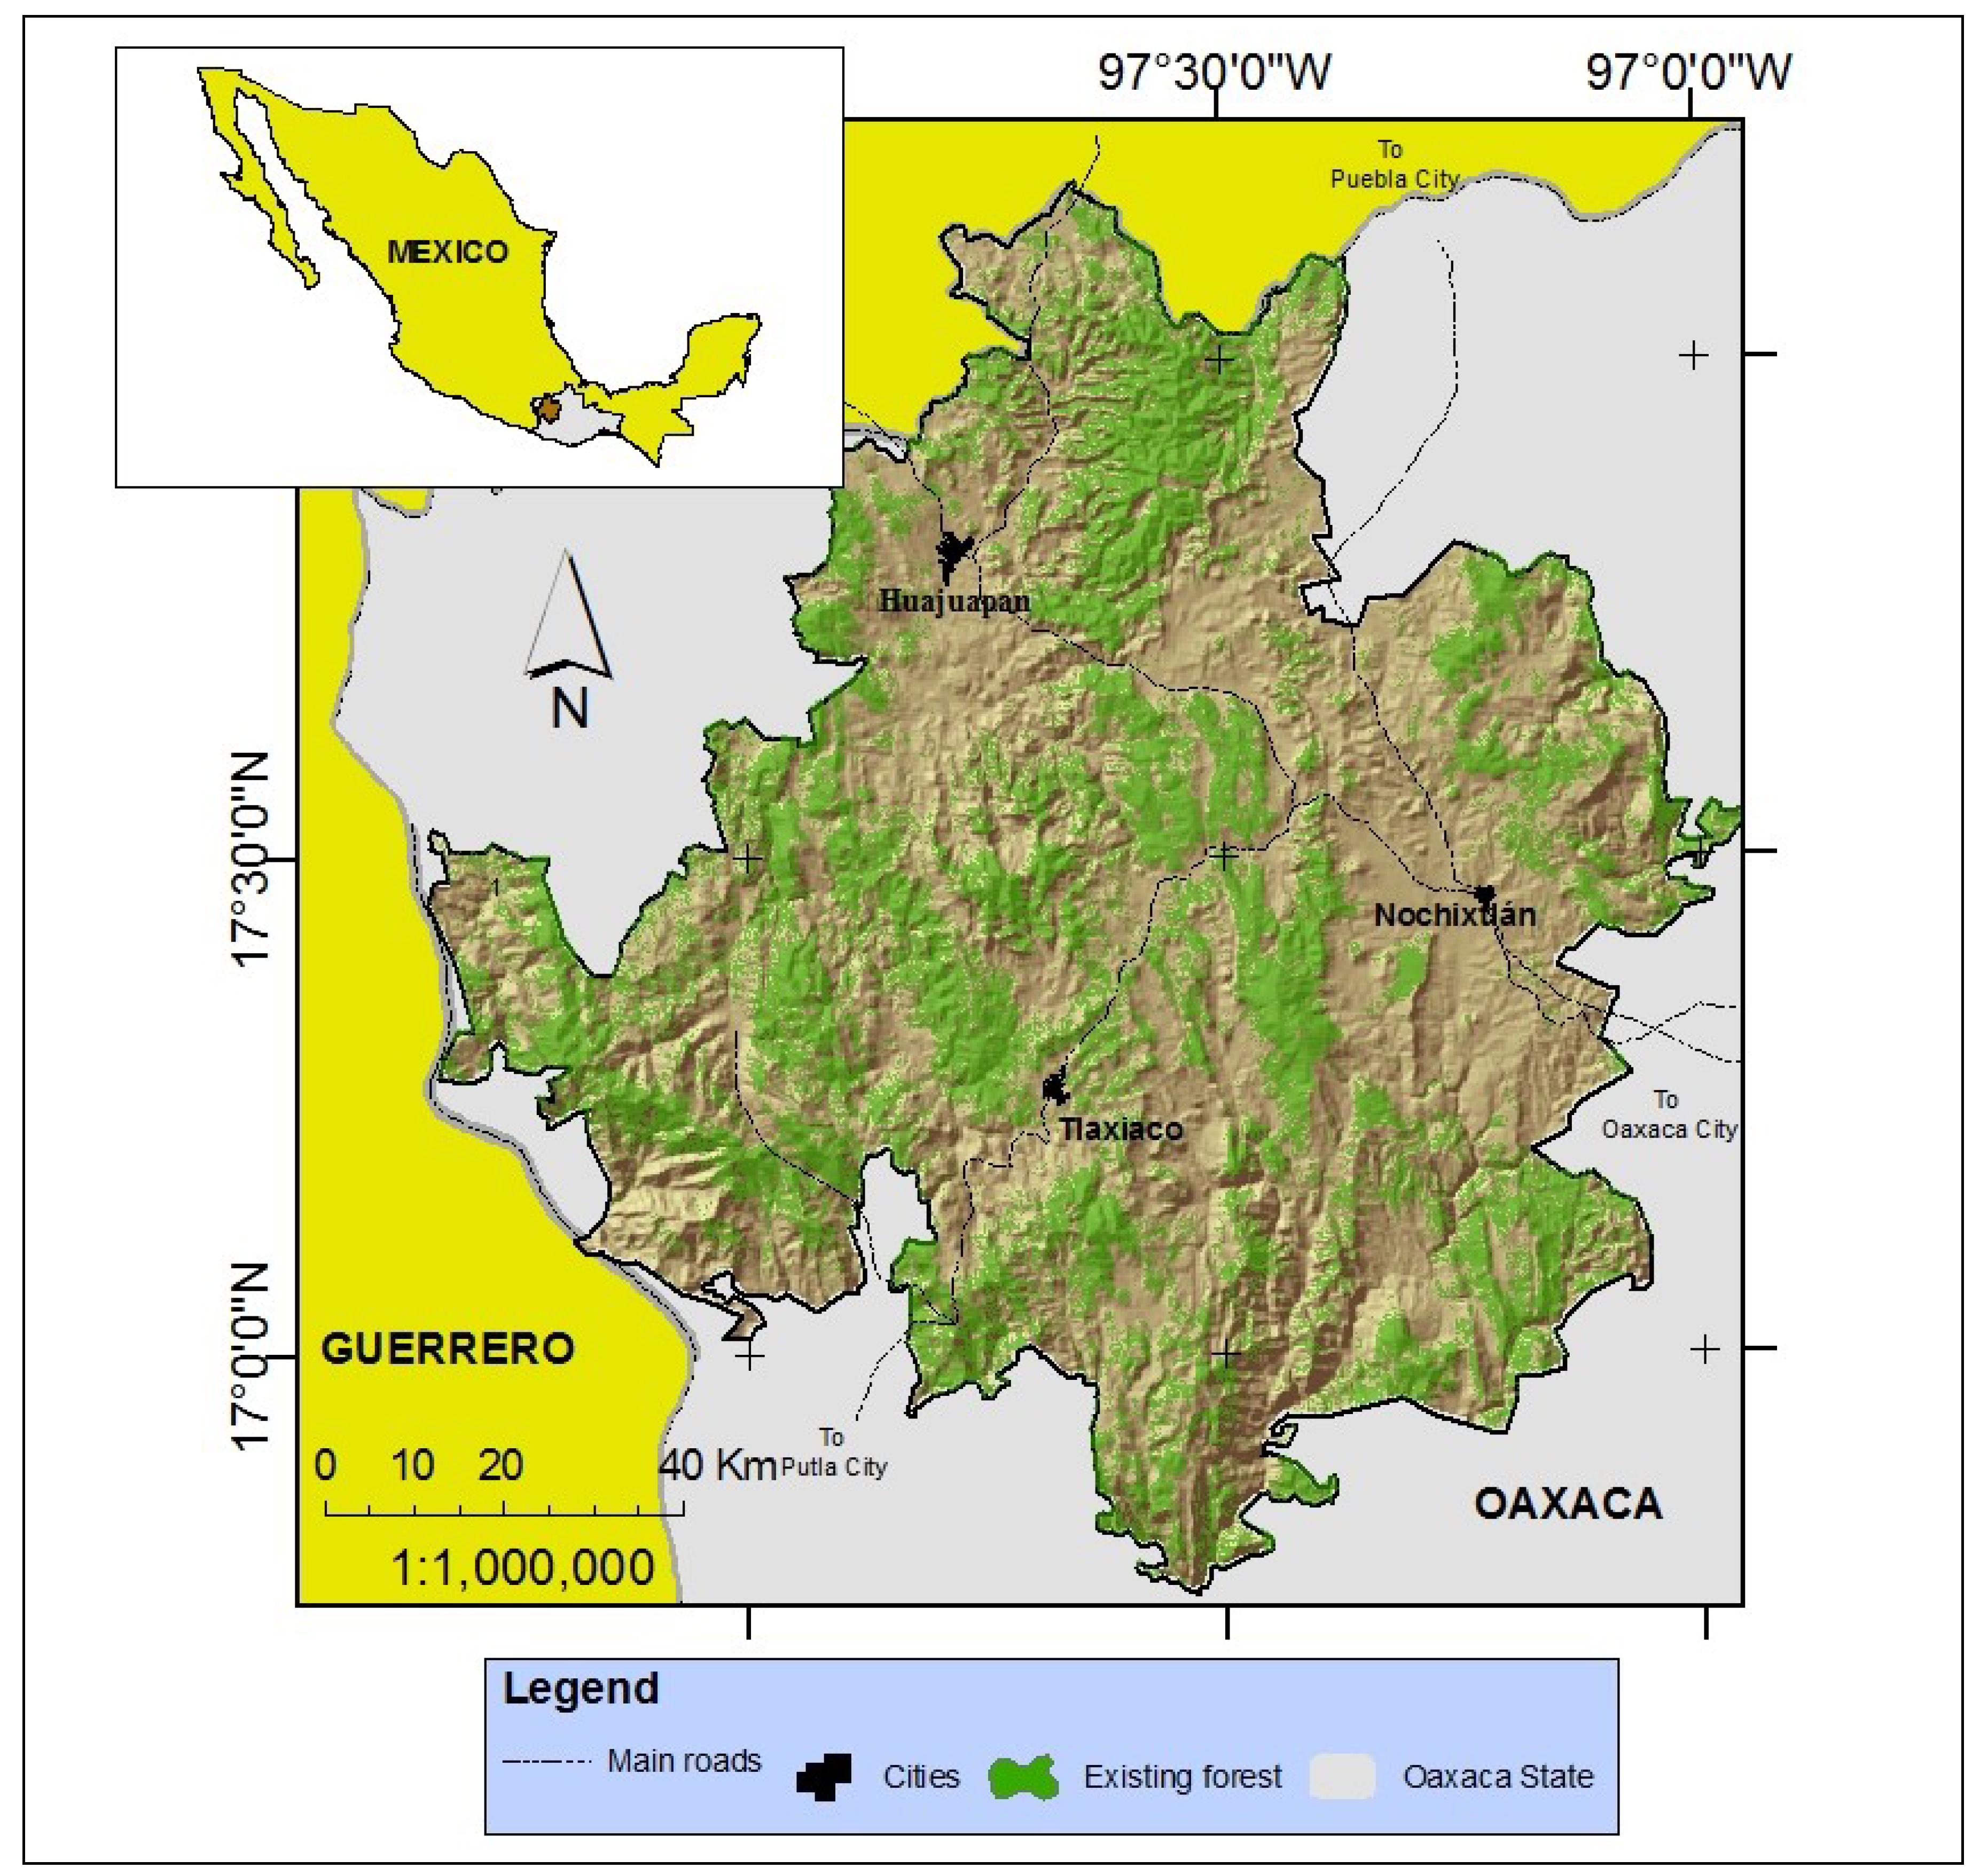
The framework methodology was designed in the Upper Mixtec region, in Southern Mexico, one of the most degraded areas of Latin America, where the lack of environmental data and resources go together with the urgency of implementing a regional plan for restoration.
The Upper Mixtec region lies on the northwest side of Oaxaca State, in South-eastern Mexico. It covers 8,100 km², corresponding to 13% of the total area of the State. Most of the information is available at the municipal level. However, some municipalities belong to more than one region. For this reason, the boundary of the study area was arbitrarily set to include all the municipalities whose area belongs for at least 50% to the region, according to the municipal and regional division available for the State of Oaxaca [
22]. As a result, 124 municipalities are incorporated in the study area for a total of 11,631 km² (
Figure 1).
The region is characterized by high topographic diversity with canyons, hills, intermountain plateaus, and valleys. The elevation ranges from 550 to 3,300 m. Native vegetation cover is composed of tropical dry forest, pine-oak forest, and xerophytes scrubs. However, crops and eroded areas are common throughout the entire area. Mean annual precipitation is 692 mm with rainfall being mostly concentrated in July and August with intense showers [
23,
24].
Figure 1.
Study area showing existing forest in the Upper Mixtec region, Oaxaca State, Mexico.
Figure 1.
Study area showing existing forest in the Upper Mixtec region, Oaxaca State, Mexico.
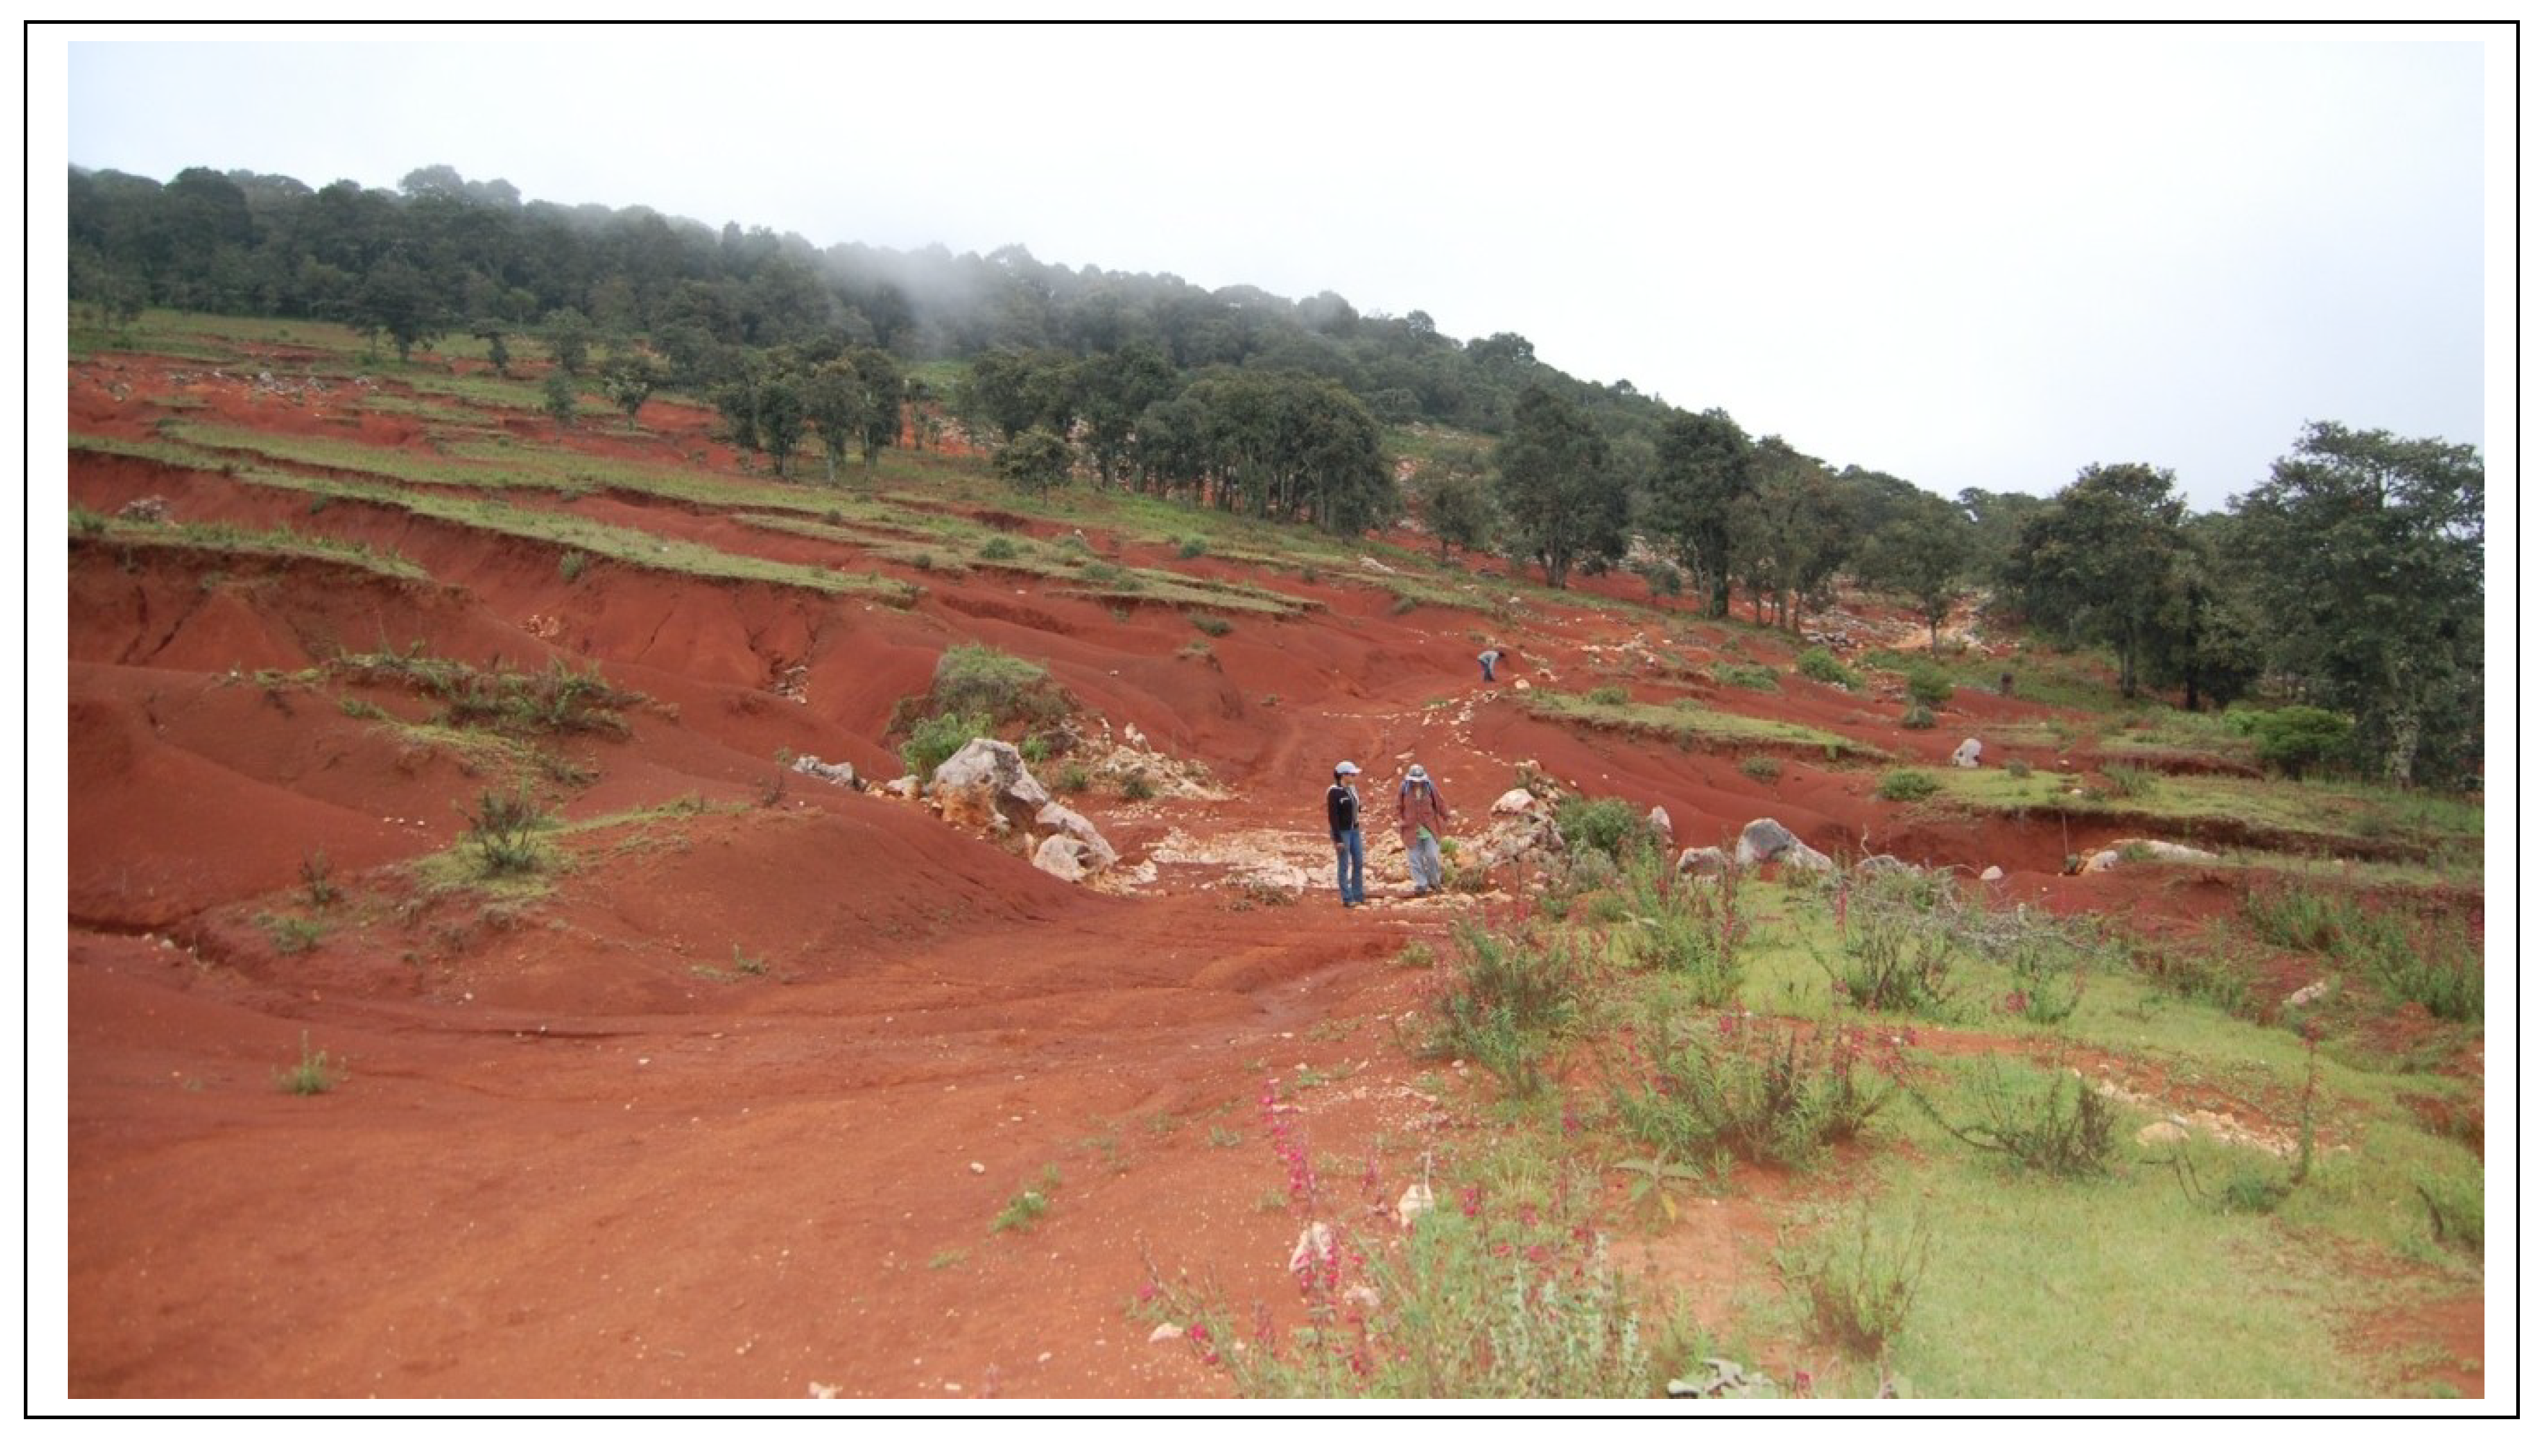
The Upper Mixtec is a region with severe socio-economic and environmental problems derived, in part, from wrong strategies of natural resources management. There is a critical problem of water supply, degraded areas, and bare soils (
Figure 2). Population is highly impoverished and dispersed [
25]. Approximately 50% of the original forest cover was lost with a deforestation rate of 52.7 km
2 per year, the current cover of forest falls around 6,592.47 km
2 (56.68% of study area). Although some governmental and non-governmental efforts against deforestation have been successful, resources available to combat deforestation cannot include all areas requiring restoration [
26,
27]. In 2005, only 26 km
2 were reforested in the whole Oaxaca State [
28]. Clearly, there is an urgent need to optimize the resources available for restoration. The main restriction to implement successful restoration projects in the Upper Mixtec region has been the lack of a good strategy of distribution for available resources, economic and technical, within a great area with high socio-ecological degradation [
27]. Selecting the best areas for restoration is a difficult task due to the many factors that should be taken into account and the particular points of view of different stakeholders that participate in the process. The use of GIS-based decision-making tools to generate a map of priority areas has not been tried in this region so far.
Figure 2.
Photograph of the Upper Mixtec region, Oaxaca State, Mexico, approximately 15 km west of Nochixtlán. It shows the loss of soils caused by deforestation (photo courtesy of Rafael F. del Castillo).
Figure 2.
Photograph of the Upper Mixtec region, Oaxaca State, Mexico, approximately 15 km west of Nochixtlán. It shows the loss of soils caused by deforestation (photo courtesy of Rafael F. del Castillo).
2. Experimental
The methodological framework was divided into three main stages, corresponding to Simon’s decision-making model [
29]: Intelligence, design, and choice (
Table 1).
In the intelligence stage, we sought the opinion of stakeholders to identify and evaluate socioeconomic and environmental criteria [
30]. Following Eastman
et al. [
31], a thematic raster layer was developed for each of the criteria based on the available data for the study region. A constraint layer was also generated that represents the areas where restoration activities are not relevant: urban, existing forest and water zones. Finally, maps of land suitability were generated [
17], reflecting the preference of the different stakeholders. In the design stage, we established a threshold based on the suitability levels to extract the most preferable sites (
i.e., contiguous pixels with high suitability levels), which can constitute potential restoration sites, as shown by Orsi and Geneletti [
32].
In the choice stage, we extracted the sites with highest suitability scores by each participant. Next, they were integrated into groups of stakeholders (academic, governmental, Non-governmental organization, and public) to create different maps of priority areas. Finally, an overall map of forest landscape restoration priorities was developed by combining the maps of the four groups.
Table 1.
Sequence of steps and activities performed in this study.
Table 1.
Sequence of steps and activities performed in this study.
| Stage | Steps and Activities | Tool |
|---|
| Intelligence | Identify and evaluate relevant criteria (Section 2.1) | Interview |
| Defining relevant criteria. | |
| Assign interval values of desirability. | |
| Assign values of importance | |
| Create criteria layers set: factors and constraint (Section 2.2) | |
| Modeling preferences (Section 2.3) | |
| Deriving commensurate criteria layers. | GIS |
| Weight assignment. | |
| Aggregation | MCE |
| Design | Design restoration options (Section 2.4) | MCE-GIS |
| Define threshold based on forest loss rate. |
| Identify and eliminate unsuitability area. |
| Create restoration options maps for each stakeholder. |
| Choice | Identification of priority areas (Section 2.5) | GIS |
| Priority areas by population sectors. |
| Map of priority areas for forest landscape restoration. |
2.1. Identify and Evaluate Relevant Criteria
Four groups of stakeholders were identified: general public (P), academic institutions (A), non-governmental organizations (NGO) and governmental officers (G). The general public included participants with knowledge about governmental programs for restoration and inhabitants from the region (including farmers, students, craftsmen). The selection of stakeholders was made following the method described by Geneletti [
33]. We elaborated a preliminary list of people with widely known work on environmental issues or professional experience in the study region, and sought advice from them to include additional suitable people. The number of final participants was determined according to Landeta [
34], who pointed a minimal of seven participants per group and thirty as the maximum number, regardless possible desertions of participants or incomplete interviews.
A total of 54 interviews were conducted with stakeholders belonging to the academic (9), governmental (10), NGO (9), and general public (26) groups. The interviews were conducted individually to avoid bias in judgment influenced by dissimilar opinions [
35]. The process was divided in two stages. In the first stage, we conducted two-round interviews to stakeholders face-to-face or via internet or telephone to generate a set of environmental and socio-economic criteria. In the second stage, the interviews aimed at evaluating the ten most relevant criteria.
Following the method applied by Orsi
et al. [
21], stakeholders were asked the question: Which criteria should be considered to select a site for forest restoration? Answers from first round were clustered into individual criteria based on semantic similarity. A preliminary list of criteria with all stakeholders’ opinions was created and returned back to each participant. In the second round, we asked to reconsider preview opinion taking into account the whole list of criteria. The criteria were ordered by the number of citations. Finally, the ten most cited criteria that fulfilled the following requirements were selected: spatial character (
i.e., suitability to be displayed on a map); availability of the data; and significant variability of this character over the study area.
Taking a decision based on one or more criteria implies that decision-makers can assign different degrees of desirability to the scores of the adopted criteria [
35]. For example, considering the criterion “distance to forest”, it could be decided that areas in close proximity to existing forest should be accorded priority or rather that areas far from existing forest should be given such priority. In this stage, stakeholders were asked:
what levels of a
criterion reflect a higher
priority for restoration? Three possible answers were possible: (1) lower, (2) intermediate, and (3) higher ranges. The answers allowed us to classify each criterion under one of the following types: 1,
cost (the lower the values of the criterion the higher the desirability); 2,
intermediate (the more intermediate the values the higher the desirability); and 3
benefit (the higher the values the higher the desirability).
In order to account for the fact that criteria may have different relative importance in a decision process [
36,
37,
38], stakeholders were asked the following question: How important is the criterion in the selection of a restoration site? The answers were ranked from low to high level of importance using a five-point scale from not relevant (key 1), to very important (key 5).
2.2. Criteria Layers: Factors and Constraints
A raster layer was generated for each one of the criteria selected. Two types of layer were constructed: factors and constraint. The
factor layers represented each one of the ten criteria selected in the consultation stage, while the
constraint layer represented restrictions to be considered during site selection. For this purpose, we acquired, compiled and processed a set of available spatial thematic data from the study area. Tabular, vector, and raster data were acquired from governmental agencies. In addition, we acquired a SPOT’05 satellite image (30 m resolution) that was analyzed through supervised classification by personnel of the GIS Laboratory of CIIDIR Oaxaca, National Polytechnic Institute. We generated raster-base layers using ArcGis 9.2 software [
39]. A resample of 30 m pixel resolution and WGS84-UTM-14N system re-projection were applied for each layer output. The minimum spatial unit of study,
i, was defined as an area of 900 m
2 (
i.e., 30m x 30m), represented by a pixel and named “
alternative”, which was assessed by criteria in terms of suitability.
2.3. Modeling Preferences
In this stage we integrated preferences and criteria layers and generated individual suitability maps
, one for each stakeholder by following the basic steps of MCDA: (1) transformation of the original attribute values of criteria layers into comparable units (standardization) (Section 3.3.1), (2) prioritization of the criterion based on its relative importance (weight assignment), and (3) computation and assignment of suitability scores to each pixel (evaluation alternative) by using a decision rule (aggregation). We used the Spatial Multicriteria Evaluation Module (SMCE) of ILWIS 3.6
® to build the criteria tree and to carry out multicriteria analysis [
40].
2.3.1. Standardization
For a multicriteria decision analysis process, in which we combine criteria and preferences, it is essential to combine criteria in the same scale of values. Therefore, original values of criteria must be transformed into comparable units [
41]. To this end, a standardization process was performed by considering value functions that convert the original criterion scores into degrees of desirability, according to the type of criterion suggested by participant (
i.e., cost, intermediate, benefit) [
35]. The standardization process was conducted using the SMCE module and the interval method of linear scale standardization following formulas 1 to 3. The standardized values of each criterion ranged between 0 (least desirable condition) and 1 (most desirable condition) [
42].
where
minv is the minimum input value, maxv is the maximum input value; a, b and
c are constants, and
v is the original input value.
2.3.2. Weight Assignment
The relative importance value assigned to each criterion, known as
weight, was used for criteria prioritization [
36,
38]. We applied the rank order method for translating the participants’ preferences expressed during the survey into quantitative values of importance that they were normalized to sum 1 [
37,
41].
The procedure was set up in the SMCE module using the information of the interviews. At first, the criteria were put in order of importance, from the most to the least important criterion [
43]. Then, the expected value algorithm (Formula 4) was applied to calculate the weight (
Wk) for criterion (
k), where
n is the number of criteria and
i is the position of the criterion within the ranking.
2.3.3. Aggregation
The aggregation brings together the results of previous steps, combining normalized criteria values and weights for each alternative [
16]. The aggregation was performed using the weighted linear summation method, which is a linear combination of standardized values by means of weights (formula 5).
where
Ai is the value of suitability for
ith each alternative (minimum spatial unit),
xij is the score of
ith alternative with respect to the
jth standardized criterion value, and
wj is a normalized weight, so that ∑
wj = 1. The most preferred alternative was that with the maximum value of
Ai [
6].
2.4. Design of Restoration Options
The design of suitable sites (restoration options) was conducted by selecting the best pixels from the suitability maps generated in the previous stage of aggregation. As suggested by Orsi and Geneletti [
32], this process was driven by the identification of total restoration target and the minimal area of the restored patches, and involved the following steps. (1) Identify the areas where there are no constraints; (2) Within these areas, select the pixels with the highest suitability values until reaching an area of 152,000 ha, which represents the target area for restoration interventions; (3) Eliminate all patches smaller than 0.54 ha (
i.e., 6 contiguous pixels), in order to avoid selecting areas too small to make restoration feasible. These rules were agreed on the basis of the rules to support and fund restoration projects by the National Forestry Commission (quoted in Céspedes-Flores and Moreno-Sánchez [
28]). One restoration map was generated for each stakeholder.
2.5. Identification of Priority Areas
Five maps of forest landscape restoration priorities were generated, one for each stakeholder group and one combining all the groups. Individual stakeholders’ maps of suitable areas for restoration were summed up within each participant groups. This was performed by using a “sum” operation in a GIS, which generates a map where each pixel contains a value tantamount to the sum of the values of the corresponding pixels in all the input maps. Subsequently, we extracted the most suitable pixels until the fulfillment of the required restoration area (152,000 ha), as described in the previous sub-section. Pixel values in the resulting maps are classified in a three-level scale: 1 (if all four stakeholder groups agree on the suitability of the site), 2 (only three stakeholder groups agree), and 3 (only two stakeholder groups agree).
3. Results and Discussion
34 different criteria were identified: 21 environmental criteria and 13 socioeconomic.
Table 2 shows the most frequently cited criteria. The highest number of citations was given to the criterion “distance from forest”, which was suggested by 18 of the interviewees. 41% of the criteria listed were mentioned only once and accounted for 3.6% of total citations. The ten most frequently cited criteria that were considered for further analysis are shown in
Table 3, which does not include criteria for which data were not available (
i.e., rate of land use change, soil depth, land tenure, forest fragmentation).
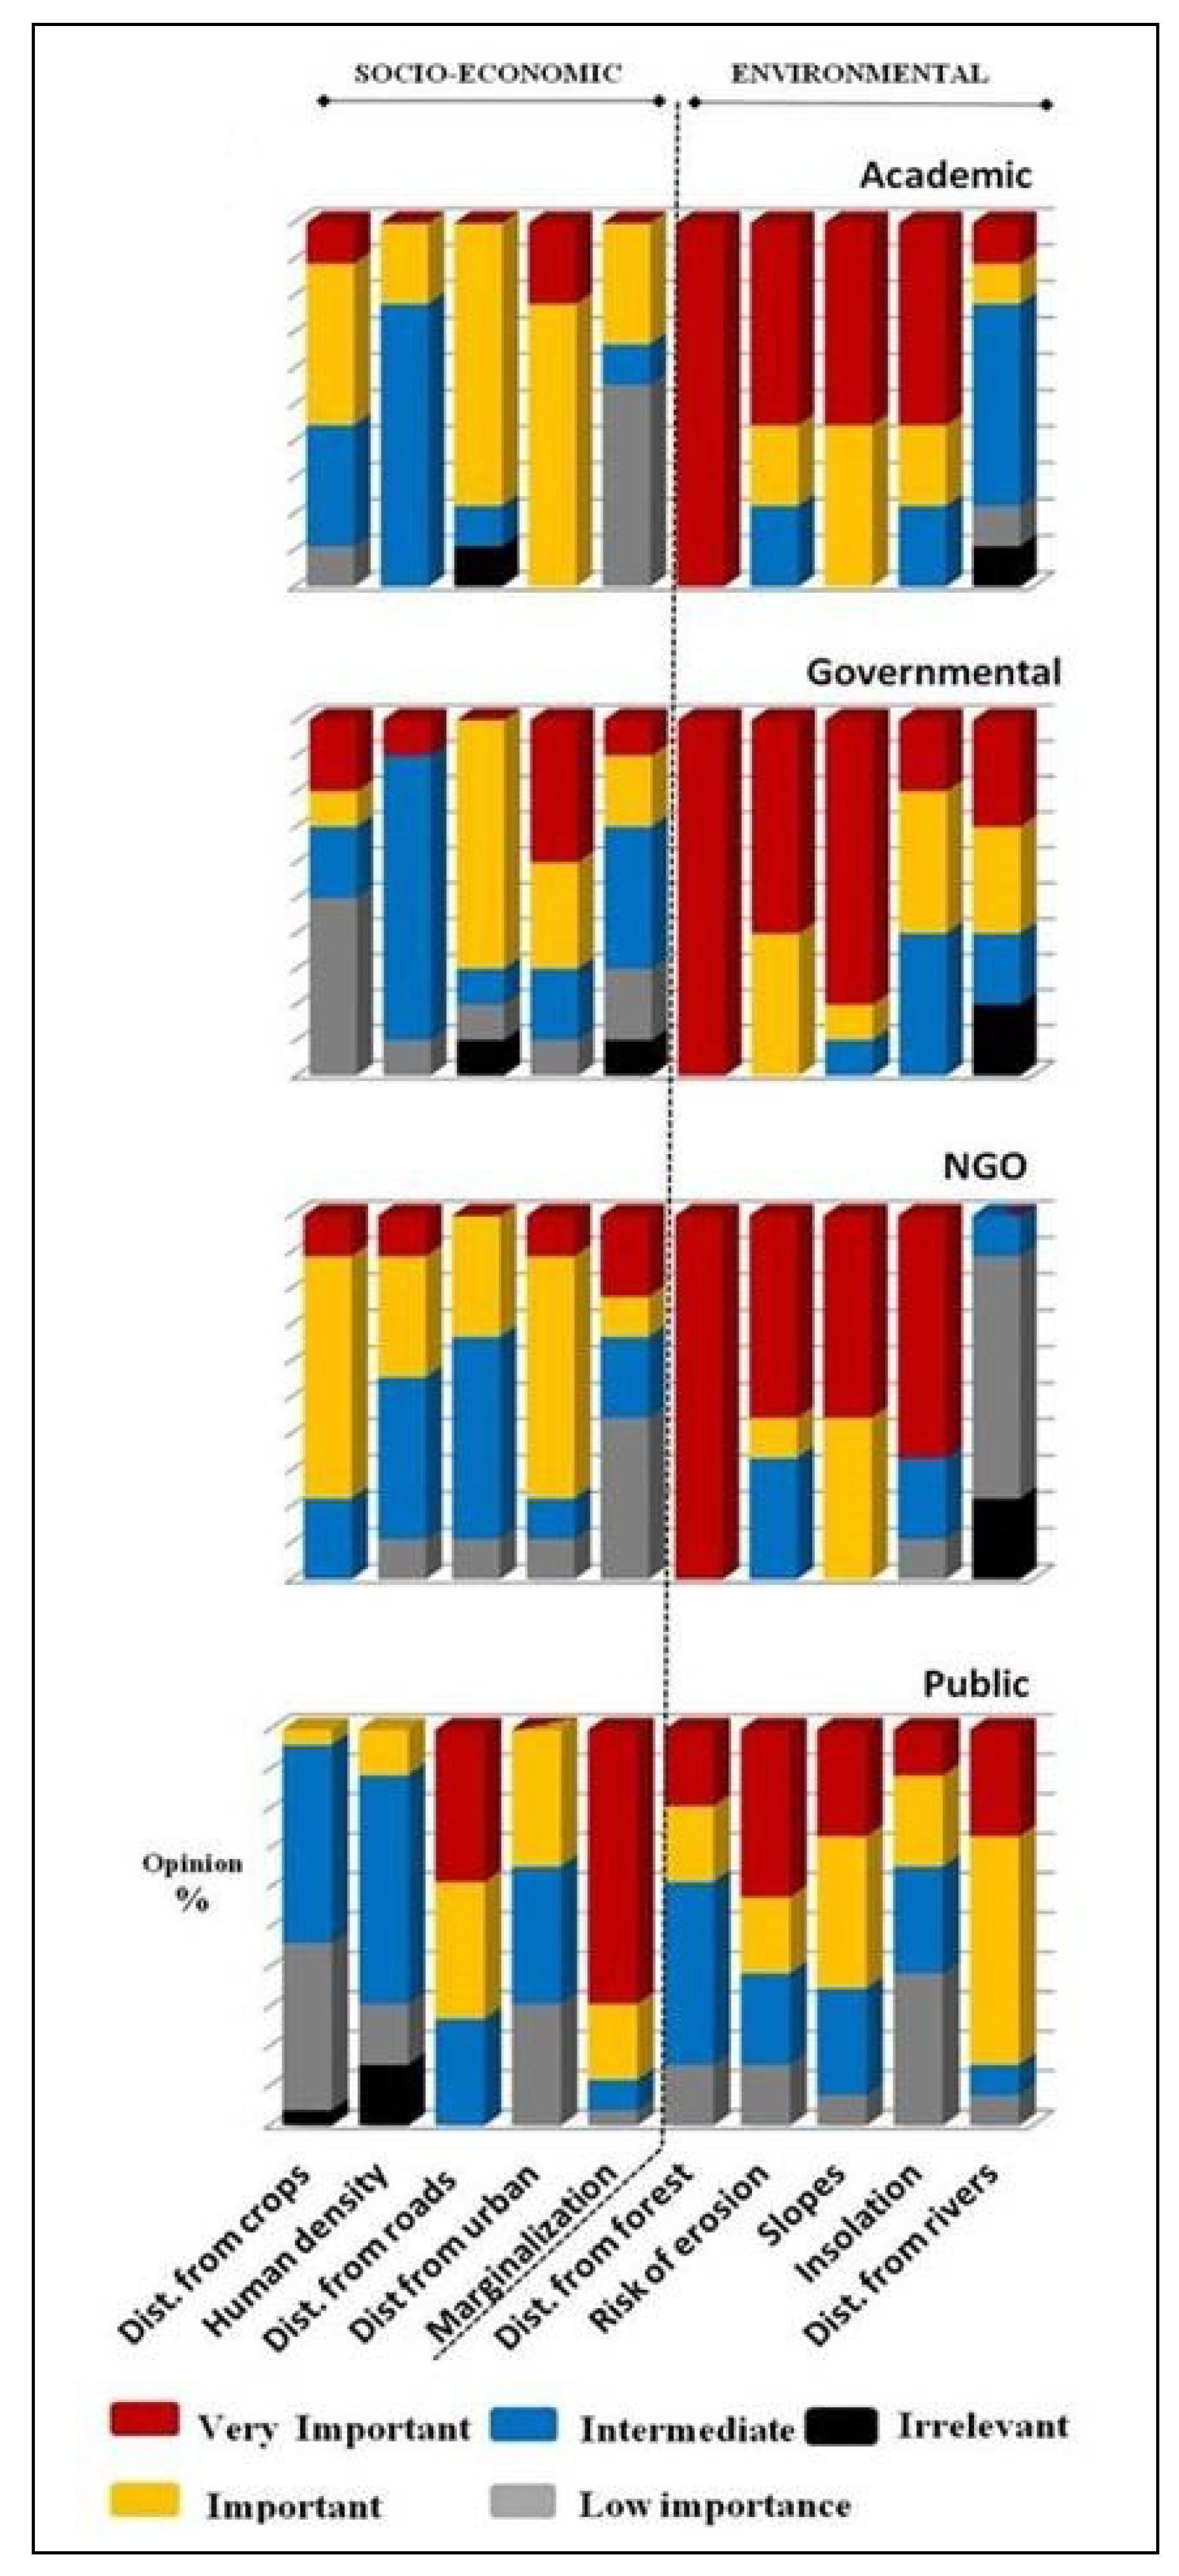
Stakeholders’ answers on the relative importance of criteria (weight) for each group or sector are shown in
Figure 3. Out of all criteria, the “marginalization index” (an index based on the availability of public services and infrastructures) was almost unanimously (
i.e., 90%) considered as a benefit factor, while “distance from forest” received the second highest consensus with 82.5% of participants considering it as a cost factor. On the other extreme, the interpretation of criteria like “distance from rivers” and “risk of erosion” were poorly agreed upon by participants. Regarding weights (
Figure 3), 66% of participants included environmental criteria in categories of “important” and “very important”, while only 46% of them included socioeconomic criteria in the same categories. The criterion “distance from forest” was assumed to be very important by 31 out of 54 participants. Within the public sector, the most important criterion was “index of marginalization” with 18 participants out of 26 rating it as very important.
Table 2.
Criteria ranking, based on the percentage of citation by interviewees.
Table 2.
Criteria ranking, based on the percentage of citation by interviewees.
| Ranking | Criteria | Citation (%) |
|---|
| 1 | Distance from forest | 64.3 |
| 2 | Rate of land use change * | 57.1 |
| 3 | Risk of Erosion | 53.6 |
| 4 | Biodiversity index *, natural corridors * | 46.4 |
| 5 | Slope of terrain (%), rate of deforestation *. | 42.9 |
| 6 | Distance from crops | 39.3 |
| 7 | Human density, Insolation, distance from roads, distance from rivers. | 35.7 |
| 8 | Distance from urban settlements, marginalization index, social capital * | 32.1 |
| 9 | Soil Depth * | 28.6 |
| 10 | Land tenure * | 17.9 |
| 11 | Distance from ANPs, distance from reforested sites | 10.7 |
| 12 | Soil fertility * | 7.1 |
| 13 | Distance from greenhouses, migration rate, forest fragmentation *, humidity, biotype *, presence of pest *, social stability *, precipitation, forest fires *, seed dispersion *, presence of cattle *, biodiversity use *, temperature, elevation above sea level. | 3.6 |
Table 3.
Relevant environmental and socioeconomic criteria selected.
Table 3.
Relevant environmental and socioeconomic criteria selected.
| Dimension | Decision Criteria | Description |
|---|
| Socio-economic | Distance from Crops | Euclidian distance (meters) from existing areas used for agriculture |
| Human density | Number of people per km2. Based on extent of municipal area. |
| Distance from roads | Euclidian distance (meters) from highways, roads and trails. |
| Distance from urban | Euclidian distance (meters) from the existing urban zones. |
| Marginalization index | Summary of nine socio-economic indicators of social exclusion [44]. |
| Environmental | Distance from forest | Euclidian distance (meters) from the existing forest. |
| Risk of erosion | Index of risk for soil erosion per water action. |
| Slope of terrain | Percentage of maximum change in z-value of the surface from each pixel. |
| Insolation | Units of hour-watt per m2 of sun insolation. Calculated for the, summer and winter, solstice and equinox. |
| Distance from rivers | Euclidian distance (meters) from the not intermittent rivers. |
The extent of territory that was analyzed with multicriteria analysis, after removal of areas where forest restoration cannot take place was 11,347.83 km
2 or 97.56% of the total study area. The non- restricted area comprises 283.17 km
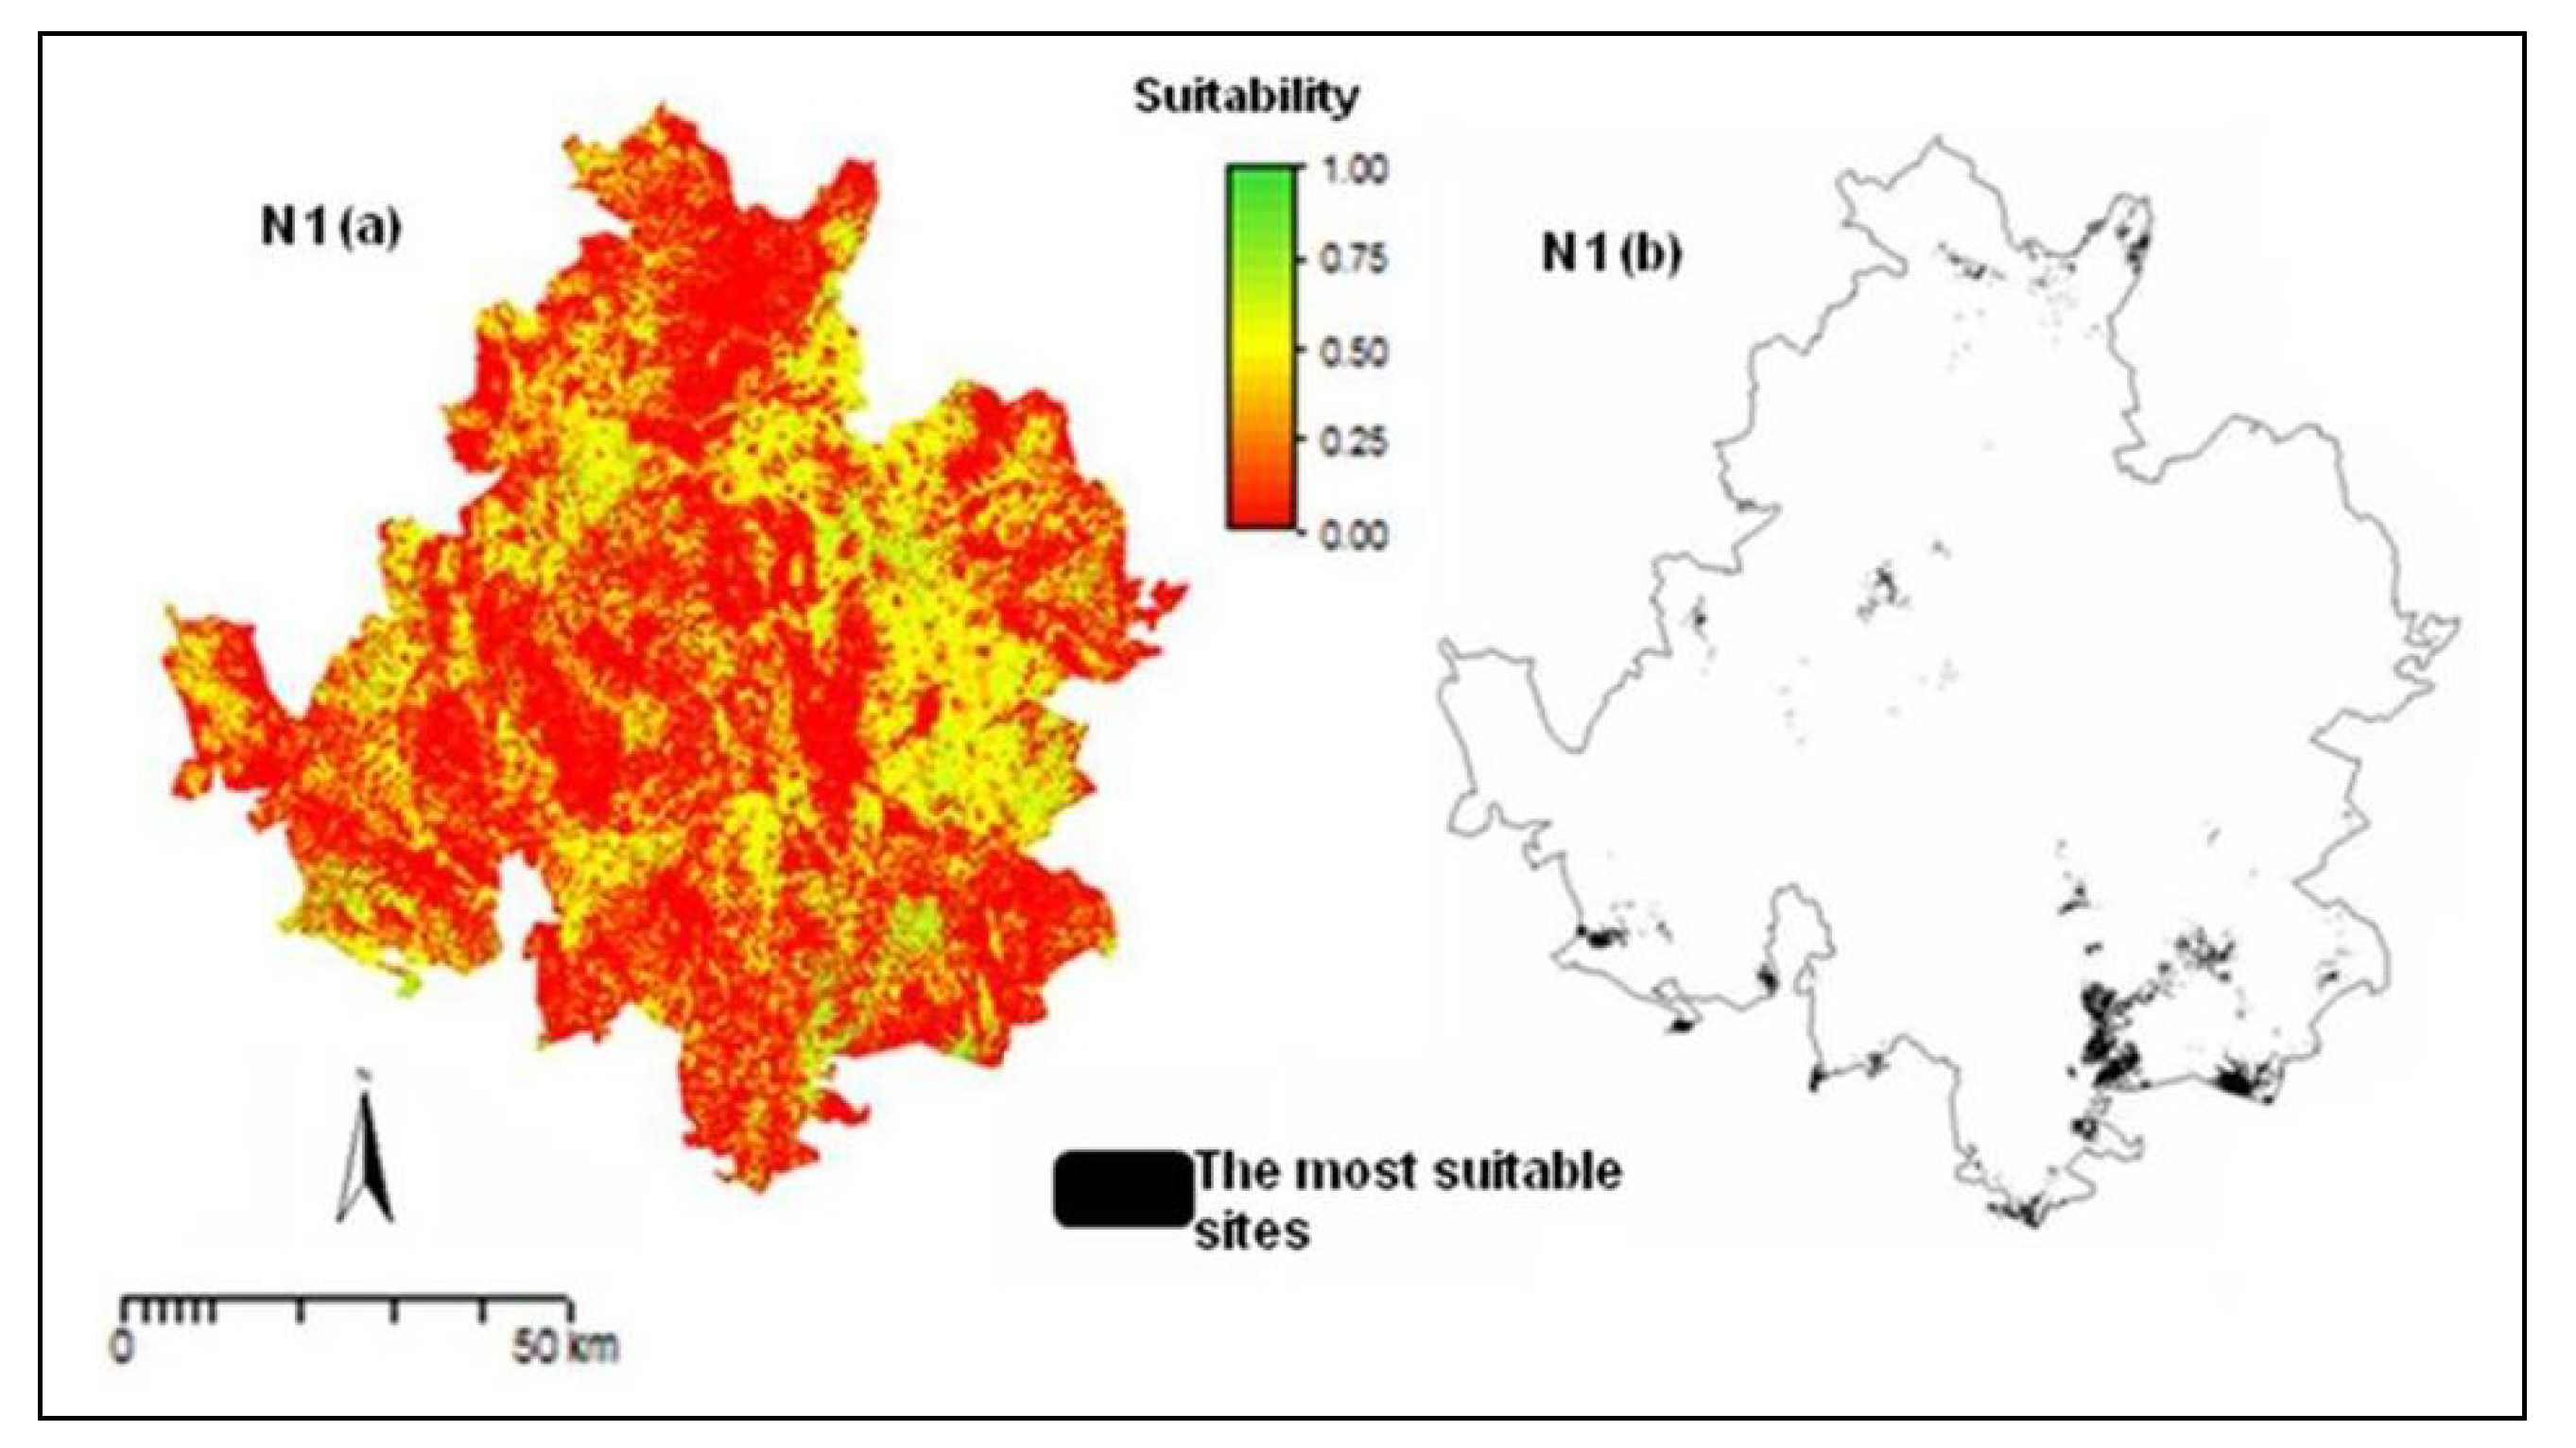
2 or 2.43% of the study area. The range of suitability values of the 54 individual maps generated was between 0.16 and 0.94. The thresholds applied to the suitability values to extract the most preferable areas until reaching the restoration target area ranged between 0.42 and 0.86, with an average of 0.70. The percentage of area selected for restoration option sites was an average of 1.35% of the total area, varying between participant maps in a range of ± 0.5%.
Figure 4 shows an example of results.
Figure 3.
Importance assigned to the socioeconomic and environmental criteria by the four stakeholder groups.
Figure 3.
Importance assigned to the socioeconomic and environmental criteria by the four stakeholder groups.
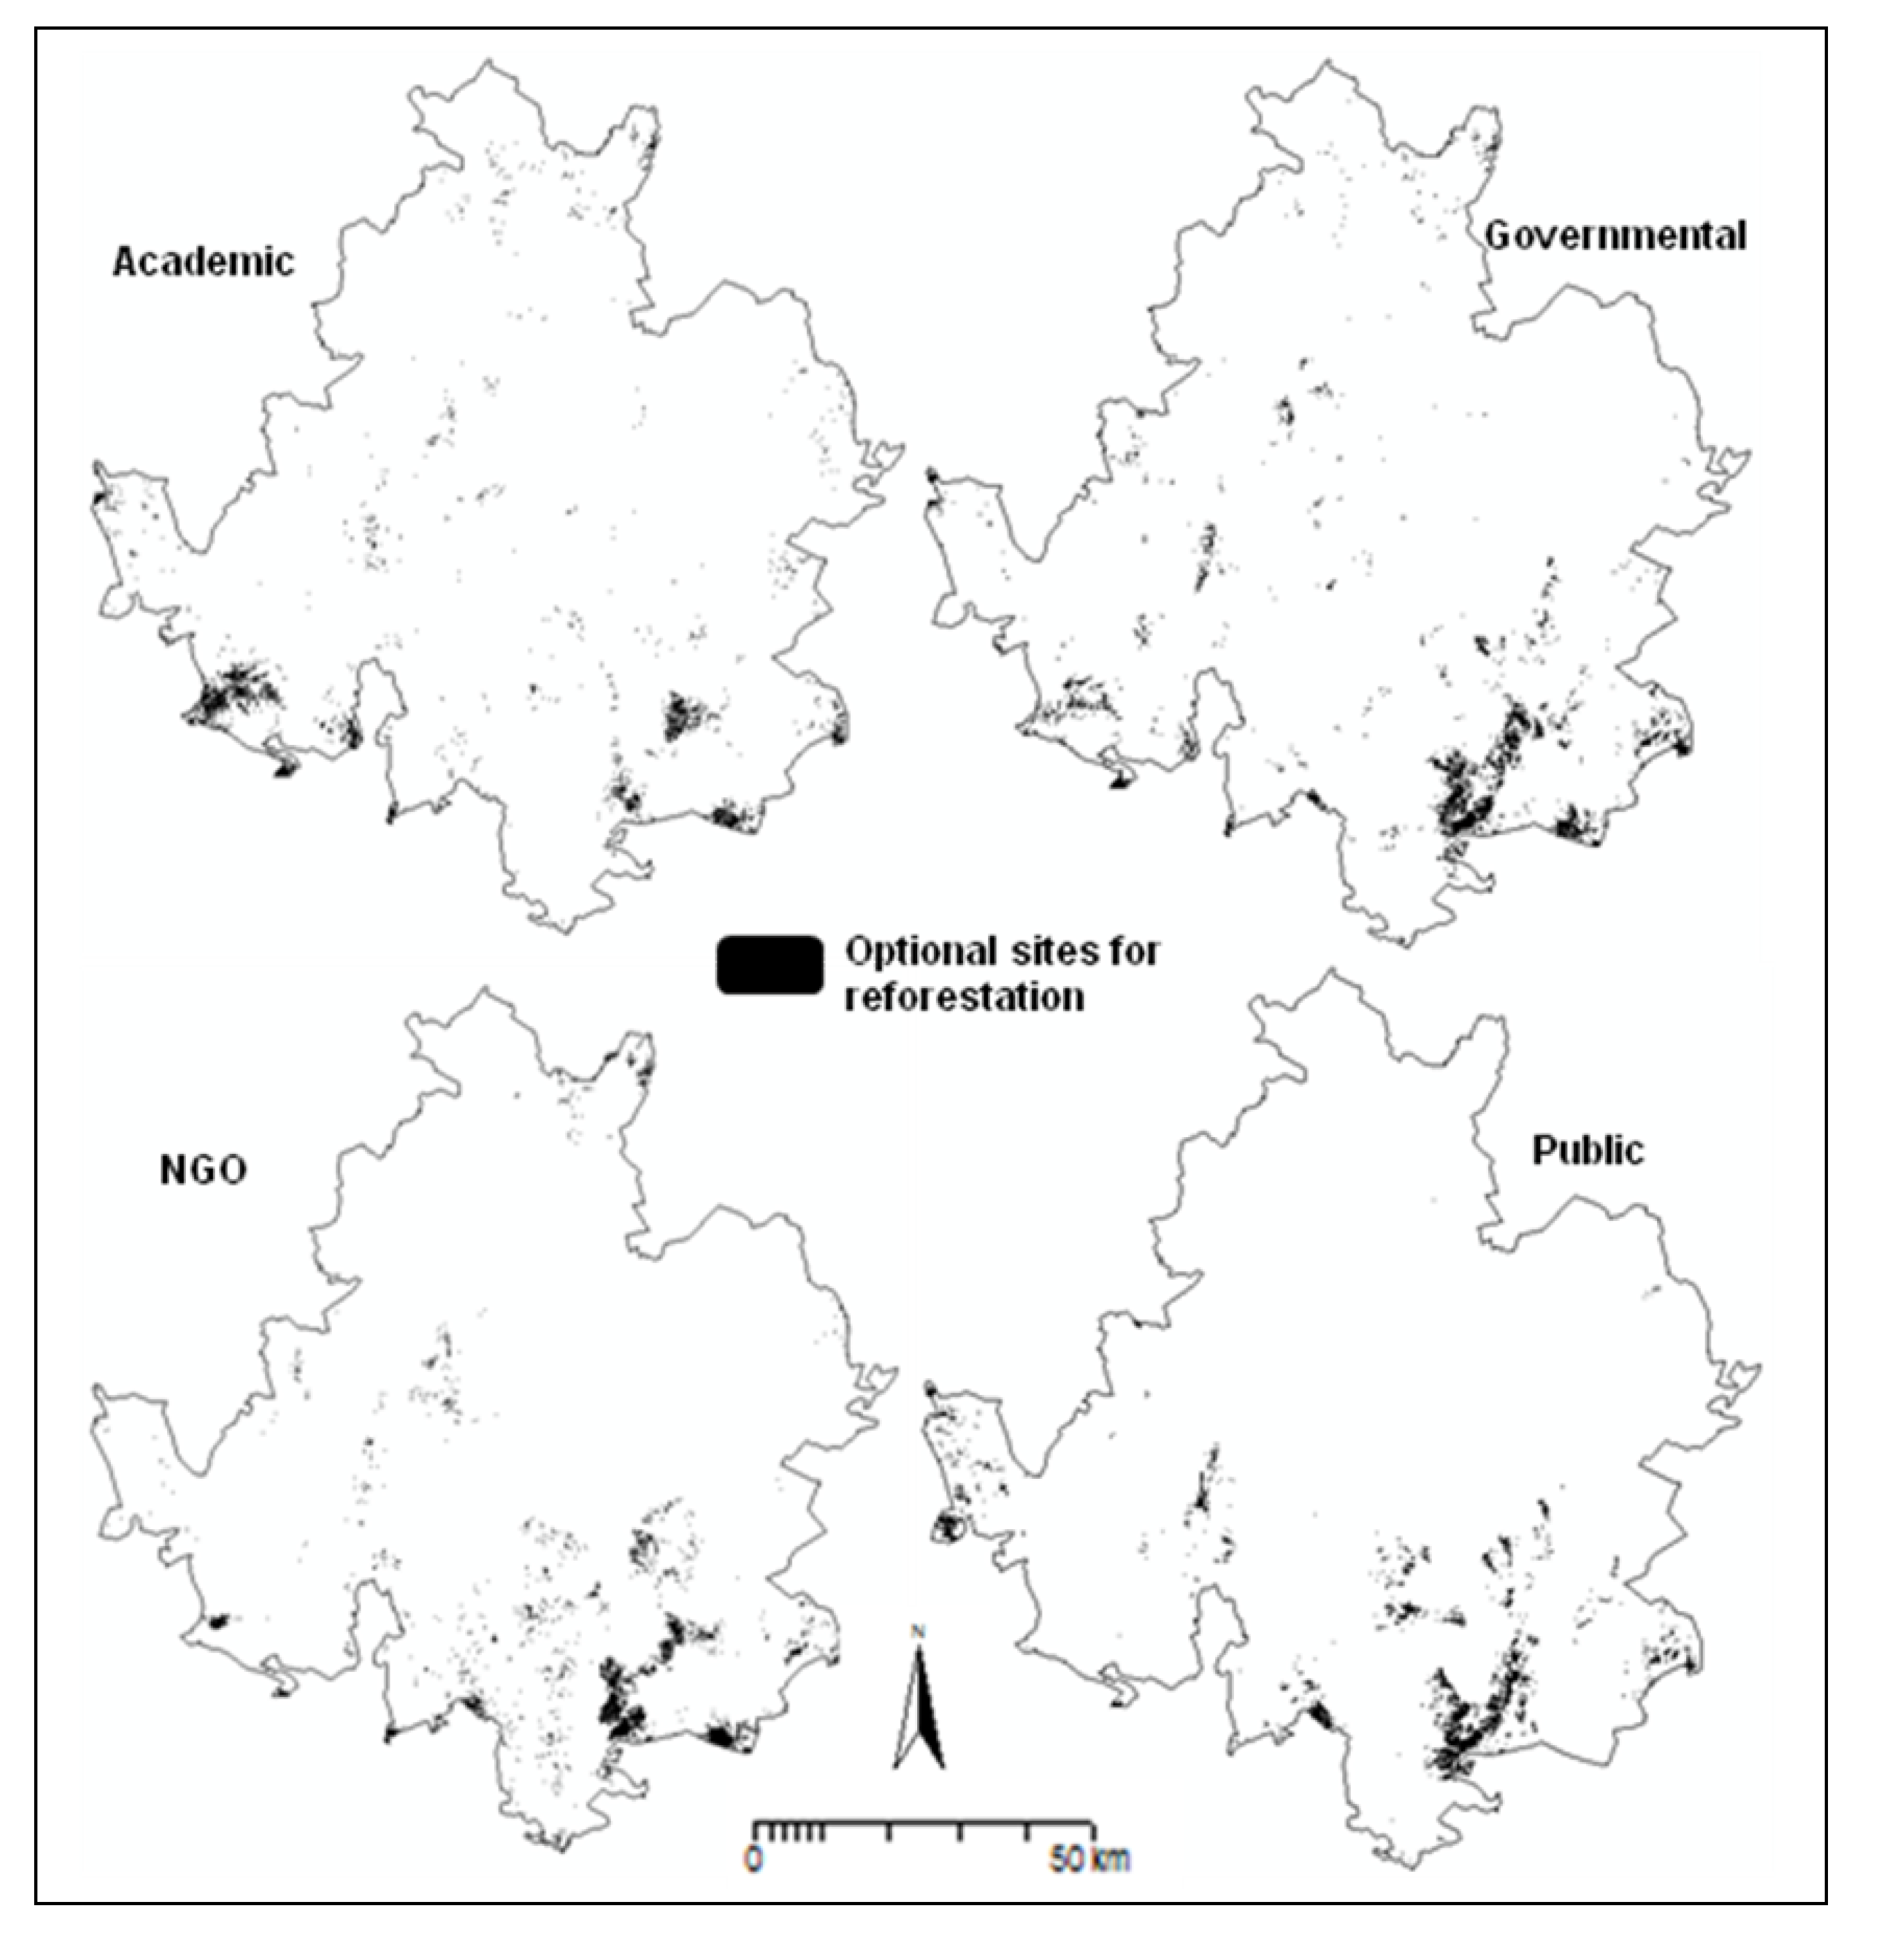
The maps of the most preferred sites generated for each stakeholder groups (
Figure 5) showed that most of these are found in the southern portion of the Upper Mixtec region. This part of the region includes 80% of the most suitable area identified by the academic group, 85% by governmental group, 87% by NGO participants and 97% by the public sector.
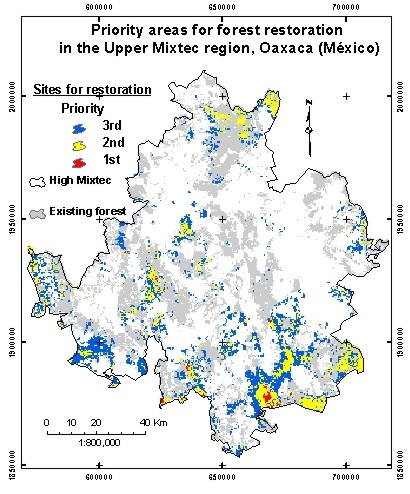
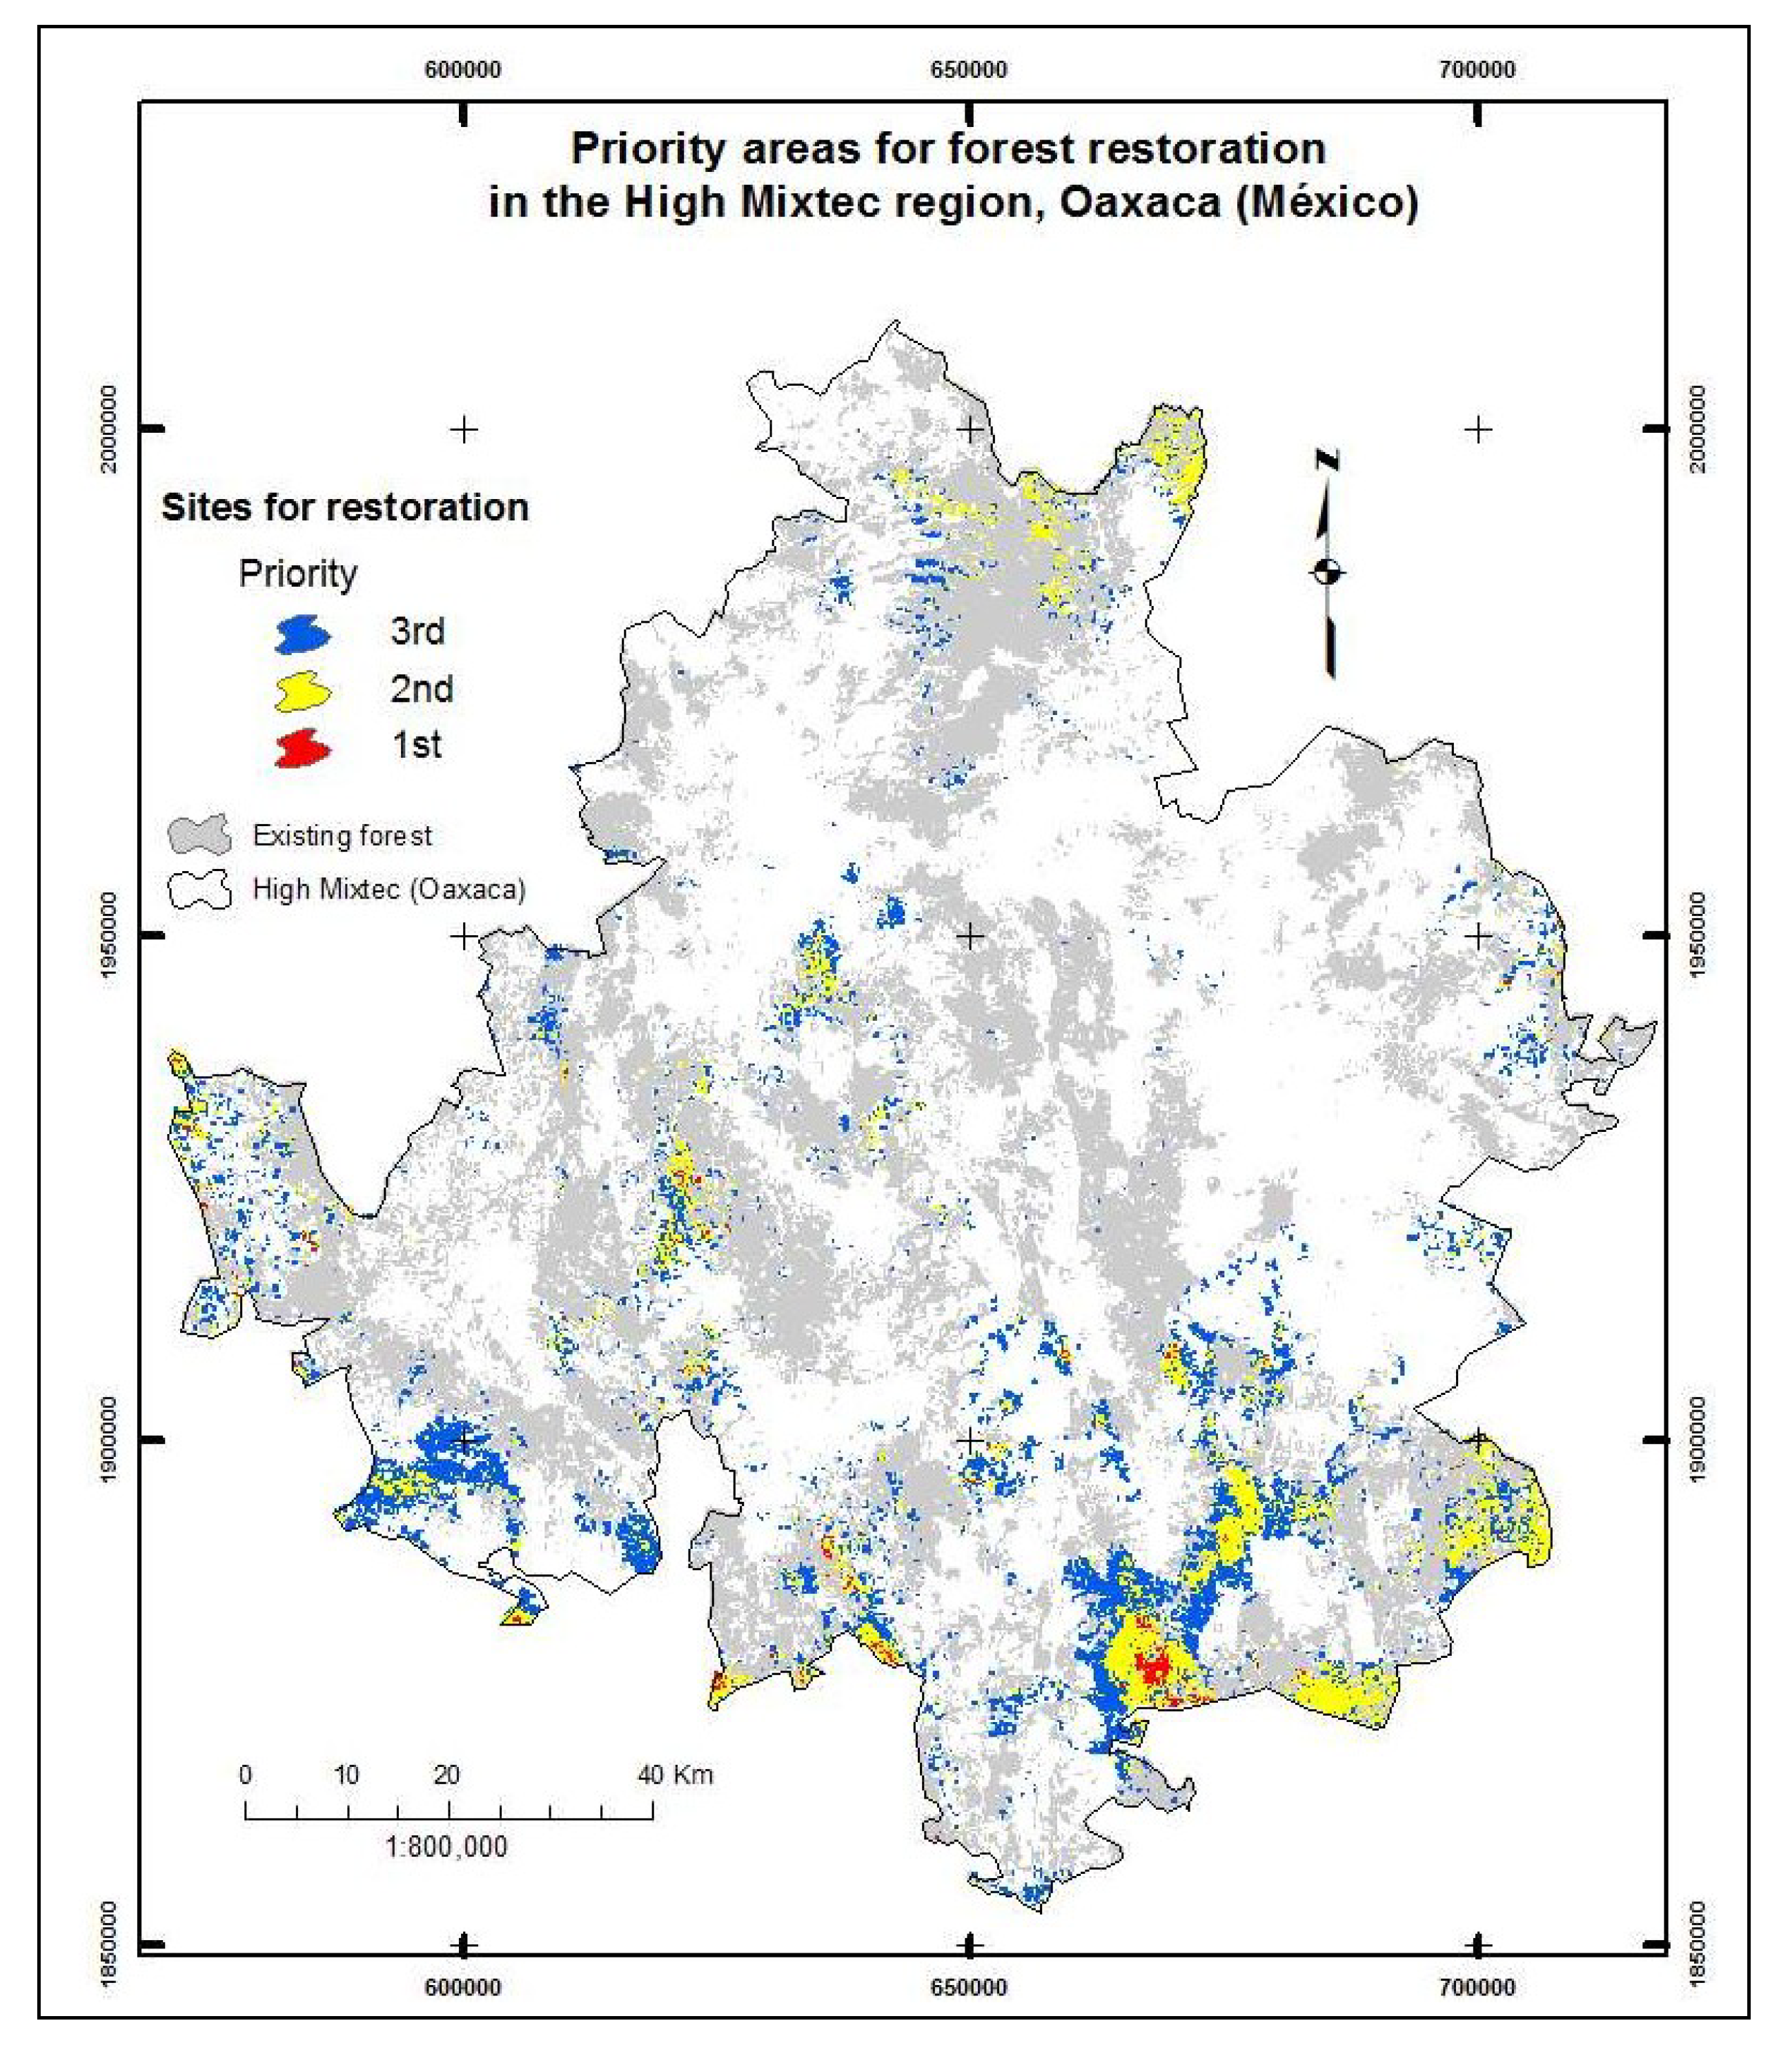
Figure 6 shows the final map of priority areas for Forest Landscape Restoration, obtained combining the opinion of all participants. The overall restoration priority area covers 151.22 km
2 or 1.35% of the study area, in three levels of priority.
Most of this, that is 87.8% of the total, falls in the southeastern part of the Upper Mixtec region. The area with the highest priority (i.e., pixels selected as priority by all sectors or groups of participants) covers 6.804 km2 with 97.7% of these sites located in the south, the area with intermediate priority (i.e., pixels selected as priority by three sectors) covers 52.35 km2 and the area with low priority (i.e., pixels selected as priority by two groups of participants) covers 91.92 km2. Half of the area of highest priority is concentrated within the territory of two municipalities: San Mateo Sinduhi and San Pablo Tijaltepecthe.
Figure 4.
Examples of participant N1 results: (a) suitability map for forest landscape restoration resulted from multicriteria analysis; and (b) map of the most suitable sites that cover the restoration area requirement. N1 is the first stakeholder consulted from the NGO group.
Figure 4.
Examples of participant N1 results: (a) suitability map for forest landscape restoration resulted from multicriteria analysis; and (b) map of the most suitable sites that cover the restoration area requirement. N1 is the first stakeholder consulted from the NGO group.
Figure 5.
Maps of the most preferable restoration areas according to the four stakeholder groups.
Figure 5.
Maps of the most preferable restoration areas according to the four stakeholder groups.
Figure 6.
Map of priority areas for Forest Landscape Restoration in the Upper Mixtec region, Oaxaca (Mexico), as identified by all sectors or groups of participants. The map shows in different colors the areas with different priority level according to the number of sectors that selected them as priority.
FLR is a pragmatic approach [
3,
4]. It was developed in response to the unclear results of traditional efforts of forest restoration, which have been focused mainly on ecological theory, leaving aside the social domain [
45,
46]. However, positive effects of an FLR-based process can only come when stakeholders are actually involved and this may prove particularly complex because value judgments must be integrated in a spatial context [
47,
48,
49]. This study proposes an approach to it that aims to account for the opinion of each stakeholder, while keeping statistical analyses and computational efforts at a minimum.
The proposed approach is based on the idea of generating multiple priority maps, one per participant, and then combining them through identification of areas of concordance (
i.e., pixels identified as priority in several participants’ maps) to obtain a map for each participant group first and a final overall map later. This approach, by excluding the identification of unique sets of value functions and weights, allowed us to minimize the uncertainty intrinsically associated with those. In fact, the resulting maps assign priority for restoration only to those pixels that have high suitability for multiple actors. GIS-based MDCA has the advantage of letting the user deal with multiple criteria, and can include conflicting opinions that describe the decision problem from different angles [
45]. The method proposed here offers a simple yet rigorous way to incorporating different views and automatically generating highly agreed upon results (
i.e., pixels selected are only those for which there is a broad consensus among stakeholders).
Nevertheless, the proposed approach has also various limitations. First of all, the need to keep the process of stakeholder involvement sufficiently straightforward imposed simplifications that have deeply affected the robustness of the analysis. In particular, the assessment of value functions has been oversimplified (
i.e., only trends were considered, not specific values) with negative consequences on the final results in terms of absolute reliability. Second, our results reveal that there is a poor agreement among experts about which criteria should be used for a land assessment to select restoration sites, as already emphasized by Orsi
et al. [
21]. Only three criteria (Distance from forest, rate of land use change, and risk of erosion) were mentioned by more than 50% of the people consulted (
Table 2). Identifying relevant criteria by means of expert opinion should be taken with caution because the expert knowledge can be incomplete, imprecise and value-biased [
30]. Further, even when a set of criteria is eventually agreed upon by stakeholders, this may need to be modified considerably depending on the availability of data for practical application as shown by this study. For this reason, a great amount of effort should be invested in the acquisition, generation, and updating of the information needed for a study.
In fact, the number of criteria and participants to be included is another controversial question. We decided to use the ten more relevant criteria based on a balance between computational load and the need of considering the widest possible range of criteria. While the selection of any number of criteria can be judged as arbitrary, few criteria may lead to the exclusion of important parameters from the analysis and too many criteria may excessively reduce the role of the single criterion and make the evaluation of criteria’s relative importance biased (e.g., establishing the relative importance of 15 criteria may generate issues of consistency in the evaluation). On the other hand, the process to determine the number of participants in a survey suggested by Landeta is based on the error decrease, leaving aside the cost of effort and feasibility. Ianni and Geneletti [
50], and Oliver [
51] present, respectively, a participatory workshop and expert panel approach, as good options to reduce these costs and better manage bias. However, sometimes this is not possible; in our case, those options were not feasible to implement because it would have been impossible to bring stakeholders together from their place of residence because of logistic limitations.


