Article

Analysis of the Influencing Factors on Resettled Farmer’s Satisfaction under the Policy of the Balance between Urban Construction Land Increasing and Rural Construction Land Decreasing: A Case Study of China’s Xinjin County in Chengdu City

1
College of Environment and Resources, Fuzhou University, Fuzhou 350116, China
2
Department of Eco-agriculture and Rural Development, Sichuan Agricultural University, Chengdu 611130, China
*
Author to whom correspondence should be addressed.
These authors contributed equally to this work.
Sustainability 2014, 6(12), 8522-8535; https://doi.org/10.3390/su6128522
Submission received: 13 September 2014 / Revised: 26 October 2014 / Accepted: 17 November 2014 / Published: 26 November 2014

Abstract

:
The purpose of this study is to explore what are the influencing factors on resettled farmer’s satisfaction and occupancy under the policy of the balance between urban construction land increasing and rural construction land decreasing in Xinjin County, Chengdu City. Questionnaires, statistical analysis and logistic regressions were employed. The results indicate that the higher educated farmers will be more satisfied with the relocation areas. An increase in the number of public facilities and the associated maintenance costs will decrease the resettled farmer’s satisfaction. Farmers who have moved to new communities are more satisfied with infrastructure, supporting facilities and property management, especially the living environment. The main tasks completed by farmers are the tillage land and to do work for their new community. The positive factors that contribute to the famer’s satisfaction, include land-rights guarantees, compensation for land consolidation, sewage treatment and the living environment. In contrast, public facilities, commercial service networks and resettled area’s maintenance are negative factors for farmer’s satisfaction. Meanwhile, the key factors to promoting harmony between urban and rural construction are to establish relevant laws and regulations, reasonable operation and management mechanisms, farmer-rights protection mechanisms, and to protect famer household income, as well as to improve agricultural production and farmer’s non-agricultural employment opportunity.

1. Introduction

China has experienced a rapid and far-reaching transition in the past three decades with a mass rural immigration to urban areas [1]. Rapid industrialization and urbanization has produced a phenomenon of village hollowing [1], and has also posed a challenge for urban land use. In 2000, according to the statistical data from the Ministry of Land and Resources of China (MLRC), rural housing land accounted for 67.3% of China’s total construction land and amounted to 165,000 km2 in China [2,3]. In 2006, China’s urban built-up area totaled 33,660 km2, with rural area accounting for the remaining 99.4% of the country [4]. Meanwhile, farmland and rural housing land are treated as the two most important land-use types depicting urban-rural development [5]. The urban-rural-connecting model has been put forward to guarantee healthy and effective development. One of the primary goals of this model is to increase urban construction land by reducing the amount of rural construction land. Namely, the government plans to expropriate rural construction land for urban construction, without changing the quantity or quality of agricultural land areas in the project, so that land can be used more effectively through a sustainable arrangement [6]. In this model, rural construction land that is planned to be reclaimed as tilled land (namely the old plot) is combined with the land planned as urban construction (namely new plot) to form a new-and-old-plot project. Within the new-and-old-plot project, the aim is to stay unchanged for the quantity and quality of agricultural land and total construction area, so that the lands will be used more effectively by a sustainable arrangement [6]. Since the project of urban-rural-connecting model was put forward, the results of each pilot stage were mixed. As one of the first provinces that carried out the Connecting Model Project organized by the MLRC [7], Sichuan province has made an active effort to explore how to balance urban and rural development and construct a new socialist countryside. Such exploration has gathered plentiful experience and formed the unique Build-on-Remove Model within Sichuan, which has been highly appreciated by the MLRC [8]. During 2010, around 1,198,000 square meters of different kinds of buildings were removed in Chengdu, then 2,160,000 square meters of rural communities, with a capacity of 136,644 households, occupancy rate up to 90%, were built [9,10]. Meanwhile, in Xinjin County, one of the key demonstration areas of this policy, 38 rural communities had been built with a population of 57,000 farmers, accounting for 28% of the county’s agricultural population. For outstanding performance in this project, Xinjin County was praised as a Target-Achieving Advanced Unit and has been considered a highlight of rural community construction in the western area [11].
In China, Previous researches on land use transition focused more on village hollowing [1], grain production [12], the sloping land conversion program [13], rural transformation development [12], but little on rural residential areas. In addition, researches on famers’ satisfaction evaluation in rural residential areas mostly depended on social mentality surveys and analysis [14,15,16,17,18]. Nevertheless, the degree of famer satisfaction for rural residential areas is influenced by numerous and varied factors [19,20]. The slowing economic development growth, lack of employment opportunities and unsound essential services are the major factors for low satisfaction in rural areas. Some foreign researchers had proposed the above conclusion, through investigating and researching the resident’s migration in rural areas [21,22,23]. Meanwhile, logistic regression has been widely used in spatial analysis to investigate the influence of driving factors et al. [24,25], but it is rarely used for satisfaction evaluation. Also, it is more characterized by good precision and accuracy, compared with social mentality analysis. For this class of residents, satisfaction surveys can help the government to better understand the real needs and opinions of farmers, strengthening farmers’ trust in government policy, improve the applicability and flexibility of policy, and provide better and more coordinated services to the development of urban and rural areas. This paper, accordingly, aims to contribute to the analysis and critique of famers’ satisfaction degree on rural residential areas in the resettlement areas by the Logistic Analytical Model. The data in this model are from sampling surveys in experimental resettlement areas for Connecting Model Project in Xinjin, Chengdu.

2. Basic Information and Features of the Investigating Area and Respondents

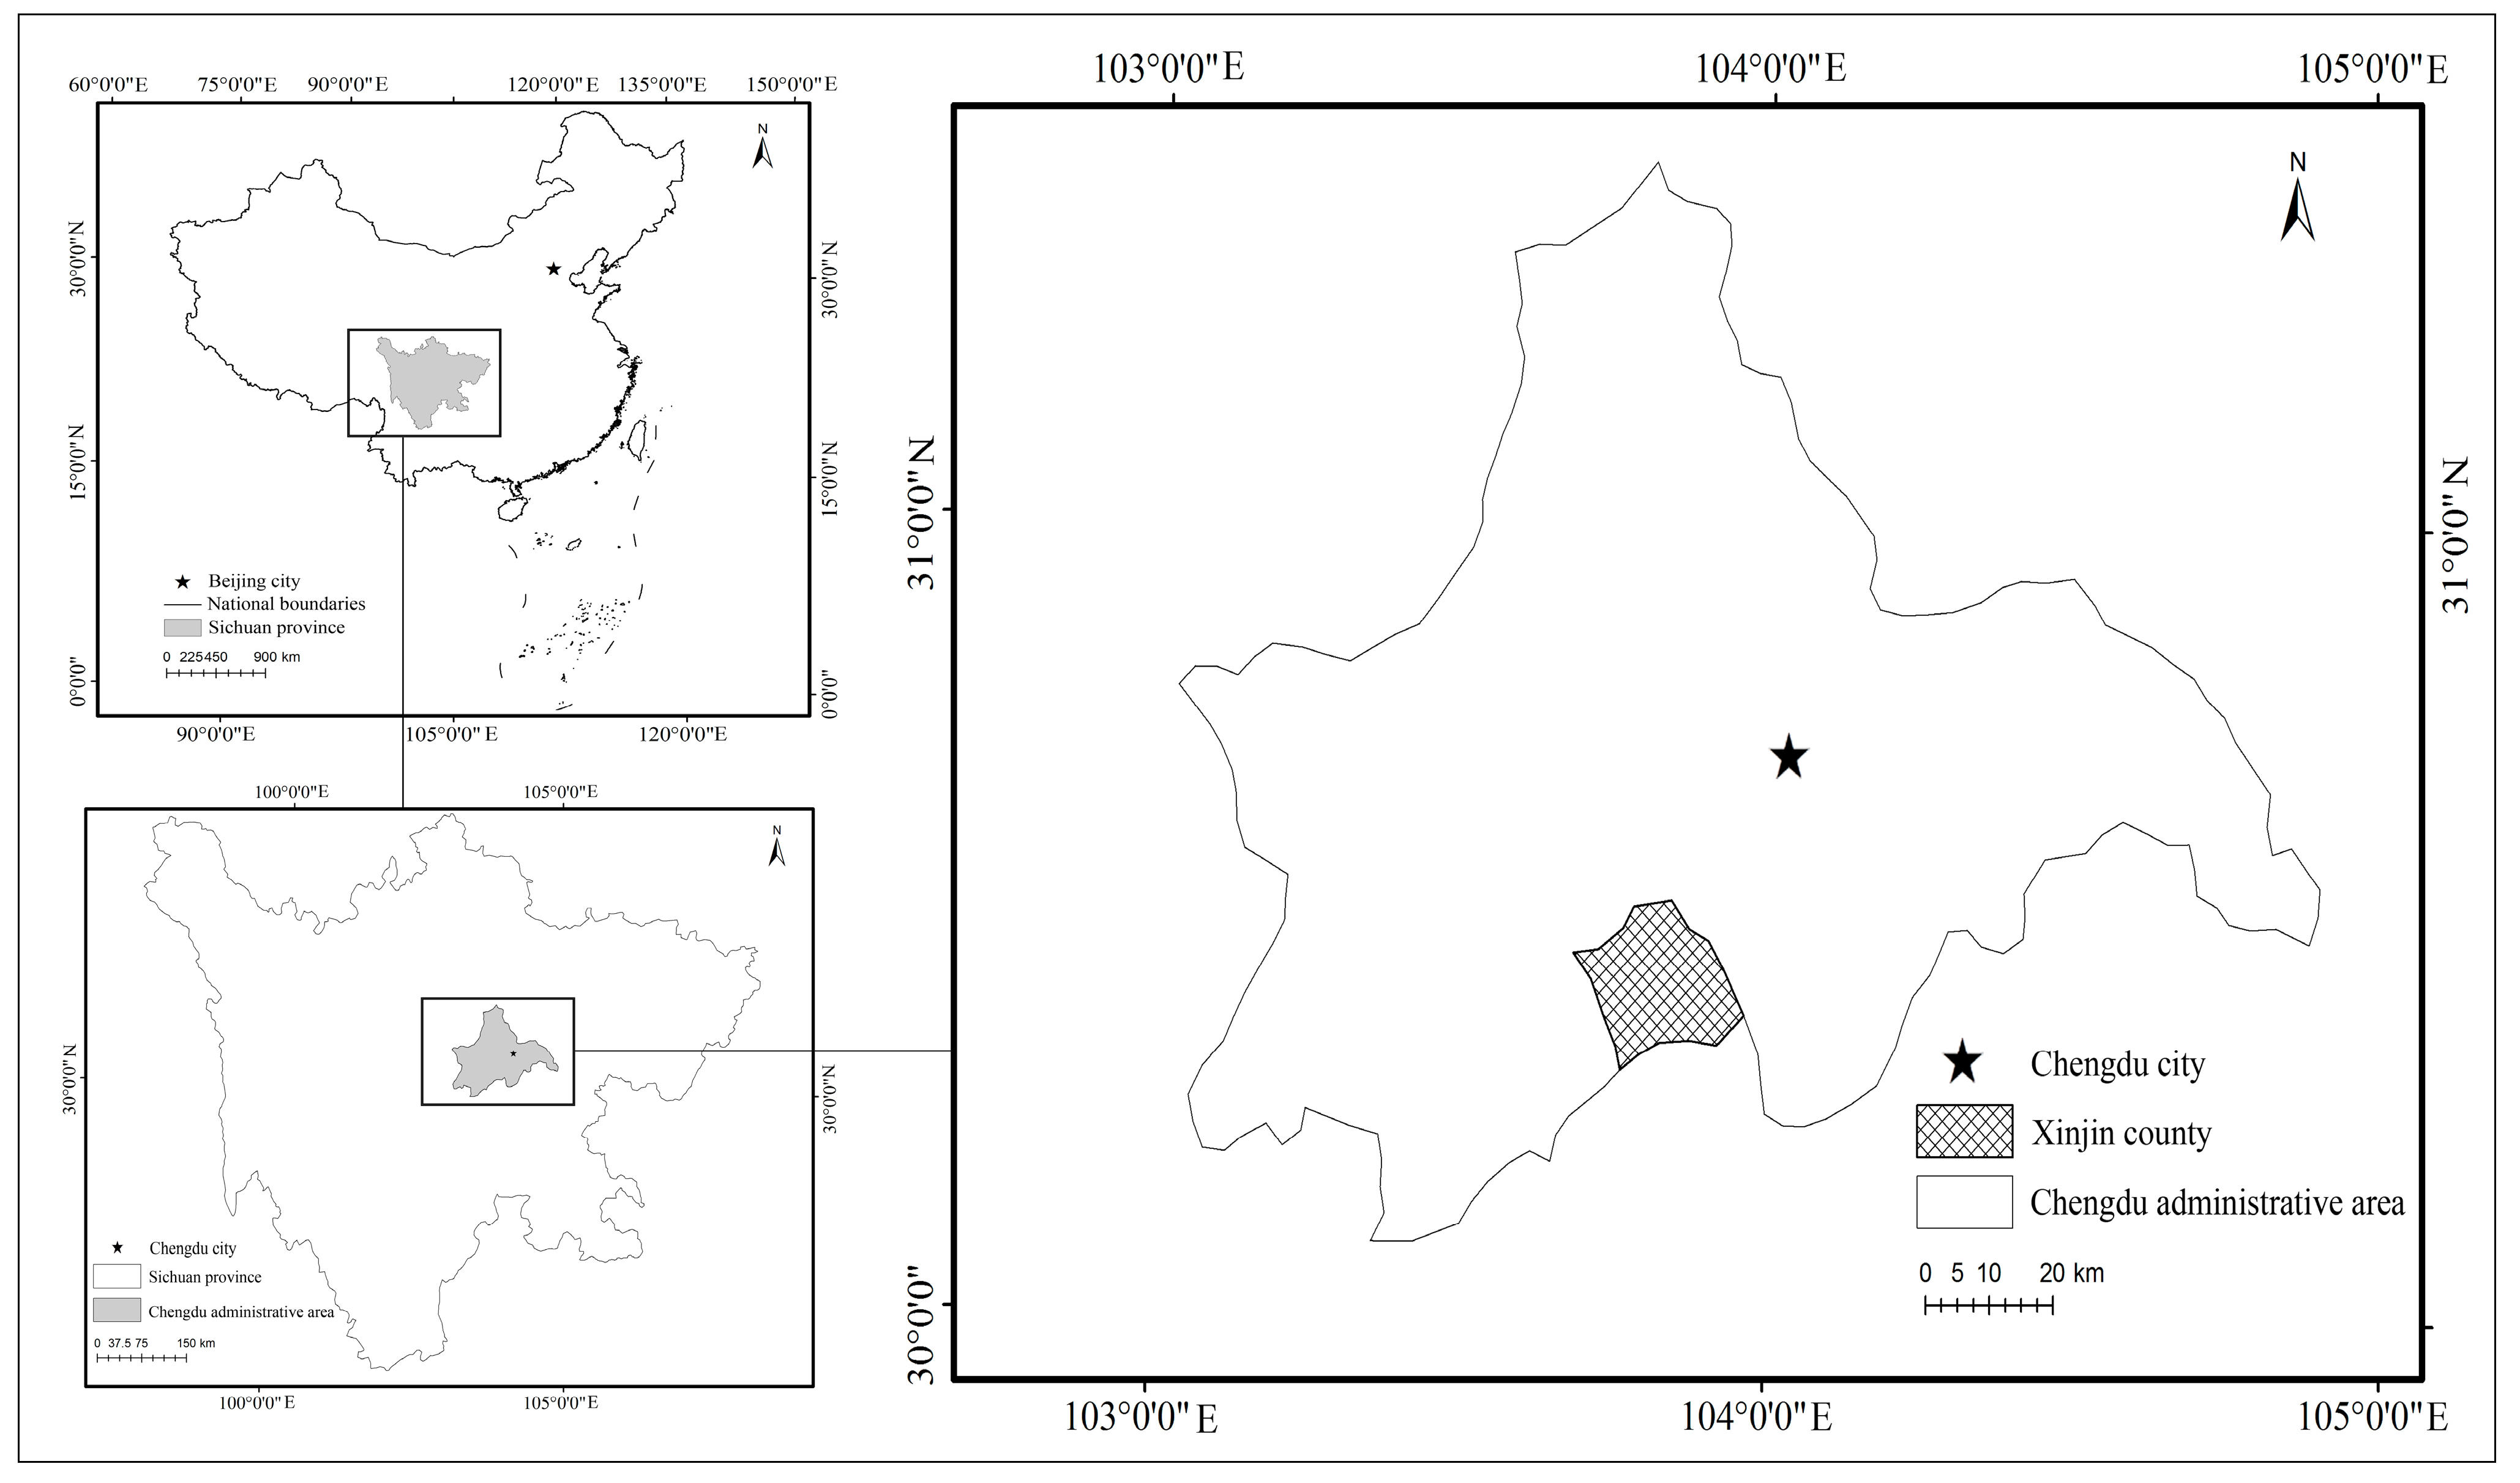
2.1. Basic Information and Features of the Investigating Area and Respondents

Xinjin County lies in the south of Chengdu, in the western part of Sichuan basin. This county, with a population of 306,300, an area of 330 km2, and consists of 11 towns and one village, is an important crossroad and material distribution center in the Western Chengdu Plain [26] (Figure 1).
Figure 1. The location of study area.
Sustainability 06 08522 g001
In the field survey, 240 questionnaires were handed out, among which 223 returned completed, so that the effective rate of the survey was 92.92%. Of these effective responses, 76 returned from Puxing Town (Yuanshan Community), 77 were from Dengshuang Town (Minjiang Community) and 70 were responses from those polled in Xinping Town (Taiping Community), among which Puxing Town (Yuanshan Community) is a provincial-level demonstration. For the representativeness of the survey, farmers in household were set as a unit and household surveys have been carried out.

2.2. Essential Features of the Respondents

To get useful information of the famer households, the respondents were requested to be the main family members of the households of families that had already been moved into the new residential settlement. Age groups of the 223 effective investigation samples were appropriately distributed and among whom 42.24% were male, 57.75% were female. Such distributions could clearly reflect the satisfaction degree. Educational level is also an influencing factor of how farmers are satisfied with the residential settlement. According to this research, the higher the educational level is, the more they’re satisfied with the residential settlement. At the same time, they have more choices when job-hunting, so that the revenue of the family increases. This result exactly corresponds with the conclusion of professors, like Shen Minghao [27]. When choosing jobs, 68.20% of farmers surveyed worked in the field and were peasant-workers, 24.21% of them had no work ability and were not yet employed. Because of the above, 70.32% of the farmer households’ net income per year was below 5000 RMB; among which 47.57% didn’t even reach the level of 2000 RMB (Table 1).
Table 1. Rural households’ basic living statistics.
Essential informationVariable (%)
Floor space (%)
Standard of culture (%)
Under100 m2 (27.29%)
Primary school and under the it (47.62%)
100 to 150 m2 (63.63%)
Junior high school (40.75%)
More than150 m2 (9.08%)
Senior high school (10.32%)
More than senior high school (1.31%)
Family size (%)Under the three persons (19.29%)3 to 4 persons (54.08%)5 to 6 persons (24.32%)More than 6 persons (2.31%)
Time of life (%)18 to 30 years (15.52%)31 to 40 years (24.66%)41 to 50 years (26.27%)51 to 60 years (13.86%)More than 60 years (19.69%)
Family’s net income of year (%)Under the 2000 yuan (47.57%)2000 to 5000 yuan (22.75%)5000 to 10000 yuan (18.25%)10000 to 20000 yuan (9.16%)More than 20000 yuan (2.27%)
Farmers’ works (%)be engaged in agriculture (39.36%)work part-time (28.84%)be engaged in business (3.97%)Working in government or enterprises (1.35%)Working in education or hospital (2.27%)These others (24.21%)
The farmers are satisfied with the policy that floor area for a rural registered permanent residence in the residential settlement should be 35 m2 per person. As informed during the interview, resettlement houses in Puxing Town (Yuanshan Community) were planned by the government and built by famers themselves. The other resettlement houses were planned in the same way, but built by construction companies that succeeded in an open tender bidding system, by attracting investment in which farmers participated with rural construction land as stock or flow. The surveyed spots also show the status as follows.
(1)
Puxing Town (Yuanshan Community)
As this community is a provincial-level demonstration of the Urban-Rural-Connecting Model in Sichuan Province, more attention was placed on the construction in this area. The resettlement allowance there was 6000 RMB per household for the first relocated farmers, and 15,000 RMB per household for the second ones.
(2)
Dengshuang Town (Minjiang Community)
The resettlement allowance payment of Dengshuang Town (Minjiang Community) was 25,000 RMB per unit of area and the farmers’ relocation to the settlement was to occur in three waves. Before the survey was carried out, only the first wave of farmers had been relocated into their new houses and had received their allowance because of the absence of compensation. Contractors would rent the rural land at the price of 1000 RMB per unit of area and 3.2 RMB per kilogram of grain price, and has promised to compensate the farmers at the market price.
(3)
Xinping Town (Taiping Community)
The payment from the contractors for renting the rural land was 600 RMB per unit of area. Meanwhile, the government would compensate the farmers for the agricultural land at about 20,000~30,000 RMB per unit of area on the condition that farmer households pay 300 RMB per square meter to supplement the resettlement construction costs before they moved in.

3. Survey Results and the Logistic Regression Analysis Model

3.1. Modeling in Theory and Variable Designs

According to the conditions in logistic regression modeling with statistical package for the social sciences (SPSS), suppose that P is the probability for something to happen and that xl, x2, x3…… is a group of vectors relative to Y, then when we take the logarithm of P per (1 − P), so that we get log [P per (1 − P)], which is the logistic transformation represented as logic (P) [28,29].
Y = log p 1 p = α + β 1 x 1 + β 2 x 2 + + β n x n
Letter P in the formula above can be the probability, the qualitative variable or a variable with a binary feature. Farmer households’ satisfaction degree with the residential settlement was classified into five levels, which are quite unsatisfied, unsatisfied, satisfied, relatively satisfied and quite satisfied. Given P as the probability that the farmer household is satisfied and that of unsatisfied is “1 − P”. Let α be the constant term, xi are influencing factors of the satisfaction degree, and β is the partial regression coefficient in the logistic regression. Quantitative analysis is taken in the logistic regression and the definitions of variables in this model are stated as below (Table 2).
Table 2. Define model variables.
Influencing factorsVariablesShort-cut processDefining variables
Living conditions of family (X1~X5)Farmers’ income (X1)1~51 = very dissatisfied; 2 = dissatisfied; 3 = general; 4 = satisfied; 5 = very satisfied
Farmers’ employment status (X2)1~51 = very dissatisfied; 2 = dissatisfied; 3 = general; 4 = satisfied; 5 = very satisfied
Building quality (X3)1~51 = enormous implications; 3 = a little influence; 5 = make no difference
The electricity/gas/water supply (X4)1~51 = very dissatisfied; 2 = dissatisfied; 3 = general; 4 = satisfied; 5 = very satisfied
Traditional festivals (X5)1~51 = enormous implications; 3 = a little influence; 5 = make no difference
Government policies (X6~X11)The p-values of land rights guarantee (X6)1~51 = very dissatisfied; 2 = dissatisfied; 3 = general; 4 = satisfied; 5 = very satisfied
The p-values of land consolidation compensation (X7)1~51 = very dissatisfied; 2 = dissatisfied; 3 = general; 4 = satisfied; 5 = very satisfied
Information on land consolidation (X8)1~51 = No publication; 3 = occasional publication; 5 = frequent publication
The factor of employment channels (X9)1~51 = not helpful at all; 3 = somewhat helpful; 5 = very helpful
Use of farmland hire (X10)1~51 = barely understood; 2 = don’t know much; 3 = general; 4 = know a little bit; 5 = fully understand
Housing’s soft terms (X11)1~51 = very dissatisfied; 2 = dissatisfied; 3 = general; 4 = satisfied; 5 = very satisfied
Communalfacilities (X12~X16)Rural infrastructure (X12)1~51 = very bad; 2 = not so well; 3 = general; 4 = good; 5 = very good
Means of transportation (X13)1~51 = high inconvenience; 2 = a little inconvenience; 3 = general; 4 = a little convenience; 5 = very convenience
Public facilities (X14)1~51 = very dissatisfied; 2 = dissatisfied; 3 = general; 4 = satisfied; 5 = very satisfied
The business service of network system (X15)1~51 = very inconvenience; 2 = a little inconvenience; 3 = general; 4 = a little convenience; 5 = very convenience
Safety installation (X16)1~51 = existence; 3 = dimness; 5 = nonexistant
Property management (X17~X19)The relocation areas maintenance (X17)1~51 = bad; 3 = general; 5 = good
Social security (X18)1~51 = very dissatisfied; 2 = dissatisfied; 3 = general; 4 =satisfied; 5 = very satisfied
Property management fee (X19)1~51 = very dissatisfied; 2 = dissatisfied; 3 = general; 4 =satisfied; 5 = very satisfied
Ecological and environmental quality (X20~X22)Sewage treatment (X20)1~51 = enormous implications; 3 = a little influence; 5 = no influence
Environmental sanitation (X21)1~51 = very bad; 2 = not so well; 3 = general; 4 = a little good; 5 = very good
Living conditions (X22)1~51 = very dissatisfied; 2 = dissatisfied; 3 = general; 4 = satisfied; 5 = very satisfied

3.2. Alpha Reliability Analysis of the Variables

In order to test the stability of variables, Alpha reliability of the influencing factors in Chart 2 was tested through SPSS. The Cronbach’s Alpha of each influencing factors are as follows; the Alpha of living condition is 0.631, government policy is 0.707, public facilities in the residential area is 0.287, estate management is 0.590 and the location’s environment is 0.428. Although the Cronbach’s Alpha of public facilities, estate management and the location’s environment are below 0.6, the overall reliability of these variables from questionnaires is relatively high for the Conbach’s Alpha of overall influencing factor is 0.849.
Table 3. Variables’ reliability analysis.
Influencing factorsCronbach’s AlphaCronbach’s Alpha based on standardized ItemsN of Items
Living conditions of family0.6310.6285
Government policies0.7070.7136
Communalfacilities0.2870.4375
Property management0.5900.5963
Ecological and environmental quality0.4280.4803
Constant0.8490.84622

3.3. Operation Results from Logistic Regression Model

Using the data from the effective questionnaires, logistic regression analysis of the influencing factors in Chart 2 is taken. In this analysis, 22 variables are introduced to analyze the factors influencing satisfaction degree. Farmers’ satisfaction degree were given numerical values (quite unsatisfied = 1, unsatisfied = 2, satisfied = 3, relatively satisfied = 4, quite satisfied = 5) and we get the influencing factors’ regression coefficient valuations are as shown as Table 4.
Variables are introduced into the logistic regression model according to their definitions to test statistical significance of each variable. In this way, final statistical results of factors influencing farmers’ satisfaction degree are figured out with each p-value (sig.) as Table 4. The p-values of land rights guarantee (X6), and that of business service network systems (X15), are statistically significant at the 0.01 level. The p-values of land consolidation compensation (X7), public facilities (X14), the relocation area maintenance (X17), sewage treatment (X20) and living conditions (X22) are statistically significant at the 0.05 level. The other variables do not show statistical significance.
Table 4. Variables in the equation of logistic model.
VariablesRegression coefficient (B)S.E.WalddfP (sig.)Exp (B)
Farmers’ income (X1)–0.1980.3650.29510.5870.820
Farmers’ employment status (X2)–0.0180.3810.00210.9620.982
Building quality (X3)–0.1980.1931.04610.3060.820
The electricity/gas/water supply (X4)0.1250.3060.16610.6841.133
Traditional festivals (X5)0.8040.5102.48410.1152.235
The p-values of land rights guarantee (X6)1.118 **0.34710.36510.0013.058
The p-values of land consolidation compensation (X7)0.910 *0.4005.17010.0232.484
Information of land consolidation (X8)0.1240.2330.28310.5951.132
The factor of employment channels (X9)0.5750.3193.24310.0721.777
Use of farmland hire (X10)0.1160.1980.34410.5571.123
Housing’s soft terms (X11)0.2320.3550.42810.5131.262
Rural infrastructure (X12)0.0430.3220.01810.8941.044
Means of transportation (X13)–0.2930.3190.84710.3570.746
Public facilities (X14)–1.362 *0.5985.19210.0230.256
The business service Network system (X15)–1.151 **0.4426.78610.0090.316
Safety installation (X16)–0.1100.1810.37010.5430.896
The relocation areas maintenance (X17)–0.611 *0.2685.18510.0230.543
Social security (X18)0.4070.2862.02510.1551.503
Property management fee (X19)0.3500.2691.69410.1931.419
Sewage treatment (X20)0.521 *0.2633.93110.0471.683
Environmental sanitation (X21)0.2840.4930.33210.5651.328
Living conditions (X22)1.547 *0.6535.62010.0184.697
Constant–7.7923.0876.37210.0120.000
Variable (s) entered on step 1: Nagelkerke R2 = 0.652, Cox & Snell R2 = 0.488, –2 Log likelihood = 159.131; the “*” presentation parameter estimates changed by less than 0.05; the“**” presentation parameter estimates changed by less than 0.01.

3.4. Partial Correlation Analyses of Variables

Statistics of the 22 variables in the logistic regression model show that there are still 15 variables that are statistically insignificant. In order to minimize the influence from the variables’ relativity, the Partial correlation method in SPSS is taken to control these 15 variables and estimated correlation between land rights guarantee (X6), land consolidation compensation (X7), public facilities (X14), business service network system (X15), the relocation areas maintenance (X17), sewage treatment (X20) and living conditions (X22).
Table 5. Variables analysis of partial correlation.
Control variablesVariblesCorrelation SignificanceInfluencing factors
Land rights guarantee (X6)Land consolidation compensation (X7)Public facilities (X14)Business service network system (X15)The relocation areas maintenance (X17)sewage treatment (X20)Living conditions (X22)
X1, X2, X3, X4, X5, X8, X9, X10, X11, X12, X13, X16, X18, X19, X21Land rights guarantee (X6)Correlation
Significance (2-tailed) df
1.000

0
land consolidation compensation (X7)Correlation
Significance (2-tailed) df
0.369 **
0.000
206
1.000

0
Public facilities (X14)Correlation
Significance (2-tailed) df
–0.102
0.143
206
0.000
1.000
206
1.000

0
Business service network system (X15)Correlation
Significance (2-tailed) df
–0.108
0.119
206
–0.041
0.558
206
0.015
0.829
206
1.000

0
the relocation areas maintenance (X17)Correlation
Significance (2-tailed) df
0.107
0.126
206
–0.026
0.711
206
–0.006
0.935
206
–0.036
0.609
206
1.000

0
Sewage treatment (X20)Correlation
Significance (2-tailed) df
0.038
0.582
206
0.028
0.619
206
–0.002
0.973
206
–0.151
0.029
206
0.257 **
0.000
206
1.000

0
living conditions (X22)Correlation
Significance (2-tailed) df
–0.086
0.219
206
0.086
0.214
206
0.483**
0.000
206
0.021
0.768
206
0.025
0.724
206
0.088
0.204
206
1.000

0
The “**” presentation parameter estimates changed by less than 0.01.
After controlling the relativity between the 15 variables in the logistic regression model, the conclusions are as follows. (1) Although probabilities of the three relativities between land rights guarantee (X6) and land consolidation compensation (X7); public facilities (X14) and living conditions (X22); the relocation areas maintenance (X17) and sewage treatment (X20) are all below 1‰, the relativity between these three groups of variables are relatively low because of their low correlation coefficient of 0.369, 0.483 and 0.257, respectively. (2) The significance of business service network systems (X15) and sewage treatment (X20) is relatively low despite their statistical significance.

3.5. Analysis of Factors Influencing Satisfaction Degrees

By logistic regression modeling, the 22 variables are fitted and the results are stated below. On the one hand, the positive factors in this model include land rights guarantee, land consolidation compensation, sewage treatment and living environment. On the other hand, the negative factors influencing satisfaction degree include public facilities, business service network systems and the relocation areas maintenance. Which means, the more farmers’ land rights are guaranteed, land consolidation are paid, sewage is cleaned and the living environment is improved, the more farmers are satisfied with the residential settlement. In this way, the more public facilities are set, business service networks are established and the relocation areas maintenance are carried out, the lower the satisfaction degree. With partial correlation method, factors influencing farmers’ satisfaction are analyzed as below. The probability that there is no correlation between land rights guarantee and land consolidation compensation, public facilities and living environment, relocation areas maintenance is below 1‰ (Table 3). However, due to the low correlation coefficient, the influence on the operation result in the logistic regression model is relatively faint.
The degrees of influences from the factors are not the same according to the logistic regression coefficient.
Firstly, the most essential positive factor is the living environment and the one that makes the worst effect on satisfaction degree is public facilities with a β of −1.362 (Table 4). There are two reasons for that. The first one is the increasing requirement for the quality of living conditions due to the background of new a socialist countryside. The second reason is that cutting off of water and electricity supply has a great effect on farmers’ life and their residential condition. All in all, improvement of living conditions in the residential areas plays an important role in raising the satisfaction degree.
Secondly, the farmers are highly concerned with land rights guarantees and land consolidation compensation. These two factors also make much effect on the farmers’ satisfaction degree following only their living conditions. According to the household surveys, most farmers are satisfied with the consolidation and reclamation of rural construction land. However, due to the collection of the rural construction land consolidation index and the slow progression in rural land consolidation, farmers are not very satisfied with the land consolidation compensation. So, farmer households pay much attention to getting more compensation to support their family and invest in business operations. These research conclusions are consistent with Zhong’s research [31].
Thirdly, the positive factor with the least effect on farmers’ satisfaction comes from sewage treatment with a β-value of 0.521 (Table 4). The relocation areas maintenance is negatively relative with the farmers’ satisfaction. It is obvious that the more maintenance happens, the more fees exist. According to the household survey, governments provide the fees for sewage and maintenance, and the fees beyond the first five years may come from the residents themselves. This may be one of the reasons that maintenance has a negative effect on the satisfaction degree in the angle of time.
Fourthly, business service network is one of the negative influencing factors. Which means, the more business service networks there are, the lower the degree of farmer satisfaction. The result of household interviews show that most residents still mostly subsist on the food planted and stored by them and the family income can only support the basic expenses. Therefore, too many business service networks have nothing to do with expanding their consumption ability.
Fifthly, the results of the logistic regression show that the factor of employment channels (X9) has a significance level of around 0.05. However, most farmers have been used to this because that this factors depends much on market mechanisms and the environment of social economy, so this has little effect on the farmers’ satisfaction degree. All other influencing factors do not show much statistical significance.

4. Conclusions

It is a full affirmation that the country authorized Chengdu to plan and carry out the city and countryside synthesis coordinated reforms for finding the new breakthrough of China’s land reforms. As a national city and countryside coordinated reform pilot area, Chengdu has been actively exploring the coordination of urban and rural development space and optimizing urban and rural land-use, structure and layout. At the same time, Chengdu also pays much attention to the reasonable allocation of land resources in villages to relieve urban and rural land-use of the contradictory supply and demand of urban and rural integration of space development. However, all the achievements are just the beginning of the urban and rural construction land connection and many pilot projects are still under construction. Therefore, the first pilot areas were chosen as the site of study to research, explore and test a theory on the factors influencing degree of satisfaction of farmers. The results show the following: (1) Farmer households are relatively satisfied with the basic facilities and estate management in the residential settlement. They are most satisfied with the living environment in the resettlement areas. However, because of the short time since the plan of work, consideration of their family income is still not enough. So the farmers’ domestic economic situation is still an unsolved problem; (2) When adjusting the ownership of rural construction land, farmers’ land may decrease, lose or suffer from profit loss because of the variable position regarding cropland responsibility. In order to solve these problems, the sum of compensation should be raised and there should be more supervision so that farmers’ land rights and interests will be protected; (3) Farmer households’ wishes should be respected in land consolidation, so that their social and economic benefits will be fully protected and their satisfaction degree will be raised.
Consequently, it is still of strategic significance to pay attention to farmers’ long-term position through guaranteed land rights [30], improving the agricultural industry and farmers’ non-agricultural employment, protecting land ownership by legislation and promoting the rational use of the land [31,32,33]. Not only whether the respondents are satisfied should be considered, but also what are the factors that may influence the satisfaction degree should also be studied, such as the farmers’ employment and income. This research may be particular and limited because the conclusions are based on three towns in Xinjin, Chengdu, where the Connecting Model is constructed.

Acknowledgments

The authors wish to acknowledge research funding provided by National Social Science Foundation of China (12CJL063) and Science and Technology Project of National Ministry of Hosing, and Urban-Rural Development (2012-R2-2), and the financial support provided by National Ministry of Land and Resources and Sichuan Agricultural University is gratefully acknowledged.

Author Contributions

Wei Shui designed research; Wei Shui and Jianping Bai performed research; Jianping Bai analyzed the data; all authors who were Wei Shui, Jianping Bai, Su Zhang, Yiping Chen wrote the paper. All authors read and approved the final manuscript.

Conflicts of Interest

All authors declare no conflict of interest.

References

  1. Long, H.L.; Li, Y.R.; Liu, Y.S.; Woods, M.; Zou, J. Accelerated restructuring in rural China fueled by “increasing vs. decreasing balance” land-use policy for dealing with hollowed villages. Land Use Pol. 2012, 29, 11–22. [Google Scholar] [CrossRef]
  2. Arayama, Y.; Miyoshi, K. Regional diversity and sources of economic growth in China. World Econ. 2004, 27, 1583–1607. [Google Scholar] [CrossRef]
  3. Long, H.L.; Heilig, G.K.; Li, X.B.; Zhang, M. Socio-economic development and land-use change: Analysis of rural housing land transition in the Transect of the Yangtse River, China. Land Use Pol. 2007, 24, 141–153. [Google Scholar] [CrossRef]
  4. Long, H.L.; Zou, J.; Liu, Y.S. Differentiation of rural development driven by industrialization andurbanization in eastern coastal China. Habit. Intern. 2009, 33, 454–462. [Google Scholar] [CrossRef]
  5. Long, H.L.; Li, T.T. The coupling characteristics and mechanism of farmland and rural housing land transition in China. J. Geogr. Sci. 2012, 22, 548–562. [Google Scholar] [CrossRef]
  6. Wu, X.F.; Yi, Y. Arguments on rural and urban construction land increase or decrease of hook. Land. Resour. Zhejiang Prov. 2009, 3, 42–43. [Google Scholar]
  7. Cui, B.M. From homestead to houses, new mode of rural collective construction land circulation in Tianjin. China Land Sci. 2010, 5, 37–40. [Google Scholar]
  8. Qiu, L.Z. Enlightenment on Tianjin and Chengdu’s rural and urban construction land increase or decrease of hook. Dev. Res. 2010, 10, 32–35. [Google Scholar]
  9. Yuan, H. Innovations from Chengdu’s town and country construction. In Chengdu Daily. Available online: http://www.sc.cei.gov.cn/dir1003/75978.htm (accessed on 22 July 2014).
  10. Chengdu Urban and rural construction and residents’ committees. The main goal of the work completion report of Chengdu Urban and rural construction and residents’ committees. Available online: http://www.cdcc.gov.cn/webNew/index.aspx (accessed on 25 December 2010).
  11. Chen, J. Xinjin’s remarkable achievements on construction of new rural community. Available online: http://news.xinhuanet.com/photo/2010-02/04/content_12929607.htm (accessed on 16 September 2014).
  12. Long, H.L.; Zou, J. Grain Production Driven by Variations in Farmland Use in China: An Analysis of Security Patterns. J. Resour. Ecol. 2012, 1, 60–67. [Google Scholar]
  13. Long, H.L. Land use policy in China: Introduction. Land Use Pol. 2014, 40, 1–5. [Google Scholar] [CrossRef]
  14. Duan, J.H.; Chen, J.B. Statistical investigation and analysis on satisfaction degree of Chinese urban and rural people. Statist. Inform. Forum 2009, 24, 79–84. [Google Scholar]
  15. Zhou, M.J.; Zhang, J.X. Influencing factors of subjective well-being of Chinese rural people. Chinese Mental Health J. 2007, 21, 783–786. [Google Scholar]
  16. Zhang, Y. Strengthen on Standard of urban and rural construction land increase or decrease hook work from Ministry of Land and Resources. Land. Resour. 2010, 7. Article 47. [Google Scholar]
  17. Li, W.J.; Wang, L. Advantages and disadvantages analysis on Urban and rural construction land increase or decrease in the hook. Land. Resour. Inform. 2009, 4, 34–37. [Google Scholar]
  18. Luo, Y.M.; Fan, L.M. The economic effects of rural infrastructure and farmers satisfaction research based on 44 administrative village in Shandong Province. Inquiry. Econ. Issue. 2008, 12, 67–73. [Google Scholar]
  19. Li, P.; Zhai, Z.Q. Farmers’ satisfaction degree on Farmers’ concentration living under the background of the new rural construction based on Changzhou, Zhenjiang and Nanjing. Agri. Jiangxi 2010, 22, 210–214. [Google Scholar]
  20. Luo, Y. Establishment and application of Chengdu urban and rural construction land increase or decrease hook project management information system. Resour. Living Environ. 2009, 8, 36–38. [Google Scholar]
  21. Dalkmann, H.; Hutfilter, S.; Vogelpohl, K.; Schnabel, P. Sustainable mobility in rural China. J. Environ. Manag. 2008, 87, 249–261. [Google Scholar] [CrossRef]
  22. Lichter, D.T.; Johnson, K.M. Emerging Rural Settlement Patterns and the Geographic Redistribution of America’s New Immigrants. Rural Sociol. 2006, 71, 109–131. [Google Scholar] [CrossRef]
  23. Mehmet, C.M. A retrospective view of the Turkish rural urban development policies and the case of the village towns. Urban Pol. Res. 2005, 23, 497–518. [Google Scholar] [CrossRef]
  24. Kumar, R.; Nandy, S.; Agarwal, R.; Kushwaha, S.P.S. Forest cover dynamics analysis and prediction modeling using logistic regression model. Ecol. Indic. 2014, 45, 444–455. [Google Scholar] [CrossRef]
  25. Conoscenti, C.; Ciaccio, M.; Caraballo, A.N.A.; Álvaro, G.G.; Edoardo, R.; Valerio, A. Assessment of susceptibility to earth-flow landslide using logistic regression and multivariate adaptive regression splines: A case of the Belice River basin (western Sicily, Italy). Available online: http://www.sciencedirect.com/science/article/pii/S0169555X14004954# (accessed on 2 October 2014).
  26. Xinjin Government. Into Xinjin. Available online: http://www.xinjin.gov.cn (accessed on 23 December 2010).
  27. Shen, M.H.; Zhou, L.G. Farmers’ employment options restriction factors of empirical research. Financ. Econ. 2004, 1, 53–57. [Google Scholar]
  28. Li, H. Statistical Analysis Software and Application Experiment; Economic Science Press: Beijing, China, 2008; pp. 203–215. [Google Scholar]
  29. Geng, J.H.; Gao, Q.S.; Ren, J.X. Community satisfaction degree based on Logistic regression model. Control Decis. 2007, 22, 1305–1308. [Google Scholar]
  30. Zhong, S.Y.; Li, K. Empirical Analysis on Land requisition for satisfaction. China Land Sci. 2008, 22, 63–69. [Google Scholar]
  31. Yin, K.K.; Deng, W.; Meng, J.F. Thinking of rural land property rights system reform and agricultural development mode. J. Financ. Econ. 2001, 27, 21–27. [Google Scholar]
  32. Galerius, P.; Vida, M. Towards sustainable rural development in central and eastern Europe: Applying land consolidation. Land Use Pol. 2010, 27, 545–549. [Google Scholar] [CrossRef]
  33. Li, X.; Li, B.L.; Zhang, H.C. The level of economic development in different areas of life in rural areas the influence factors of happiness research. Tech. Econ. 2009, 28, 98–103. [Google Scholar]

