Measurement Method and Empirical Research on the Sustainable Development Capability of a Regional Industrial System Based on Ecological Niche Theory in China

Abstract
:1. Introduction

| Year | Annual GDP of China (Billion RMB) | Volume of Waste Water (Million Cubic Meters) | Emissions of Waste Gas (Thousand Tons) | Emissions of Solid Waste (Thousand Tons) |
|---|---|---|---|---|
| 2012 | 51932.23 | 67489.39 | 23066.64 | 31596.83 |
| 2011 | 47310.41 | 65919.22 | 22179.13 | 33282.52 |
| 2010 | 40151.28 | 61725.62 | 21851.53 | 34928.62 |
| 2009 | 34090.28 | 58908.77 | 22144.04 | 44998.43 |
| 2008 | 31404.54 | 57168.01 | 23212.02 | 51253.22 |
| 2007 | 26581.03 | 55684.94 | 24680.94 | 57815.11 |
| 2006 | 21631.44 | 51448.02 | 25888.03 | 70941.43 |
| 2005 | 18493.74 | 52450.89 | 25494.02 | 75235.92 |
| 2004 | 15987.83 | 48240.94 | 22549.03 | 74289.51 |
| 2003 | 13582.28 | 46710.84 | 24213.11 | 86269.31 |
| 2002 | 12033.27 | 46619.80 | 24227.83 | 94637.04 |
| 2001 | 10965.52 | 47553.89 | 25480.63 | 103816.32 |
| 2000 | 9921.46 | 48310.97 | 26607.43 | 113886.02 |
| 1999 | 8967.71 | 49030.37 | 27755.92 | 124932.43 |
| 1998 | 8440.23 | 54436.43 | 32657.84 | 128230.12 |
| 1997 | 7897.30 | 53635.51 | 32218.83 | 128839.22 |
| 1996 | 7117.66 | 52467.20 | 30722.91 | 142668.31 |
| 1995 | 6079.37 | 51814.53 | 30149.31 | 159683.91 |
| 1994 | 4819.79 | 45996.98 | 28337.92 | 164929.01 |
| 1993 | 3533.39 | 37535.41 | 23929.23 | 178996.74 |


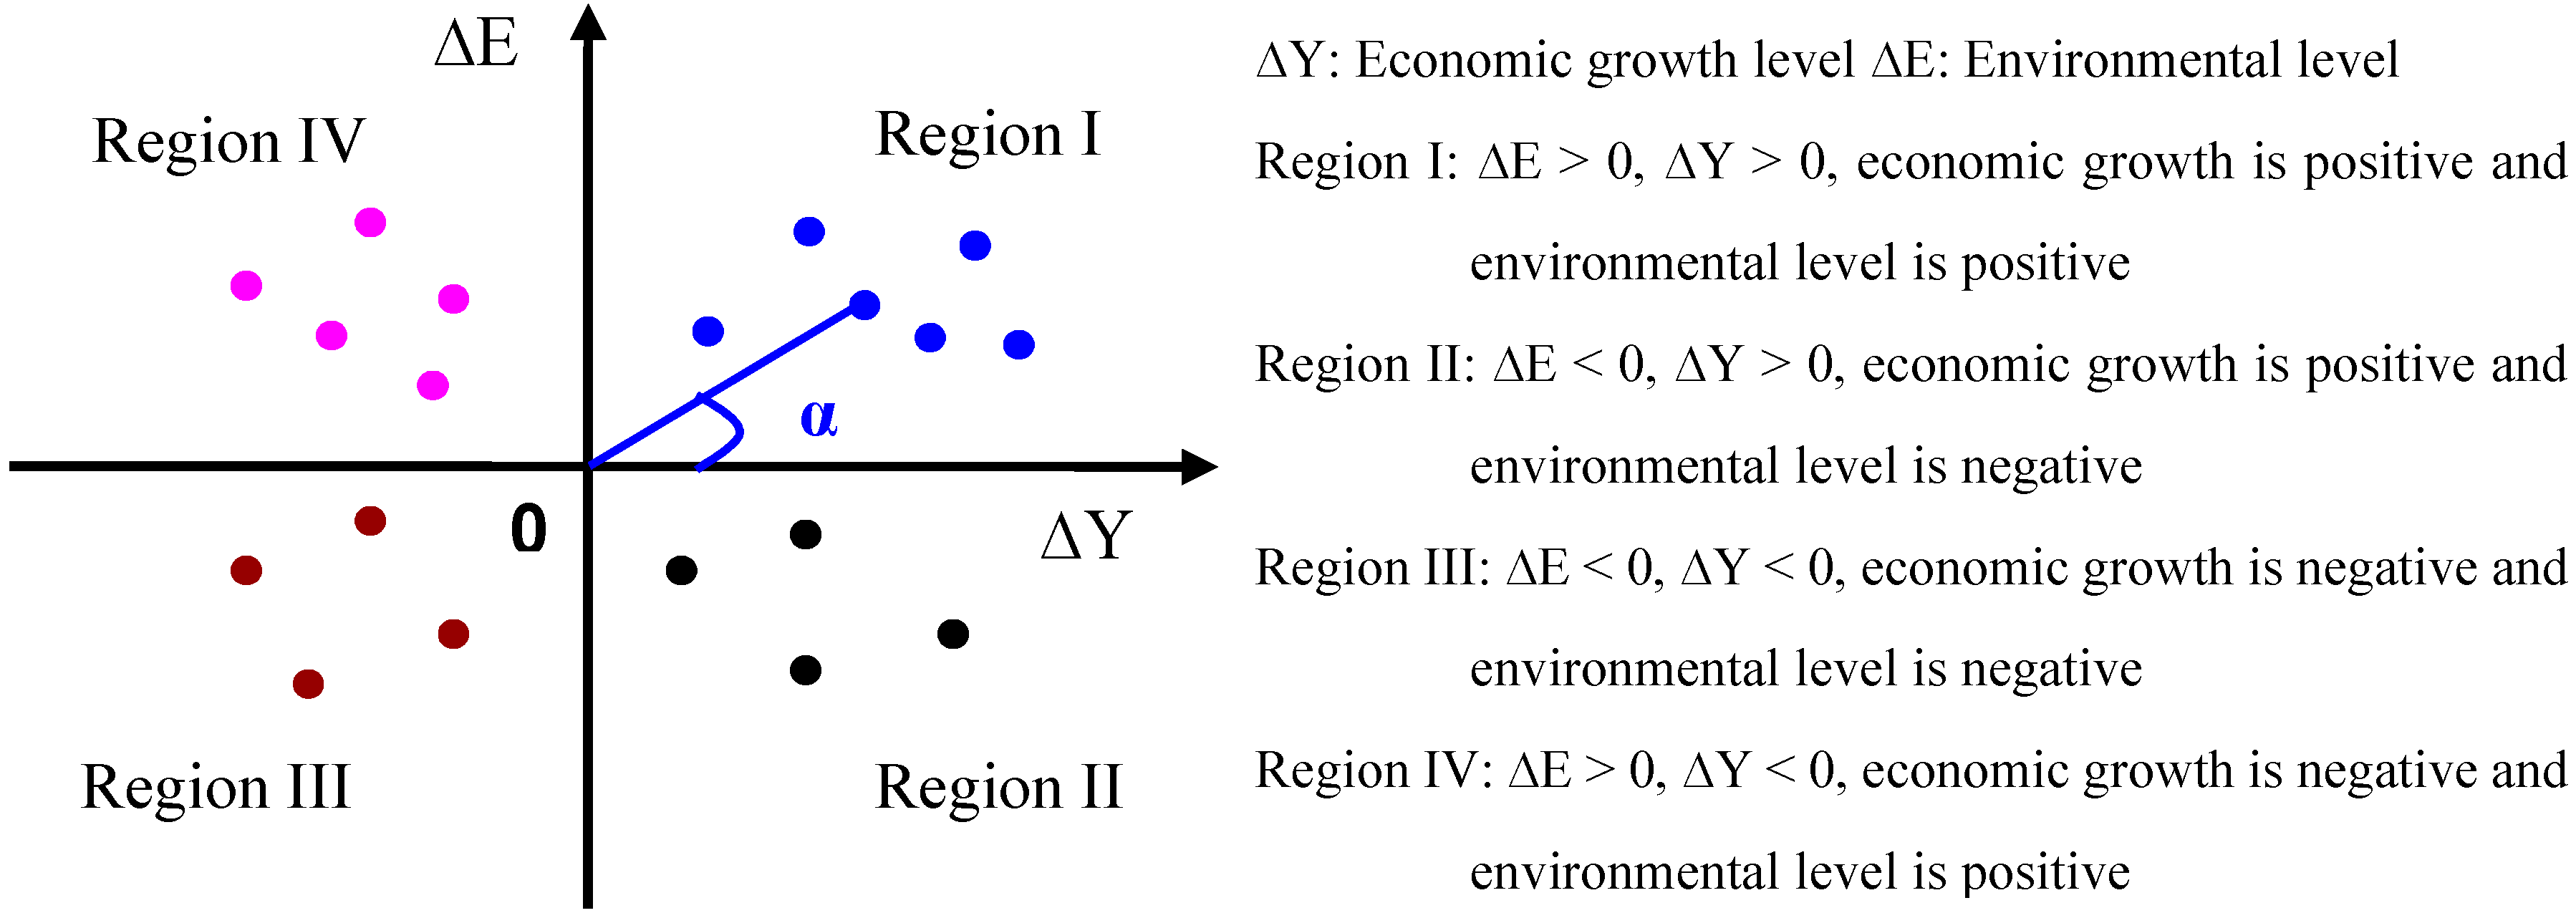
2. Economic Growth Theory

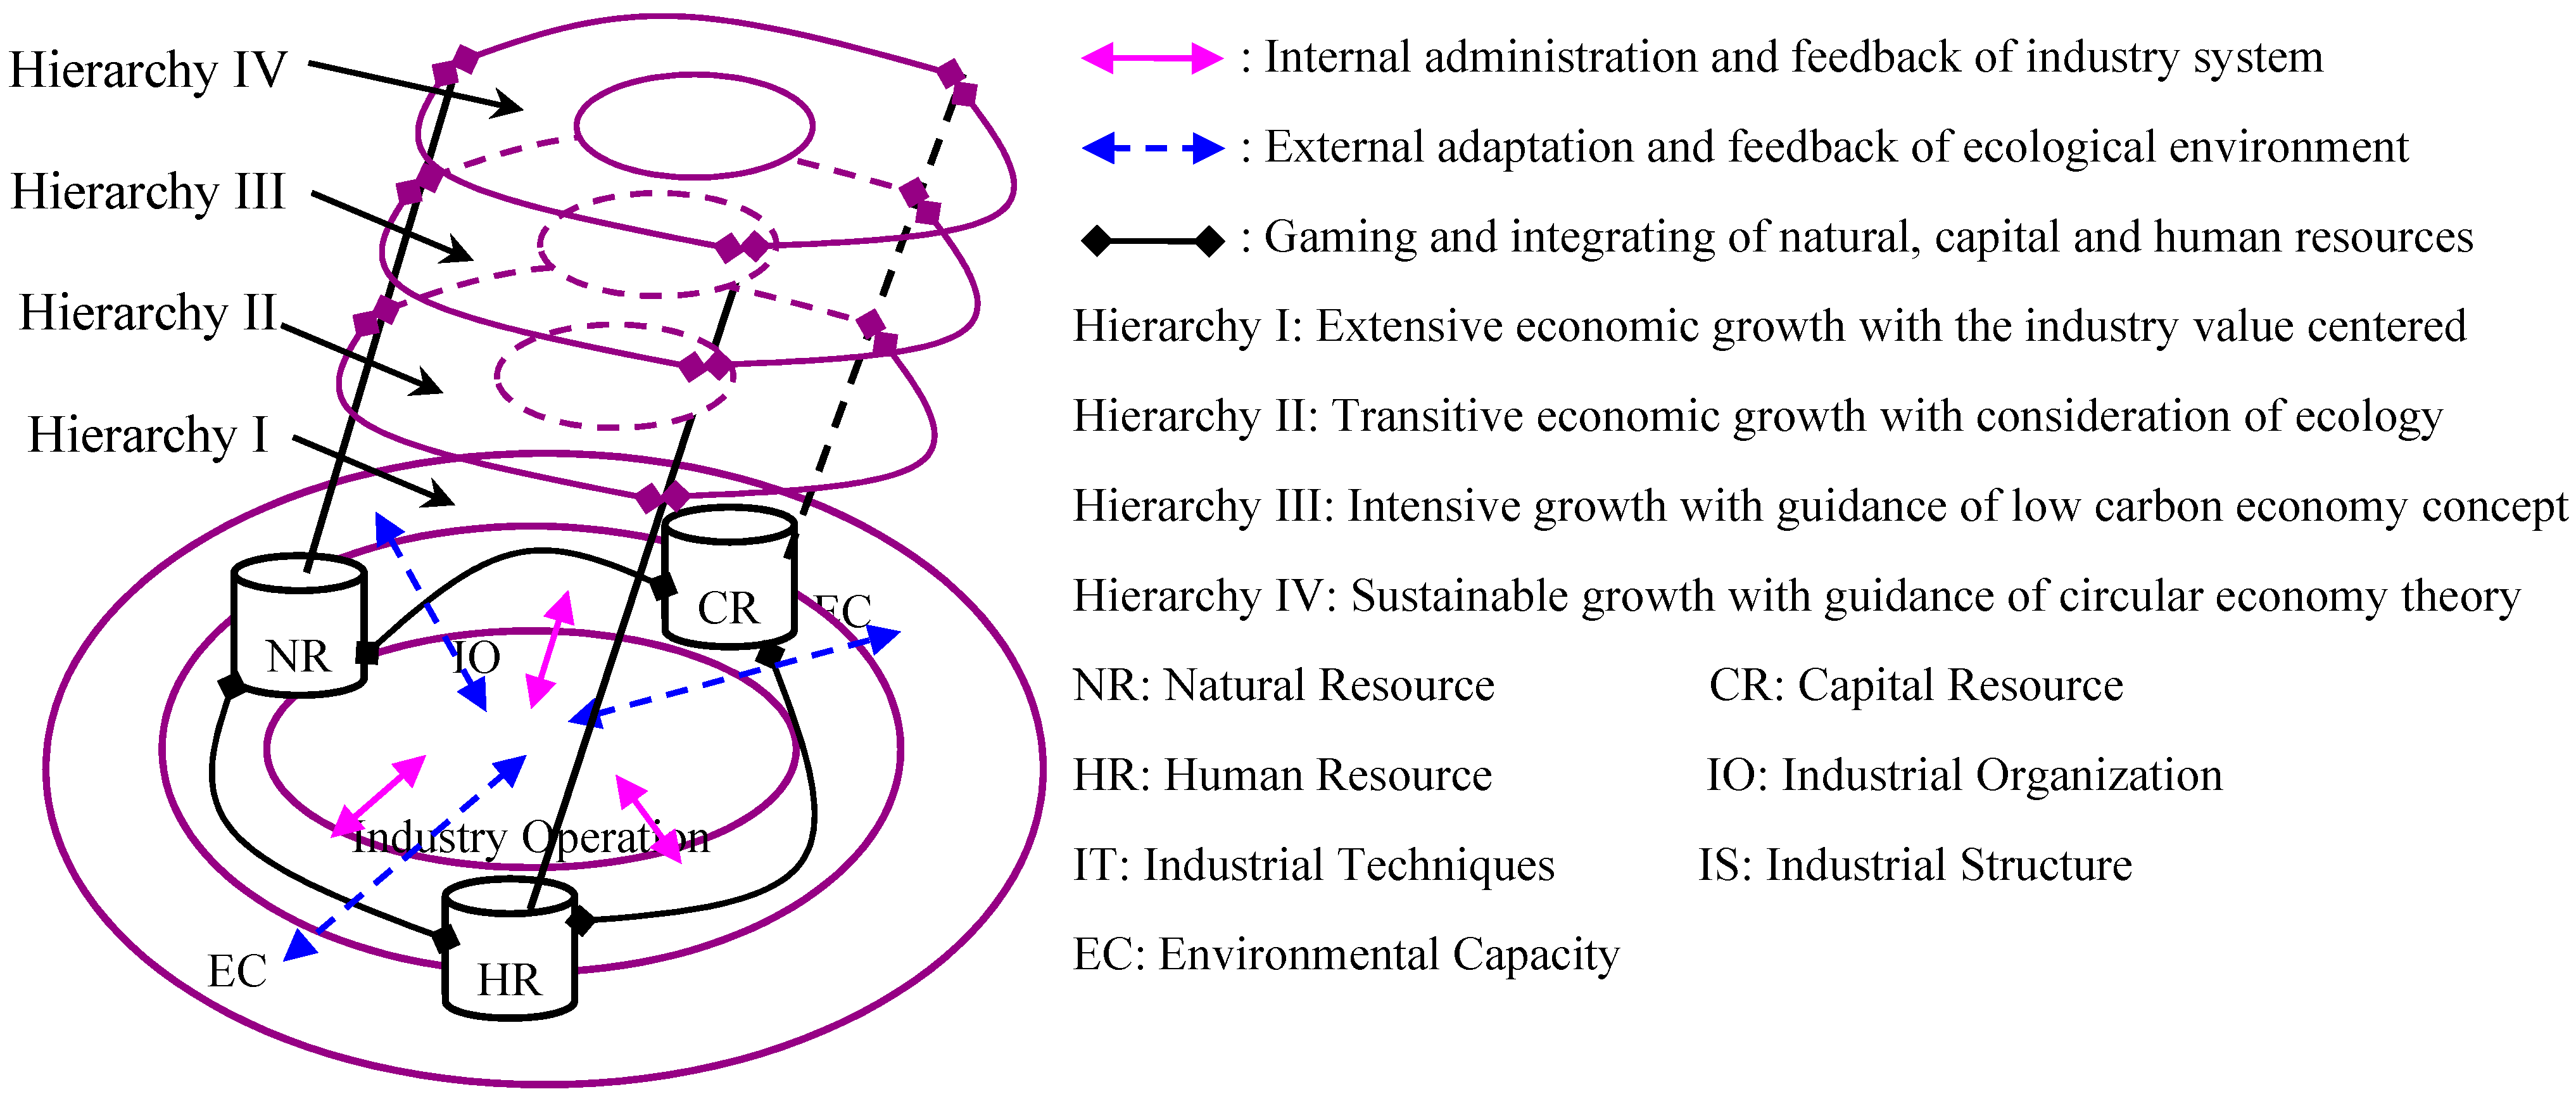
3. Evolutionary Capability of Industrial Ecological Niche
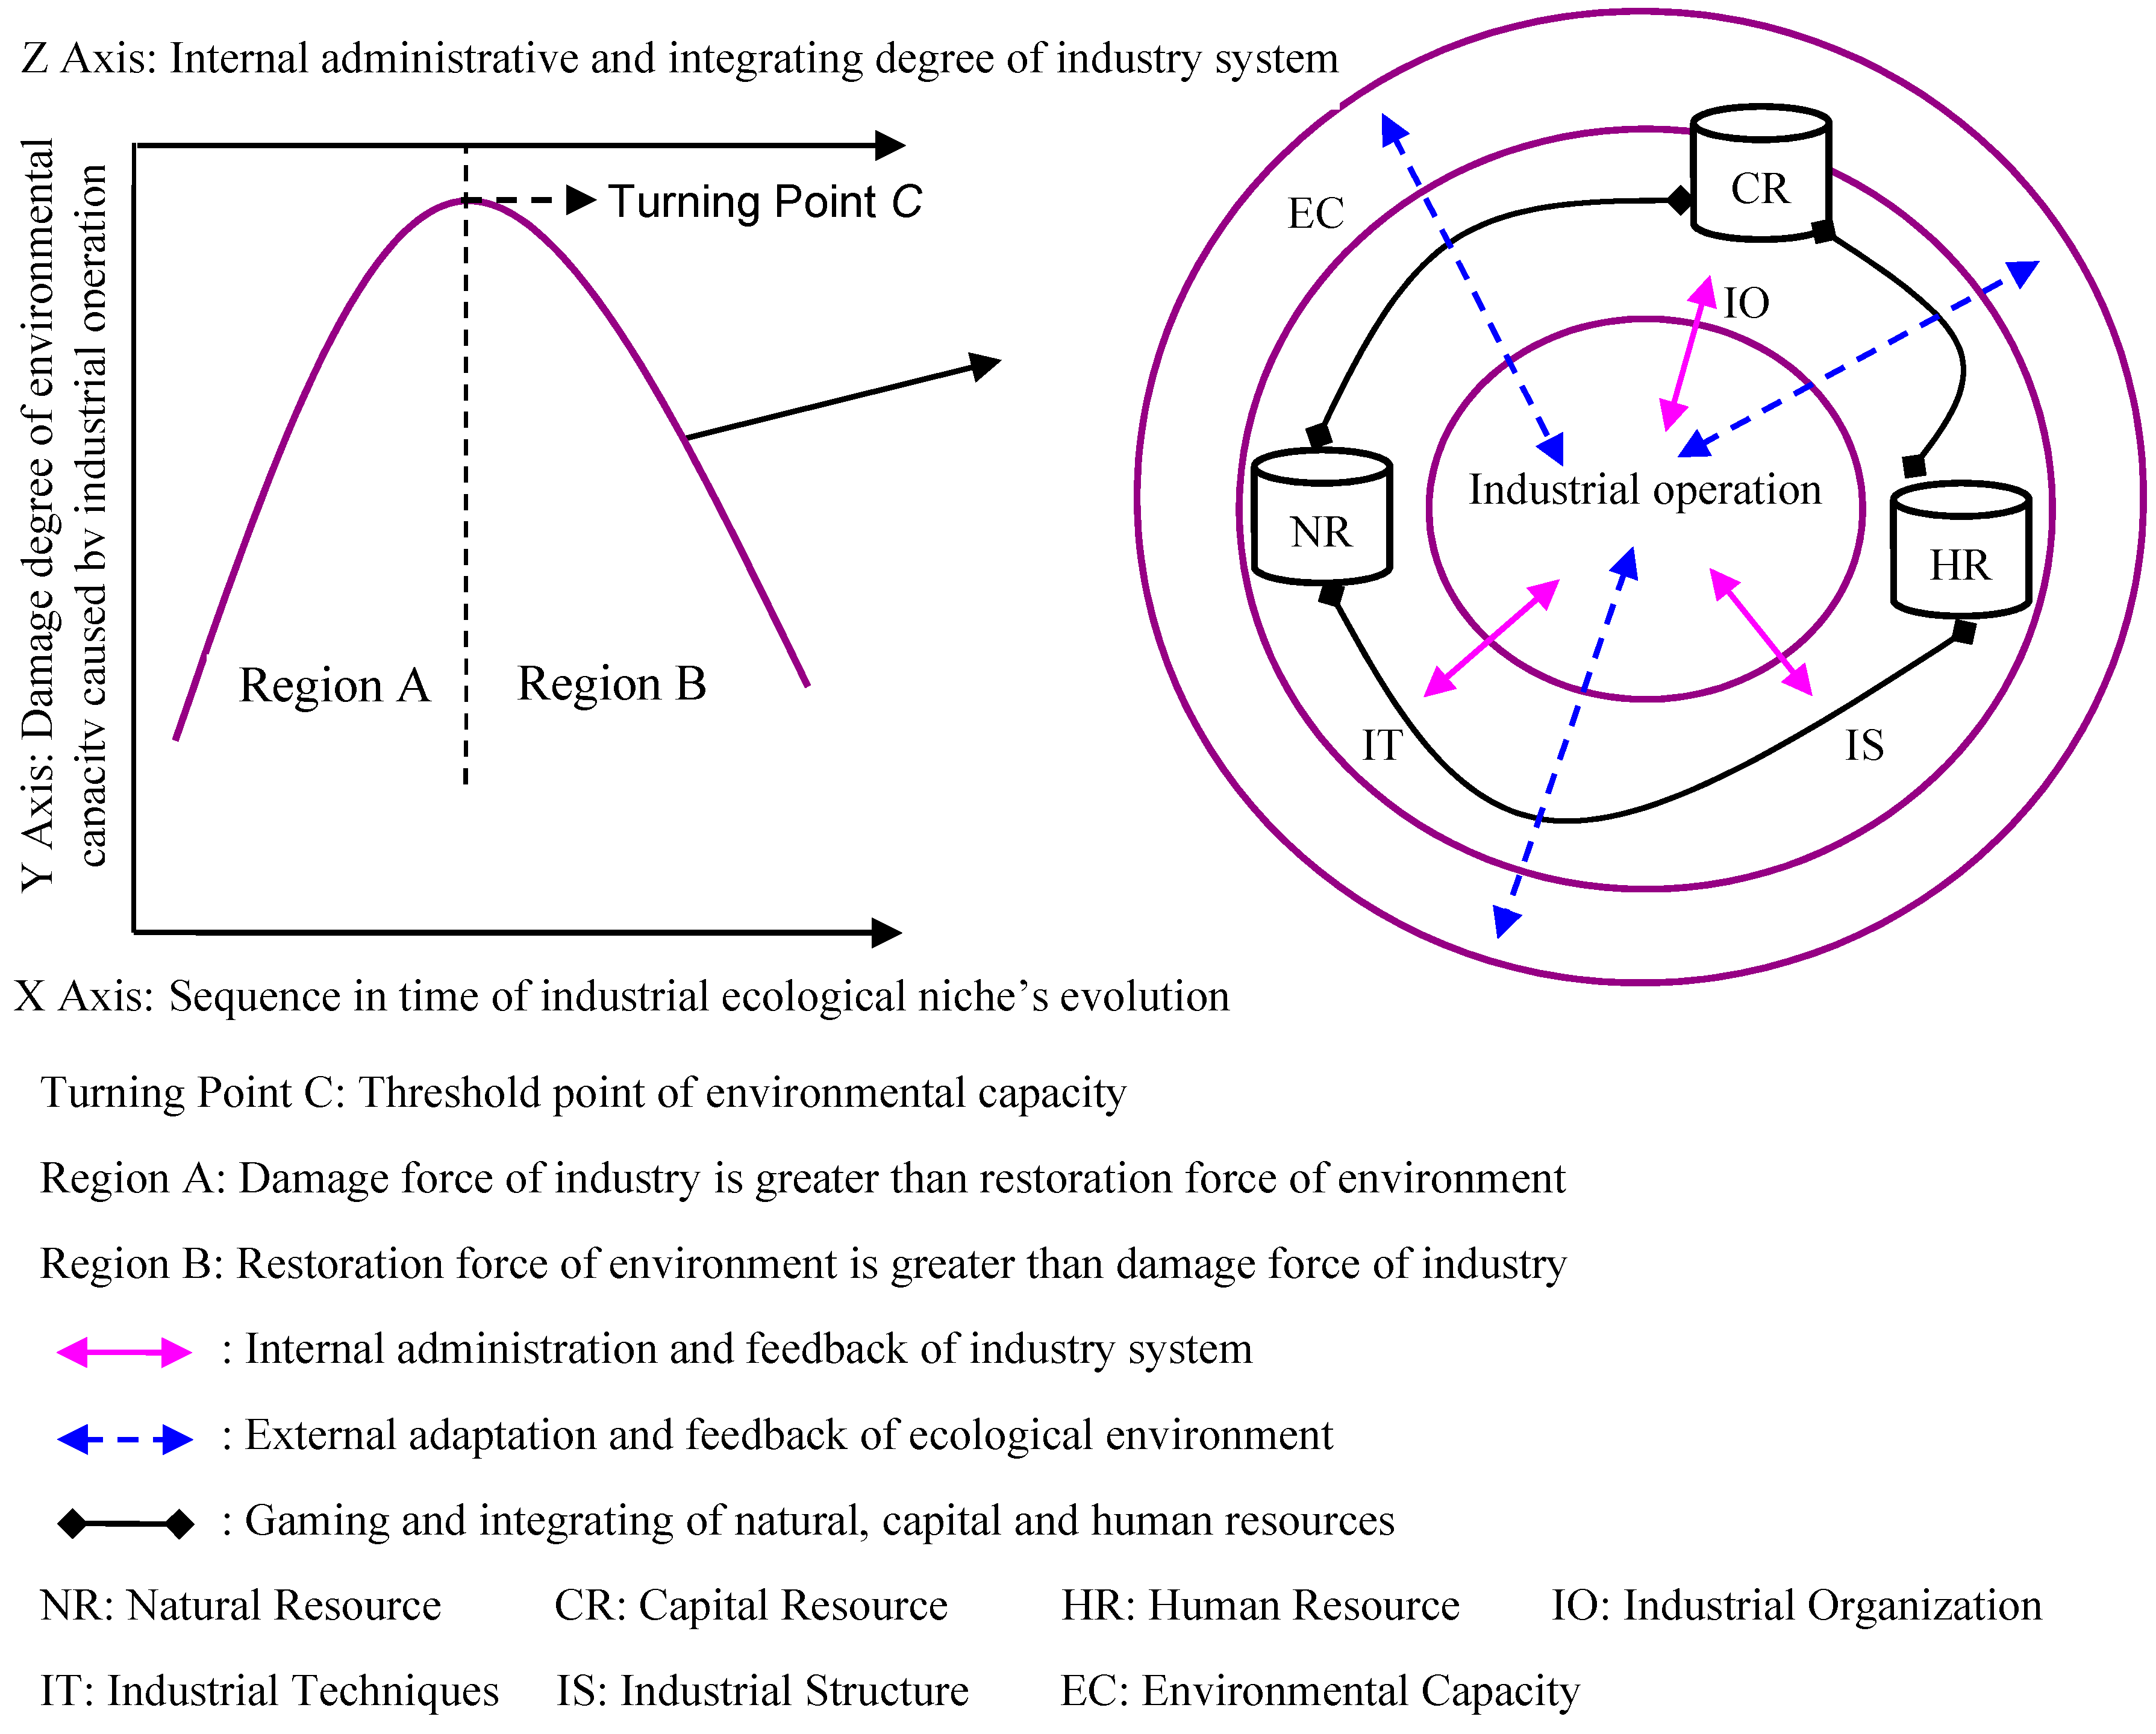
3.1. Connotation Definition of Industrial Ecological Niche
3.2. Evolutional Sequence Analysis of Industrial Ecological Niche

4. Methods
4.1. Dimensions Analysis on Industrial Operational Efficiency
4.2. Measurement Principles on Industrial Operational Efficiency
4.3. Measurement Indexes on Industrial Operational Efficiency
| Category of Indexes | Measurement Indexes |
|---|---|
| input index 1 | annual industrial net value of capital assets (X1) |
| input index 2 | annual industrial average current assets (X2) |
| input index 3 | work force of industry system (X3) |
| input index 4 | annual exhaust emission of industry system (X4) |
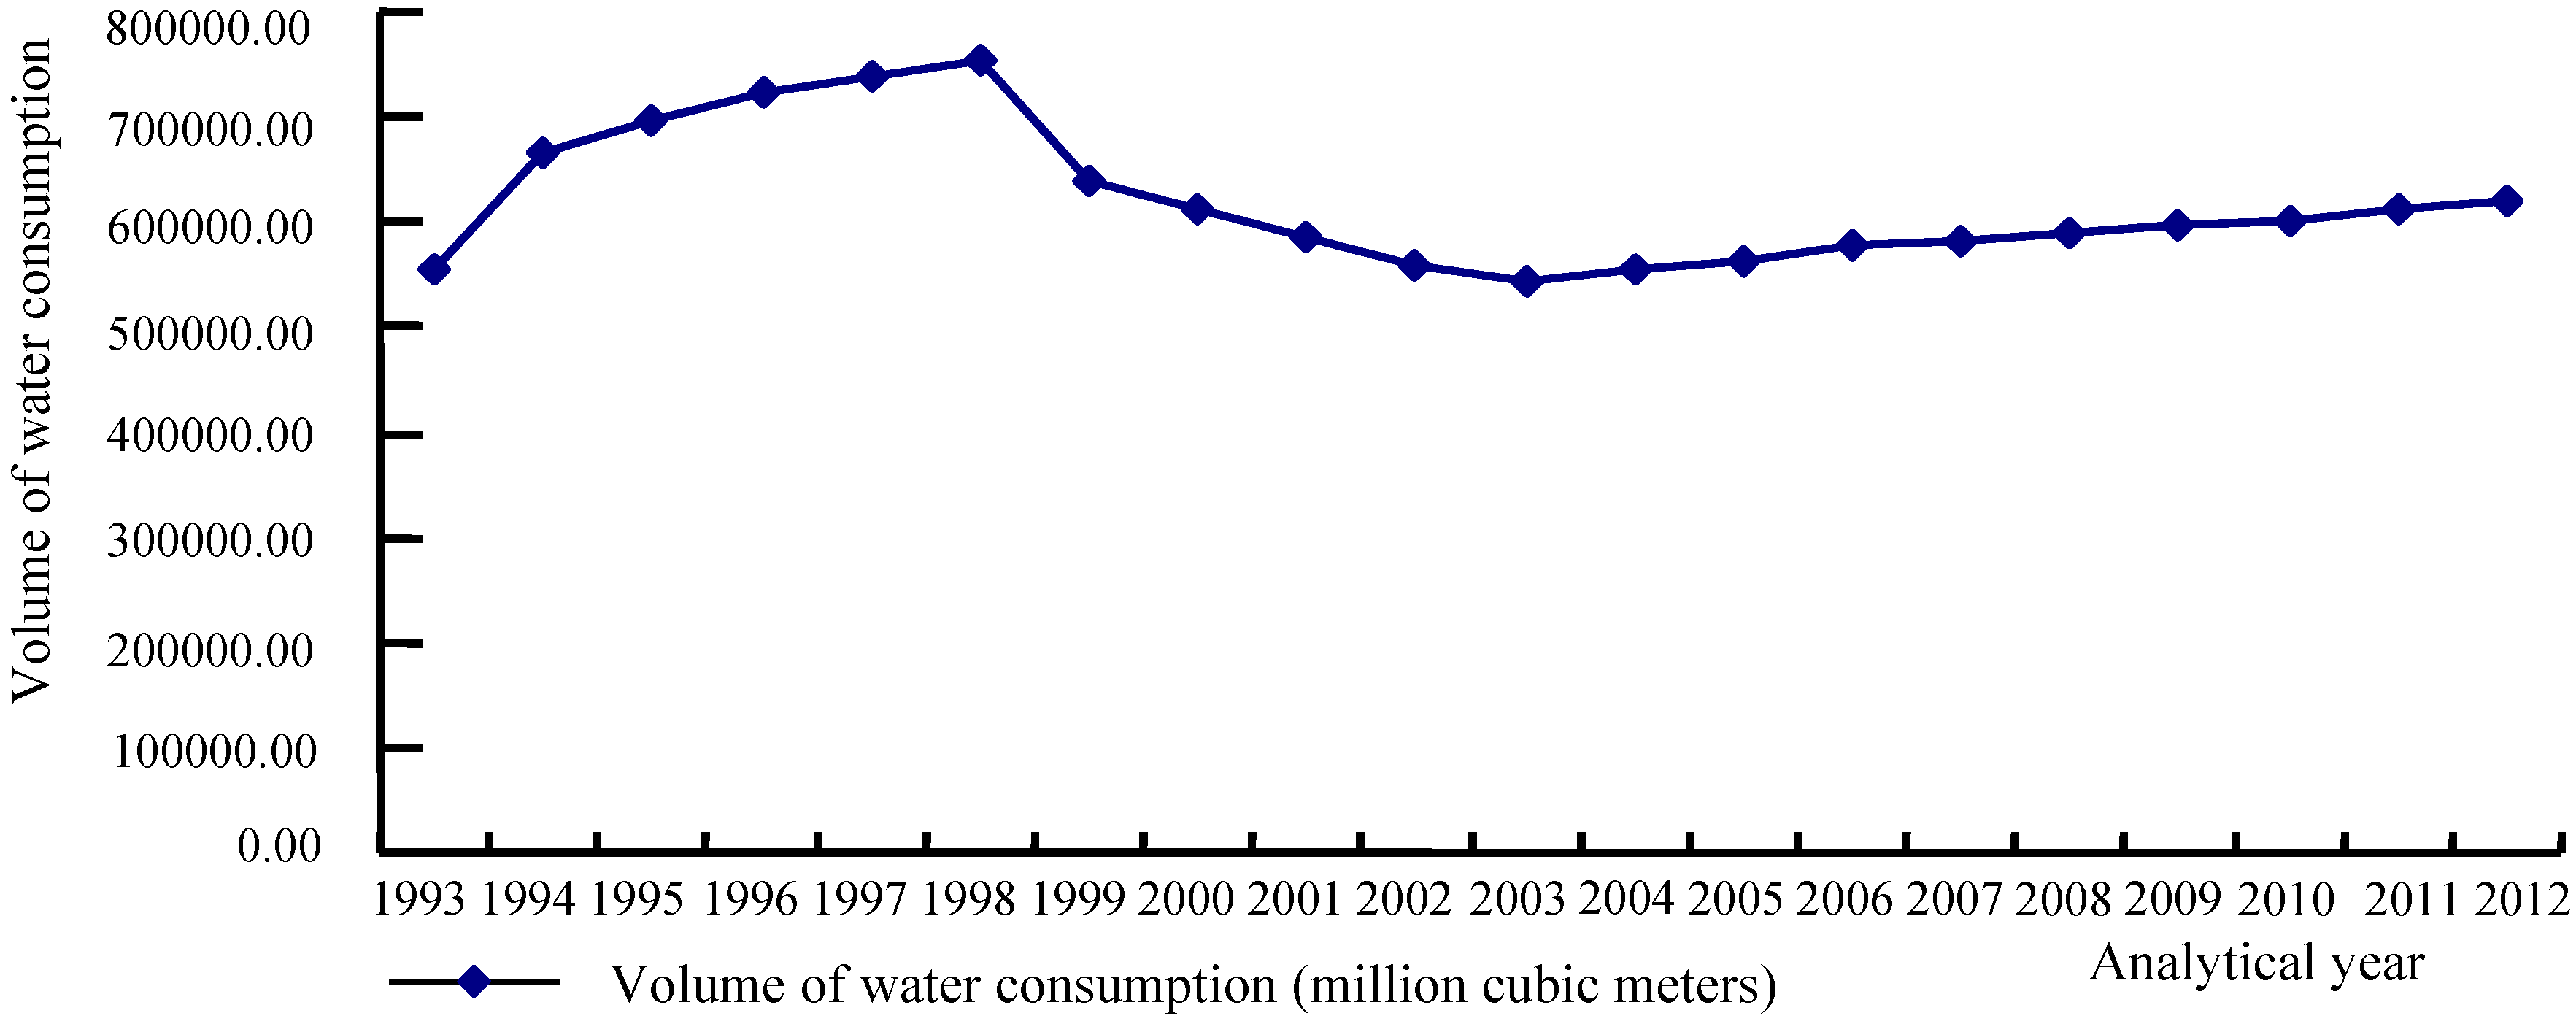
| input index 5 | annual unstandardized waste water of industry system (X5) |
| input index 6 | annual unutilized solid waste of industry system (X6) |
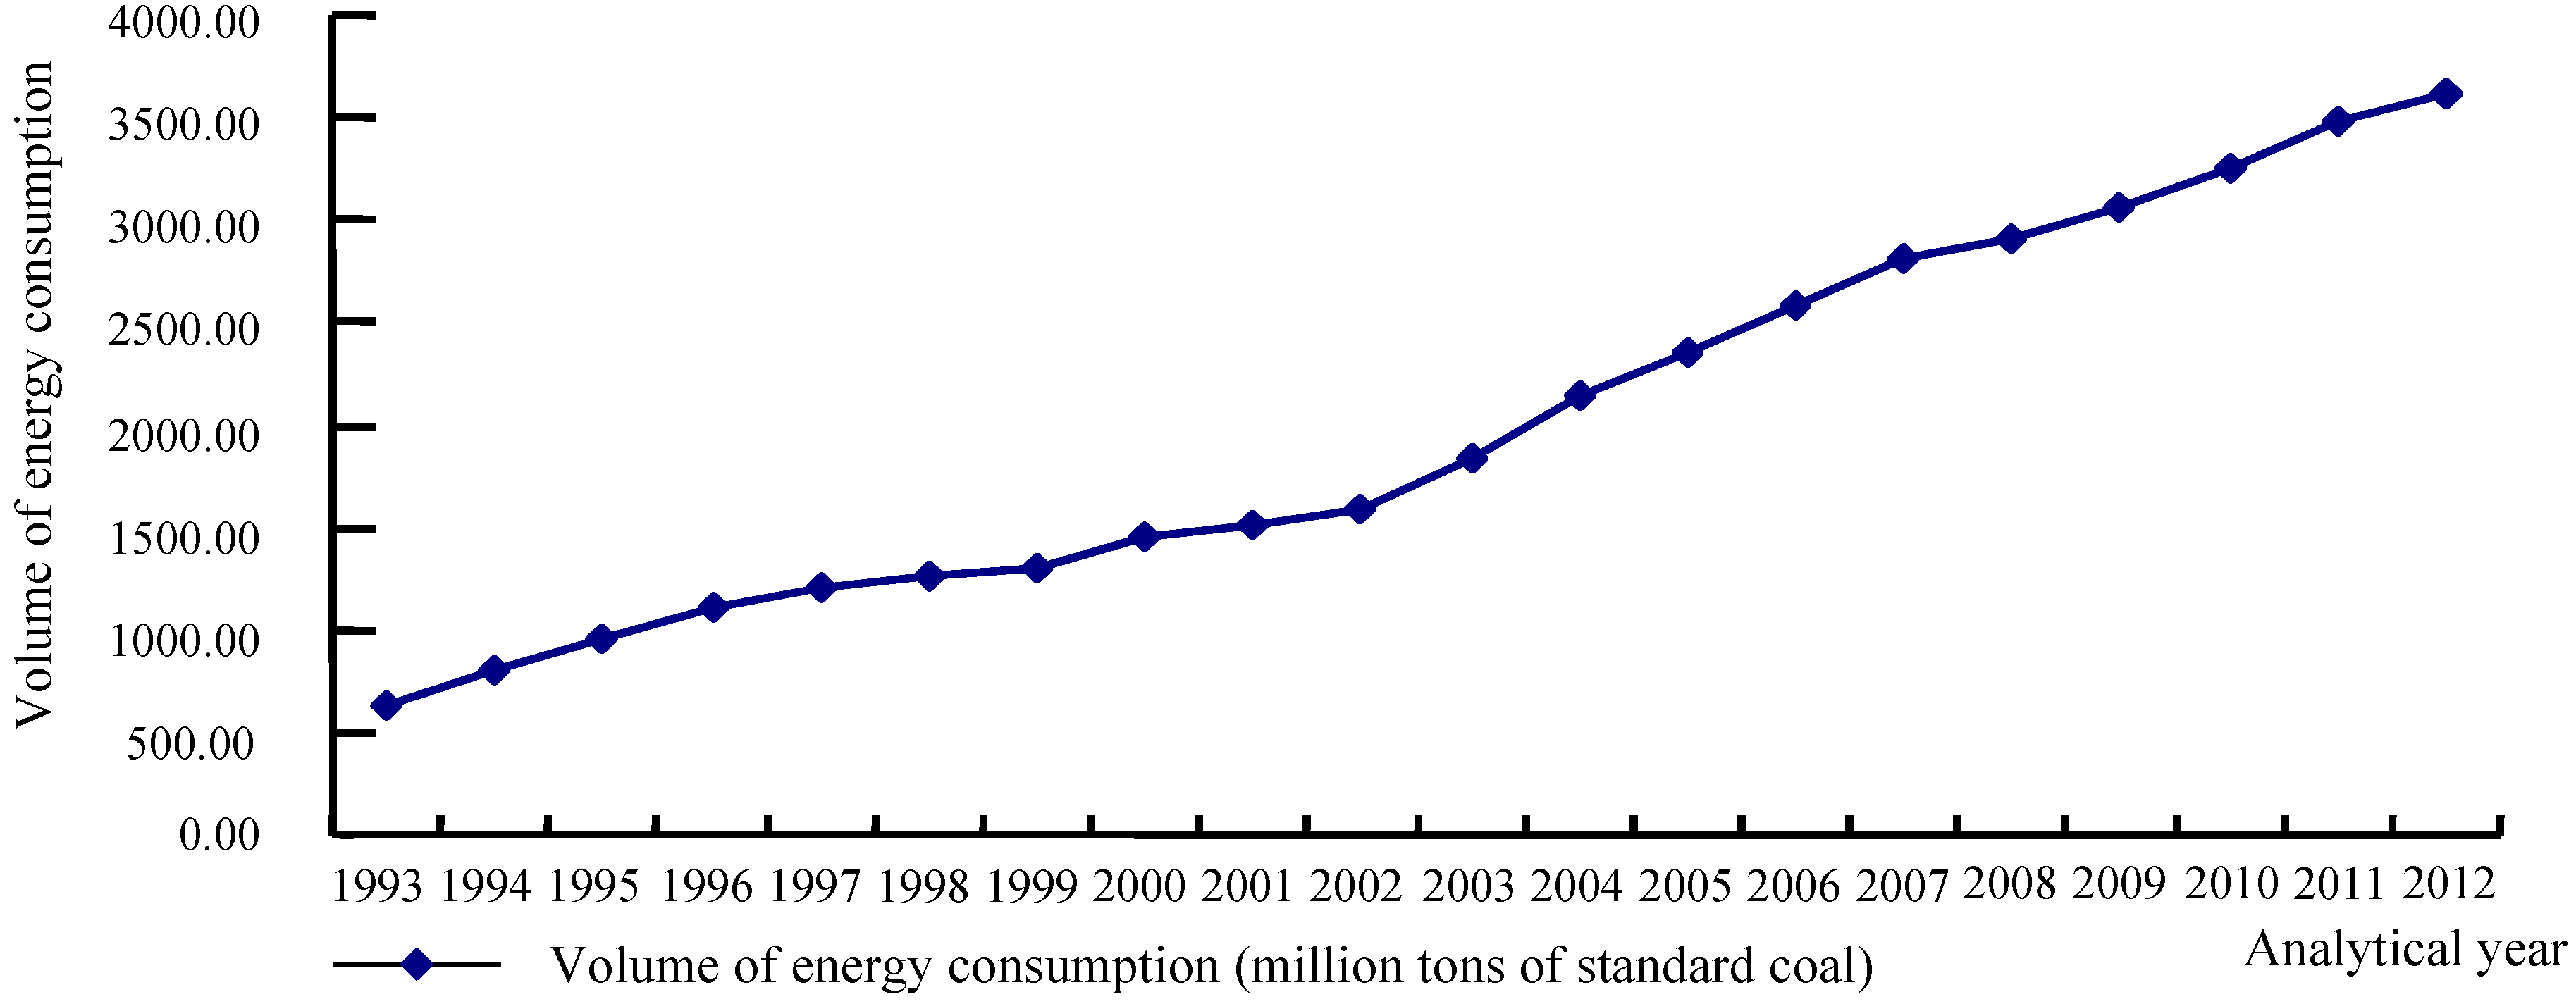
| input index 7 | annual energy consumption of industry system (X7) |
| Output index 1 | annual industrial productivity of industry system (Y1) |
| Output index 2 | annual net profit of industry system (Y2) |
| Output index 3 | return on total assets of industry system (V1) |
| Output index 4 | overall staff working productivity of industry system (V2) |
4.4. Measurement Model on Industrial Operational Efficiency
5. Results
5.1. Analytical Units and Statistical Data for Empirical Research
5.2. Calculating Procedure and Measurement Values
| Analytical Units | Procedural Coefficient of DEA Model Φ | Initial Values of Measurement θ0 | Standard Values of Measurement θ * |
|---|---|---|---|
| 1993 | 0.6173 | 0.7804 | 0.4353 |
| 1994 | 0.3647 | 0.7645 | 0.4265 |
| 1995 | 0.5037 | 0.7340 | 0.4095 |
| 1996 | 0.5700 | 0.7000 | 0.3905 |
| 1997 | 0.4396 | 0.6679 | 0.3726 |
| 1998 | 0.4454 | 0.6138 | 0.3424 |
| 1999 | 0.4070 | 0.6821 | 0.3805 |
| 2000 | 0.4696 | 0.8010 | 0.4468 |
| 2001 | 0.4783 | 0.8584 | 0.4789 |
| 2002 | 0.5405 | 1.1230 | 0.6264 |
| 2003 | 0.5593 | 0.9811 | 0.5473 |
| 2004 | 0.5035 | 0.9128 | 0.5092 |
| 2005 | 0.7240 | 0.9389 | 0.5237 |
| 2006 | 0.5218 | 1.0653 | 0.5943 |
| 2007 | 0.6389 | 1.1144 | 0.6217 |
| 2008 | 0.8479 | 1.5379 | 0.8579 |
| 2009 | 0.8919 | 1.5549 | 0.8674 |
| 2010 | 0.8784 | 1.5857 | 0.8846 |
| 2011 | 0.5805 | 1.6271 | 0.9077 |
| 2012 | 0.2002 | 1.7926 | 1.0000 |
5.3. Optimization Values of Redundancy Cost
6. Discussion and Conclusions
6.1. Discussion of Results
| Analytical Units | Redundant Percent of Index X1 | Redundant Percent of Index X2 | Redundant Percent of Index X3 | Redundant Percent of Index X4 | Redundant Percent of Index X5 | Redundant Percent of Index X6 | Redundant Percent of Index X7 |
|---|---|---|---|---|---|---|---|
| 1993 | 19.604 | 19.970 | 15.929 | 16.298 | 14.225 | 15.170 | 15.568 |
| 1994 | 16.968 | 17.597 | 15.289 | 17.575 | 16.407 | 16.369 | 16.220 |
| 1995 | 19.622 | 17.047 | 16.497 | 18.894 | 17.495 | 17.043 | 16.696 |
| 1996 | 18.782 | 21.764 | 16.941 | 19.334 | 18.733 | 17.983 | 17.553 |
| 1997 | 21.052 | 19.418 | 15.878 | 20.855 | 19.760 | 18.394 | 18.558 |
| 1998 | 21.352 | 22.037 | 18.739 | 21.087 | 19.858 | 19.423 | 22.136 |
| 1999 | 23.544 | 22.508 | 17.345 | 20.679 | 20.202 | 16.696 | 21.008 |
| 2000 | 21.405 | 19.953 | 15.892 | 19.554 | 14.943 | 14.039 | 17.512 |
| 2001 | 18.614 | 17.516 | 15.598 | 17.820 | 13.660 | 14.069 | 15.815 |
| 2002 | 12.202 | 14.772 | 14.600 | 15.674 | 11.210 | 12.413 | 13.415 |
| 2003 | 15.614 | 16.102 | 16.645 | 17.463 | 13.186 | 13.493 | 14.368 |
| 2004 | 17.020 | 17.083 | 13.912 | 17.781 | 15.353 | 14.908 | 15.327 |
| 2005 | 16.214 | 19.926 | 16.094 | 16.517 | 14.891 | 14.086 | 16.682 |
| 2006 | 15.828 | 16.218 | 18.654 | 15.832 | 14.111 | 13.501 | 12.827 |
| 2007 | 13.742 | 15.357 | 12.936 | 15.060 | 10.976 | 12.521 | 12.642 |
| 2008 | 14.348 | 15.146 | 15.745 | 13.773 | 9.673 | 12.118 | 13.391 |
| 2009 | 11.052 | 12.219 | 11.004 | 11.059 | 10.887 | 10.966 | 10.849 |
| 2010 | 8.528 | 9.066 | 7.845 | 5.965 | 8.640 | 8.680 | 6.745 |
| 2011 | 8.017 | 7.478 | 6.559 | 5.237 | 7.083 | 8.142 | 5.900 |
| 2012 | 0.007 | 0.014 | 0.006 | 0.012 | 0.008 | 0.013 | 0.009 |
6.2. Conclusions

| Year | Volume of Waste Water (Cubic Meters per Thousand RMB) | Emissions of Waste Gas (Tons per Million RMB) | Emissions of Solid Waste (Tons per Million RMB) |
|---|---|---|---|
| 2012 | 1.2996 | 0.4423 | 0.6148 |
| 2011 | 1.3933 | 0.4740 | 0.7359 |
| 2010 | 1.5373 | 0.5448 | 0.8723 |
| 2009 | 1.7280 | 0.6512 | 1.3230 |
| 2008 | 1.8204 | 0.7433 | 1.6316 |
| 2007 | 2.0949 | 0.9330 | 2.1809 |
| 2006 | 2.3784 | 1.2004 | 3.2832 |
| 2005 | 2.8361 | 1.3804 | 4.0732 |
| 2004 | 3.0174 | 1.4199 | 4.6514 |
| 2003 | 3.4391 | 1.7830 | 6.3537 |
| 2002 | 3.8742 | 2.0155 | 7.8626 |
| 2001 | 4.3367 | 2.3224 | 9.4715 |
| 2000 | 4.8693 | 2.6801 | 11.4807 |
| 1999 | 5.4674 | 3.1330 | 13.9344 |
| 1998 | 6.4496 | 3.8745 | 15.1948 |
| 1997 | 6.7916 | 4.0831 | 16.3132 |
| 1996 | 7.3714 | 4.3241 | 20.0419 |
| 1995 | 8.5230 | 4.9634 | 26.2713 |
| 1994 | 9.5434 | 5.8828 | 34.2238 |
| 1993 | 10.6231 | 6.7745 | 50.6609 |
6.3. Shortcomings and Further Improvement
Acknowledgments
Author Contributions
Conflicts of Interest
References
- Zhang, K.T.; Wen, Z.G. Review and challenges of policies of environmental protection and sustainable development in China. J. Environ. Manag. 2008, 88, 1249–1261. [Google Scholar] [CrossRef]
- Perles, R.; Vías, M.B. Vulnerability of human environment to risk: Case of ground-water contamination risk. Environ. Int. 2009, 35, 325–335. [Google Scholar] [CrossRef] [PubMed]
- Veena, S.; Karen, C.S. The impact of urbanization on water vulnerability: A coupled human-environment system approach for Chennai, India. Glob. Environ. Chang. 2013, 66, 229–239. [Google Scholar]
- Li, M.N.; Zhang, L.L. Haze in China: Current and future challenges. Environ. Pollut. 2014, 189, 85–86. [Google Scholar] [CrossRef] [PubMed]
- Grossman, G.M.; Krueger, A.B. Environmental impacts of a North American Free Trade Agreement. In National Bureau of Economic Research Working Paper; MIT Press: Cambridge, MA, USA, 1991; Volume 3914, pp. 1–39. [Google Scholar]
- Kuznets, S. Economic growth and income inequality. Am. Econ. Rev. 1955, 45, 12–35. [Google Scholar]
- Grossman, G.M.; Alan, K. Economic growth and the environment. Q. J. Econ. 1995, 110, 13–37. [Google Scholar] [CrossRef]
- Gibson, R.B.; Walker, A. Assessing trade: An evaluation of the commission for environmental cooperation’s analytic framework for assessing the environmental effects of North American Free Trade Agreement. Environ. Impact Assess. Rev. 2001, 21, 449–468. [Google Scholar] [CrossRef]
- Hu, D.; Xu, K.P.; Yang, J.X. Economic development and environmental quality: Progress on the Environmental Kuznets Curve. Acta Ecol. Sin. 2004, 24, 1259–1266. [Google Scholar]
- Saboori, B.; Sulaiman, J. Environmental degradation, economic growth and energy consumption: Evidence of the environmental Kuznets Curve in Malaysia. Energy Policy 2013, 60, 892–905. [Google Scholar] [CrossRef]
- Wang, Y.; Kang, L.Y.; Wu, X.Q.; Xiao, Y. Estimating the environmental Kuznets curve for ecological footprint at the global level: A spatial econometric approach. Ecol. Indic. 2013, 34, 15–21. [Google Scholar] [CrossRef]
- Ana, J.; López, M.; Rigoberto, P.; Blanca, M. Environmental costs and renewable energy: Re-visiting the Environmental Kuznets Curve. J. Environ. Manag. 2014, 145, 368–373. [Google Scholar] [CrossRef]
- Ling, K.; Wang, H.C.; Liu, T. The Statistical Research on the relationship between urban economic development and environmental pollution: The case of Nanjing city. Stat. Res. 2001, 11, 46–57. [Google Scholar]
- Liu, Y.B.; Li, R.D. Exploring on environmental Kuznets characteristics of wastewater, waste gas and solid wastes and their causes in Wuhan City. Urban Environ. Urban Ecol. 2003, 16, 44–45. [Google Scholar]
- Brajer, V.; Mead, R.W.; Xiao, F. Searching for an environmental Kuznets Curve in China’s air pollution. China Econ. Rev. 2011, 22, 383–397. [Google Scholar] [CrossRef]
- Jayanthakumaran, K.; Ying, L. Openness and the environmental Kuznets Curve: Evidence from China. Econ. Model. 2012, 29, 566–576. [Google Scholar] [CrossRef]
- Steven, P.C.; Stephen, F.H. The transition from dirty to clean industries: Optimal fiscal policy and the environmental Kuznets curve. J. Environ. Econ. Manag. 2004, 48, 1050–1077. [Google Scholar] [CrossRef]
- Yang, W.J. Measuring eco-efficiency with data envelopment analysis: An example of provincial industry in China. Sci. Econ. Soc. 2009, 29, 56–67. [Google Scholar]
- Duan, X.M. Relationship between economic growth and environmental pollution in Zhejiang: An empirical analysis based on VAR Model. J. Chongqing Jiaotong Univ. 2012, 12, 52–61. [Google Scholar]
- Majid, H.; Syed, M.H.Z.; Riffat, N.M.; Benktesh, D.S. Greenhouse gas emissions from production chain of a cigarette manufacturing industry in Pakistan. Environ. Res. 2014, 134, 81–90. [Google Scholar] [CrossRef]
- Romer, P.M. Increasing Returns and Long Run Growth. J. Polit. Econ. 1986, 95, 1002–1037. [Google Scholar] [CrossRef]
- Yin, J. Introduction of learning by doing and endogenous human capital to endogenous growth model. World Econ. Papers 2003, 47, 30–37. [Google Scholar]
- He, J.; Chen, H.P.; Bi, G.B. An endogenous growth model based on product-adding innovations and human capital. J. Quant. Tech. Econ. 2006, 23, 127–136. [Google Scholar]
- Zhang, T. Demand analysis in sustainable economic increase. J. Quant. Tech. Econ. 2001, 18, 43–49. [Google Scholar]
- Wang, H.; Yan, Z.G.; Li, H. Progress of environmental management and risk assessment of industrial chemicals in China. Environ. Pollut. 2012, 165, 174–181. [Google Scholar] [CrossRef] [PubMed]
- Zhao, X.L.; Zhang, S.F.; Fan, C.Y. Environmental externality and inequality in China: Current Status and future choices. Environ. Pollut. 2014, 190, 176–179. [Google Scholar] [CrossRef] [PubMed]
- Gao, X.L.; Zhou, F.X.; Chen, C.T.A. Pollution status of the Bohai Sea: An overview of the environmental quality assessment related trace metals. Environ. Int. 2014, 62, 12–30. [Google Scholar] [CrossRef] [PubMed]
- Yu, B.T.; Yu, B. Research on CRE efficiency in an industrial system based on the endogenous theory of environmental elements. J. Harbin Eng. Univ. 2010, 31, 1549–1558. [Google Scholar]
- Yang, S.L.; Li, T.F. Agility evaluation of mass customization product manufacturing. J. Mater. Proc. Technol. 2002, 129, 640–644. [Google Scholar] [CrossRef]
- Xue, X.F.; Tan, Z. The research on knowledge innovation mechanism and knowledge niche of virtual enterprise. J. Intell. 2008, 27, 73–79. [Google Scholar]
- He, J.F. Technological competence evolution model based on niche theory. Ind. Eng. J. 2008, 11, 32–41. [Google Scholar]
- Sun, B. A study on technology niche’s status from the perspective of network relationship. Stud. Sci. 2013, 42, 518–529. [Google Scholar]
- Ji, Q.Y.; Lin, J. The evaluation method for core competence of colleges and universities based on the niche theory. China Soft Sci. 2006, 31, 145–155. [Google Scholar]
- Xu, F.; Li, J.H. Study of principle and model of enterprise niche. China Soft Sci. 2005, 30, 130–141. [Google Scholar]
- Yan, A.; Da, Q.L. A model of enterprise evolution based on niche construction. East China Econ. Manag. 2009, 23, 293–316. [Google Scholar]
- Laland, K.N.; Odling-Smee, F.J.; Feldman, M.W. Evolutionary consequences of niche construction: A theoretical investigation using two locus theory. J. Evol. Biol. 1996, 9, 293–316. [Google Scholar] [CrossRef]
- Xiao, Y.; Mao, X.Q. Urban niche theory and its application. China Pollut. Resourc. Environ. 2008, 18, 41–45. [Google Scholar]
- Topuz, E.; Talinli, I.; Aydin, E. Integration of environmental and human health risk assessment for industries using hazardous materials: A quantitative multi criteria approach for environmental decision makers. Environ. Int. 2011, 37, 393–403. [Google Scholar] [CrossRef] [PubMed]
- Gibbs, D.; Deutz, P. Reflections on implementing industrial ecology through eco-industrial park development. J. Clean. Prod. 2007, 15, 1683–1695. [Google Scholar] [CrossRef]
- Du, Y.W.; Zhang, P.; Ren, J. Analysis of the energy efficiency in the large enterprises from an industrial ecology perspective: Case study from BaoGang group. Energy Procedia 2011, 5, 1237–1242. [Google Scholar] [CrossRef]
- Despeisse, M.; Ball, P.D.; Evans, S.; Levers, A. Industrial ecology at factory level-a conceptual model. J. Clean. Prod. 2012, 31, 30–39. [Google Scholar] [CrossRef] [Green Version]
- Alessandro, D.; Tiziano, B.; Andrea, C. Development and application of an innovative expert decision support system to manage sediments and to assess environmental risk in freshwater ecosystems. Environ. Int. 2013, 60, 171–182. [Google Scholar] [CrossRef] [PubMed]
- Shaleen, S.; Amit, K. Industrial estate planning and management in Indiavative expert decision support industrial ecology. J. Environ. Manag. 2002, 66, 19–29. [Google Scholar] [CrossRef]
- Han, D.F.; Xu, J.H.; Su, F.L. Review on Kuznets Curve. Environ. Sustain. Dev. 2006, 31, 123–129. [Google Scholar]
- Shafik, N.; Bandyopadhyay, S. Economic growth and environmental quality: Time series and cross-country evidence. In Background Paper for World Development Report 1992, 1st ed.; World Bank: Washington, DC, USA, 1992; pp. 1–50. [Google Scholar]
- Pan, J.H. Economic Analysis of Sustainable Development, 1st ed.; China Renmin University Press: Beijing, China, 1997; pp. 177–193. [Google Scholar]
- Li, Z.; Bao, X.B. Estimation of Kuznets Curve of China’s Environment. Sci. Technol. Rev. 2002, 23, 57–87. [Google Scholar]
- Tsuzuki, Y. An index directly indicates land-based pollutant load contributions of domestic wastewater to the water pollution and its application. Sci. Total Environ. 2006, 370, 425–440. [Google Scholar] [CrossRef] [PubMed]
- Sang, H.K.; Yoon, S.G.; Song, H.C.; Park, S.W. Economic and environmental optimization of a multi-site utility network for an industrial complex. J. Environ. Manag. 2010, 91, 690–705. [Google Scholar] [CrossRef]
- Wu, Y.P.; Dong, S.C.; Song, J.F. Modeling economic growth and environmental degradation of Beijing. Geogr. Res. 2002, 21, 241–253. [Google Scholar]
- Yang, K.; Ye, M.; Xu, Q.X. Environmental Kuznets characteristics of municipal solid waste growth in Shanghai city. Geogr. Res. 2003, 22, 60–67. [Google Scholar]
- Cai, Z.B.; Li, Z.Y. The research on the Environmental Kuznets Curve of Jiangsu province based on the panel data model. China Dev. 2012, 12, 6–17. [Google Scholar]
- Zhuang, D.C.; Ye, H.; Zhang, H.X. Relationship of economic development and water environmental pollution in Guangzhou. Econ. Geogr. 2013, 33, 38–41. [Google Scholar]
- Fang, Y.P.; Raymond, P.C.; Qin, R. Industrial sustainability in China: Practice and prospects for eco-industrial development. J. Environ. Manag. 2007, 83, 315–328. [Google Scholar] [CrossRef]
- Sabadie, J.A. Technological innovation, human capital and social change for sustainability. Lessons learnt from the Industrial Technologies Theme of the EU’s Research Framework Programme. Sci. Total Environ. 2014, 481, 668–673. [Google Scholar] [CrossRef] [PubMed]
- Yu, B.T.; Yu, B. Research on CRE efficiency of industrial system based on improvement of ecological niche. Oper. Res. Manag. Sci. 2010, 19, 161–169. [Google Scholar]
- Wu, W.J. Analysis and Application of Data Envelopment Analysis Model, 1st ed.; China Statistics Press: Beijing, China, 2002; pp. 114–229. [Google Scholar]
- Wei, Q.L. Data Envelopment Analysis, 2nd ed.; Science Press: Beijing, China, 2004; pp. 209–217. [Google Scholar]
- Hirofumi, F.; Mirdehghan, S.M. Identifying the efficiency status in network DEA. Eur. J. Oper. Res. 2012, 220, 85–92. [Google Scholar] [CrossRef]
- Samoilenko, S.; Osei-Bryson, K.M. Using data envelopment analysis (DEA) for monitoring efficiency-based performance of productivity- driven organizations: Design and implementation of a decision support system. Omega 2013, 41, 131–142. [Google Scholar] [CrossRef]
- Andre, F.J.; Herrero, I. A modified DEA model to estimate the importance of objectives with an application to agricultural economics. Omega 2010, 38, 371–382. [Google Scholar] [CrossRef]
- Wu, J.; An, Q.X.; Shujahat, A.; Lian, L. DEA based resource allocation considering environmental factors. Math. Comput. Model. 2013, 58, 1128–1137. [Google Scholar] [CrossRef]
- Fu, Y.W.; Yin, H. Evaluation on relative efficiency validity of medicine industry companies based on mixed DEA model. Chin. J. Manag. Sci. 2006, 14, 91–102. [Google Scholar]
- Yin, H. Analysis and evaluation of relative efficiency of industrial system based on super-efficiency mixed DEA Model. Oper. Res. Manag. Sci. 2008, 17, 143–152. [Google Scholar]
- Yin, H.; Li, B.Z.; Guo, T.; Zhu, J.X. Measurement Method and Empirical Research on Systemic Vulnerability of Environmental Sustainable Development Capability. Polish J. Environ. Stud. 2014, 23, 243–253. [Google Scholar]
© 2014 by the authors; licensee MDPI, Basel, Switzerland. This article is an open access article distributed under the terms and conditions of the Creative Commons Attribution license (http://creativecommons.org/licenses/by/4.0/).
Share and Cite
Yin, H.; He, Q.; Guo, T.; Zhu, J.; Yu, B. Measurement Method and Empirical Research on the Sustainable Development Capability of a Regional Industrial System Based on Ecological Niche Theory in China. Sustainability 2014, 6, 8485-8509. https://doi.org/10.3390/su6128485
Yin H, He Q, Guo T, Zhu J, Yu B. Measurement Method and Empirical Research on the Sustainable Development Capability of a Regional Industrial System Based on Ecological Niche Theory in China. Sustainability. 2014; 6(12):8485-8509. https://doi.org/10.3390/su6128485
Chicago/Turabian StyleYin, Hang, Qing He, Tao Guo, Jianxin Zhu, and Botao Yu. 2014. "Measurement Method and Empirical Research on the Sustainable Development Capability of a Regional Industrial System Based on Ecological Niche Theory in China" Sustainability 6, no. 12: 8485-8509. https://doi.org/10.3390/su6128485