Given the current and possible future land use changes in regions of increasing agricultural activity, we propose a conceptual framework (iSIDES) to facilitate understanding and discussion of not only how such changes may impact the flows of energy, nutrients, and water across a landscape, but also where the potential leverage points may exist to manage a landscape so as to ensure the maintenance of critical ecosystem services. Before introducing the iSIDES framework itself, it is worth highlighting its similarities and differences to previous related efforts.
Attempts to conceptualize and model the environmental impacts of various human activities have a long history. In the early 1970’s, for example, the IPAT model [
10,
11] posited that environmental Impact is a function of such factors as Population, Affluence, and Technology. While this was a useful starting point, integrating multiple factors that influence environmental degradation, IPAT did not explicitly consider the role of ecosystem services in buffering those impacts, nor did it consider the role of scale. It has since been recognized that regulating ecosystem services, as defined in the Millenium Ecosystem Assessment [
7], not only mitigate the impact of human activities but that they emerge over spatial scales. While some more recent frameworks have focused on the impacts that one ecosystem service may have on another (
i.e., tradeoffs) [
12,
13], they do not consider how other ecosystem services might limit those impacts. Bennett
et al. (2006) [
9] proposed a typology of ecosystem services where one service impacts another, arguing that these feedbacks must be understood to enhance the overall provision of ecosystem services; and current quantitative models such as Integrated Valuation of Ecosystem Services and Tradeoffs (InVEST) have been developed to understand the interactions and tradeoffs among multiple ecosystem services, with an eye toward economic valuation [
14]. While such model studies are extremely useful for understanding interactions, they have not explicitly addressed how ecosystem services emerge over broader spatial scale to mitigate impacts. Nor are such quantitative models, with their attendant complexity, as accessible to non-specialists as earlier conceptualizations were (e.g., IPAT).
The iSIDES conceptual framework proposed here incorporates concepts from the IPAT model, recent work on ecosystem services, and the growing field of ecosystem modeling to explicitly account for the role of scale and ecosystem services capacity to buffer the impact of human activities. Furthermore, it strives to do this while maintaining a conceptual nature accessible to stakeholders outside of the environmental modeling disciplines. In light of these objectives, we suggest that the iSIDES framework, presented in the form of a general quantitative model, is a useful tool not only for understanding the scale-dependent impacts of human activities but also for overcoming the common research-implementation gap (or “knowing-doing” gap [
15]) by serving as a conceptual bridge among the various communities engaged in these issues (e.g., academic, political, agricultural,
etc.).
2.1. Introduction of the iSIDES Conceptual Framework
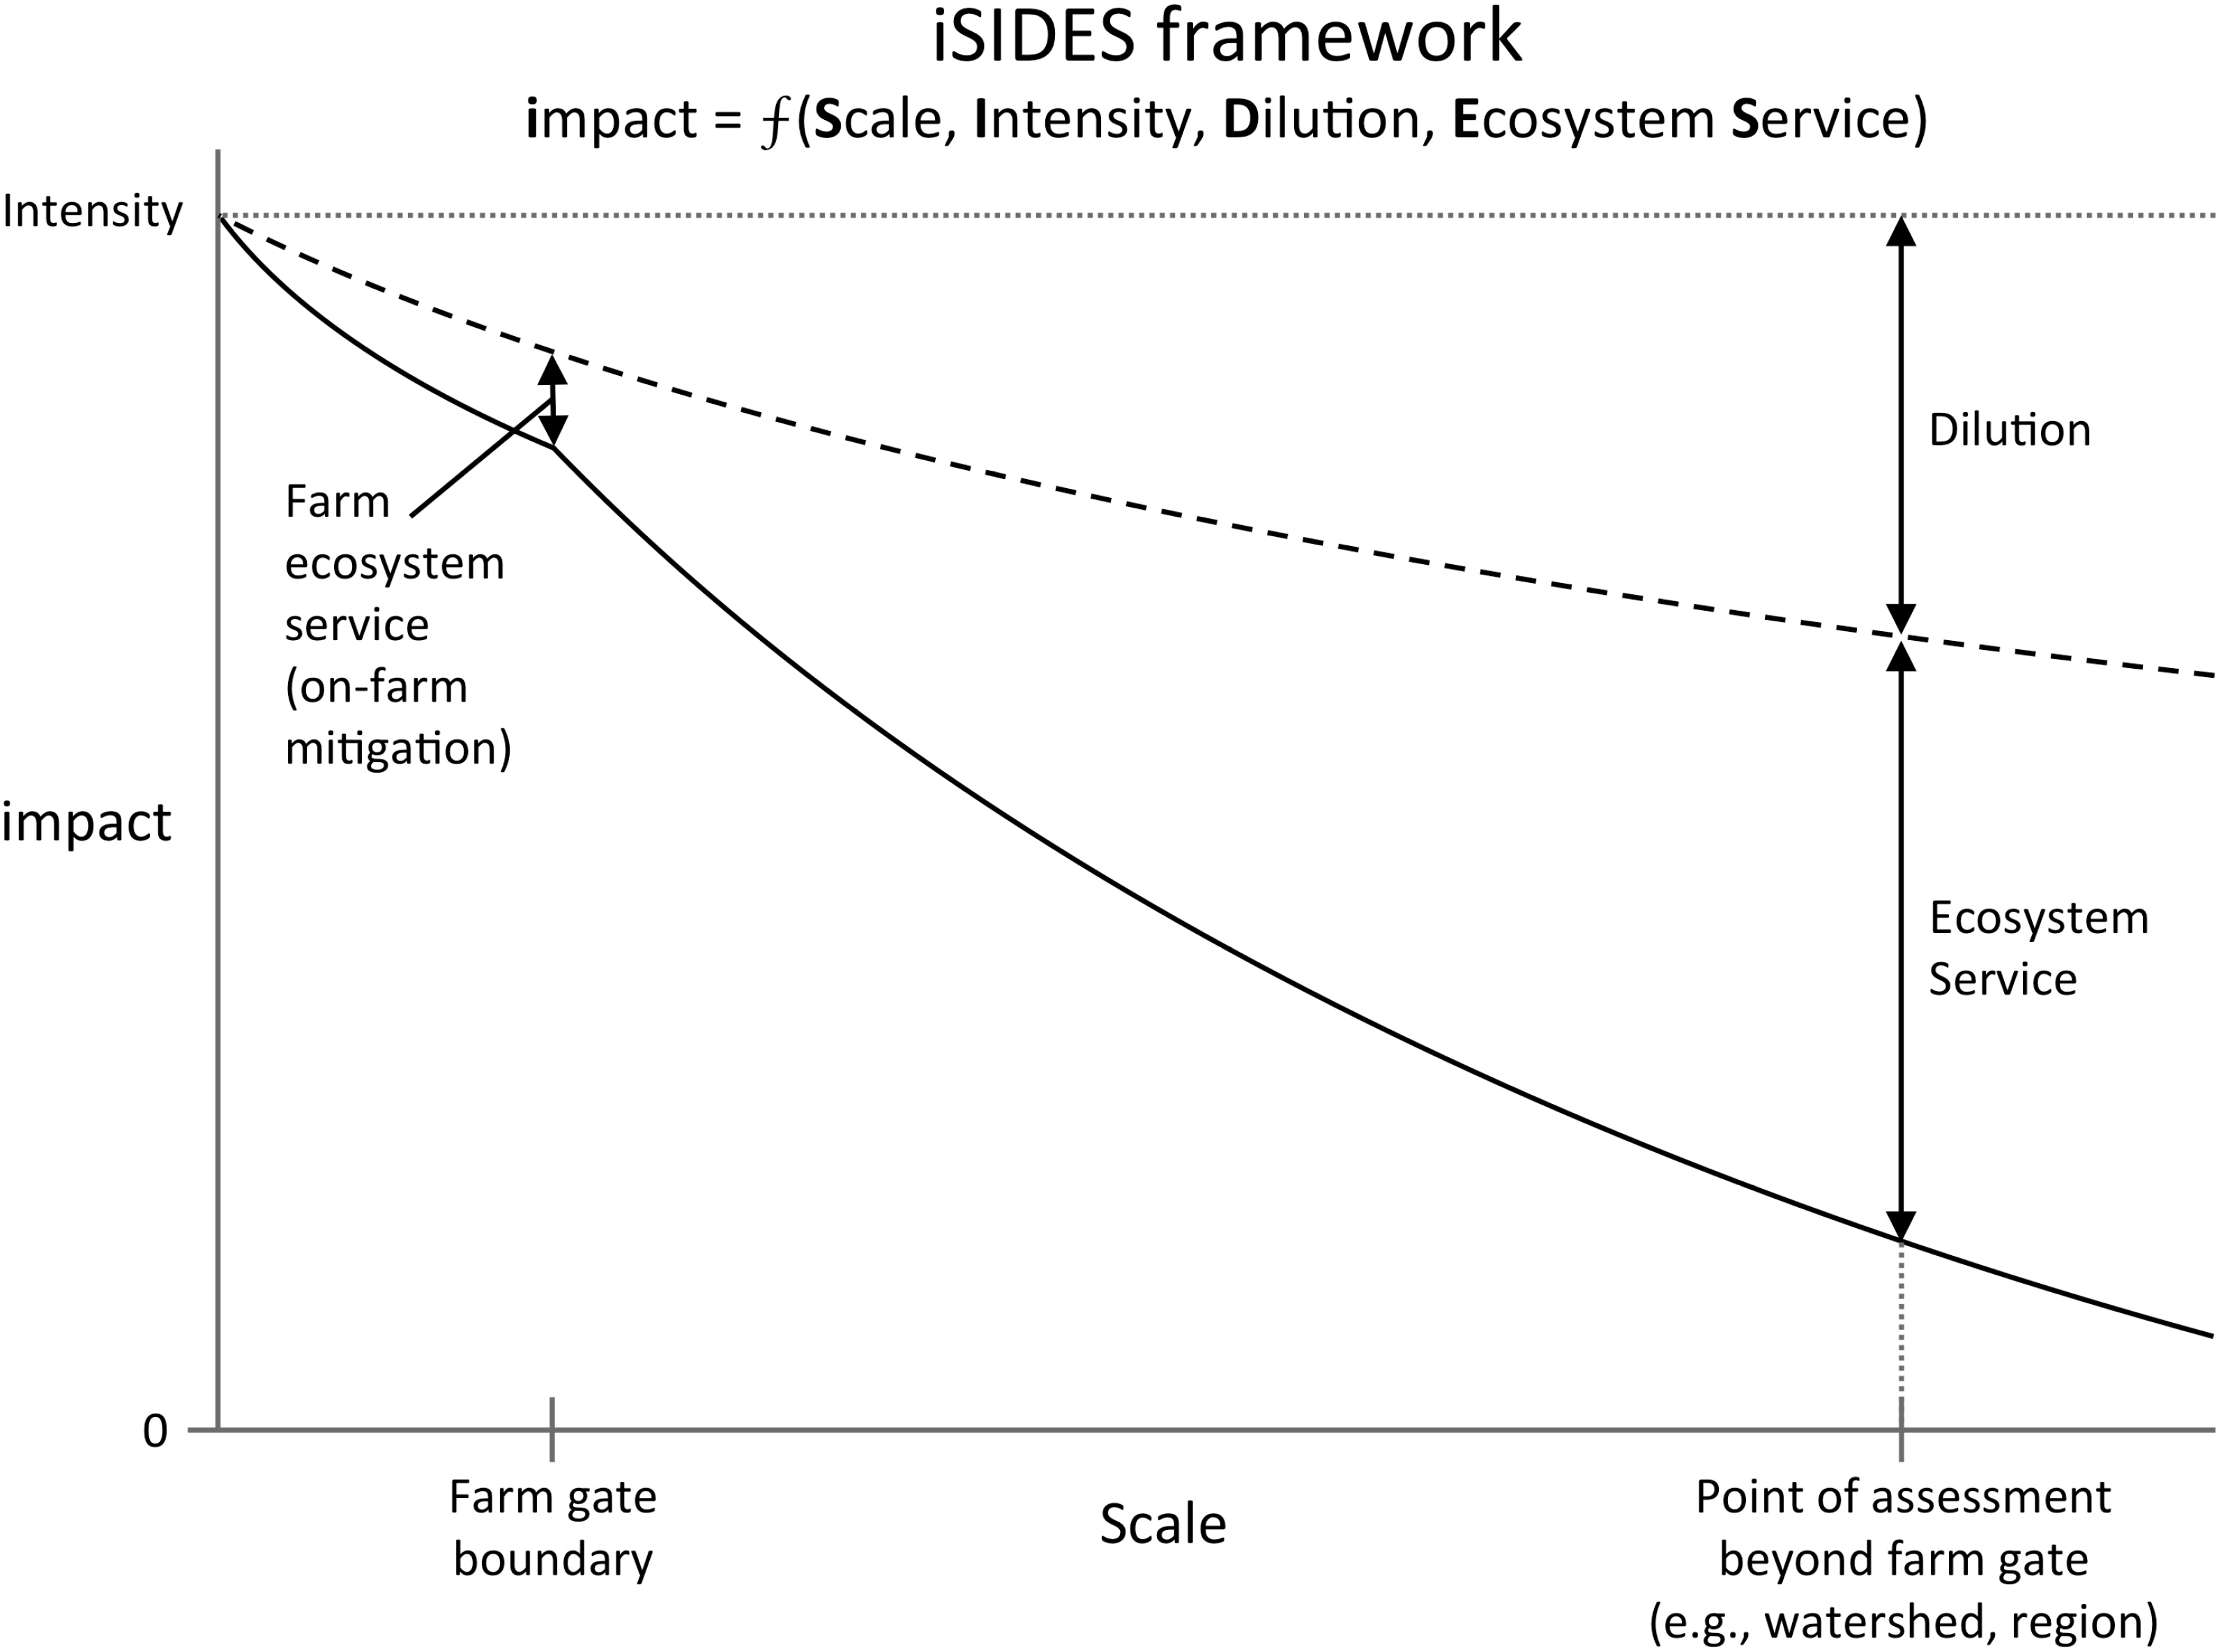
Figure 2 depicts the scale-dependent impact of a given agricultural practice (or, more generally, any land use), considered in isolation, on a chosen environmental metric. Within this general conceptual framework, hereafter referred to as iSIDES, ecosystem impact is understood to be a function of (1) the chosen spatial Scale of assessment; (2) the local Intensity of the disturbance in question; (3) the Dilution of that disturbance across the landscape; and (4) the mitigating Ecosystem Service capacity of the landscape.
Although the iSIDES conceptual framework is quite general, appropriate for conceptualizing the impact of agricultural land use change on a wide range of ecosystem services, a detailed description of its components will be clearer if grounded in a more specific context. We will therefore proceed to introduce in detail the various components of the iSIDES framework by applying the framework to the specific issue of nitrogen (N) pollution.
Figure 2.
The general form of the iSIDES framework, showing the relationship between impact (y-axis) of a human activity on some environmental characteristic and the attenuating detectability of that impact across Scale (x-axis), decreasing from its initial Intensity due to Dilution and regulating Ecosystem Services. The dashed line represents the scale-dependent dilution of the initial impact, while the solid line represents the measurable detection of that impact in the landscape, reduced beyond dilution due to the presence of regulating ecosystem services which accumulate over increasing scales.
2.2. Explanatory Application of the iSIDES Framework to N Pollution
2.2.1. Background
Nitrogen concentration is one of the criteria used by the Environmental Protection Agency to infer when a water body is impaired [
16]. Agricultural activity is a major source of excess reactive N released into the landscape (e.g., via nitrate leaching) [
17,
18], and natural ecosystem services mitigate its impacts on the environment [
19,
20]. Examples of ecosystem services relevant to N pollution include transport, uptake with long-term storage, and permanent removal via biological denitrification. Such services emerge across spatial scales, meaning that impacts of agriculture at one spatial scale may not transfer to broader spatial scales, in part because of these services. For example, though a farm may contribute elevated N loads to the streams draining its fields, its impact to downstream systems may be negligible due to a combination of dilution by the remainder of the watershed and denitrification along flow paths (
i.e., ecosystem services), provided the farm is situated within a watershed possessing denitrification capacity.
Once mobile N leaves its site of application and intended uptake (e.g., an agricultural field), removal may accumulate slowly along lengthy riverine flow paths or occur in spatially localized hotspots such as soils, forests, riparian areas, fluvial wetlands, lakes/reservoirs, and floodplains [
21]. Nitrogen flux is therefore determined by the accumulation of N sources and the demand for N at a given scale. Thus, as farming activity increases and spreads across a watershed, it is possible for denitrification and uptake to prevent the breakthrough of excess N from that watershed if the demand by aquatic processes along the entire flow path exceeds supply (
i.e., uptake capacity is not saturated) [
22,
23]. While modeling studies demonstrate that denitrification by river systems can remove 20%–50% of N loads on an annual basis, and even more during low flow periods [
23,
24,
25], the capacity of N regulating ecosystem services will vary regionally and across basins, depending on the locations of sources relative to flow path lengths and the distribution of hot spots of N removal. Demand for N is also tightly linked with the carbon cycle, itself impacted by land use change due to the fact that denitrification requires carbon sources and occurs only where oxygen is first removed by microbial respiration and decomposition of organic matter [
26]. For any given watershed, understanding how factors such as the intensity and spatial distribution of N sources, dilution processes, mitigating services, and scale interact offers the opportunity to manage the growth of agriculture in that watershed while minimizing negative impacts to downstream ecosystem services.
2.2.2. Impact
For N (
Figure 3), it is biologically meaningful to define impact (y-axis) as the N concentration in surface waters specifically attributable to a given agricultural activity, as measured at some chosen point of observation in the landscape. In the general iSIDES framework, other measures of impact may apply depending on the ecosystem service under consideration. For example, an impact could be a direct effect on an ecosystem service (e.g., fragmentation of wildlife habitat, where the provision of contiguous habitat is understood to be an ecosystem service); or, as in the case of N, an impact may be an environmental indicator (N concentration) of the functional status of an important ecosystem service (e.g., the provision of clean water).
2.2.3. Scale
Since moving water provides the mechanism for transporting N across a landscape, an appropriate definition of Scale (the x-axis,
Figure 3) in this case is distance along a flowpath, which roughly corresponds to drainage area. One informative scale at which to assess impact is at the farm boundary (e.g., a stream draining a farm), as this is the point where the measured impact may be attributed to the farm
as a whole, rather than to a single enterprise within the farming system. Then, because measurable N concentration (as impact) is governed by the interaction of N-producing activities and N-mitigating processes throughout an entire drainage area, another meaningful scale at which to assess impact is the boundary of a watershed (e.g., mouth of a river) within which a farm, a group of farms, or an entire farming region is situated. Depending on the intended application, other scales of assessment may also be considered. Scale is a rich concept within the iSIDES framework, providing not only meaningful points of impact assessment in a landscape, but also serving as the link between an individual farm’s activities and the cumulative dilution and ecosystem service capacities of its surrounding landscape.
Figure 3.
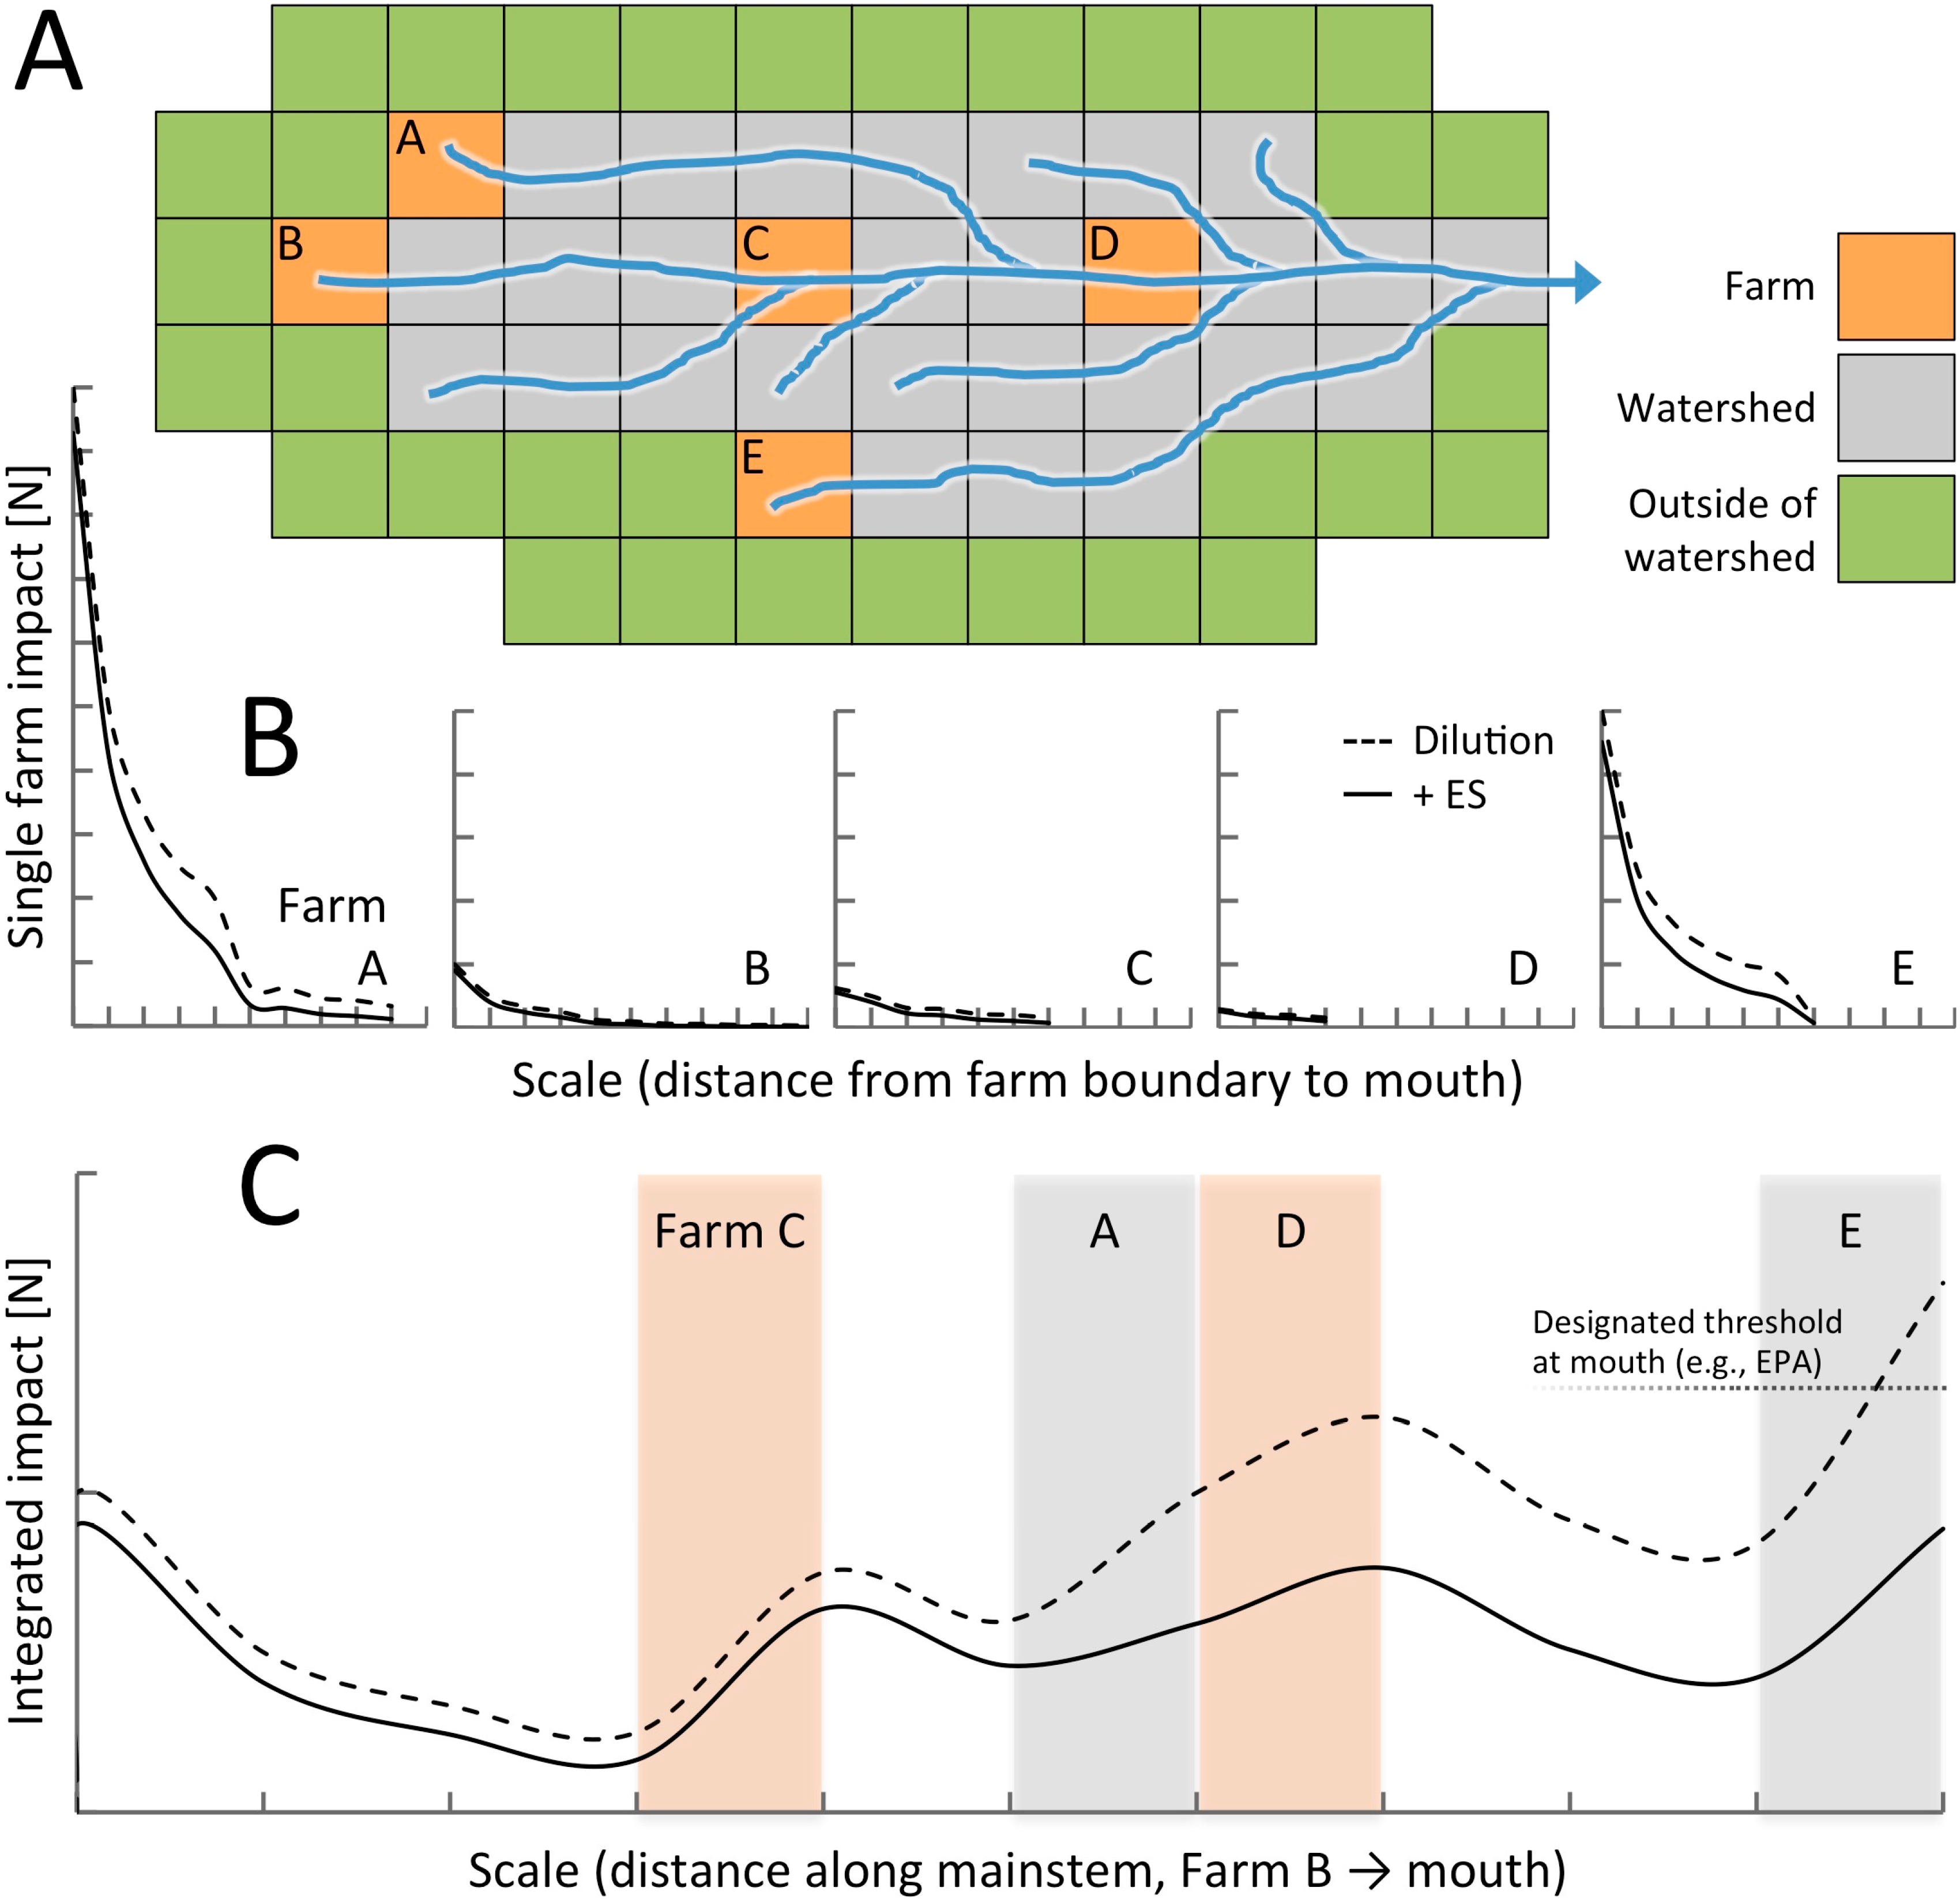
Demonstration of the iSIDES conceptual model in the context of understanding agricultural impacts to water quality via N pollution. (A) Model of river network draining a hypothetical watershed containing five dairy farms. Due to similar management practices, Farms B-E produce equivalent levels of on-farm excess N, while Farm A’s relatively more intensive management practices result in twice the production of on-farm excess N. Farms A, B, and E are located at headwaters; and Farm B has enhanced on-farm ecosystem services (90% catchment N removal due to enhanced riparian management, compared to 50% for the other farms); (B) Propagation through the watershed of the impact of each individual farm considered in isolation, after accounting for dilution only (dashed lines) and dilution plus N removal accumulated along the flowpath from each farm boundary to the basin mouth (solid lines). In this example, N removal is defined as a constant fraction of inputs within each river reach (i.e., grid cell). The initial impact on water quality (intercept) for each farm is determined by its intensity (excess N), its on-farm mitigation, and its location in the river network, which defines the initial dilution; (C) Integrated impact of all farms within the watershed along the longest surface water flow path (i.e., the mainstem, from Farm B to the mouth), accounting for cumulative local impacts, river network structure, dilution, and N removal. Letters indicate where the impact of each farm enters the mainstem, either directly or via tributary; and an example of a designated scale-specific threshold is indicated.
Figure 3.
Demonstration of the iSIDES conceptual model in the context of understanding agricultural impacts to water quality via N pollution. (A) Model of river network draining a hypothetical watershed containing five dairy farms. Due to similar management practices, Farms B-E produce equivalent levels of on-farm excess N, while Farm A’s relatively more intensive management practices result in twice the production of on-farm excess N. Farms A, B, and E are located at headwaters; and Farm B has enhanced on-farm ecosystem services (90% catchment N removal due to enhanced riparian management, compared to 50% for the other farms); (B) Propagation through the watershed of the impact of each individual farm considered in isolation, after accounting for dilution only (dashed lines) and dilution plus N removal accumulated along the flowpath from each farm boundary to the basin mouth (solid lines). In this example, N removal is defined as a constant fraction of inputs within each river reach (i.e., grid cell). The initial impact on water quality (intercept) for each farm is determined by its intensity (excess N), its on-farm mitigation, and its location in the river network, which defines the initial dilution; (C) Integrated impact of all farms within the watershed along the longest surface water flow path (i.e., the mainstem, from Farm B to the mouth), accounting for cumulative local impacts, river network structure, dilution, and N removal. Letters indicate where the impact of each farm enters the mainstem, either directly or via tributary; and an example of a designated scale-specific threshold is indicated.
![Sustainability 06 08432 g003]()
2.2.4. Intensity
The starting value of the impact curve is the peak impact (or Intensity) of a given disturbance, which necessarily occurs at the site of agricultural activity (
i.e., a particular location on a particular farm).
Figure 3A presents a model of a river network draining a watershed containing five dairy farms, and
Figure 3B shows the impact curves of those farms within this hypothetical watershed. In this example, Farms B–E share the same production practices (e.g., grazing cows); Farm A has a more intensive production system (e.g., confined cows); Farm B has enhanced on-farm N mitigation capacity (e.g., due to the presence of well-managed riparian buffers, swales,
etc.); and Farms A, B, and E are located at headwaters.
Taking the origin of the x-axis to be the farm boundary (i.e., the point where a farm drains into adjacent surface waters), the difference in the intensities of disturbance (y-intercepts) among these farms is attributable to three factors: (1) different agricultural production systems (e.g., a pasture-based dairy operation like Farm E, low intercept, versus a more intensive operation like Farm A, high intercept); (2) different levels of on-farm N mitigation (e.g., buffer strips providing on-farm N removal on Farm B versus no strips on Farm E); and (3) different scales at which N input to adjacent surface waters occurs (e.g., small stream vs. large river).
In general, intensity is determined primarily by the nature of an agricultural activity itself, including the size and spatial distribution of production operations, nutrient inputs, crop/animal uptake, N use efficiencies, and soil disturbances; and intensity will be inherently higher for some activities compared to others (e.g., the relative impact of various tillage regimes on soil loss and soil organic matter accumulation). In addition, factors such as land use conversion can also greatly influence intensity.
2.2.5. Dilution
As one moves away from a point of local disturbance, encompassing broader spatial scales, the measurable impact attributable to that disturbance will decline. Within the iSIDES framework, this purely scale-dependent reduction in impact is referred to as Dilution and is represented by the dashed curves in
Figure 3. In the specific case of N concentration, dilution is a function of the drainage area (
i.e., aggregate flow volume); in other words, the dashed curves represent the degree to which the initial impact (N concentration = amount of N per unit water) dilutes due to the growing volume of water encompassed by an ever-increasing catchment area. Since ecosystem services not only mitigate but are themselves impacted by land use disturbances, the extent of dilution realized is also a function of the aggregate level of disturbance. That is, as the number and intensities of impacts increase within a watershed, the dilution capacity of that watershed declines, as is currently the case in the Chesapeake, which has undergone considerable eutrophication as a result of widespread agricultural activity and urbanization [
27].
As shown in
Figure 3B, although Farms D and E are managed in the same manner and therefore have the same on-farm intensities, the detectable impacts of their operations at and beyond their farm boundaries differ due to the locations of those farms in the watershed (
i.e., the differential drainage areas at the points of entry into their adjacent surface waters). As a result, the intensity of initial impact, with respect to N concentration in surface waters, is far greater for Farm E than for Farm D; and although dilution acts to eventually reduce the detectable impact of Farm E to levels equivalent to those of Farm D, Farm E has a greater impact over a broader range of scale. Note that in this example the on-farm dilution of impact is considered negligible and constant across all five farms.
2.2.6. Ecosystem Services
Within the framework, Ecosystem Services mitigate impact beyond the effect of mere physical dilution and are represented by the difference between the impact dilution curve (dashed lines) and the measured impact (solid lines), at a chosen spatial scale (refer to
Figure 2). Ecosystem services accumulate with increasing scale; and in the example here, both terrestrial and aquatic ecosystem services, in the forms of N sequestration and denitrification, play a role.
Initially, the impact of an agricultural activity may be mitigated via terrestrial ecosystem services, some of which may be on-farm. For example, though Farms B and E share the same production practices, Farm B reduces the amount of N entering its adjacent headwaters through enhanced on-farm ecosystem services (e.g., 90% removal due to riparian buffers, swales, holding ponds, hedgerows,
etc. [
28]), as compared to Farm E. Once the runoff N leaves a farm boundary and enters surface waters, the measurable impact drops rapidly due to dilution (
i.e., a rapid increase in drainage area) and continues to fall due to both continued dilution and accumulated aquatic ecosystem services [
29]. Again, while this aquatic ecosystem service could be assessed relative to some criteria at any scale,
Figure 3 illustrates its assessment along the main branch, up to the watershed mouth.
2.2.7. Landscape Context
In general, the functional relationship between a farm’s impact and scale will resemble a monotonically decreasing, asymptotic curve which captures the aggregate effect of “landscape context” (Dilution + Ecosystem Services) on mitigating impact. Within any defined scale of interest, the presence and nature of a given farm has the potential to influence the landscape context of all other land use activities, activities which in turn define the landscape context of that farm. Despite this inherent complexity, however, it is instructive as a first approximation to assume a context-independent setting in order to visualize the scale-dependent impacts of individual agricultural activities in a given, static landscape (
Figure 3B).
2.2.8. Scale-dependent Thresholds
The utility of the iSIDES model lies in the fact that, though we have focused to this point on the simplified, individual impact curves of isolated land use activities, we are able to integrate those curves into a landscape curve, thereby quantifying the aggregated impact of all agricultural activities in concert. Though each farm's individual impact curve is relatively simple, when aligned based on relative location in the landscape, those simple curves can give rise to complex impact functions (
Figure 3C). The actual measurable impact in the landscape can therefore be understood to be a highly structured sum of the impact curves of all individual land use activities within the system. In other words, if the impact function of Farm X is:
then the impact of all n farms in a given landscape, within a domain bounded by the chosen scale of assessment, can be conceptualized as:
While the above summation is a useful first approximation, its indication of linear accumulation may not always be accurate, as when non-linearities occur in ecosystem services (e.g., denitrification rates increase at a slower rate than increasing N concentrations [
23,
29] (see below and
Figure 5 for further discussion).
A scale-dependent threshold is crossed when this integrated impact function for a landscape fails to reach some acceptable level at some critical scale, as indicated in
Figure 3C. The acceptable level at the chosen critical scale will depend upon the nature of the impact under consideration and may be set by local regulations or state or regional mandates. Crossing such a threshold is synonymous with creating a collective (
i.e., landscape-level) disturbance that exceeds the available mitigating processes (Dilution + Ecosystem Services) at a given scale.
In this example, one management threshold is defined at the watershed mouth, perhaps a critical coastal area. If N concentrations above the threshold level at that scale are detected, it indicates that the collective impact of the integrated landscape exceeds some management-relevant level. Knowing how the individual, underlying land use activities (
Figure 3B) contribute to this integrated function (
Figure 3C) provides a powerful entry point for making management decisions. Indeed, visualized in this way, it becomes clear that numerous points of leverage may be considered in order to manage the environmental impact of agricultural land use, with actual type of agricultural activity being just one, and of site-specific relevance.
2.2.9. Cross-Scale Impact, Cross-Scale Regulation
As formulated here, the iSIDES framework is novel not only because it explicitly includes the role of regulating ecosystem services in the determination of the level of impact but also because it incorporates a consideration of spatial extent (Scale), which is needed to account for both dilution effects as well as ecosystem services which accumulate over space. Because iSIDES considers scale, it can be applied to a variety of environmental problems that range in scale from local to global; and although the basis of iSIDES is a consideration of the impacts attributable to single, isolated land use activities within a given landscape scenario, by integrating the scale-dependent impacts of all such singly definable disturbances, an approximation of the landscape-level impact attributable to all disturbances in the landscape may be generated. In other words, iSIDES has the potential to model the total impact of arbitrarily large networks of disturbances, while considering the effects of scale.
With the general framework introduced and explained within the specific context of N pollution, we now focus on carbon (C) emissions as a different example which demonstrates how agricultural activity, dilution, ecosystem services, and spatial scale interact, and how the iSIDES framework may be used to conceptualize and prioritize various impact management strategies.
2.3. Application of the iSIDES Framework to C Emissions
iSIDES is a broadly useful conceptual framework, in part because of the flexibility of how one may define the axes, impact and Scale, in light of relevant mechanisms. Due to the highly structured flow paths of reactive N in waterways and the biological relevance of N concentration rather than total N mass, a logical choice for the impact metric in the N example was N concentration. For C, however, it is not the concentration of C emitted but rather the net C flux to the atmosphere attributable to a given agricultural disturbance that is relevant to managing the global C cycle [
30].
In the case of C emissions, then, the intercept (Intensity) is the local measure of net per unit area C flux due to the agricultural activity in question (
i.e., (total agricultural C emissions - total agricultural C sequestration)/(area × time)). Before proceeding, it is worth mentioning that the choice of C flux as one measure of impact is not meant to devalue other, more local impacts of C loss, including soil organic matter depletion and its associated fertility and productivity declines. Similar to the N case,
Figure 4 presents the impact curves (
Figure 4B) for five farms in a hypothetical forested landscape (
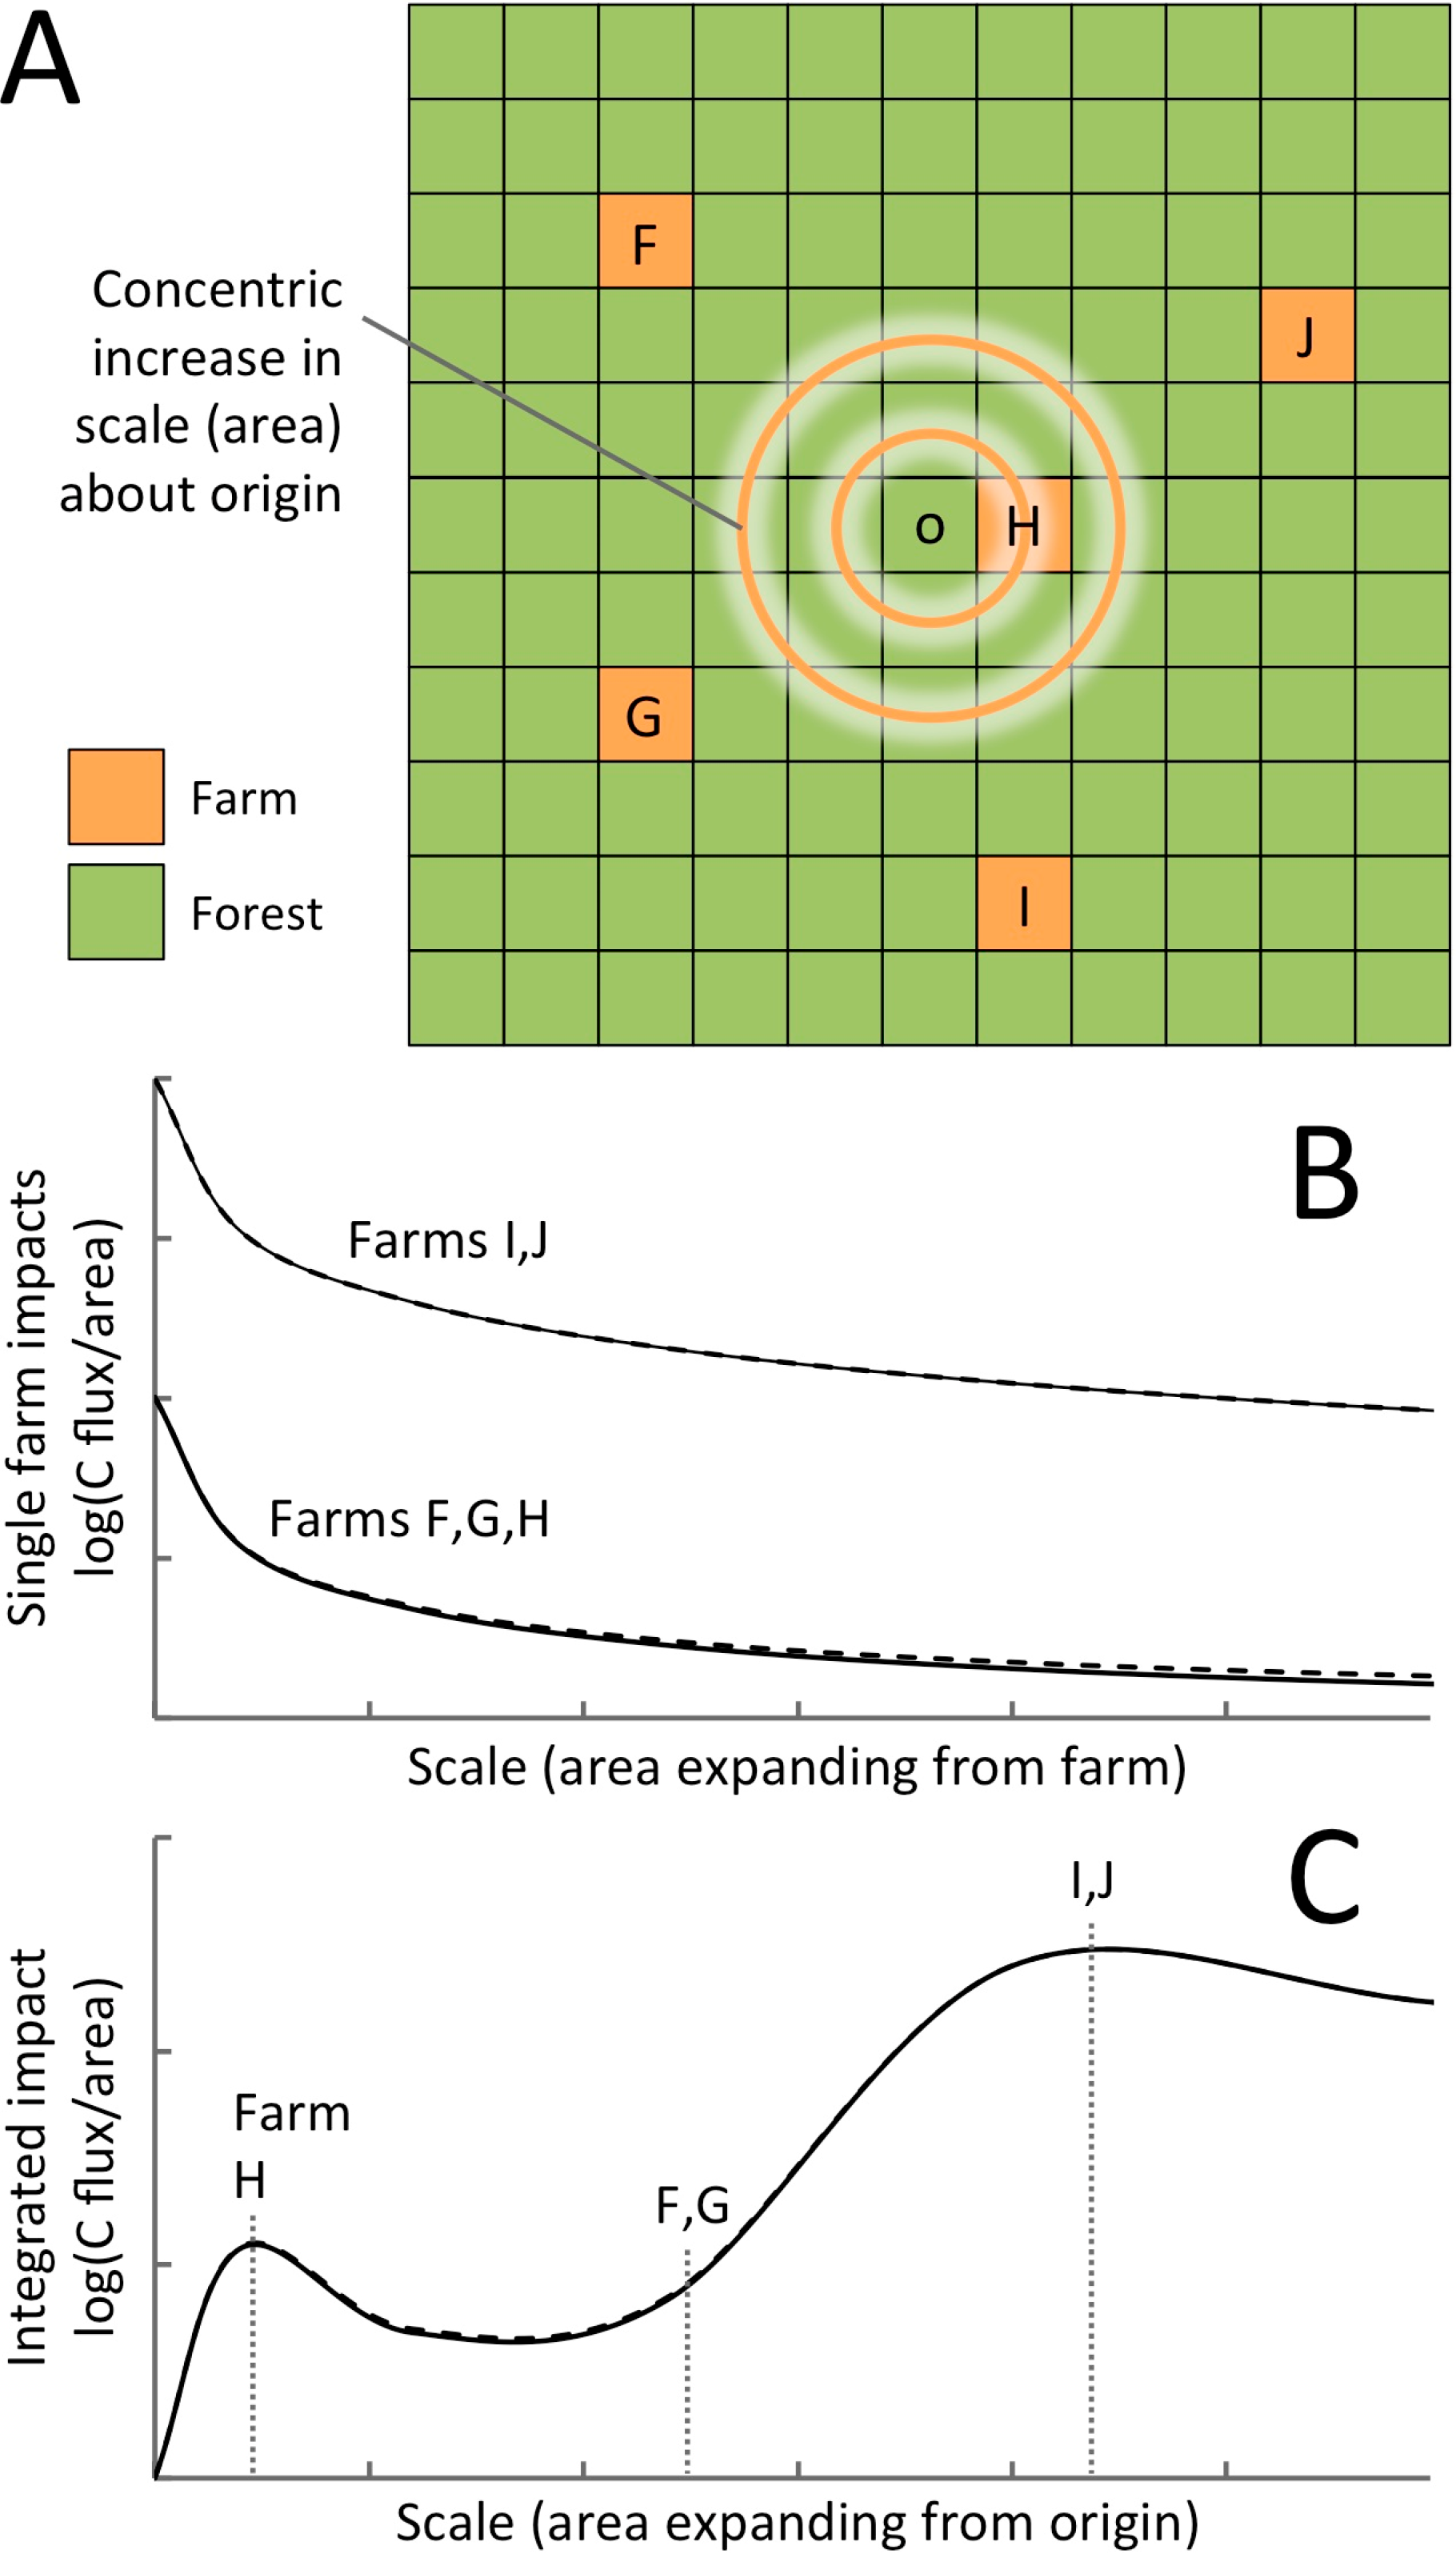
Figure 4A) over some period of time (e.g., their first year of operation). Due to the fact that C emissions, immediately upon release, become part of the global atmosphere, Scale in this case is represented simply as ever-increasing circular areas centered on the individual farms in question (
Figure 4A).
The relatively low intercepts for Farms F, G, and H reflect an intensification scenario in which the net positive C flux is due to intensified production activities (e.g., C release from additional soil cultivation, increased emissions from more frequently used farm equipment,
etc.). In contrast, Farms I and J represent extensification scenarios, wherein forest is cleared to provide land for agricultural operations. Even though the daily operations of the farms may be the same, the net C fluxes of Farms I and J are orders of magnitude higher than the others due to forest clearing and the initial release of substantial above- and belowground stores of C [
31,
32]. While the type of agricultural activity and the fate of the cleared wood products (e.g. burned
vs. utilized as long-lived wood products) must be taken into account when estimating the exact level of emissions due to this sort of agricultural extensification, low mitigation potential as indicated in the curves for Farms I and J is expected due to two reasons: (1) Agricultural fields in the region have significantly lower soil organic C sequestration rates than the forests they may replace [
33]; and (2) Even under favorable post-harvest assumptions, significant C release is at best delayed rather than avoided [
34].
It is worth noting that this type of analysis, including the labeling of agricultural land use change as “intensive” or “extensive”, is very sensitive to the choice of timeframe and is more concerned with the impact of present and future activities rather than historical land use decisions. For example, Farms F, G, and H, here taken as examples of agricultural intensification, were likely converted from forest to agriculture sometime in the past; but the impact on the C balance of those past extensification events are not included in this particular analysis.
Considered at broader spatial scales, the impact of a given agricultural operation on net per unit area C emissions declines primarily due to Dilution (dashed lines); and this dilution of a given farm’s impact is extremely rapid due to the fact that the area surrounding each farm increases exponentially as one radiates outward to higher scales. This stands in contrast to the N case, in which drainage area increases in a punctuated manner, with initial flow paths accumulating area roughly linearly until tributaries are met, resulting in a somewhat slower overall dilution effect. Also in contrast to N, there is little, if any, ecosystem service capacity available to further attenuate impact. Though heavily forested, New England currently sequesters far less than its total C emissions [
35], and the region’s C sequestration capacity can be considered saturated due to the presence of excess C emissions from the global system, leaving no additional sequestration capacity to offset increased agricultural impacts. As a result, the iSIDES model for C indicates no appreciable difference between the dilution and ecosystem service lines in
Figure 4B,C.
Figure 4.
Application of the iSIDES framework to conceptualize the impact of increased farming activity on regional carbon cycling. (A) Gridded map of hypothetical forested landscape containing five farms. Due to their having similarly intensive agricultural management practices, Farms F, G, and H release equivalent levels of C; Farms I and J, however, release orders of magnitude more C due to agricultural extensification (i.e., forest clearing); (B) Impact of individual farm C emissions, as detected at increasingly broader scales, after accounting for dilution only (dashed lines) and dilution plus a marginal increase in C sequestration hypothetically achievable through management of encompassed forestlands (solid lines). In this example, C sequestration is defined as a constant value, independent of the magnitude of C emissions; (C) Integrated impact of all farms within the landscape, as one increases scale concentrically from the origin (grid cell labeled “o”), accounting for cumulative local impacts, dilution, and C sequestration. Letters indicate the points at which individual farms are encompassed by the radially-increasing domain.
![Sustainability 06 08432 g004]()
With their precipitous dilution effects, almost indiscernible ecosystem service effects, and widely varying impact scales between the intensification and extensification scenarios, the graphs in
Figure 4B reveal some important points. First, the iSIDES framework suggests that management strategies for C flux should focus foremost on Intensity (e.g., minimizing the agricultural conversion of land with large C stores), recognizing that the primary mechanism of impact mitigation is Dilution rather than direct, manageable mitigation via regulating ecosystem services (e.g., C sequestration). This stands in marked contrast to the N example, in which regulating ecosystem services, both on-farm and at higher scales, emerge as potential viable management mechanisms, alongside reduction of Intensity.
Second, while some marginal enhancement of landscape-level C sequestration may be realized (e.g., via optimized forest management practices, reduced tillage, planting trees on abandoned agricultural lands,
etc.; [
35,
36]), such increases in regional sequestration capacity are likely to be both relatively small and, due to excess global atmospheric C, independent of increasing C emissions associated with agricultural land use change. This contrasts with the N case, in which the absolute levels of regulating ecosystem services may increase with impact, though perhaps still fall short of compensating for that impact, as long as watersheds are not N saturated. Although currently many watersheds in New England do not appear to be N saturated, some evidence suggests with continued increases in N loading they may eventually approach saturation [
23].
2.4. iSIDES and the Kinetics of Regulating Ecosystem Services
Based on the above considerations, we hypothesize that the capacity of regulating ecosystem services to attenuate impacts follows a modified saturating function (
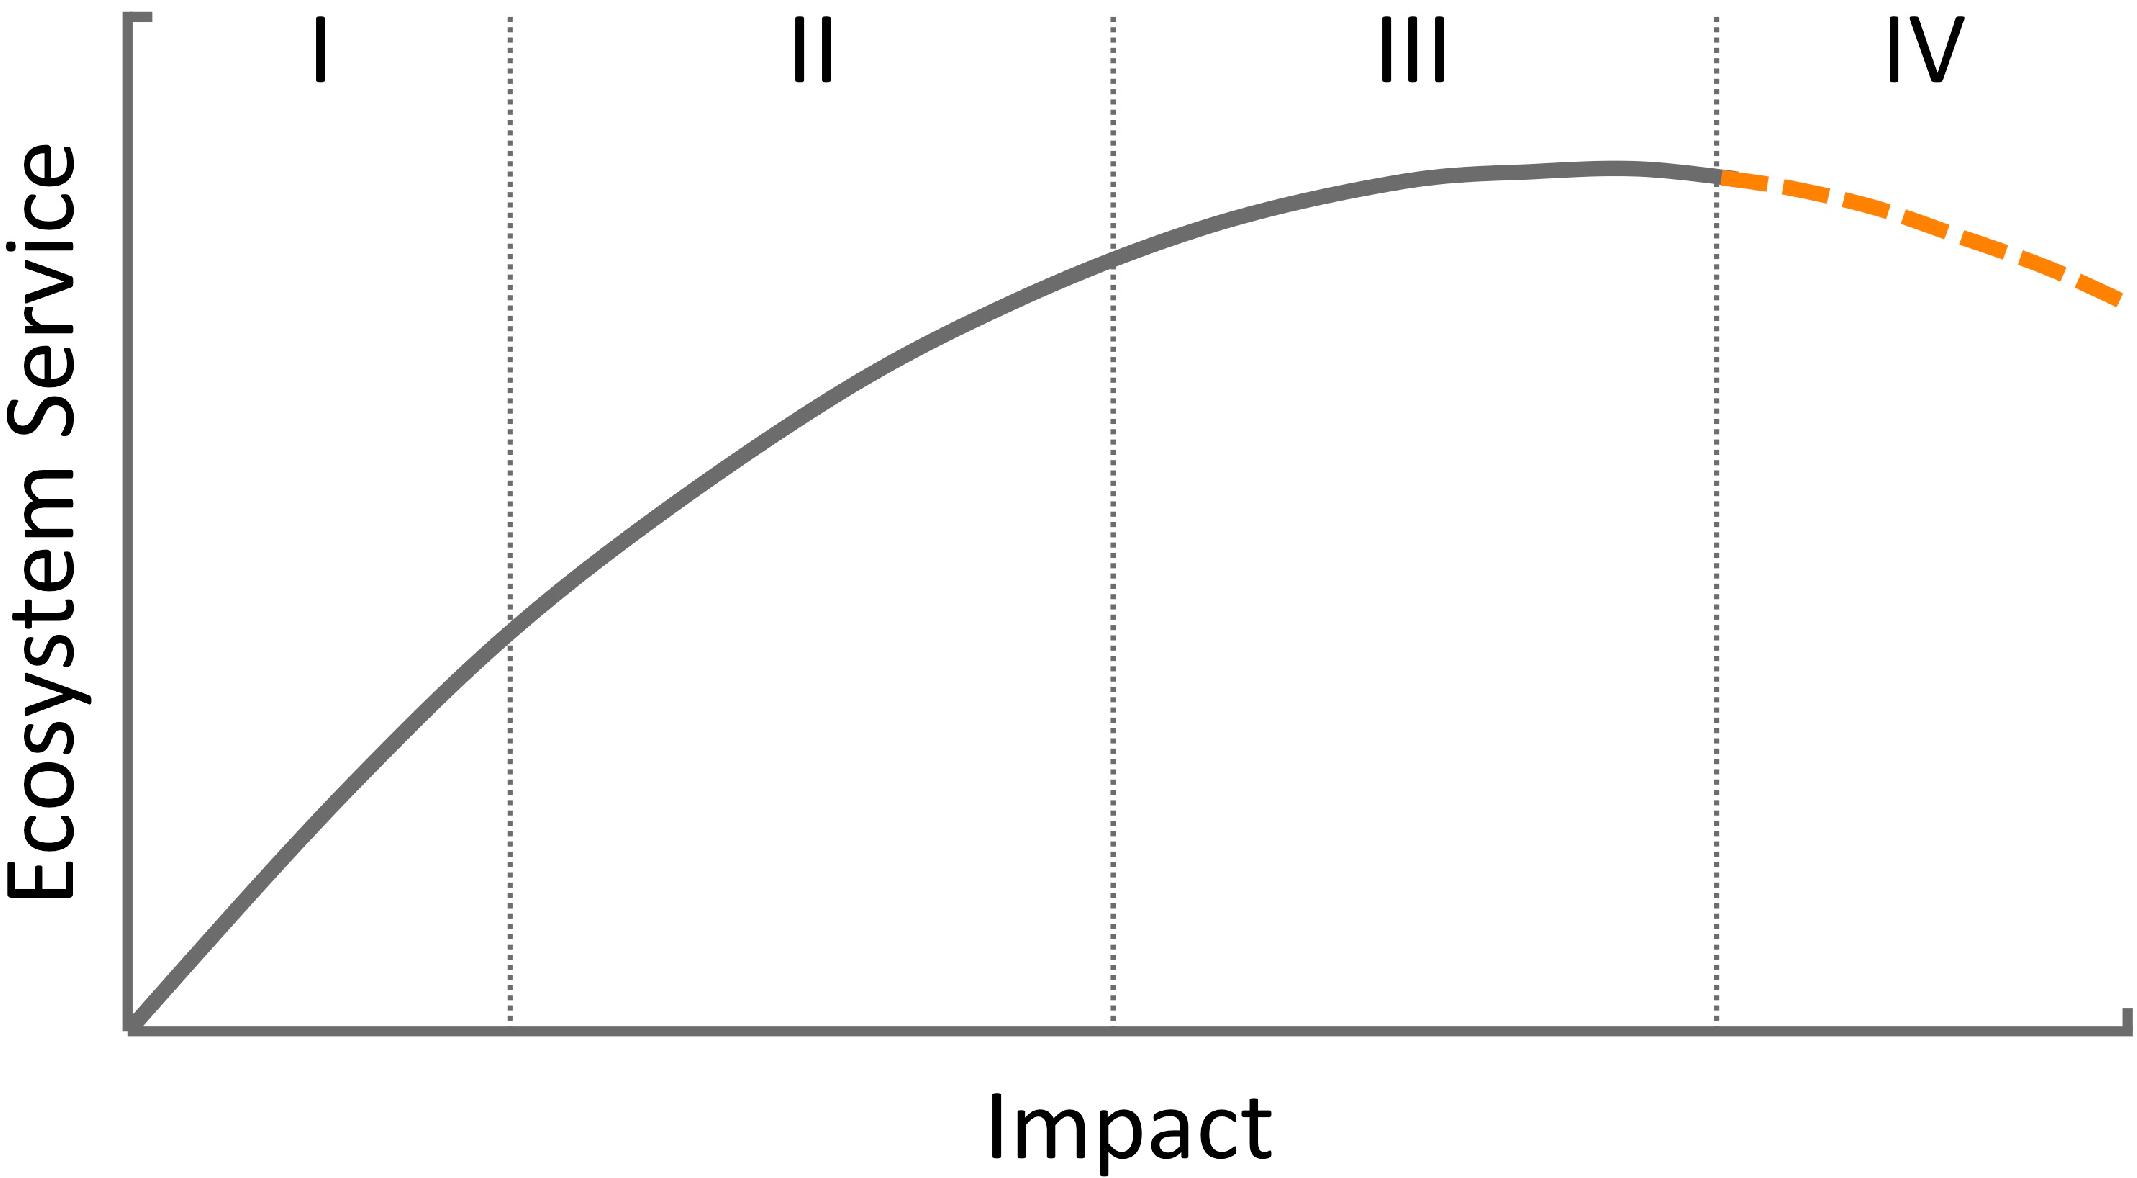
Figure 5). Different ecosystem services can be characterized in terms of whether they continue to increase in proportion to impact (Zone I), increase more slowly (efficiency loss, Zone II), increase not at all (Zone III), or decrease (Zone IV). For example, previous work focused on N removal by aquatic ecosystems suggests that, in a watershed with relatively high N loading (the Ipswich, draining suburban Boston, MA), this service is at the lower end of Zone II [
23]. More pristine watersheds in the region are likely in Zone I. For C in our example, since sequestration capacity is already exhausted in the region (
i.e., currently far more C is emitted than sequestered [
37,
38]), there is little possibility of increase due to additional impact (Zone III). If anything, the region’s C sequestration capacity may decline with increasing impact, particularly under agricultural extensification scenarios in which native landforms are replaced by land use activities with reduced sequestration capacity; hence, ultimately, the possibility of declining services with increasing impact (Zone IV). Similar responses have been demonstrated for changes in provisioning services such as water supply in response to increasing urbanization (e.g., see Figure 8 in [
39]).
Establishing the location of place-specific regulating ecosystem services on the proposed kinetics graph (
Figure 5) is critical to the accurate application of the iSIDES model and thus to the identification of relevant impact assessment and management strategies. Also, in the case of ecosystem services which lie within the “saturated” zone of the graph (like C sequestration), it is clear that great care must be taken when applying the iSIDES framework not to overestimate a landscape’s ecosystem service capacity through double-counting. Unlike the N case, in which the ecosystem service-mitigated impact at the landscape level may be approximated through the sum of the individually mitigated impacts across the landscape, for C the actual landscape level impact is higher than the sum of the individually mitigated impacts because the marginal increase in C sequestration capacity is fixed and does not scale with impact. This, along with the fact that dilution is essentially the sole mechanism of mitigation, makes C emissions inherently a higher-scale issue than N pollution.
Figure 5.
Fundamental to the application of the iSIDES framework is an understanding of the kinetics of the regulating ecosystem service under consideration (i.e., the manner in which increasing impact, due to agricultural land use change or other pressures, will likely affect an ecosystem service under specified conditions). In this suggested typology, resembling a modified saturation curve, an ecosystem service may be classified as falling within one of four zones: (I) Robust: the service increases linearly with increasing impact; (II) Challenged: the increase in service declines with increasing impact; (III) Saturated: there is no service response under increasing impact; or (IV) Deteriorating: the service declines under increasing impact.


