1. Introduction
Recently, due to innovative IT computing technologies, manual operations that required huge amounts of labor have been automated. In addition, the enhanced performance and convenient portability of diverse smart devices (for instance, digital cameras, smart TV, smartphones and tablet PCs) have increased leisure time and work efficiency. This has been possible because an organic topology has been formed among many diverse smart devices grafted onto real life. These smart devices use cloud services because of limited resources (for instance, CPU performance, memory size and storage size). In general, cloud services are divided into infrastructure as a service (IaaS), platform as a service (PaaS) and software as a service (SaaS), according to the services provided [
1,
2,
3,
4,
5]. These cloud services are provided to users internally using virtualization. Desktop resource virtualization enables cloud services using the virtualization of many existing desktop PCs. For the high availability and sustainability of these desktop PC resources, clustering for hierarchical structures is very important [
6,
7,
8,
9,
10,
11,
12,
13]. Therefore, many algorithms have been developed, such as centroid-based clustering [
14], distribution-based clustering [
15], density-based clustering [
16] and connectivity-based clustering [
17]. However, selecting optimized algorithms according to the environment is very difficult. In addition, directly testing the definitions and ratios of elements for clustering requires a great amount of time. For this reason, in the present paper, a desktop resource virtualization clustering simulator (DRV-CS), an efficient simulator for selecting desktop virtualization clusters to be maintained sustainably, is proposed. The DRV-CS provides simulations by reading XML-based host information for efficient host clustering. With the simulator, the applicability to clustering algorithms can be tested by visualizing clustering operation processes as two-dimensional (2D) or 3D views. The simulator also provides interfaces that can be added by users, so that diverse clustering algorithms can be simulated and clustering algorithms can be selected.
The present paper is composed as follows. In
Section 2, previous studies on the visualization of and simulators for resource management, scheduling, clustering,
etc., are examined. In
Section 3, 2D and 3D configuration methods for simulating the DRV-CS are discussed. In
Section 4, the design of the DRV-CS is explained, and in
Section 5, the implementation of the DRV-CS is explained. In
Section 6, simulation operation speeds are evaluated according to the number of desktop PCs. Finally,
Section 7 is composed of a summary of the overall conclusions and comments on future studies.
2. Related Works
Studies on the visualization of and simulators for resource management, scheduling, clustering,
etc., were examined as follows. The growing hierarchical self-organizing map (GHSOM) [
18] investigated the visualization of cellular manufacturing systems based on self-organizing maps (SOMs) for the clustering of similar manufacturing parts and machines for producing those parts. For visualization, criteria for convergence, calculation time and quantization errors for the implementation of GHSOM algorithms were considered. Since this method is fixed in the present paper, user-setting interfaces for visualizing diverse experiments are provided.
The Veritas Cluster Server (VCS) simulator [
19] can be operated only in Windows systems and does not require additional hardware. This simulator enables users to compose clusters. In addition, it provides simulations for service groups and resource composition and failover. However, there are difficulties in the analysis, because the simulator provides command line interface (CLI)-based interfaces and shows text-based results. Therefore, in the present paper, graphic user interface (GUI)-based interfaces and visualization for easy analyses are provided.
GridSim [
20,
21] is a Java-based simulator for scheduling algorithms. GridSim’s resource entity can express the number of processors of individual resources that are multi-processors, the cost of processing, the speed of processing and internal process scheduling policies. Although virtual environments can be easily simulated through GridSim, there are difficulties, since users must write program source code in order to manipulate the diverse variables necessary for resource analysis and convert the results into charts,
etc. Therefore, in the present paper, visualization is provided for a GUI-based resource setting, operation processes and results.
ClusterSim [
22] is a Java-based parallel discrete-event simulation tool. ClusterSim supports the clusters’ workload and visual modeling. In addition, the simulator enables users to designate clusters and can simulate message passing interfaces (MPI) between clusters and parallel job scheduling algorithms,
etc. However, this simulator does not have functions for selecting clusters in desktop PC resource environments consisting of heterogeneous or homogeneous clusters, and users must manually designate clusters. Therefore, the algorithm operations for cluster selections cannot be easily understood.
CloudSim [
23] supports behavior modeling of the data center, virtual machine (VM), resource provisioning policies,
etc., with cloud system configurations. In addition, CloudSim can allocate VMs among networks through user-defined interfaces. However, there are difficulties in understanding the cause of problems and operation processes, because text-based results are derived. In addition, desktop resource virtualization is not considered in data center configuration. Therefore, in the present paper, visualization of the host-based clustering operation process is provided for efficient operation of desktop resources.
3. DRV-CS Scheme
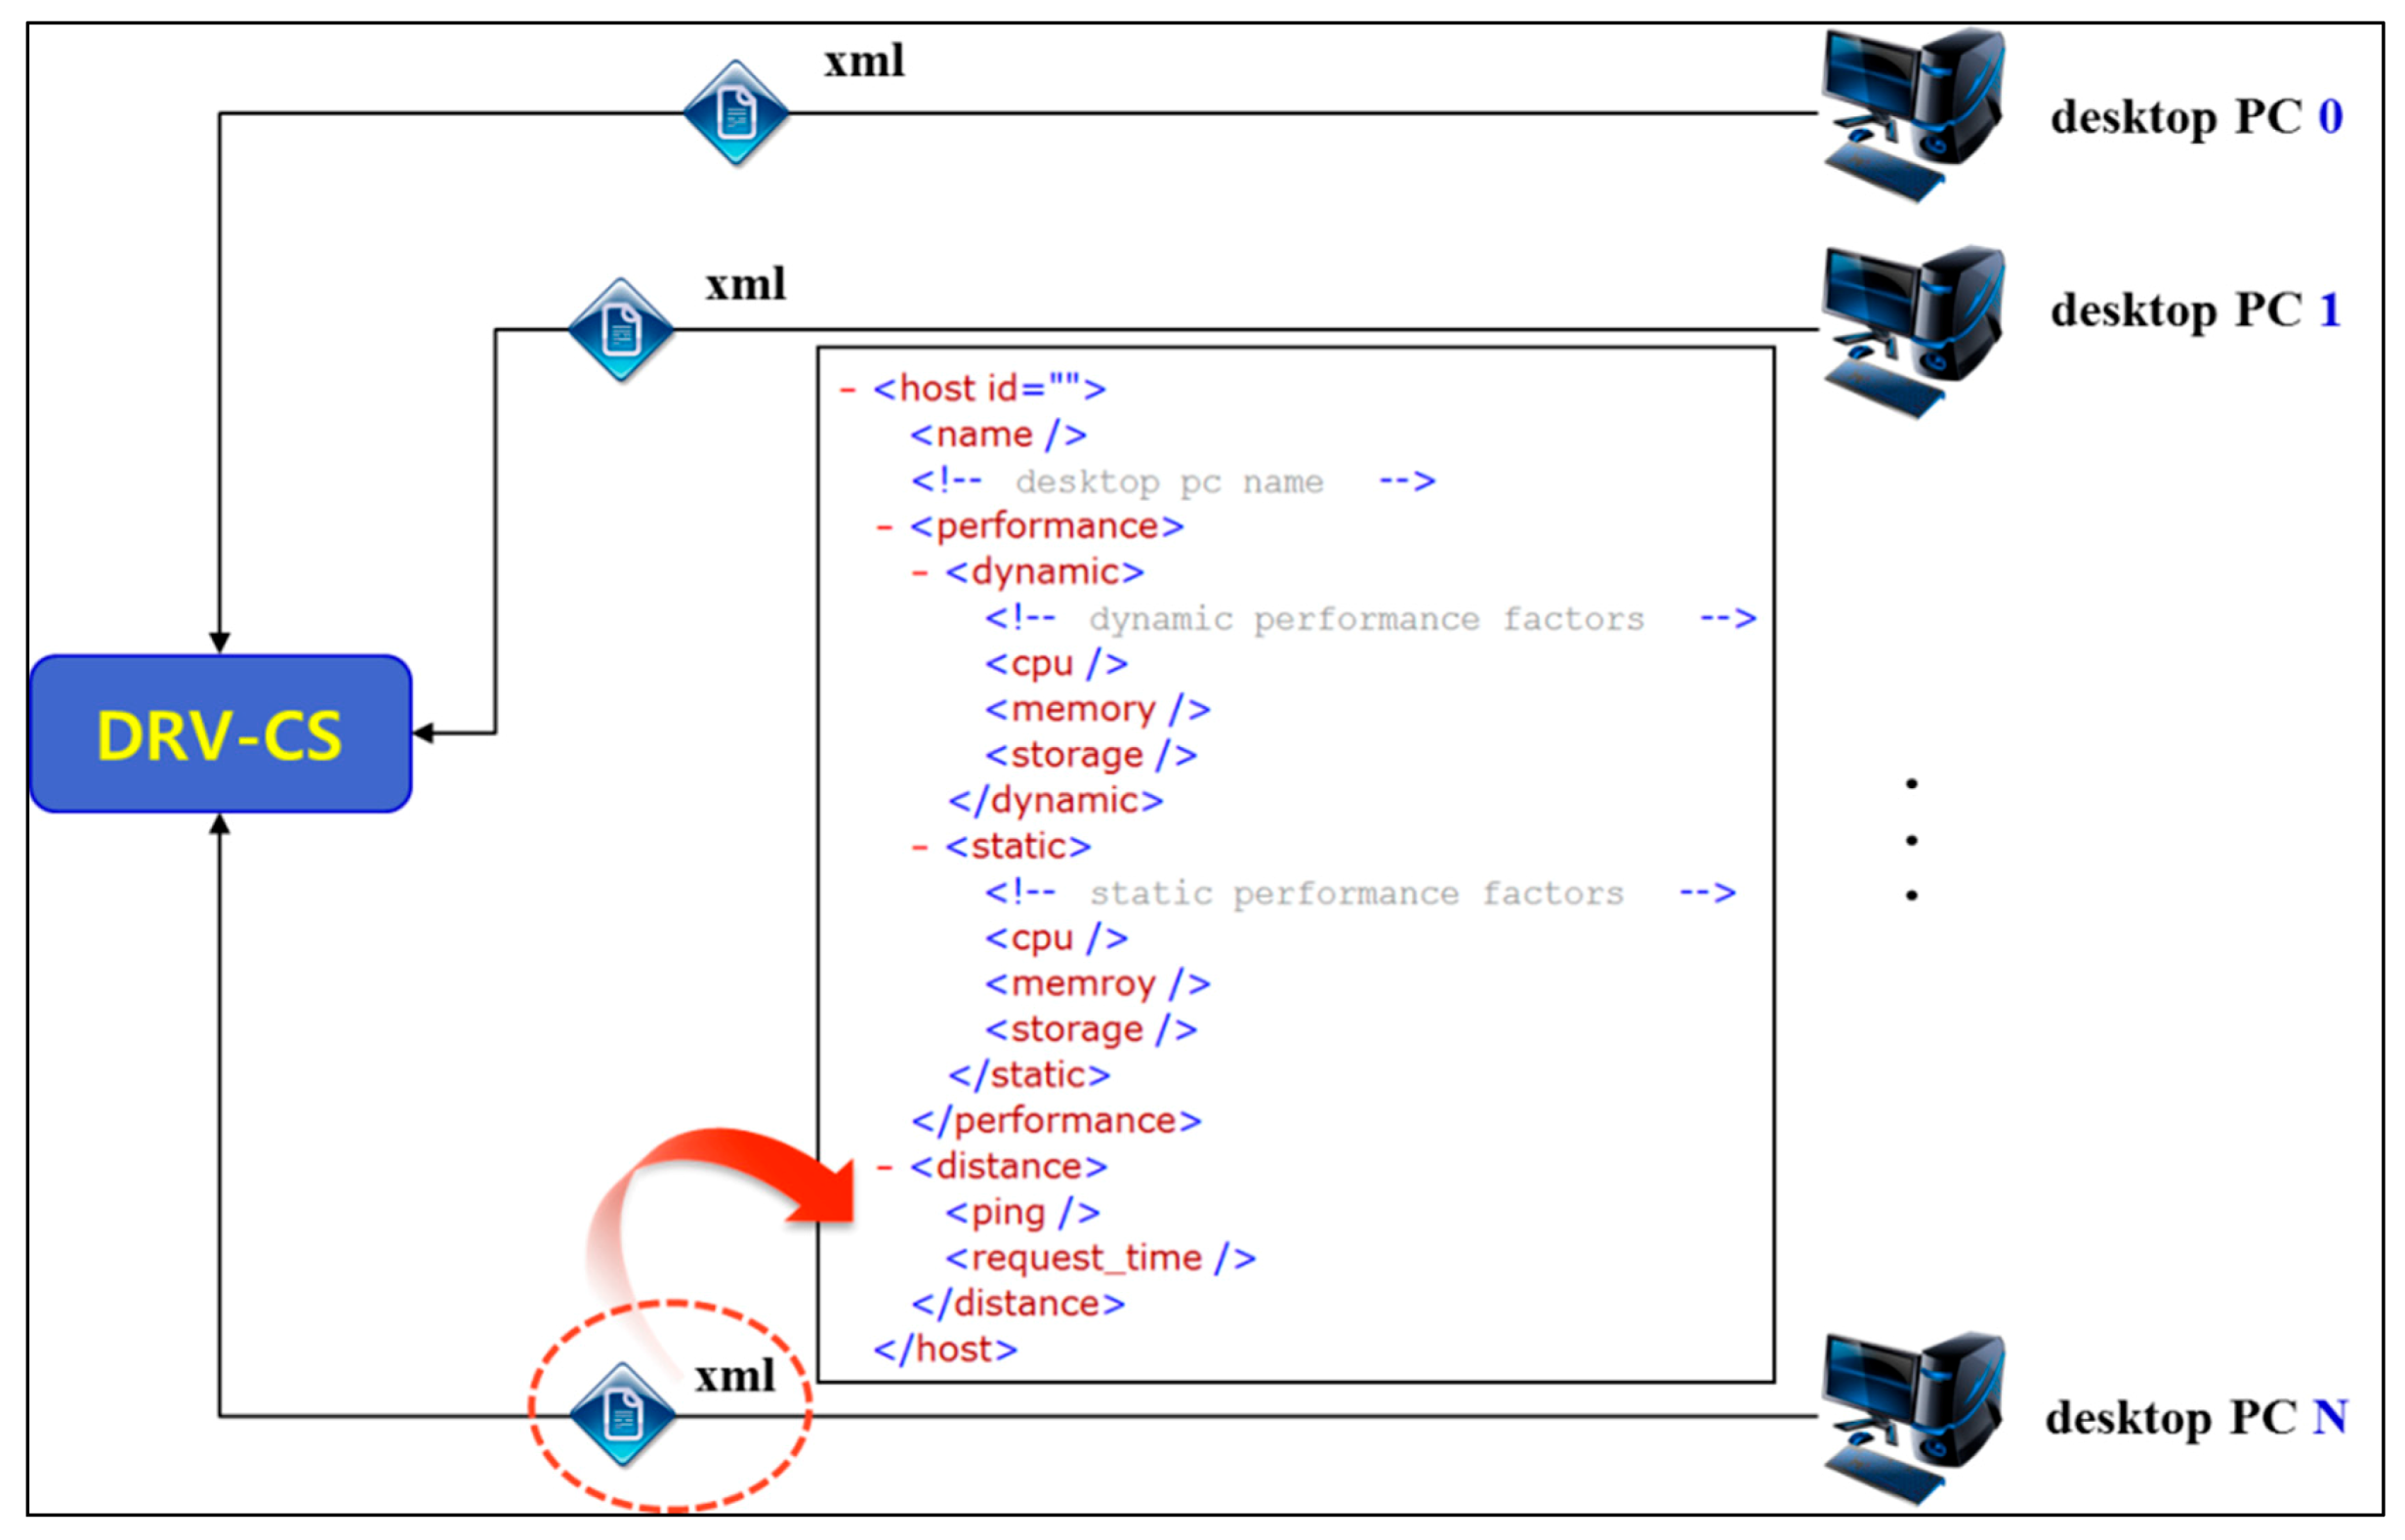
For desktop resource clustering, the DRV-CS receives desktop PC information in the form of XML, as shown in
Figure 1. In addition, for simulations of the clustering of heterogeneous desktop PCs, the DRV-CS also provides user interfaces that create arbitrary desktop information.
The basic clustering DRV-CS elements are divided into distances and performance, and a detailed explanation is shown in
Table 1.
Figure 1.
XML scheme of desktop PC for the desktop resource virtualization clustering simulator (DRV-CS).
Figure 1.
XML scheme of desktop PC for the desktop resource virtualization clustering simulator (DRV-CS).
Table 1.
DRV-CS’s basic clustering elements.
Table 1.
DRV-CS’s basic clustering elements.
| Clustering Element | Content |
|---|
| Distance | - -
ping: time measurement by ping
|
- -
request time: the time to connect individual hosts in which the DRV-CS is operated and the time to respond to individual hosts in cases where time measurement by ping is impossible
|
| Performance | - -
dynamic performance factors: idle CPU performance, size or residual memory and storage
|
- -
static performance factors: performance of the basic CPU installed, maximum size of the memory and storage
|
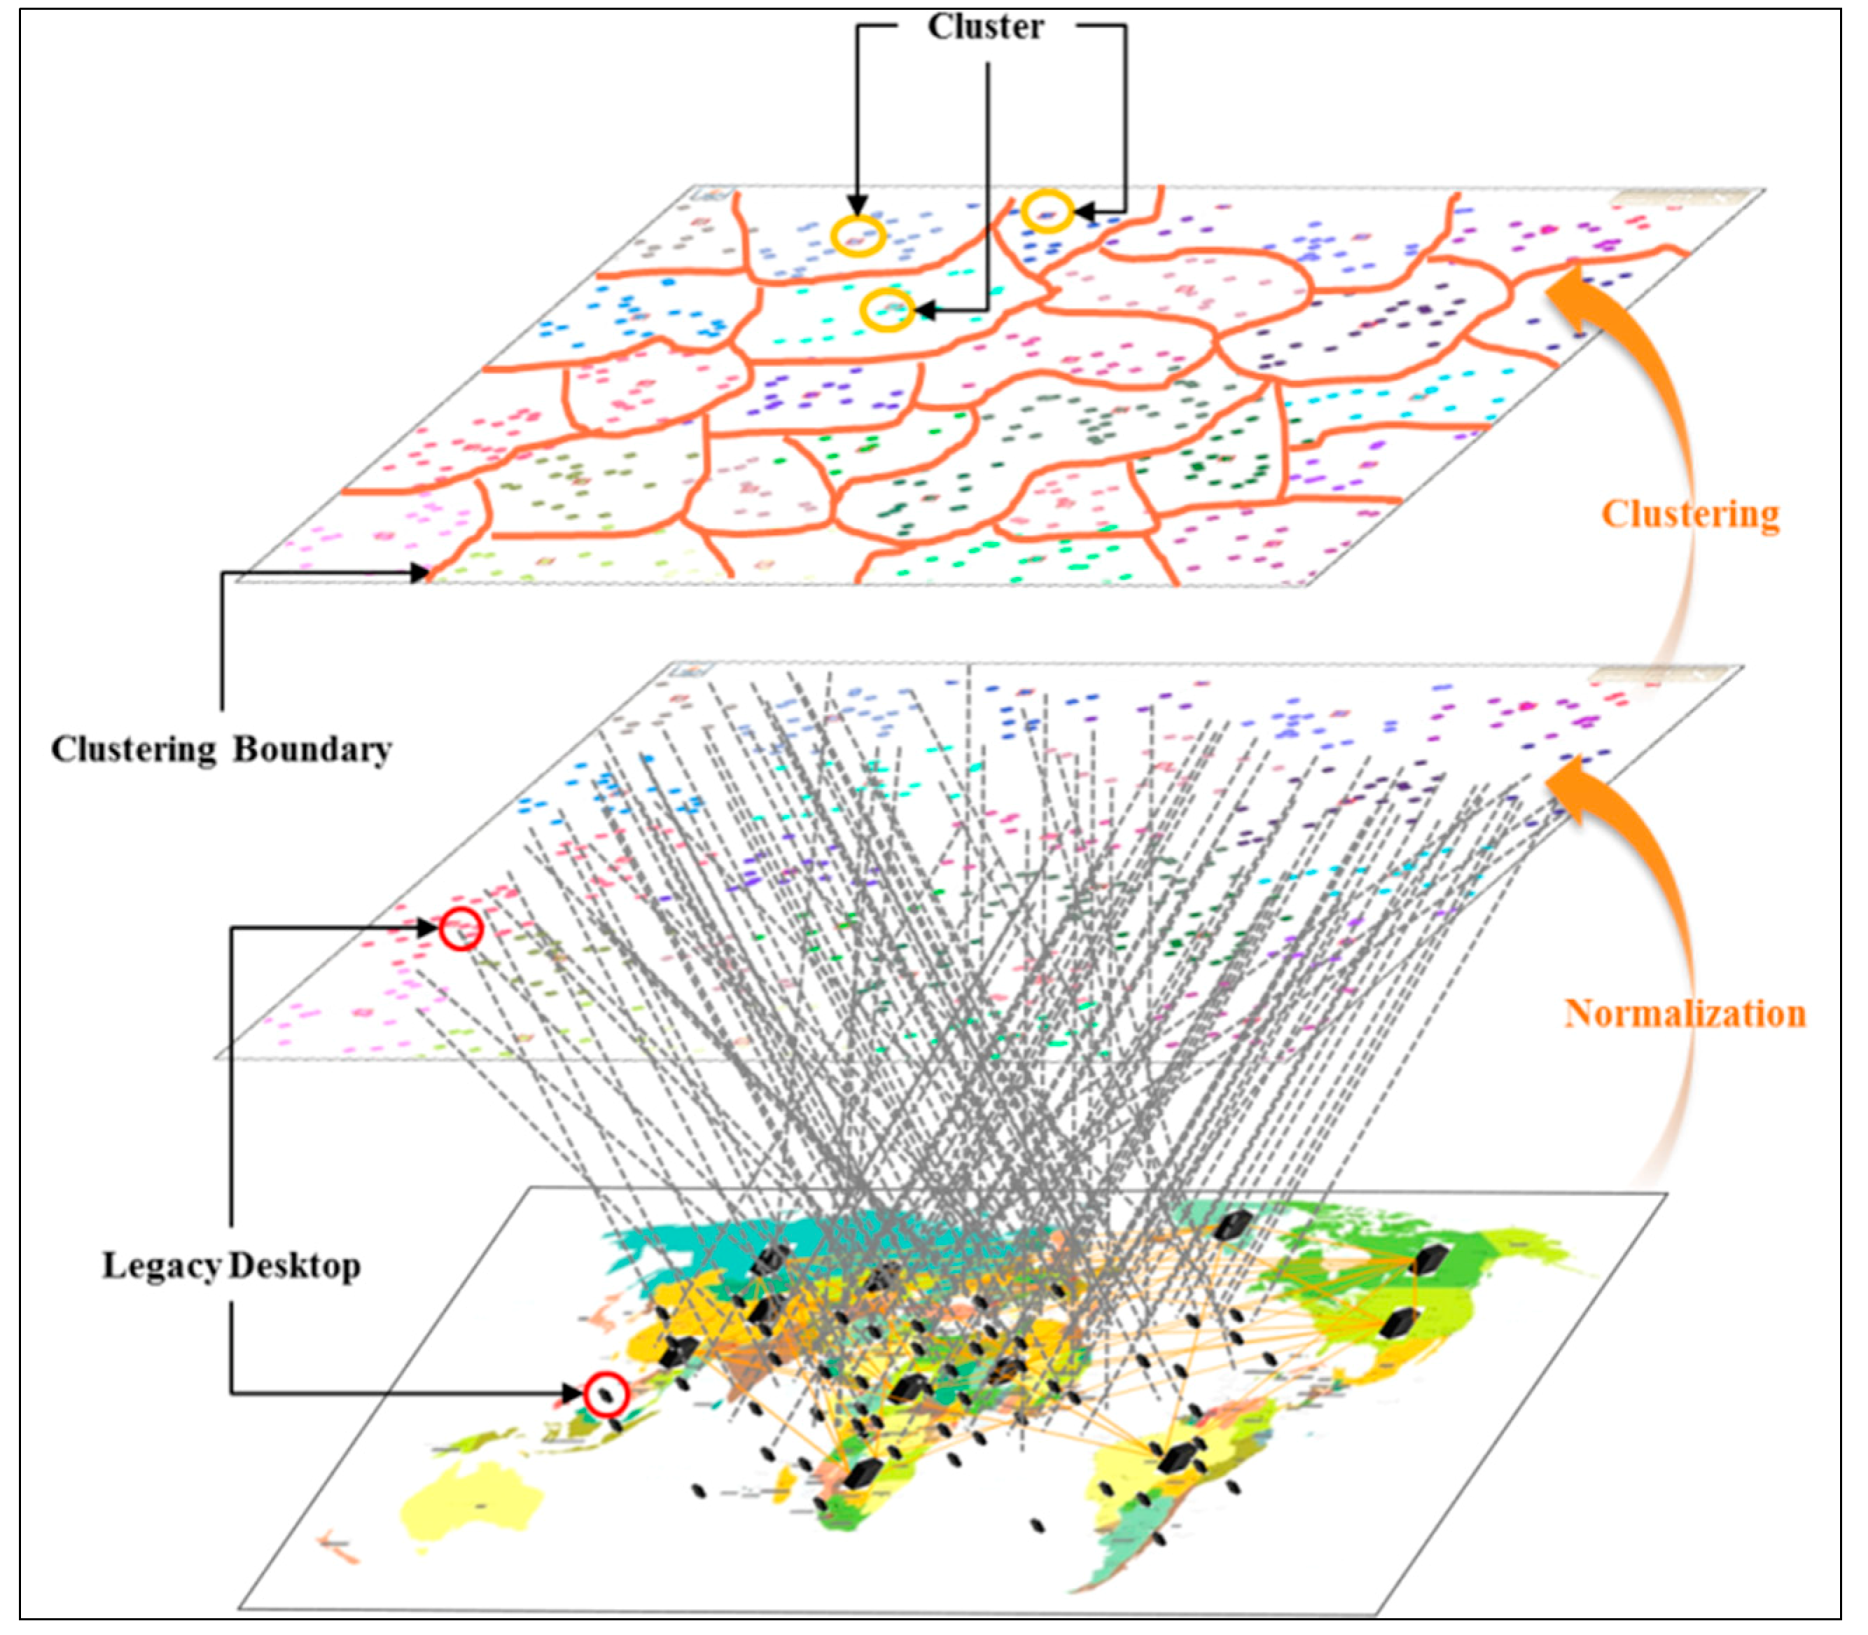
3.1. Processing of Cluster Scheme
Shown
Figure 2 is the overall processing step of clustering with a legacy desktop for an efficient hierarchy storage scheme.
For starting the processing step, the number of desktops is greater than the number of cluster; an arbitrary set of clusters should be generated by the given value from the user and system, such as C = {C1, C2, C3, …, Ck}. Continuously, each cluster includes the new host through the distance, which is the normalization value by the pair (x-axis value, y-axis value), where, the value is the response time or the number of hops with the router and the y-axis is the performance based on the CPU, memory and storage. Finally, it updates the center of each cluster
, where H is the number of hosts in each cluster and Ci is a host in each cluster group.
Figure 2.
Overall processing of the cluster scheme.
Figure 2.
Overall processing of the cluster scheme.
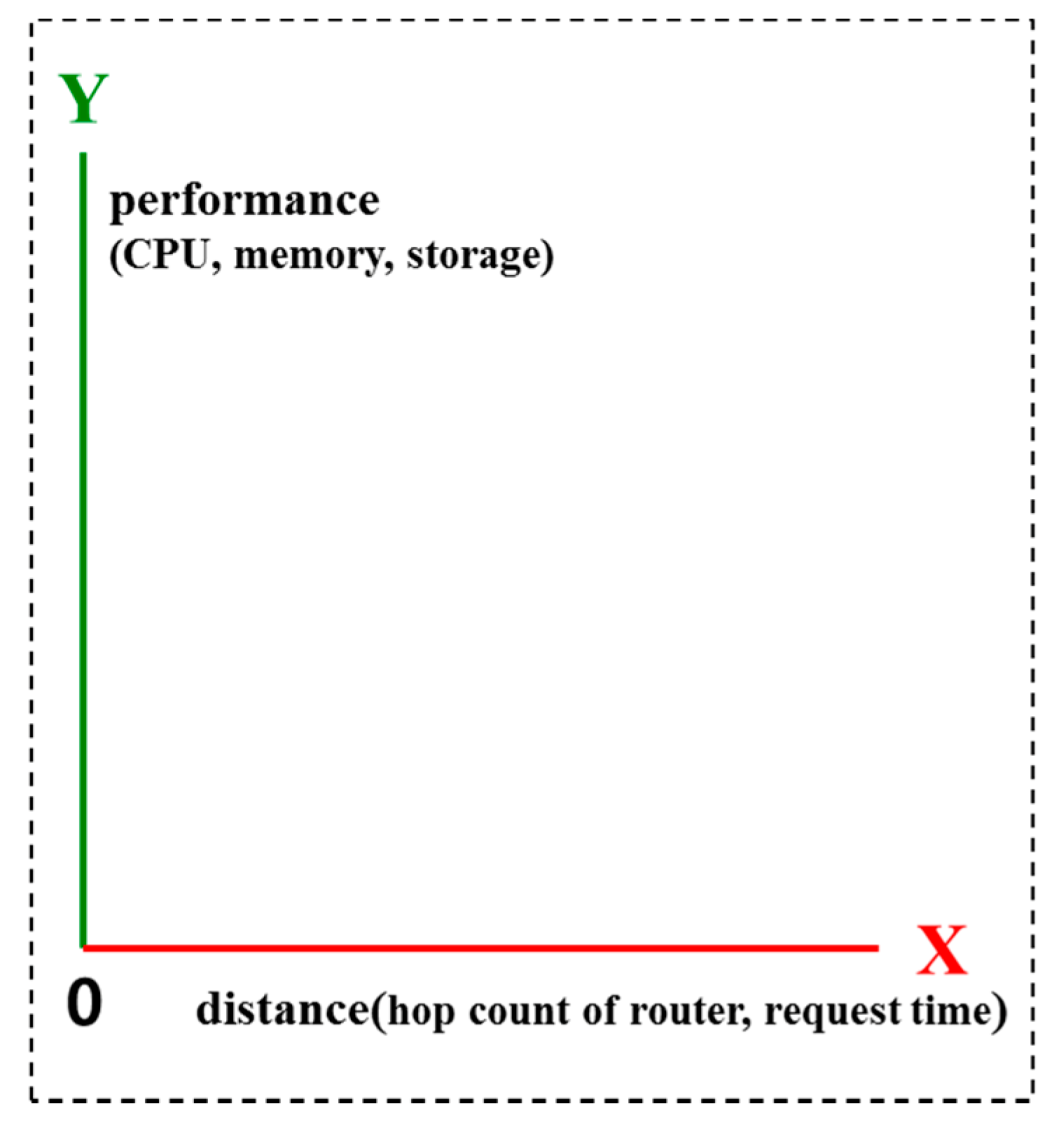
3.2. DRV-CS 2D Coordinates
For the 2D simulation, the DRV-CS shows distance (for instance, hop count of the router, request time,
etc.) on the x-axis and performance (for instance, CPU, memory and storage) on the y-axis using the host’s information, as shown in
Figure 3.
Figure 3.
DRV-CS 2D coordinates.
Figure 3.
DRV-CS 2D coordinates.
The x-axis is normalized as follows.
- (1)
First, among the hosts for the clustering simulation, determine the
where the highest measured value is based on the number of hops of the router or the response time.
- (2)
Calculate by Equation (1)
where
is x-axis value of n
th host,
the distance of n
th host and
the maximum distance of the host among all hosts.
- (3)
Implement the process under Step 2 for n hosts to calculate the x-axis coordinate value normalized for all hosts.
The y-axis is normalized as follows.
- (1)
First, determine the
, which are the hosts with the highest measured values with the CPU, memory and storage that show the host performance.
- (2)
Next, determine α, which shows the percentage of CPU, β, which shows the percentage of memory, and α, which shows the percentage of storage. In this case, the sum of α, β and γ may not exceed 100. In addition, the sum of α, β and γ should be 100.
, which is the performance of the n
th host, should be calculated through Expression (2).
- (3)
In this case,
is equal to
, and the y-axis coordinate value normalized for all hosts should be calculated by implementing the process under Step 2 for n hosts.
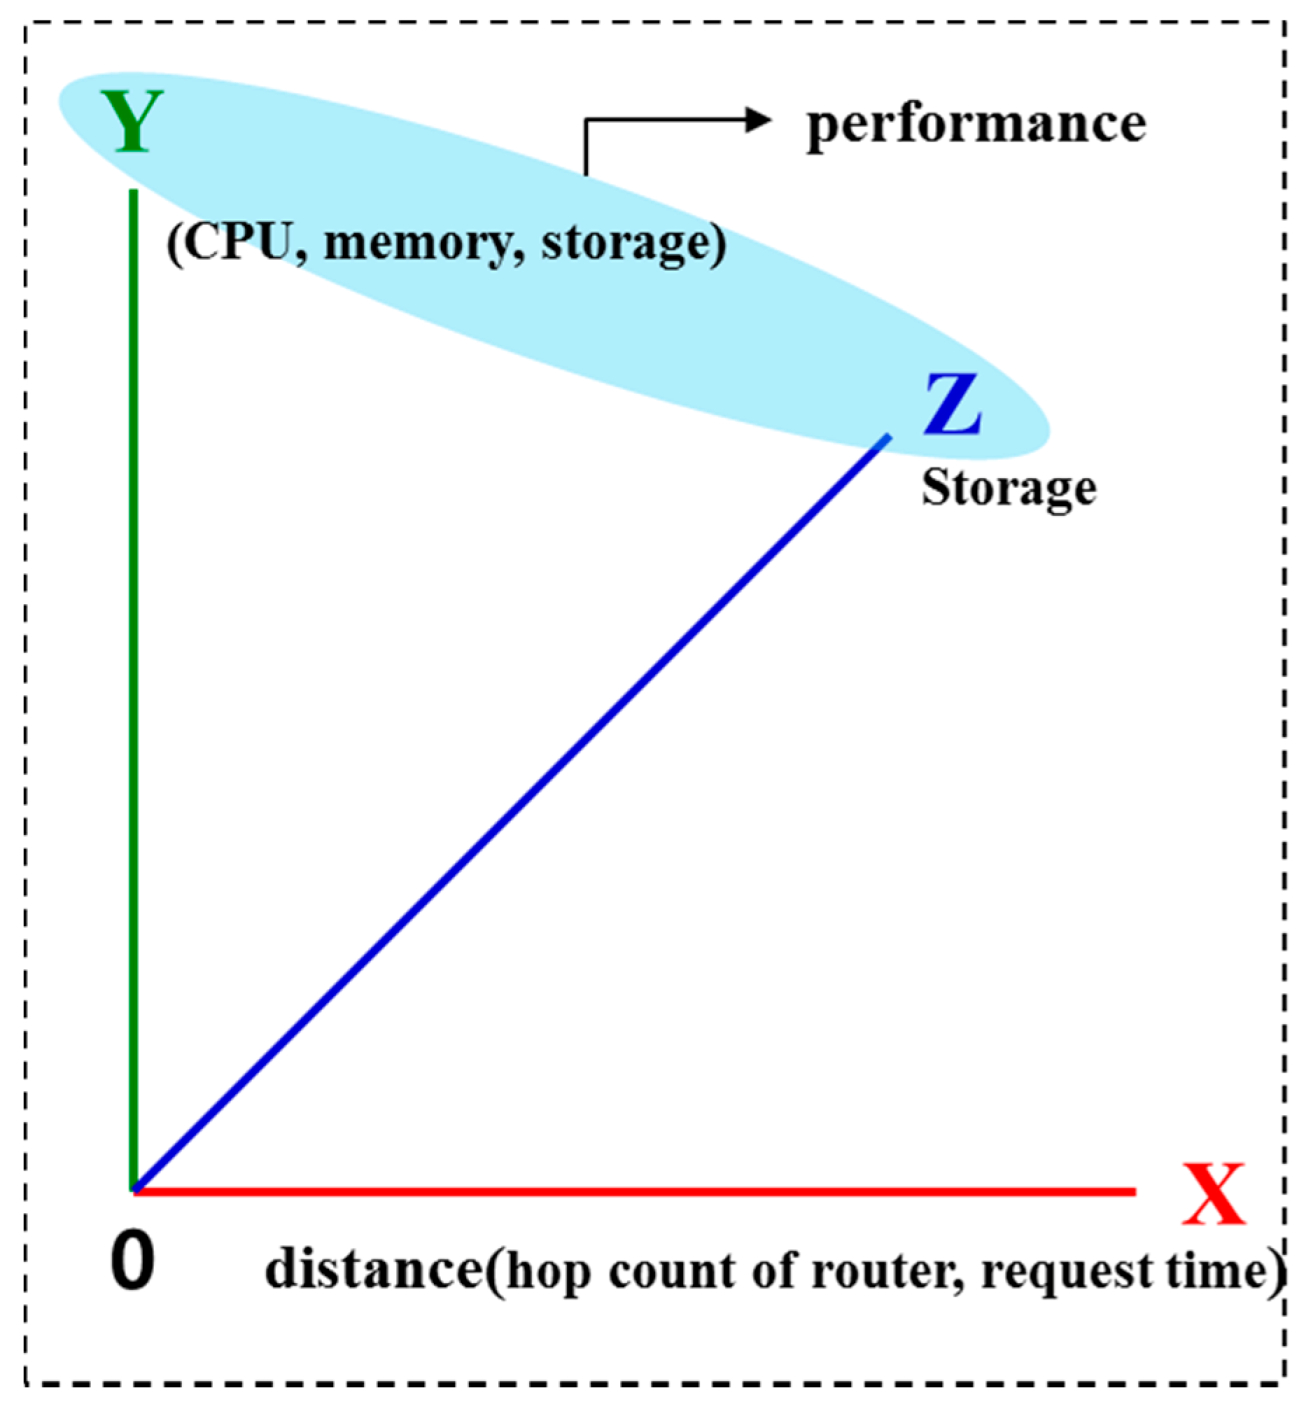
3.3. DRV-CS 3D Coordinates
For 3D simulation of the DRV-CS, the distances between the hosts are shown on the x-axis, and the performance is shown on the y-axis and z-axis, as shown in
Figure 4. In this case, the y-axis shows the CPU and memory, and the z-axis shows storage, although the user may change. The x-axis can be normalized in the same way as used for 2D coordinates.
Figure 4.
DRV-CS 3D coordinates.
Figure 4.
DRV-CS 3D coordinates.
The y-axis is normalized as follows.
- (1)
Determine
, which are the hosts with the highest measured values for the CPU and host memory, respectively.
- (2)
Next, determine α, which shows the percentage of CPU, and β, which shows the percentage of memory. In this case, the sum of α and β should be 100 and may not exceed 100. Calculate
, which is the y-axis coordinate value of n-th host through Expression (3).
- (3)
The y-axis coordinate value normalized for all hosts should be calculated by implementing the process under Step 2 for n hosts.
The z-axis is normalized as follows.
- (1)
Among the hosts for the clustering simulation, determine , the host with the largest available storage size.
- (2)
For
, the n
th host from the
, calculate the z-axis coordinate
through Expression (4).
- (3)
The z-axis coordinate value normalized for all hosts should be calculated by implementing the process under Step 2 for n hosts.
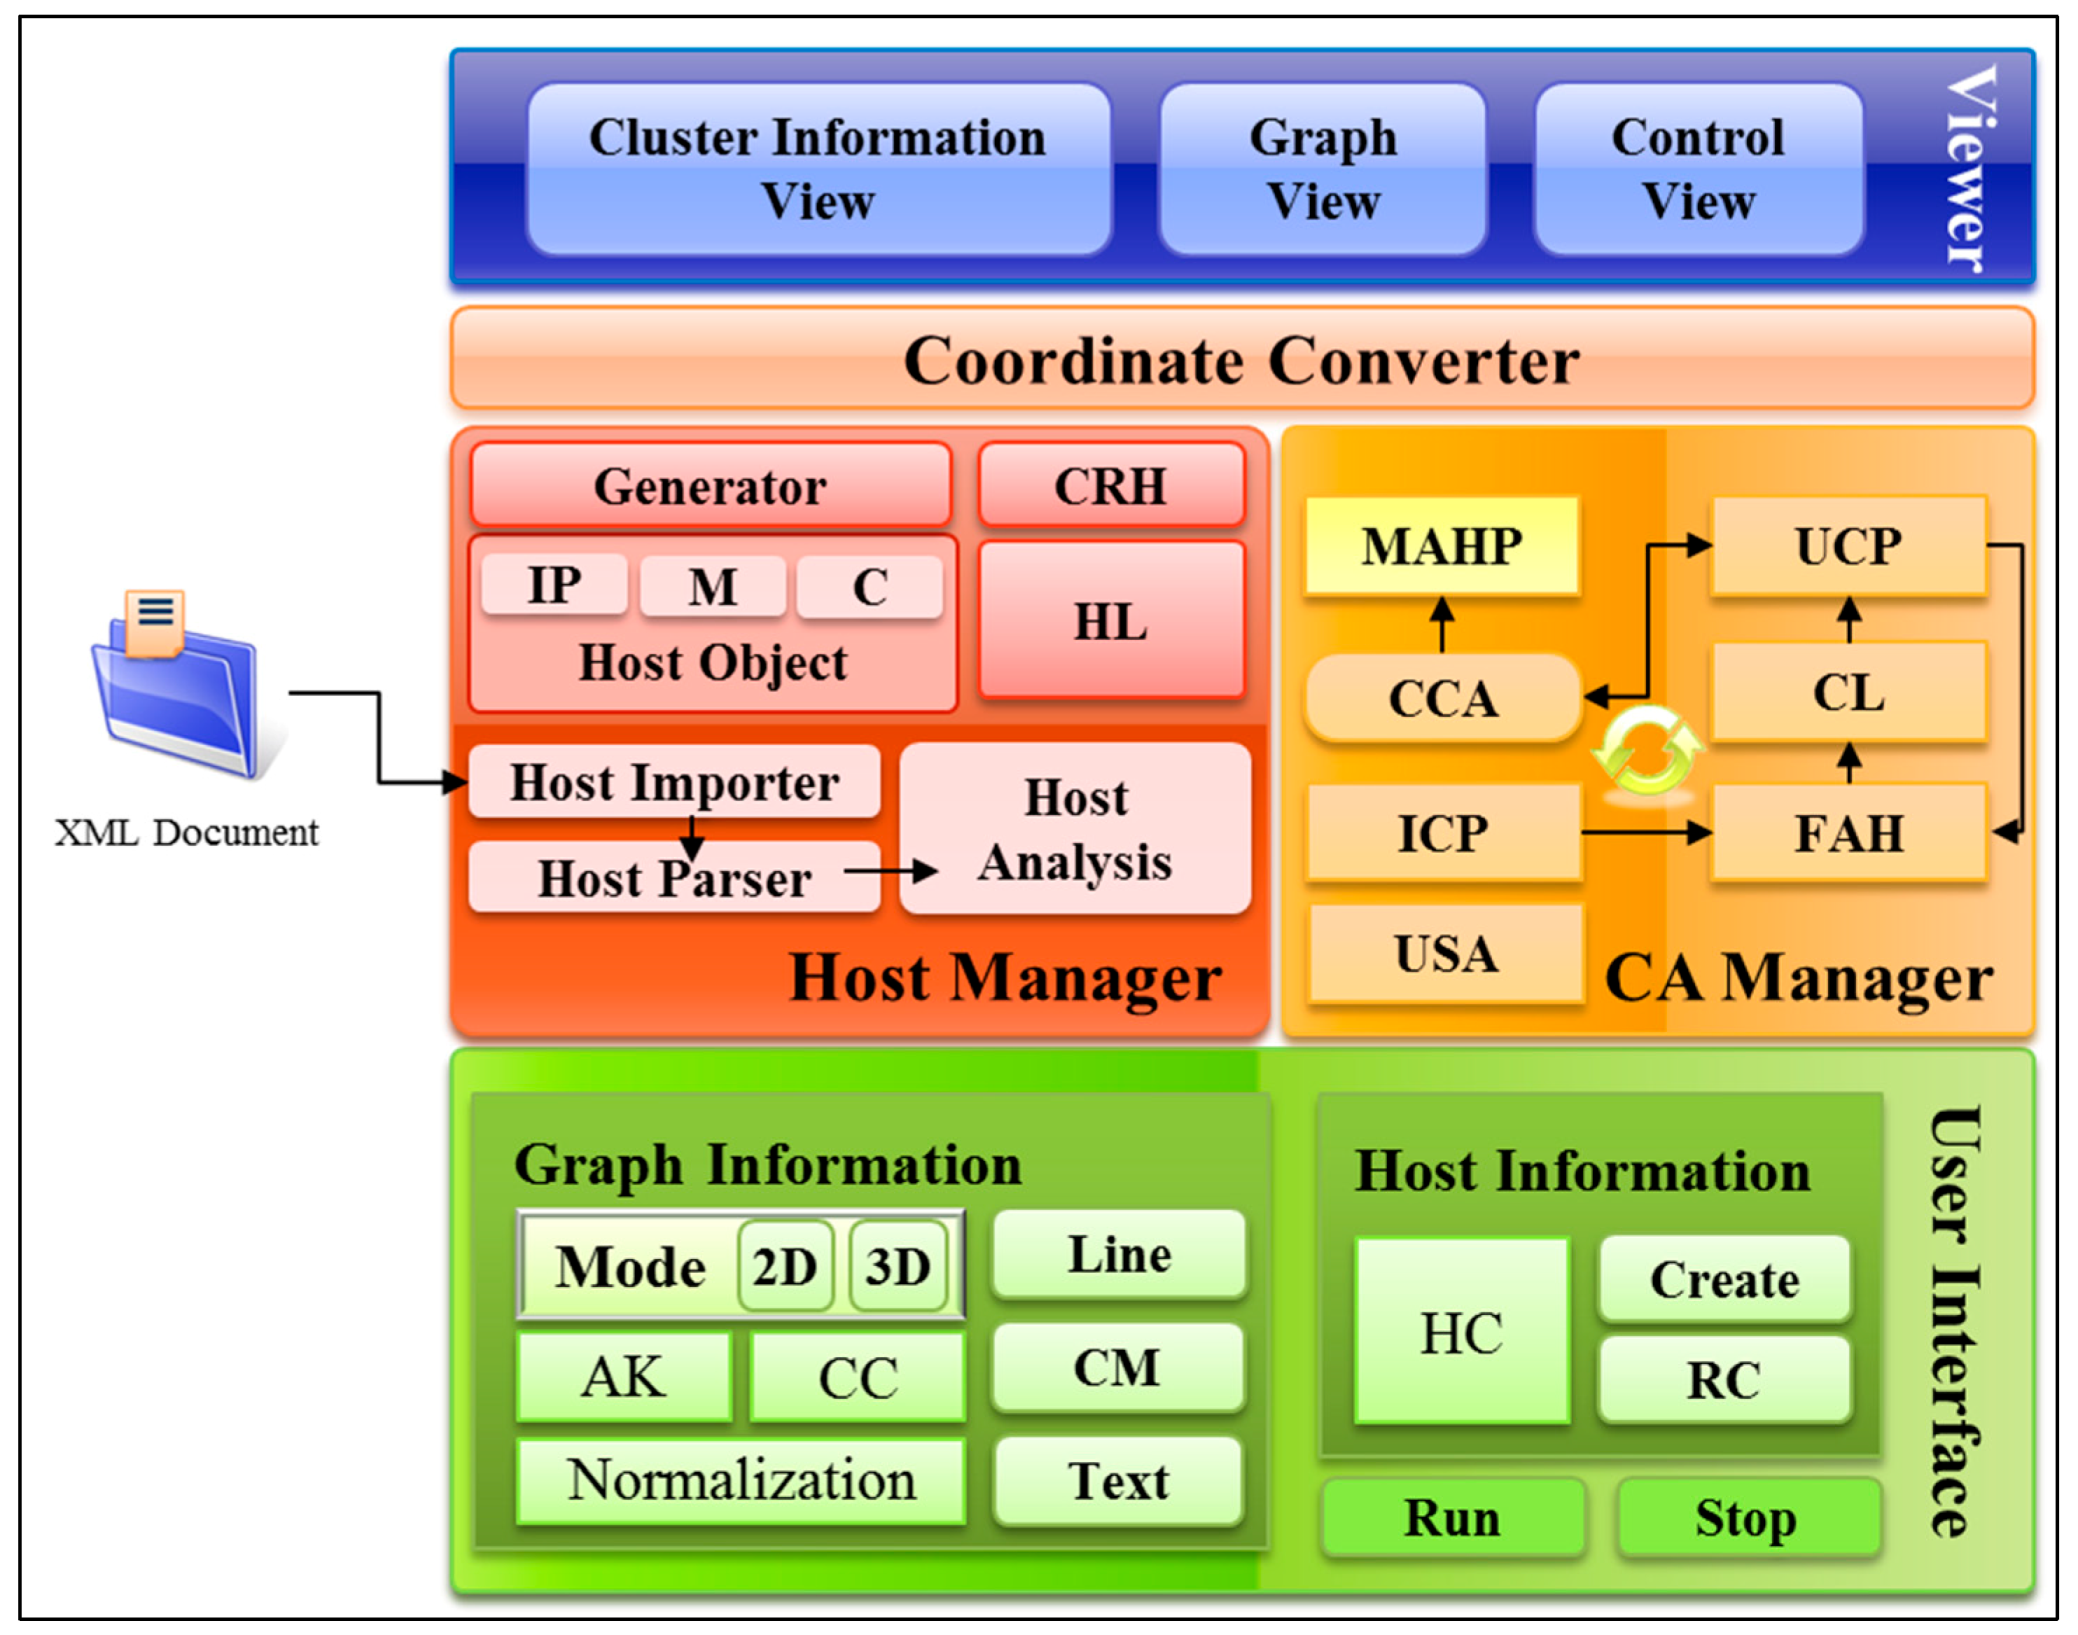
4. DRV-CS Design
The DRV-CS is composed of a user interface, which receives simulation visualization and host information from the user, a host manager, which analyzes and manages the host information in the form of XML received from the user as inputs, a CA manager, which manages clustering algorithms to be implemented based on the host information, a coordinate converter, which processes data to show simulations on the viewer, and a viewer, which visually shows simulation states. A fully functional structural drawing of the DRV-CS is shown in
Figure 5.
The user interface consists of graph information for controlling the visualization of the simulations, host information for setting the host to be simulated, Run for implementing simulations and Stop for stopping the simulations. The graph information consists of algorithm kind (AK) for algorithm selection, cluster count (CC) for receiving inputs of the number of clusters to be simulated and normalization for showing hosts on graphs. In addition, 2D or 3D can be selected according to simulation visualization through the mode. The host information consists of the host count (HC), which inputs the number of hosts to be simulated, create, which creates as many numbers as the number of inputted hosts, and random create (RC), which creates arbitrary numbers internally in the system.
The host manager comprises the host importer (which reads XML documents to simulate hosts installed in actual environments), host parser (which analyzes the XML documents that have been read), and host analysis (which analyzes the hosts through normalization). In addition, it also comprises the generator (which creates arbitrary hosts) and compare random host (CRH), which compares host information for diverse distributions. Hosts are added to the host list (HL) after being identified as having host information that does not overlap with other hosts’ host information through CRH.
Figure 5.
DRV-CS architecture. IP, Internet Protocol; M, Memory; C, CPU; CRH, compare random host; HL, host list; MAHP, move adjacent host point; CCA, check clustering availability; ICP, initialization center point; USA, user-selected algorithm; UCP, update center point; CL, cluster list; FAH, find adjacent host; CA, cluster algorithm; AK, algorithm kind; CC, cluster count; CM, Cluster Mark; HC, host count; RC, random create.
The CA manager (cluster algorithm manager) consists of the user-selected algorithm (USA), which shows the clustering algorithm selected by the user, the initialization center point (ICP), which creates arbitrary clusters in the number set by the user, and find adjacent host (FAH), which finds adjacent hosts based on arbitrary clusters. The hosts found through FAH are added to the cluster list (CL). When all hosts have been implemented, the CA manager moves to a new center point through the update center point (UCP) based on the hosts added to individual clusters. Thereafter, FAH is repeatedly implemented to move to the optimum center point, and whether FAH should be additionally implemented is judged through the check clustering availability (CCA). When no additional implementation is necessary according to the CCA, the host adjacent to the center point is selected as a cluster through the move adjacent host point (MAHP).
The coordinate converter plays the role of a broker that processes data and delivers them to the viewer, so that the viewer can visualize the operation state of the host manager and the CA manager.
The viewer consists of the control view for controlling the DRV-CS, graph view for visualizing simulations and information view for providing the clustered host information to the user.
5. DRV-CS Implementation
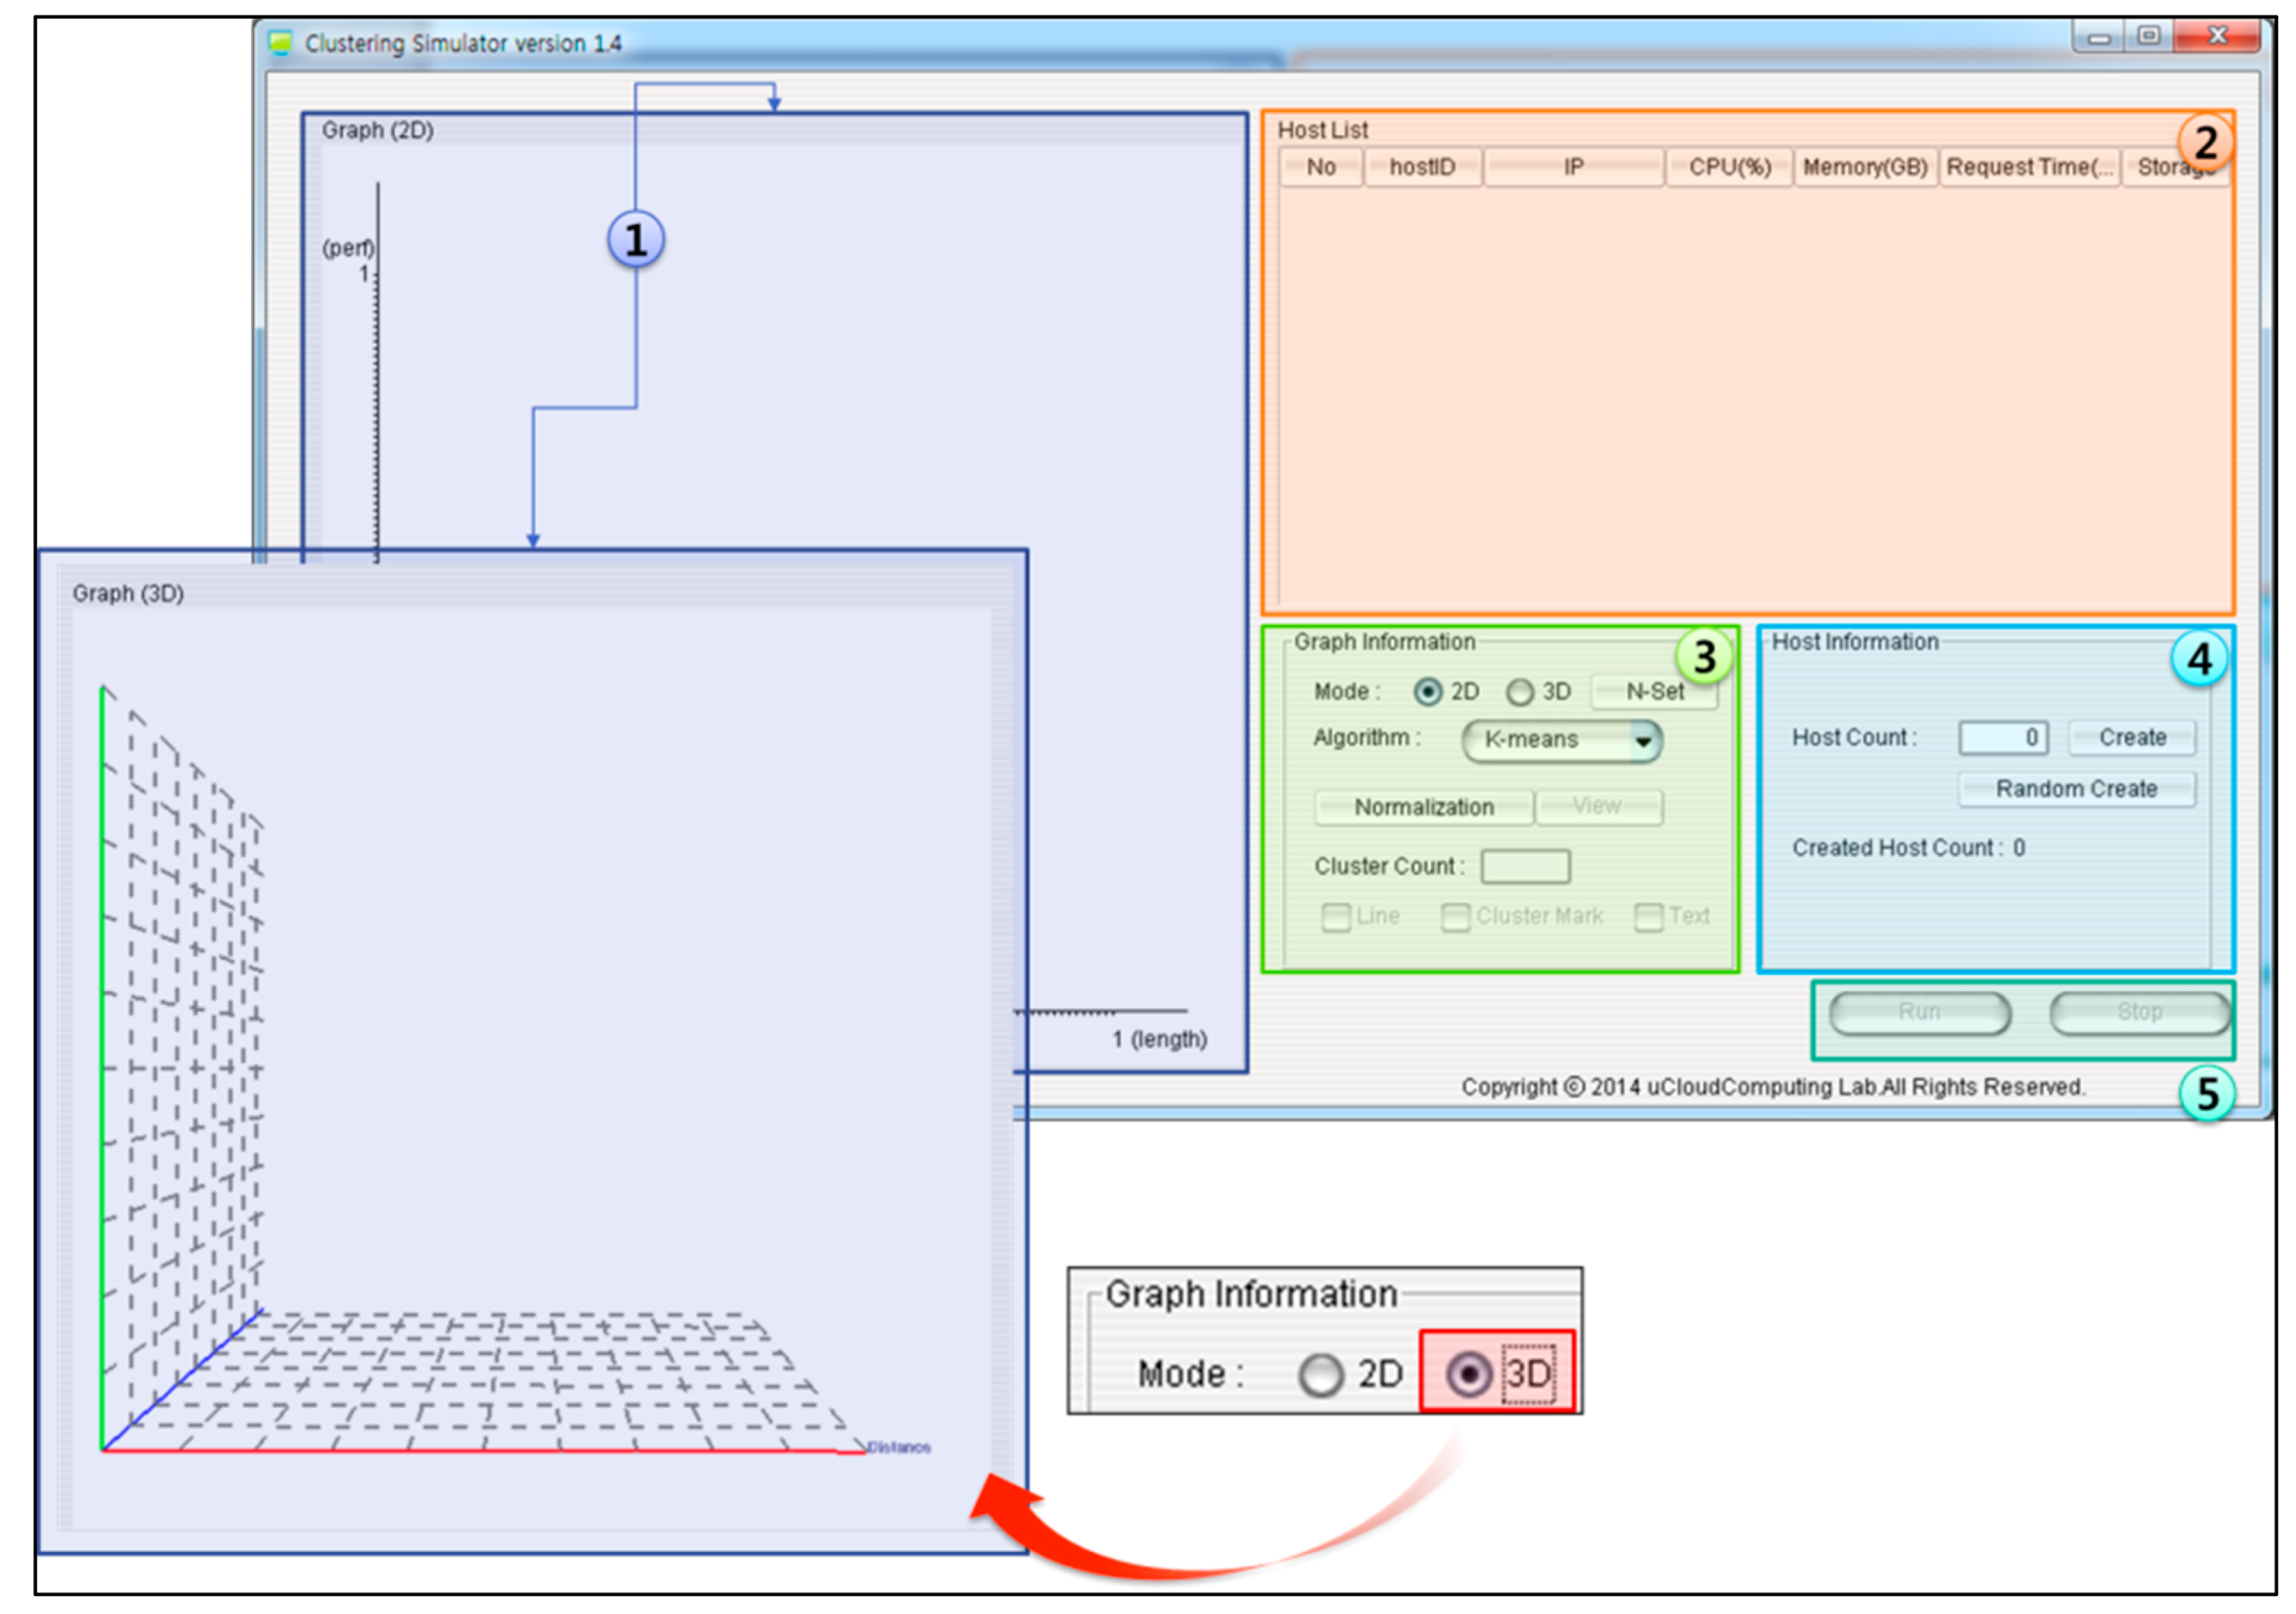
The initial screen of the DRV-CS is shown in
Figure 6. Screen 1 visualizes the host clustering simulation for desktop resource virtualization in 2D or 3D depending on the user’s view mode selection. In addition, when a cluster has been selected in Screen 1, a frame that shows the information of the clustered host is implemented. Screen 2 shows the desktop PC information to be simulated. Through this table, the user may first revise the host information to be simulated. Screen 3 provides an interface for selecting whether to show the visualization to be simulated in Screen 1 in 2D or 3D. In addition, the screen provides algorithm selection and normalization for clustering, a view for showing normalization states in Screen 1 and an interface for inputting the number of clusters for clustering. It also provides a line for showing the state of clustering on simulations, a cluster mark for identifying changes in clusters’ locations and a text interface for distinguishing clusters. Screen 4 provides an interface for defining the number of hosts necessary to simulate clustering algorithms and changes in performance ratios for arbitrary hosts.
Figure 6.
Initial configuration screen of the DRV-CS.
Figure 6.
Initial configuration screen of the DRV-CS.
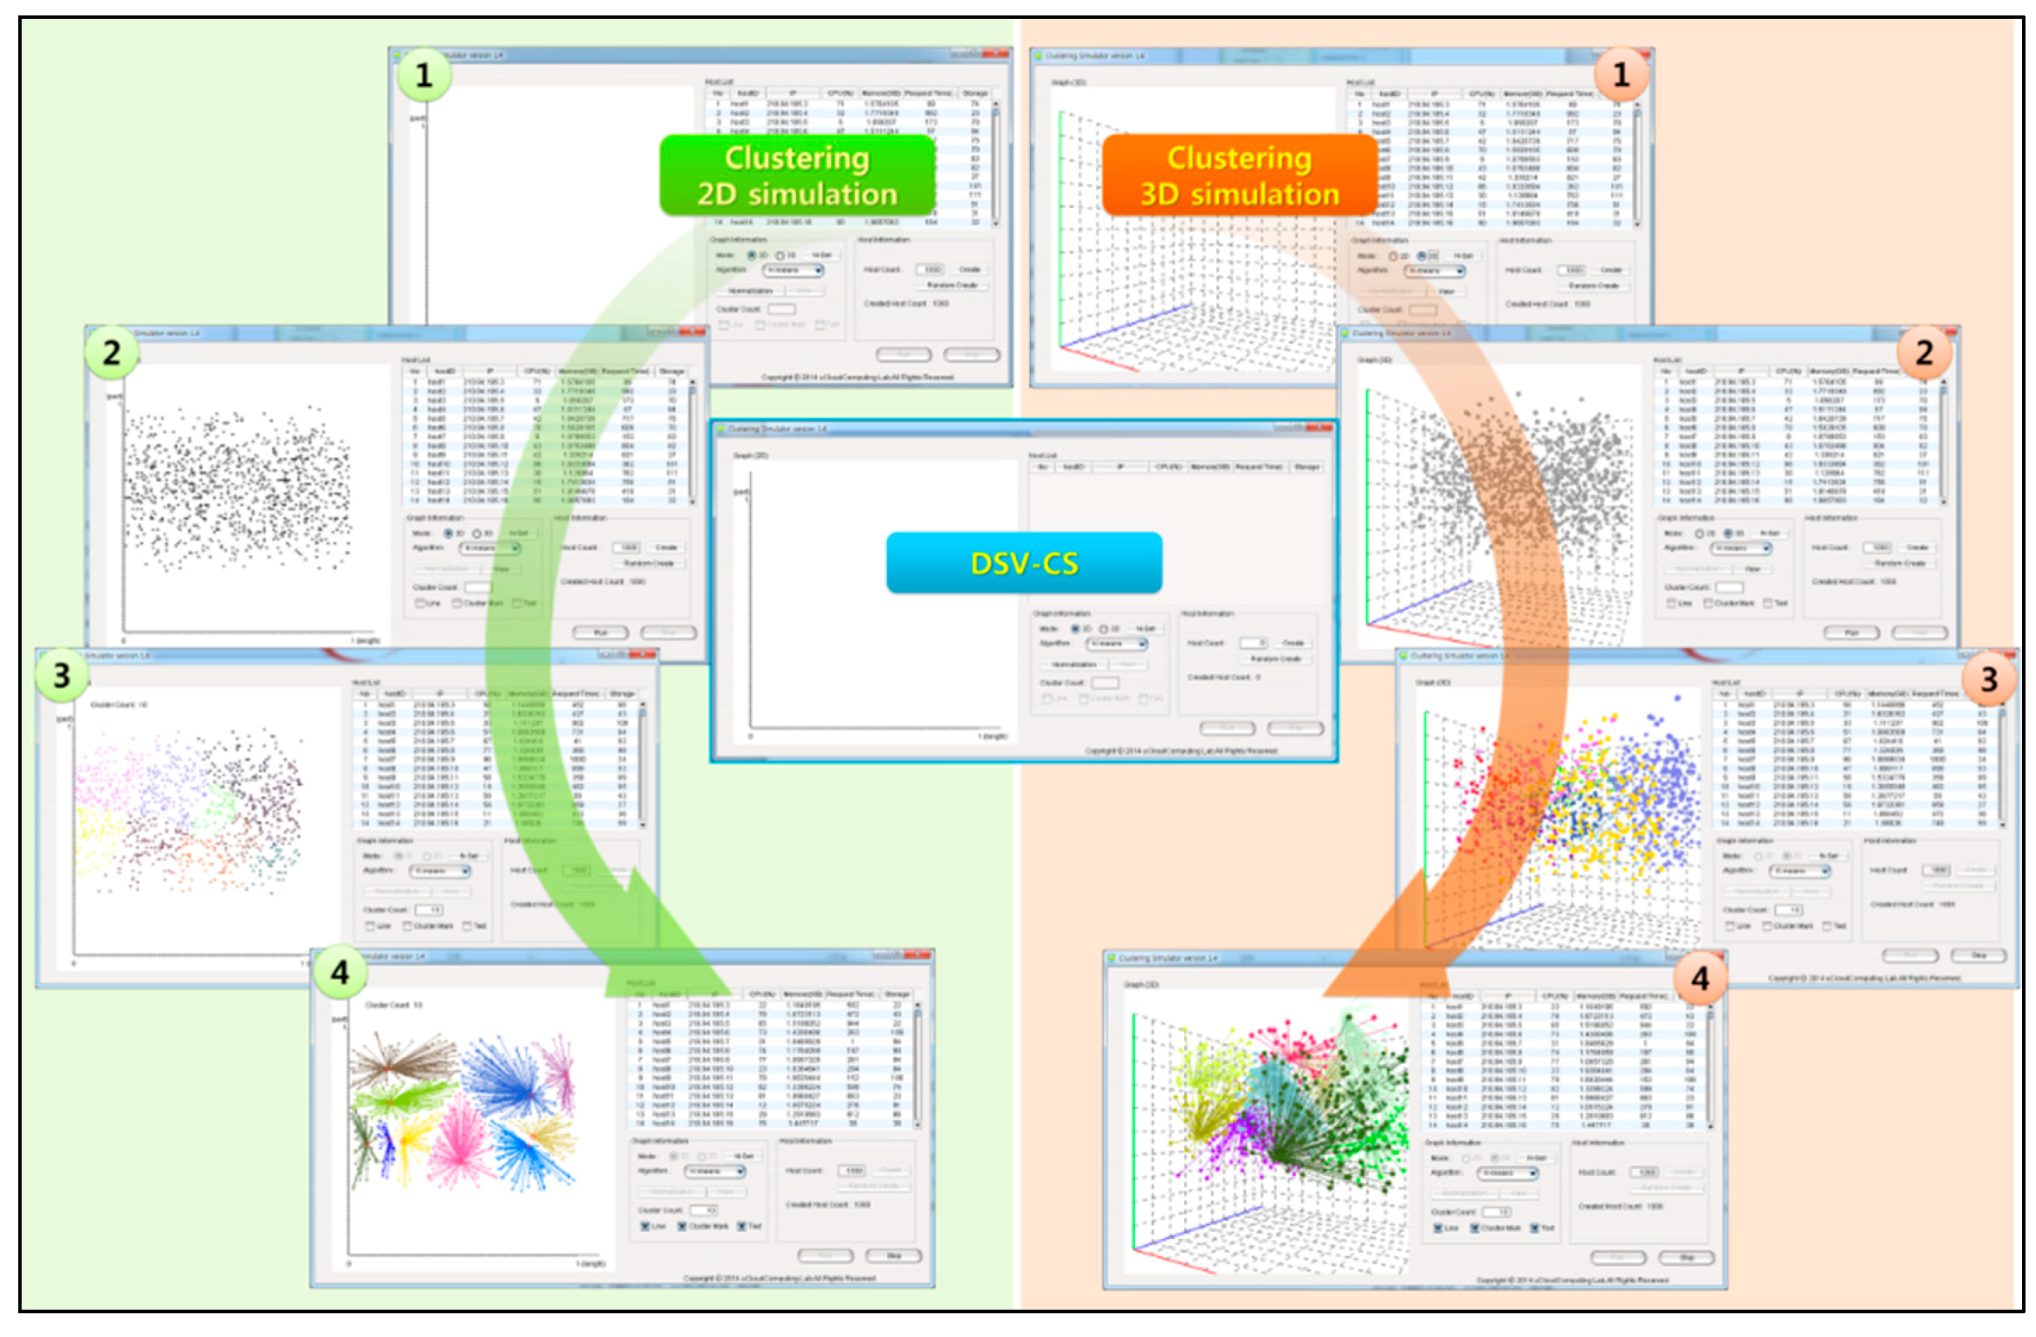
Figure 7 shows the operation screens of the DRV-CS that create and simulate 1,000 hosts. The left side shows 2D simulations, and the right side shows 3D simulations. Screen 1 inputs the number of host as 1,000, creates random host information through create, and shows the information in the table. Screen 2 performs normalization to show the created random hosts on the graph and produces x-axis, y-axis and z-axis values, depending on the simulation modes. Through the view, each host is expressed as a point in the case of 2D simulations as shown in Screen 2 and as a sphere in the case of 3D simulations. Screen 3 shows a case in which the number of clusters was inputted as 10 for clustering, and the clustering was implemented through the run interface. In this case, clustering simulations in the inputted number of clusters are operated. Screen 4 shows a case where line, cluster mark and text have been activated on a simulation in operation in which the current locations of clusters and the view of clustered hosts connected with each other are shown. In addition, the screen shows the host ID of each cluster on the graph, so that cluster conditions can be understood.
Figure 7.
DRV-CS simulation screen.
Figure 7.
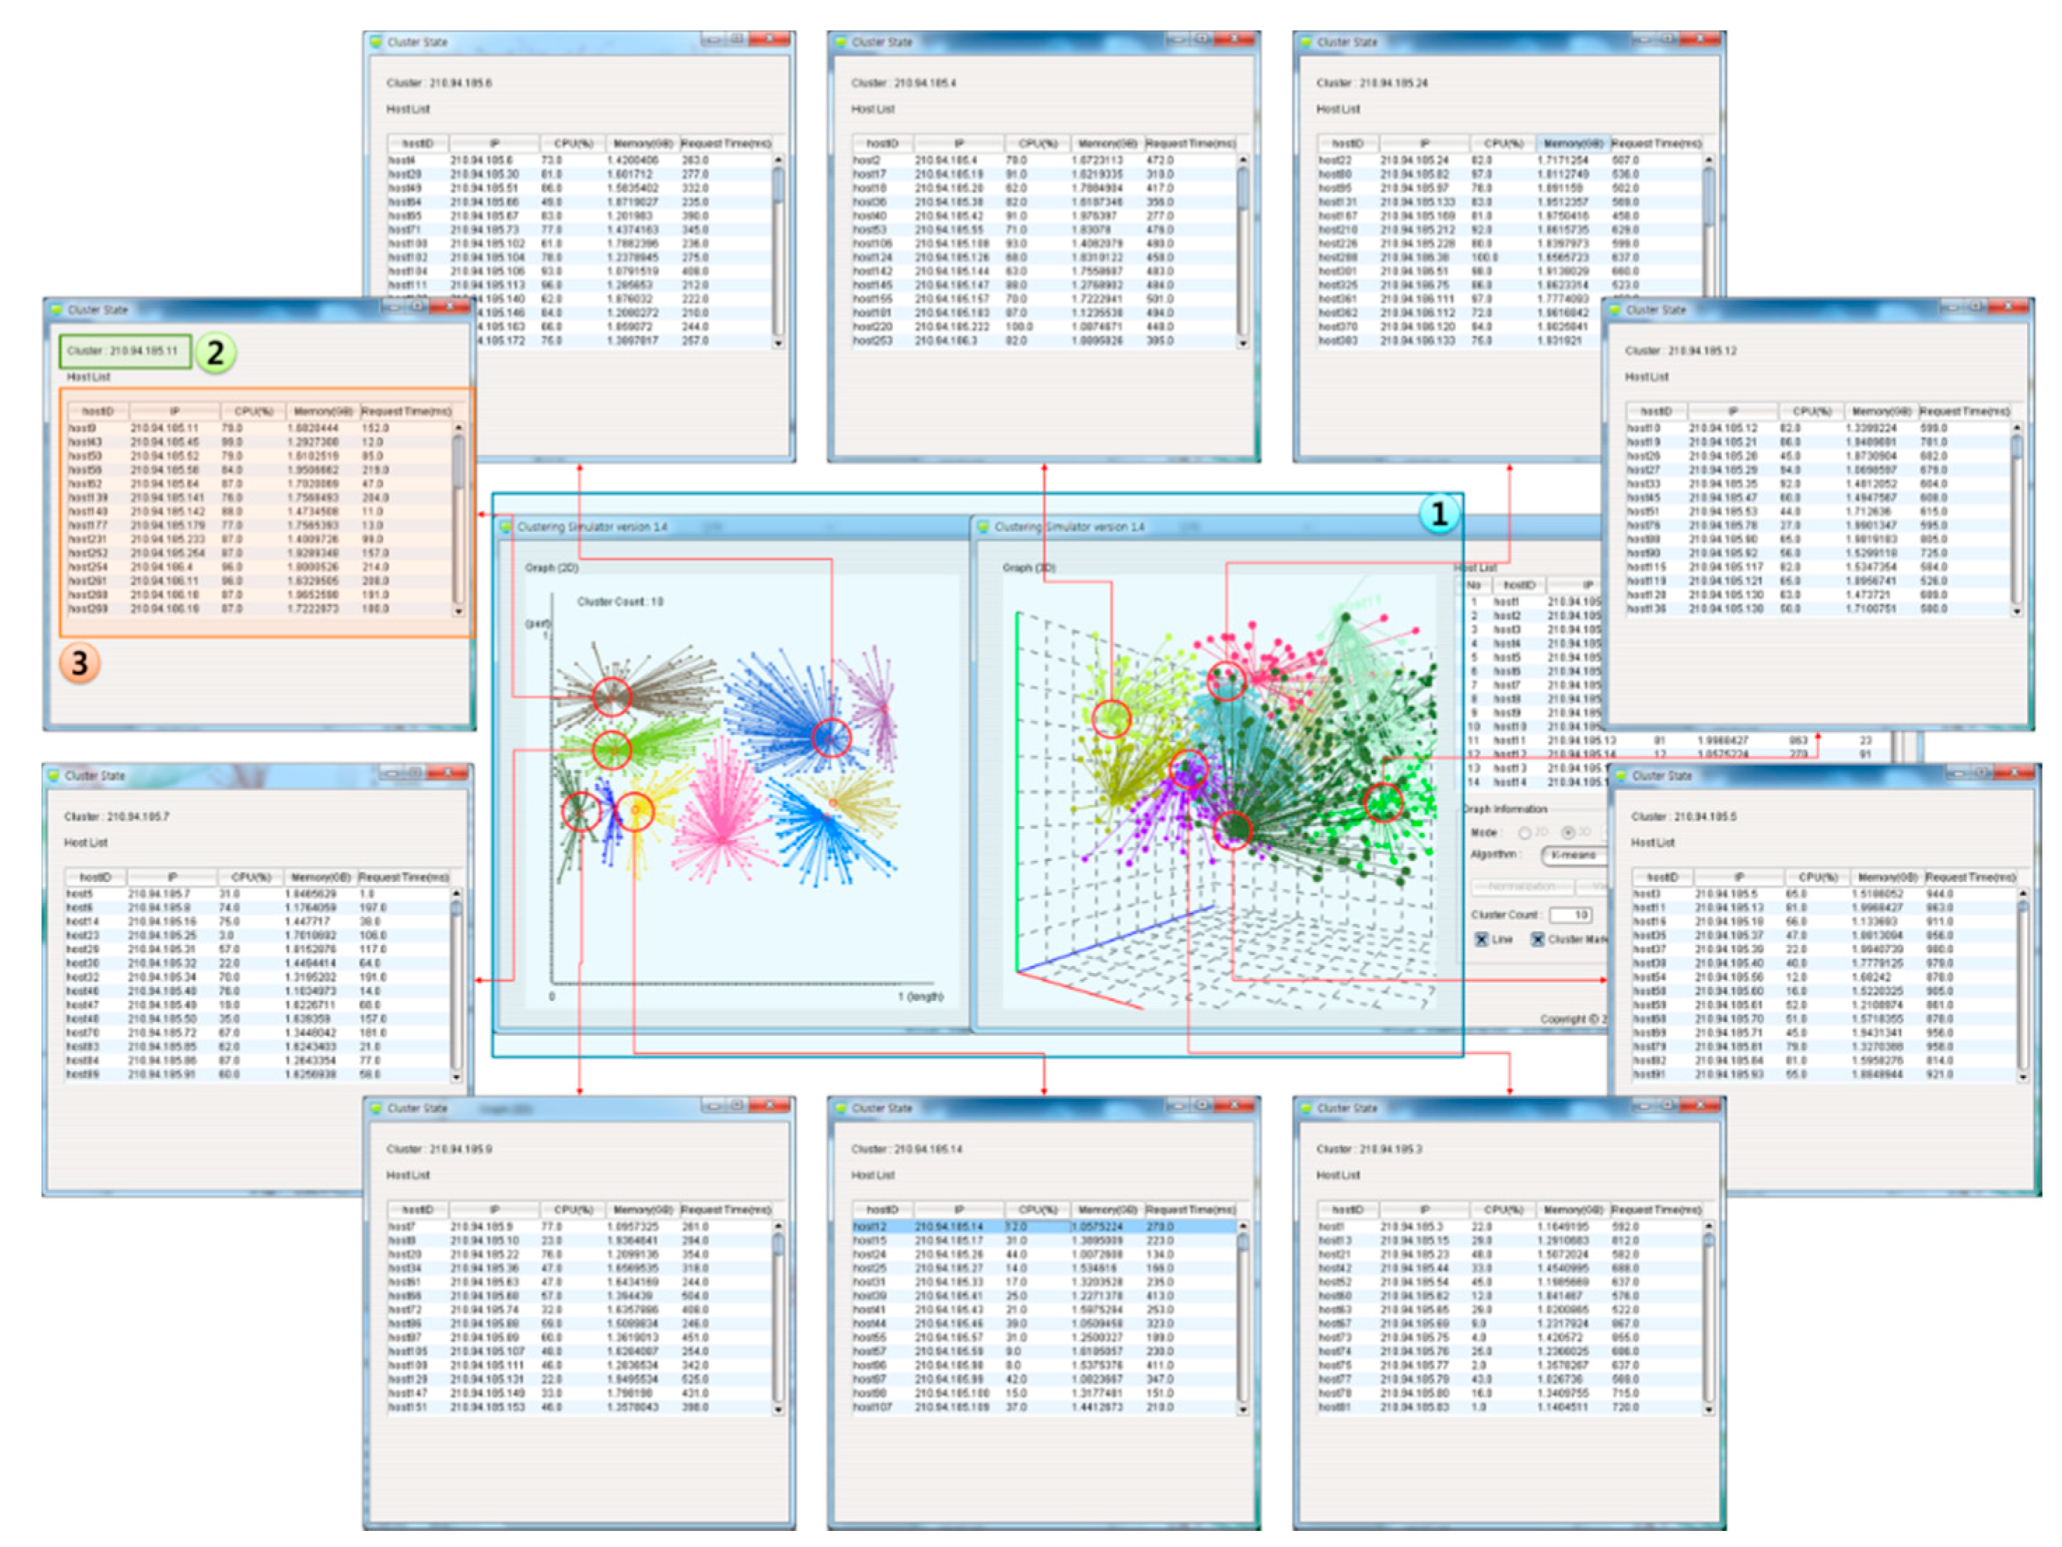
DRV-CS simulation screen.
Figure 8 shows host information clustered with the results of the clustering simulation of 10 clusters for 1,000 hosts shown in
Figure 7. When the user has selected a cluster, Screen 1 shows the host information included in the selected cluster in the form of a table. Screen 2 provides the selected cluster to the user, so that it can be identified based on its IP. Screen 3 provides the host information included in the selected cluster to the user, so that it can be understood by the user.
Figure 8.
Host clustering through the DRV-CS.
Figure 8.
Host clustering through the DRV-CS.
6. Performance Evaluation
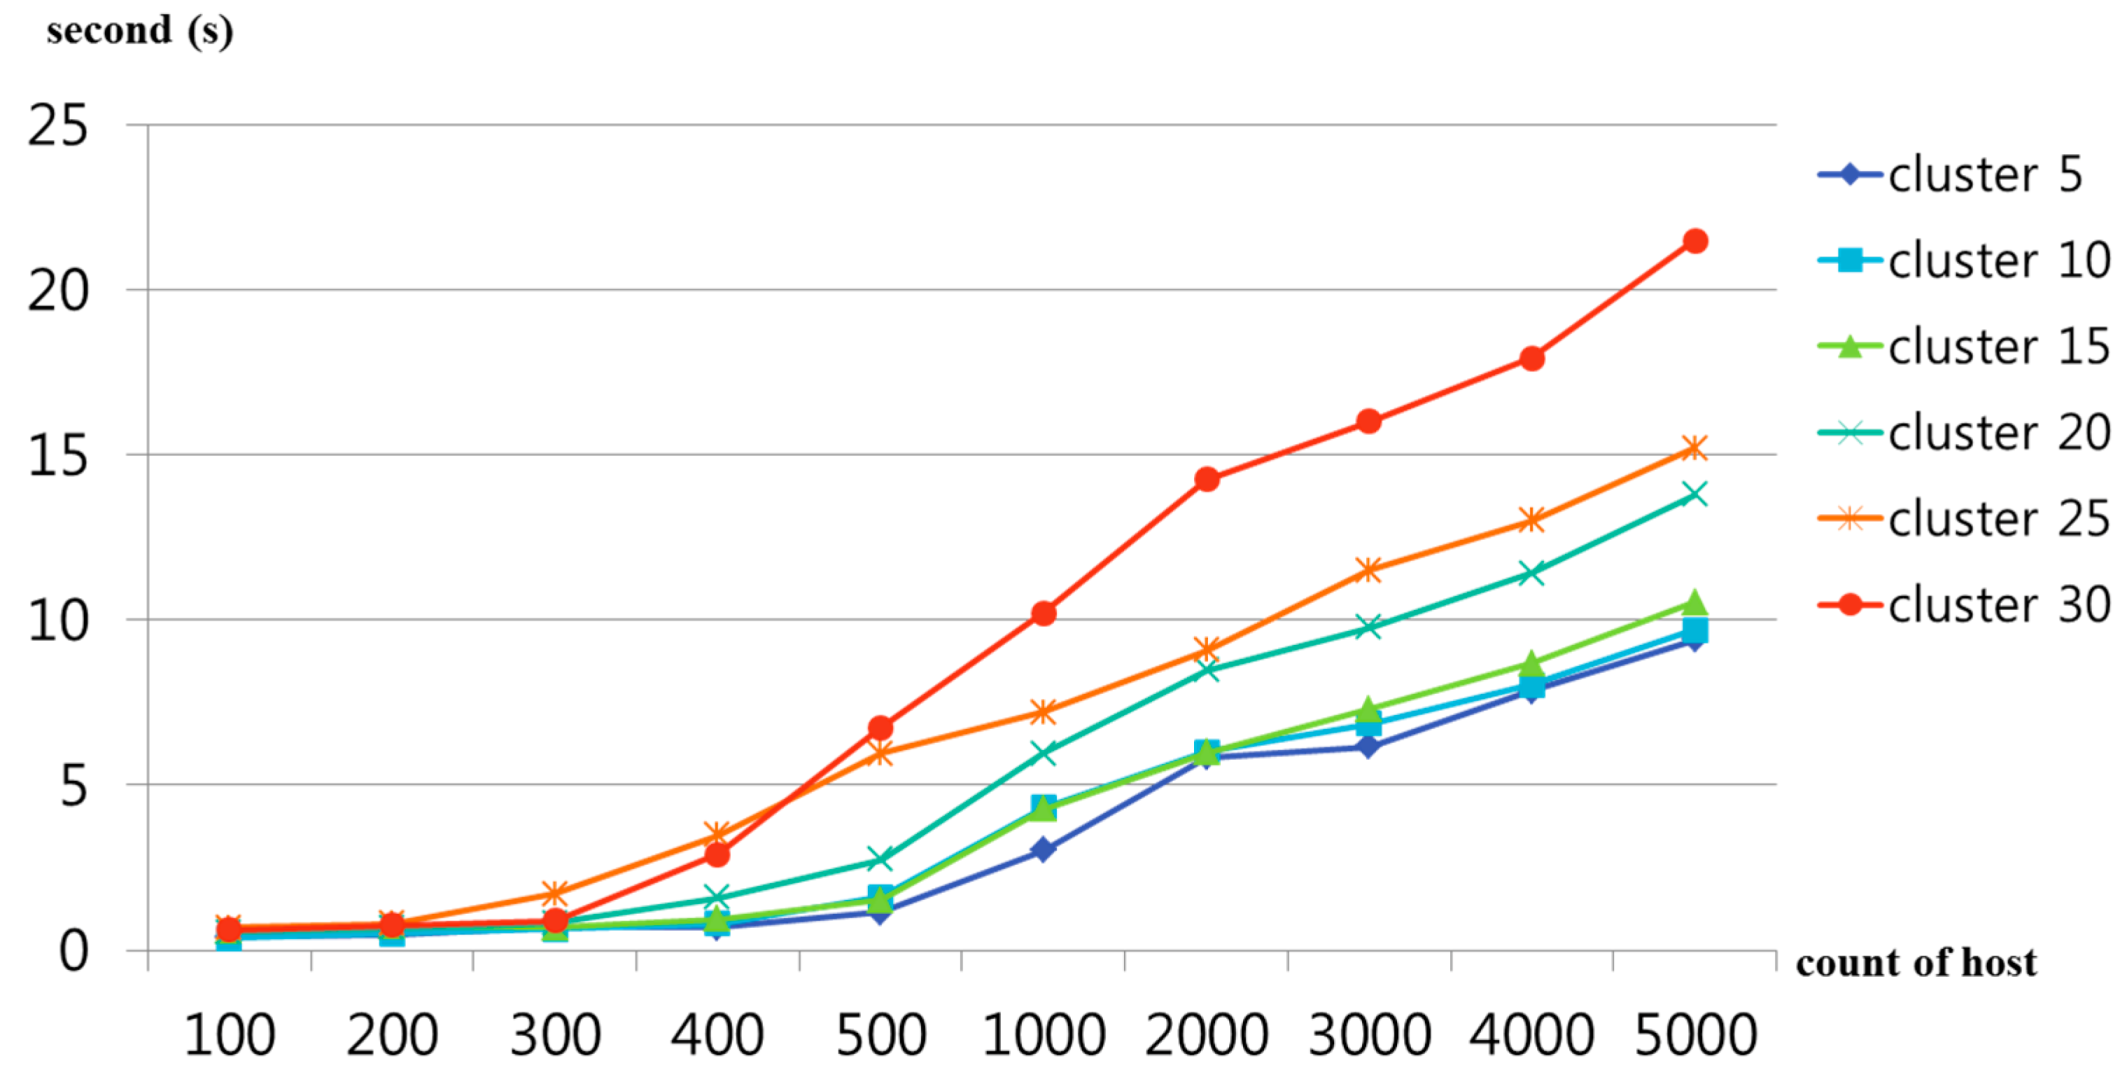
Figure 9 shows the results for measuring the clustering time according to increases in the number of DRV-CS hosts and clusters. The number of hosts increased to 100, 200, 300, 400, 500, 1000, 2000, 3000, 4000 and 5000, and the number of clusters increased to 5, 10, 15, 20, 25 and 30 at each time point of increase to implement clustering. In this case, the implementation speed at each time point of increase was the average of 50 implementations.
Figure 9 shows that clustering is implemented within 5 s when the number of hosts is smaller than 500. When the number of hosts was 1000 or larger, at least 10 s was spent. When clustering was implemented by applying 30 clusters to 5000 hosts, approximately 21 s was spent. This is more efficient compared to the labor, electricity and time spent on actual clustering tests with 5000 hosts.
Figure 9.
Clustering workload time according to increases in the number of DRV-CS hosts and clusters.
Figure 9.
Clustering workload time according to increases in the number of DRV-CS hosts and clusters.
7. Conclusions
Due to the limited performance of the resources of desktop PCs or smart devices, the use of cloud services has been rapidly increasing. Among the visualizations for cloud services, desktop resource virtualization utilizes the resources on existing desktop PCs, and thus, hierarchical structures for clustering are very important. Therefore, in the present paper, a DRV-CS was proposed for selecting clusters in desktop virtualization. The DRV-CS provided XML-based interfaces, so that the hosts in cloud infrastructures in operation could be simulated. In addition, the simulator provided user interfaces, so that the user can determine clustering elements for selecting appropriate clustering algorithms from among diverse clustering algorithms.
In future work, studies will be conducted to express not only normalization, but also fault-tolerance and resource availability. Studies will be conducted to provide user-defined interfaces, so that host information, including not only CPU, memory, and storage, but also time and network infrastructure according to resource availability, can be considered to enable utilization in diverse applications. In addition, a multi-core GPU will be used to extend the simulation to multiple desktop PCs.


