Incorporating Bio-Physical Sciences into a Decision Support Tool for Sustainable Urban Planning

 , ,
, ,
Abstract
:1. Introduction
2. Materials and Methods
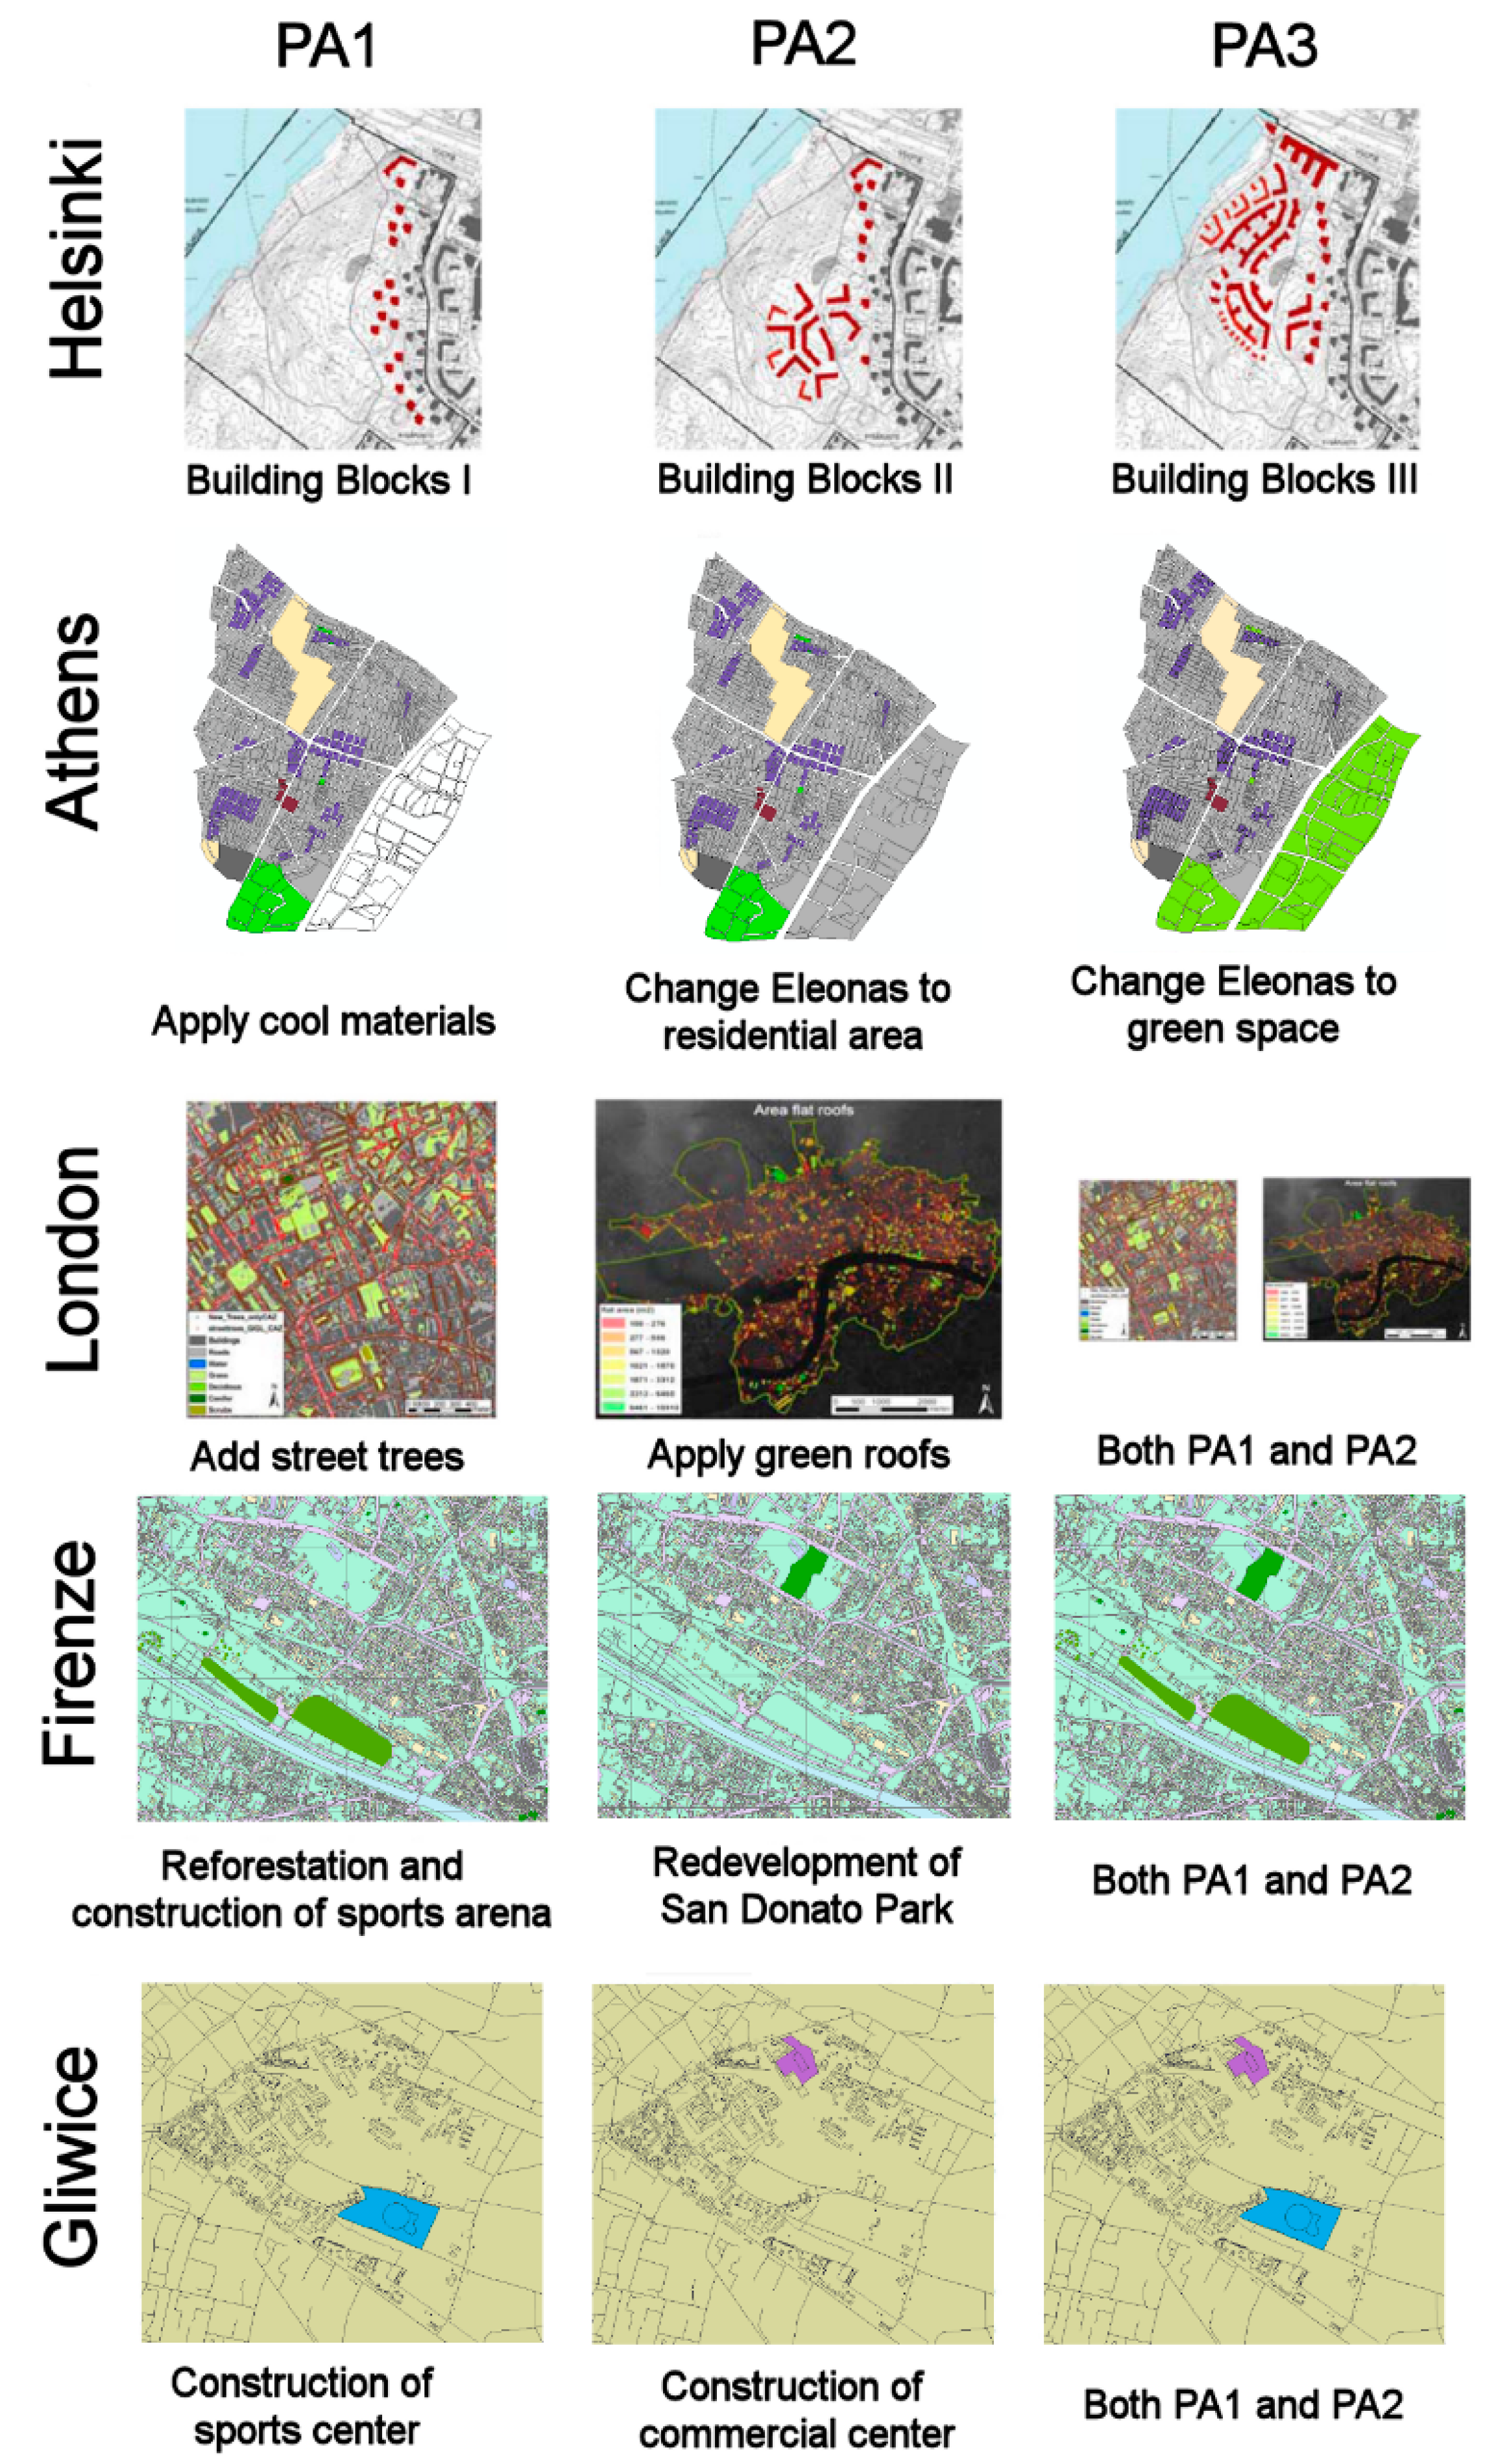
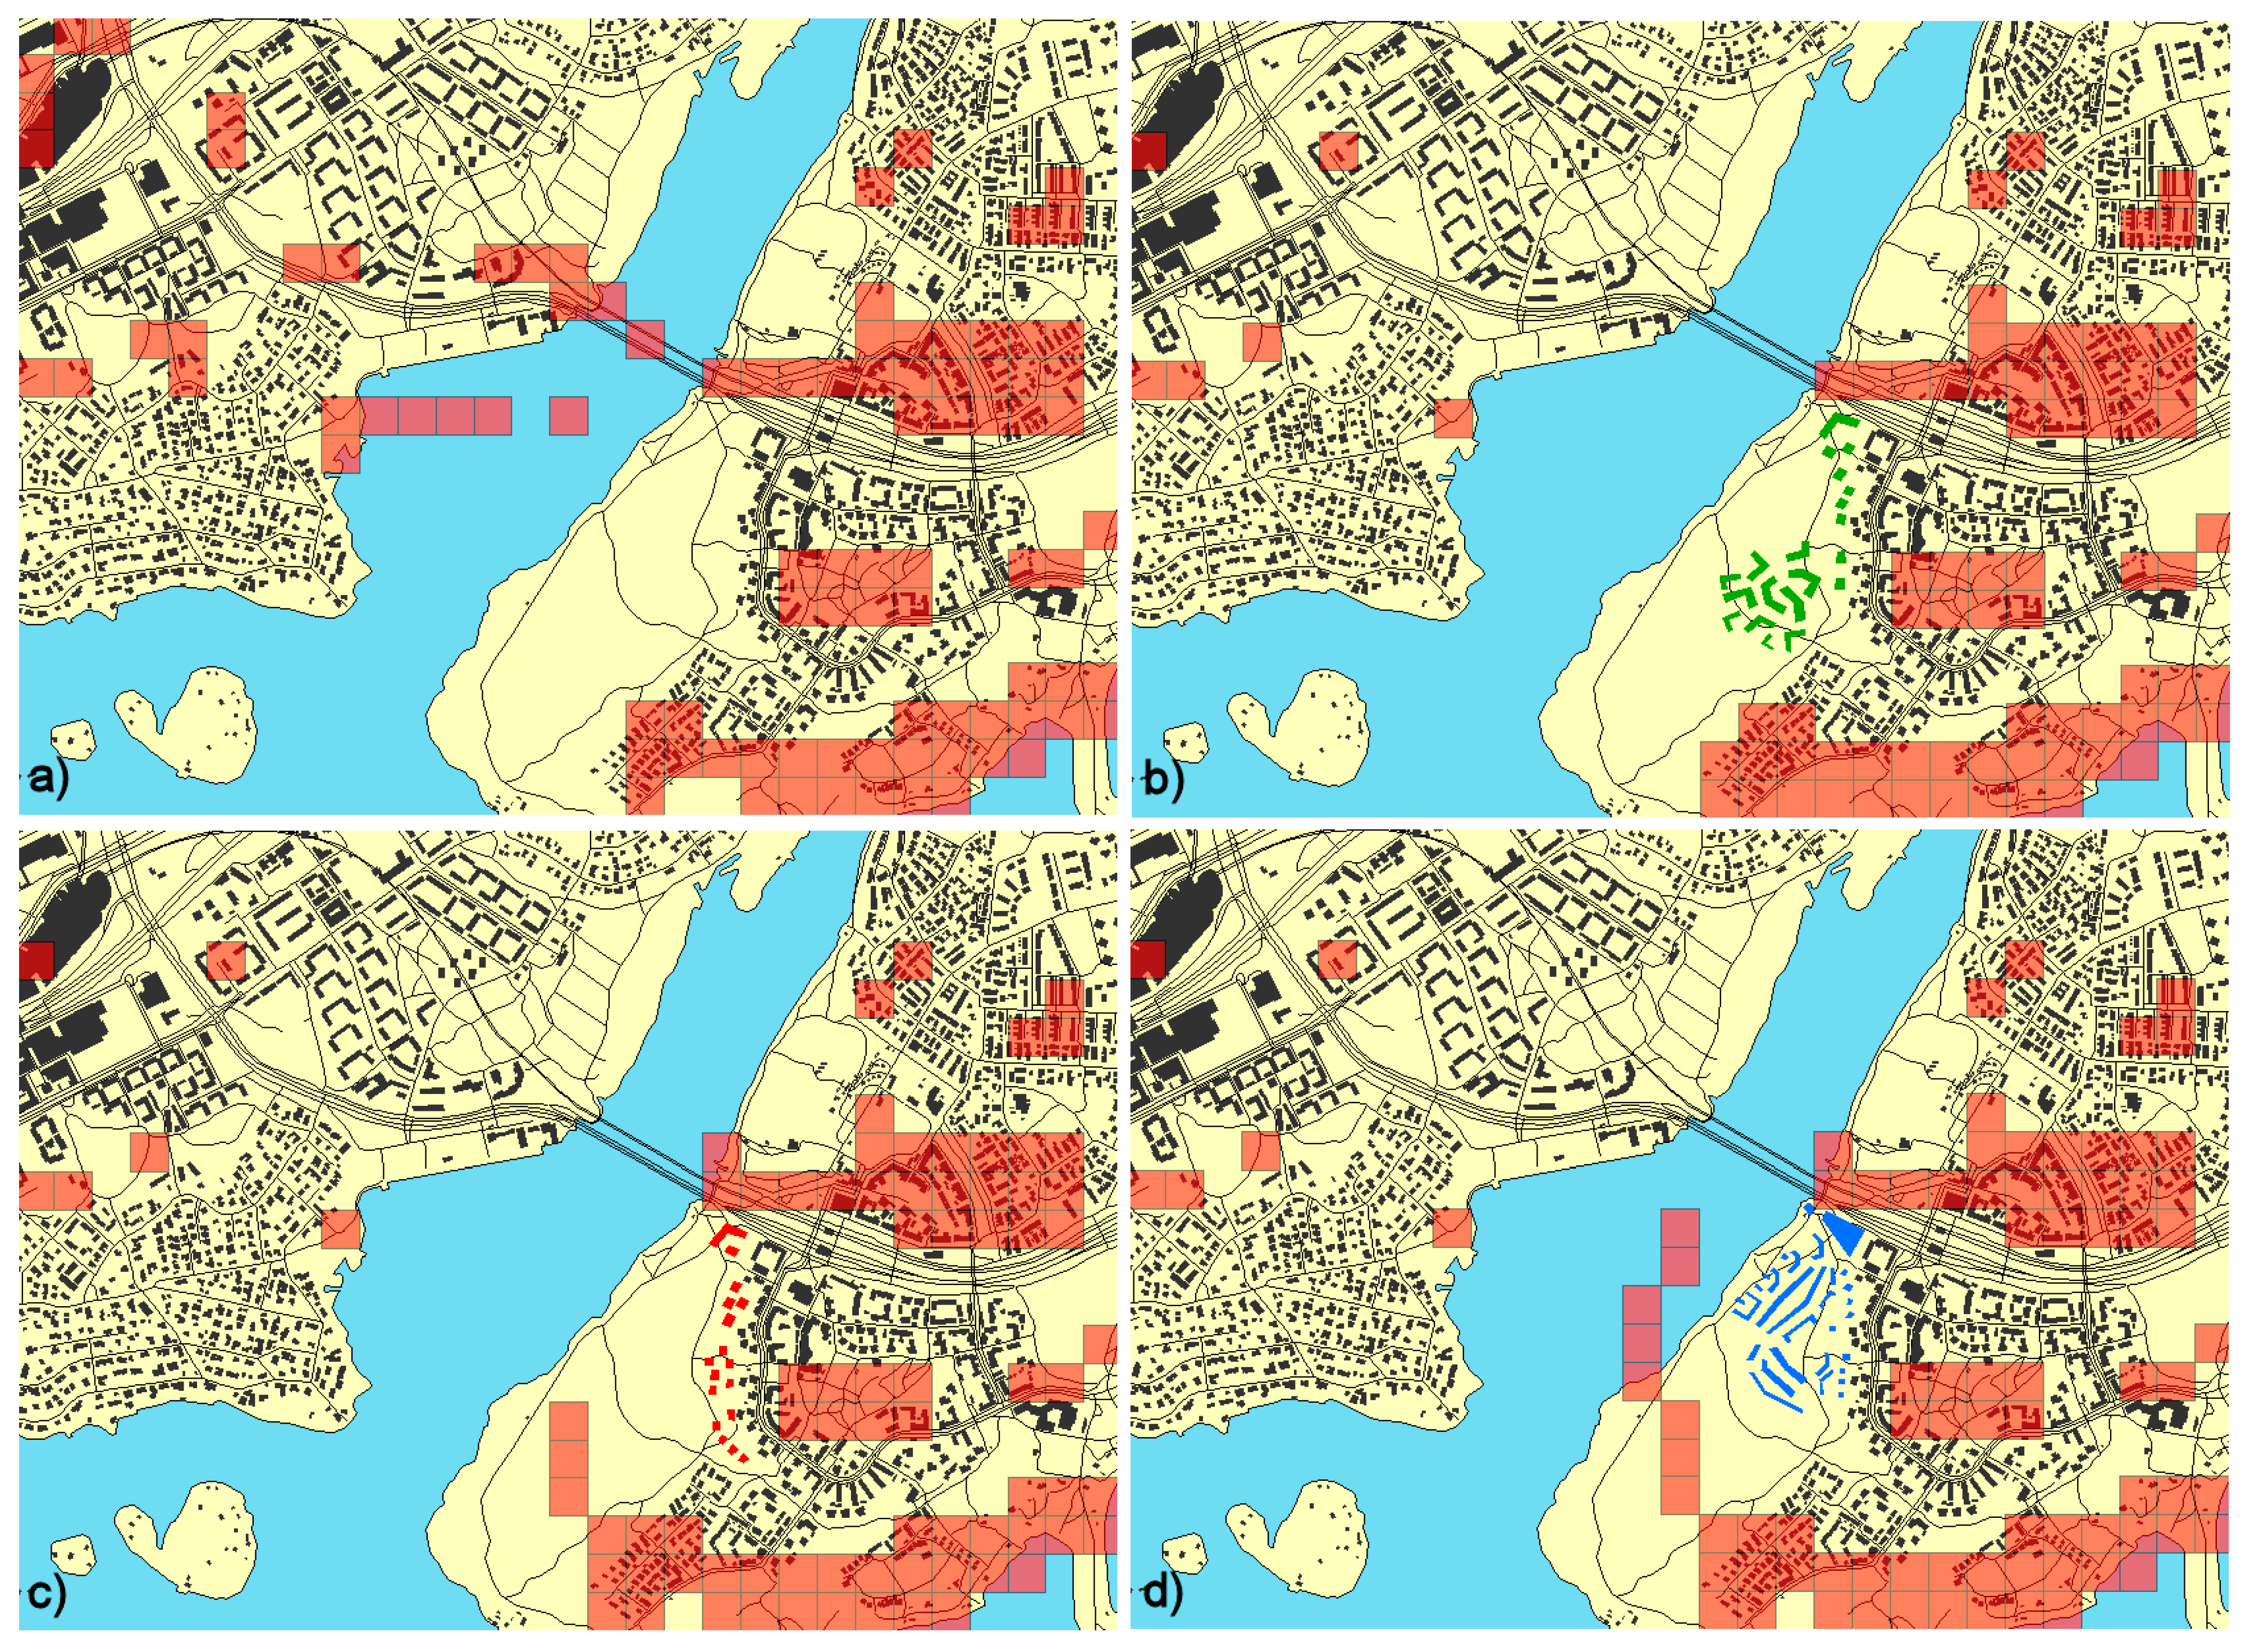
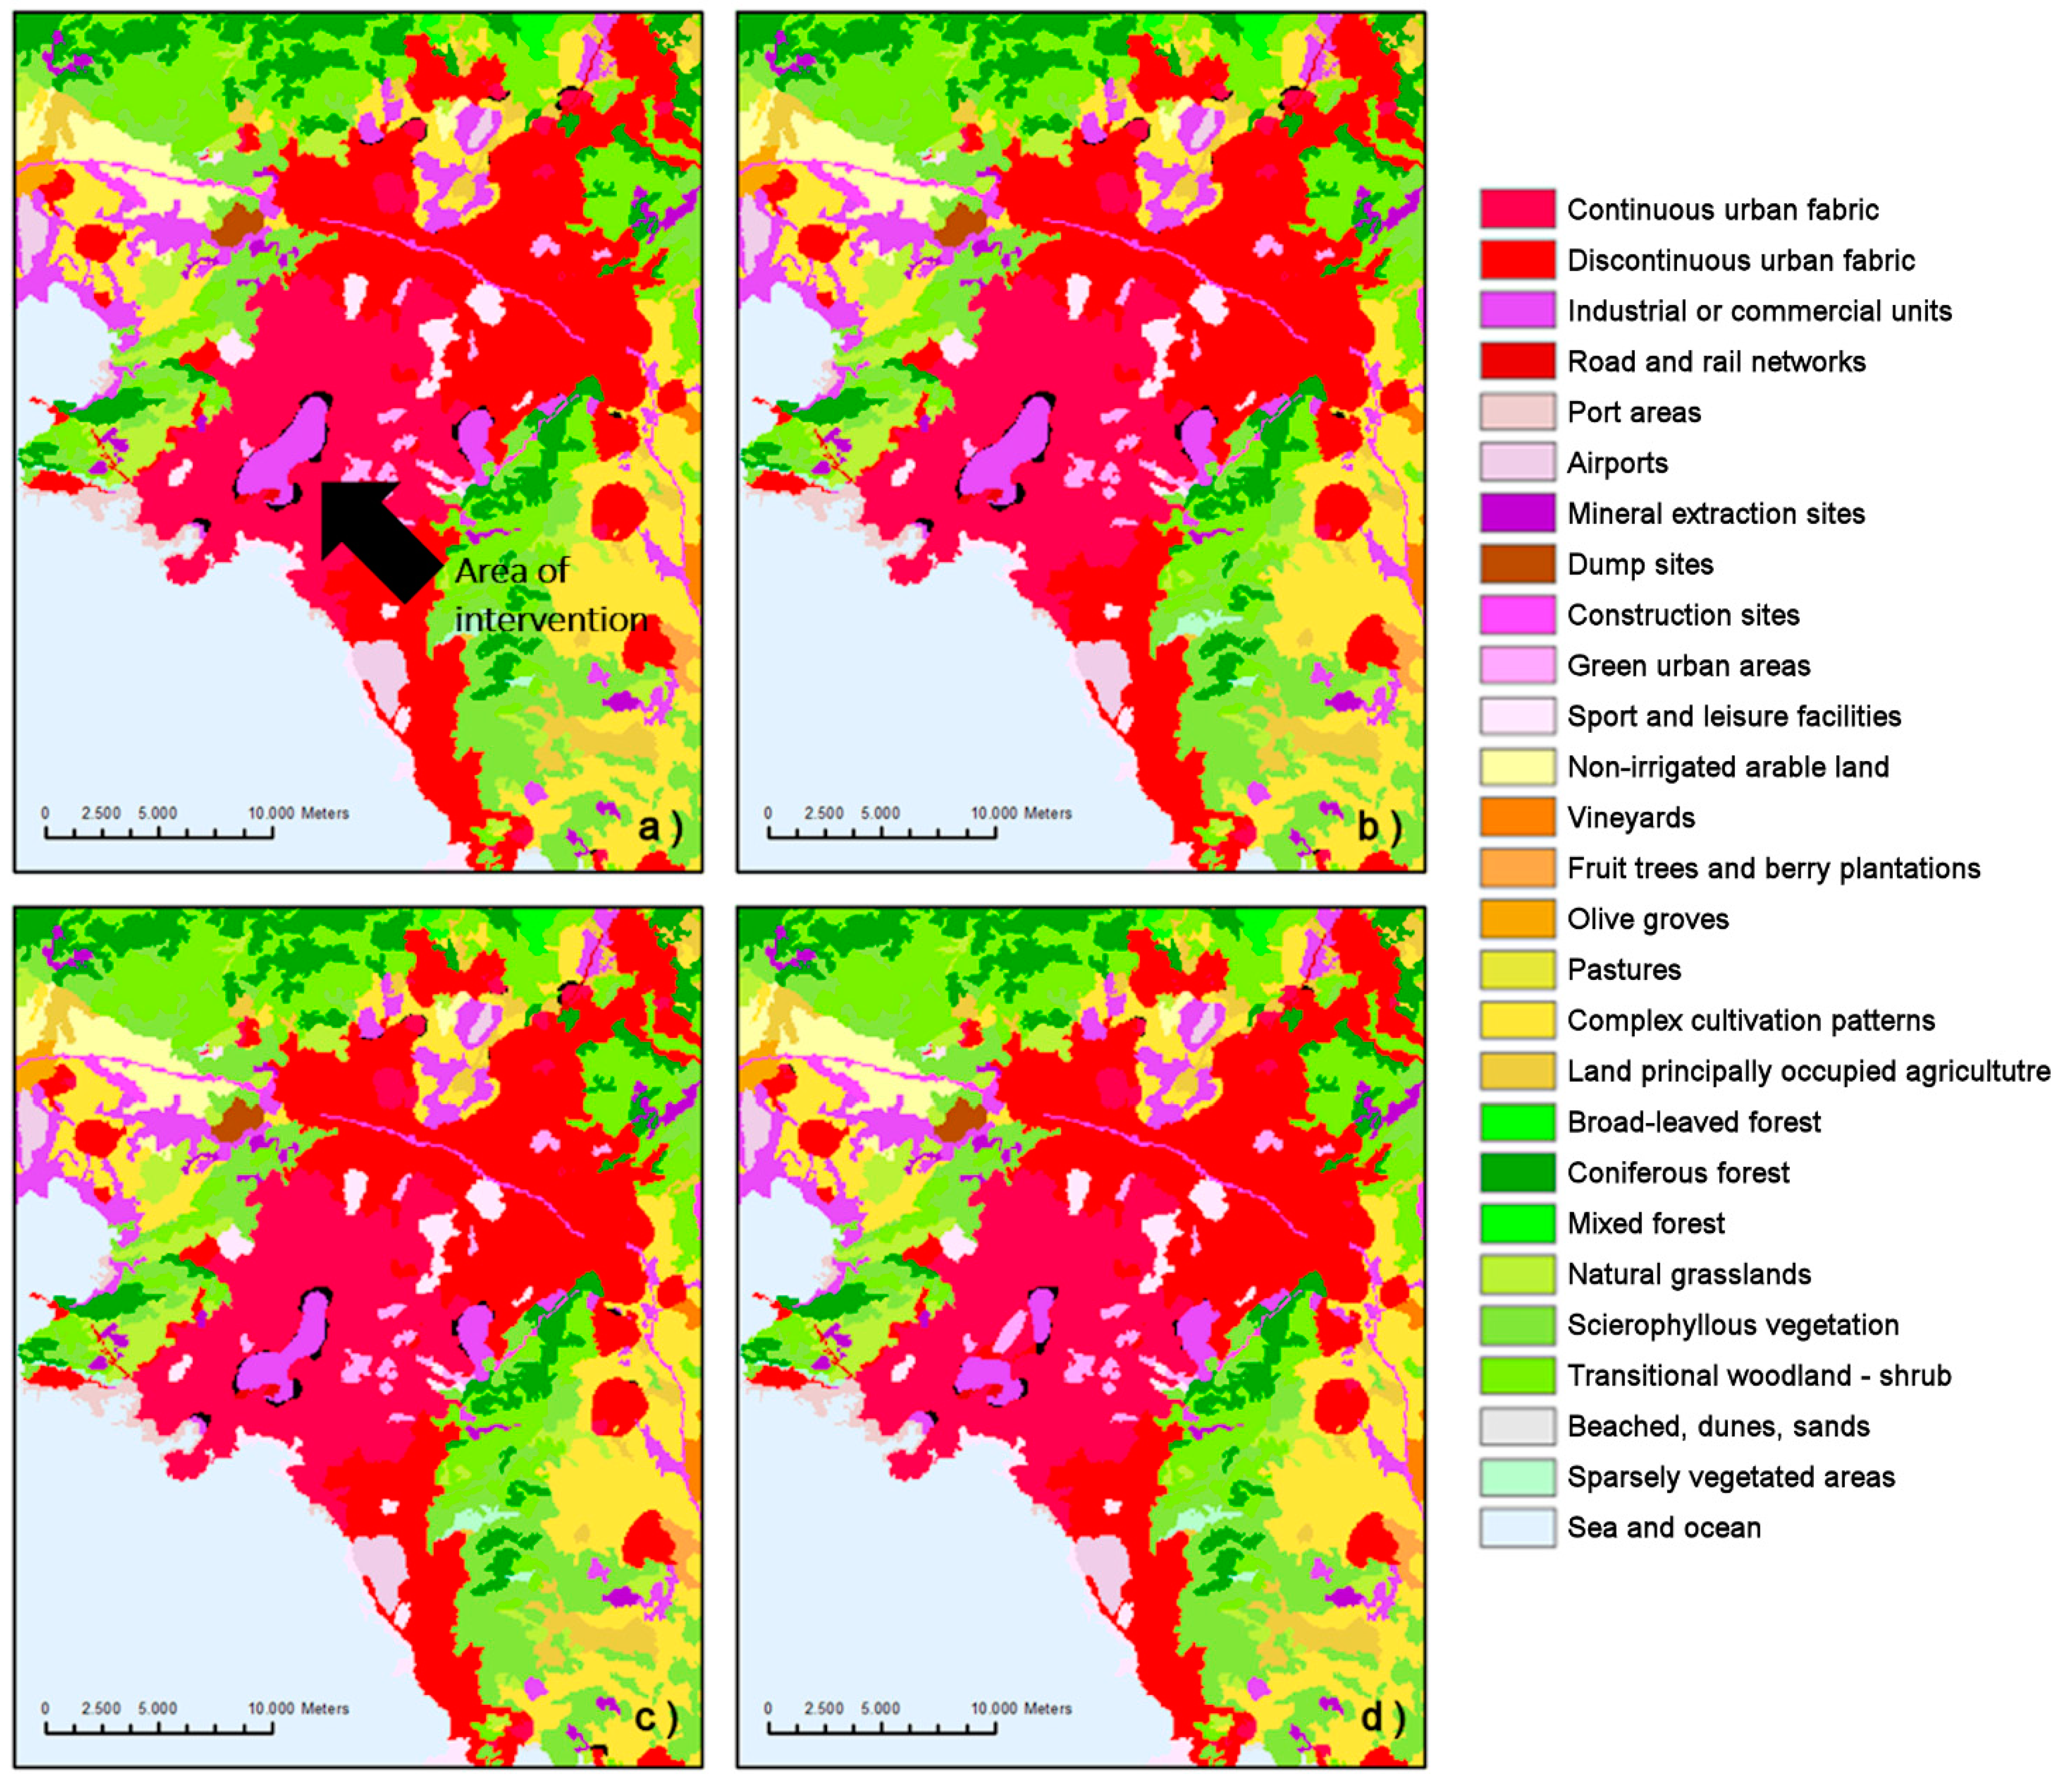
2.1. Study Sites

2.2. Physical-Flow Numerical Models
2.3. Data Collection and Organization
3. Algorithms Description and Implementation
3.1. Algorithms Description

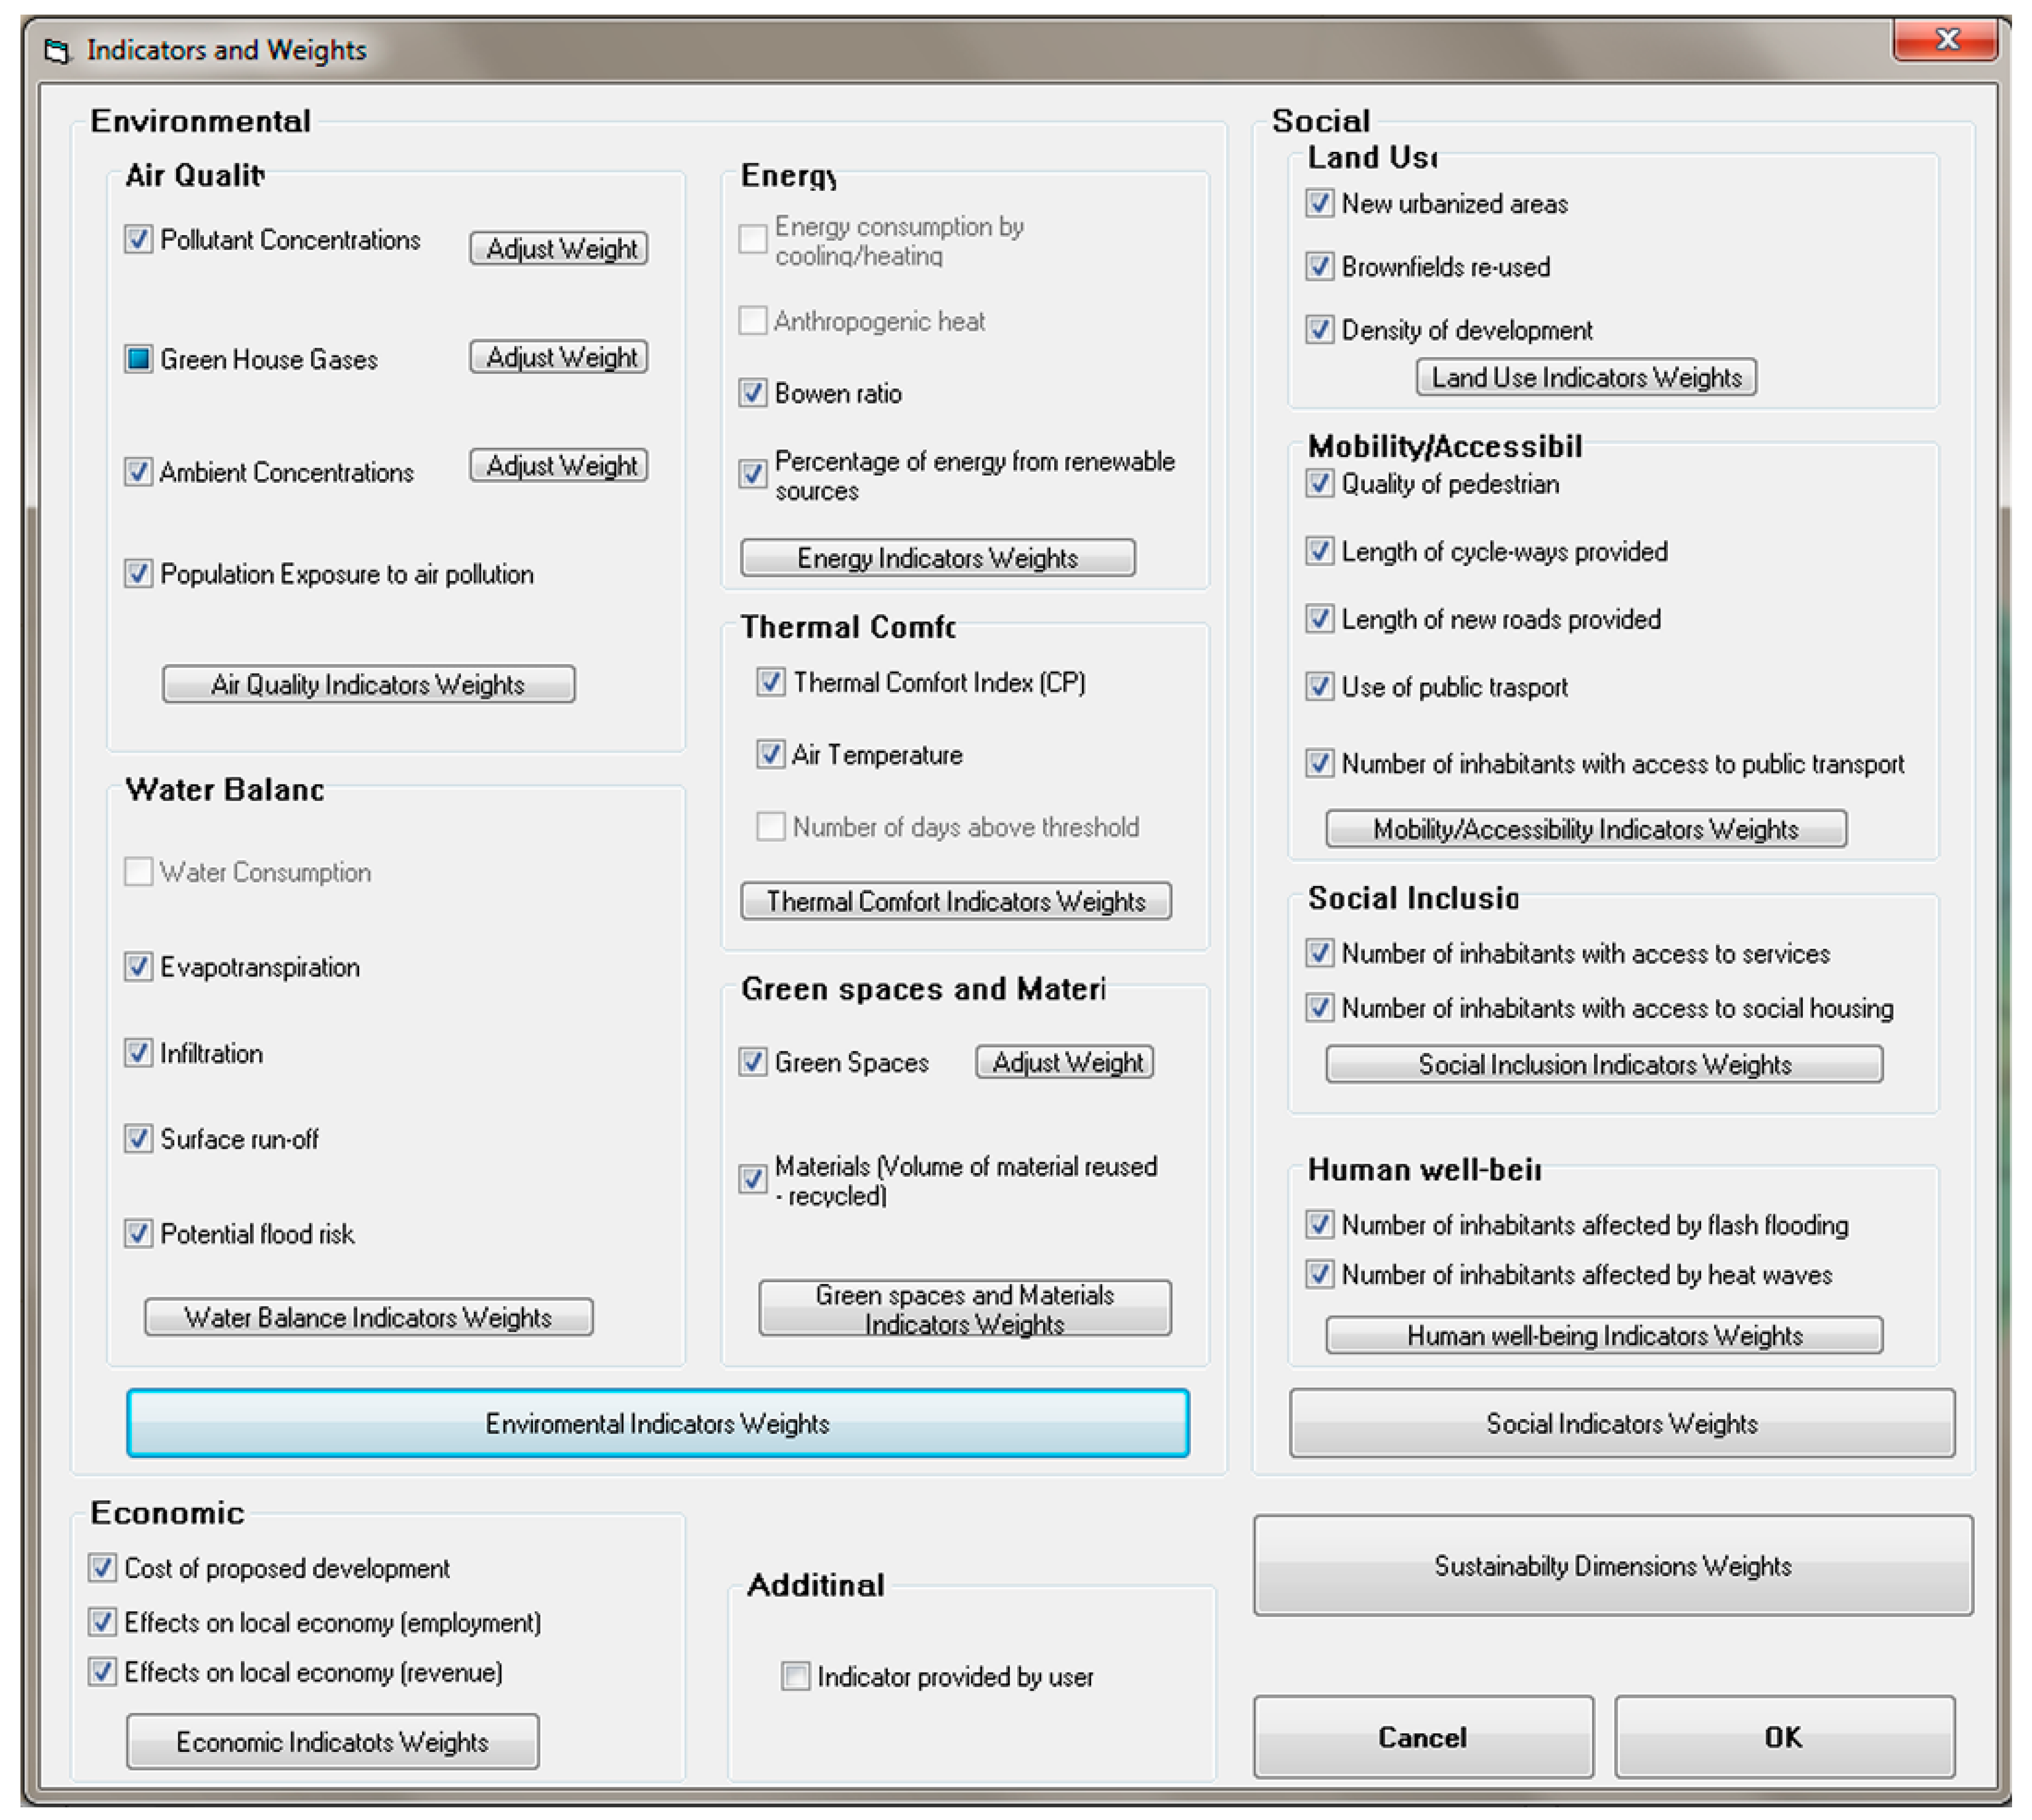
| Environmental Indicators | Social Indicators |
|---|---|
| Energy | Land Use |
| Energy consumption by cooling/heating (kWh/m2); Anthropogenic heat (W/m2); Bowen ratio (unitless); Percentage of energy from renewable sources (%) | New urbanized areas (m2); Brownfields re-used (m2); Density of development (built m2/total m2) |
| Thermal Comfort | Mobility/Accessibility |
| Thermal Comfort Index (Cooling Power); Air Temperature (°C); Number of days above threshold (days/total period) | Quality of pedestrian (qualitative); Length of cycle-ways provided (m); Length of new roads provided (m); Use of public transport (% of total population); Number of inhabitants with access to public transport (inhabitants within 500m of public transport) |
| Water | Social Inclusion |
| Water consumption (mm3); Evapotranspiration (mm3/m2); Infiltration (mm3/m2); Surface run-off (mm3/m2); Potential flood risk (peak mm3/m2 discharges) | Number of inhabitants with access to services (inhabitants/m2); Number of inhabitants with access to social housing (inhabitants/m2) |
| Air Quality | Human well-being |
| NOx, PM10, PM2.5, O3, CO, SO2 concentrations (μg/m3); NOx, PM10, O3, SO2 exceedances (threshold exceeded or not); NOx, PM10, O3, SO2 Potential Population Exposure | Number of inhabitants affected by flash flooding (No. of inhabitants); Number of inhabitants affected by heat waves (No. of inhabitants) |
| Greenhouse Gases | Economic Indicators |
| CO2, CH4 Emissions (tonnes) | Cost of proposed development(€ or €/m2); Effects on local economy (No. of new jobs created); Effects on local economy (€ or €/m2) |
| Value | Verbal Term |
|---|---|
| 0 | same importance |
| 1 | slightly more important |
| 2 | weakly more important |
| 3 | weakly to moderate more important |
| 4 | moderately more important |
| 5 | moderately to strongly more important |
| 6 | strongly more important |
| 7 | greatly more important |
| 8 | absolutely more important |
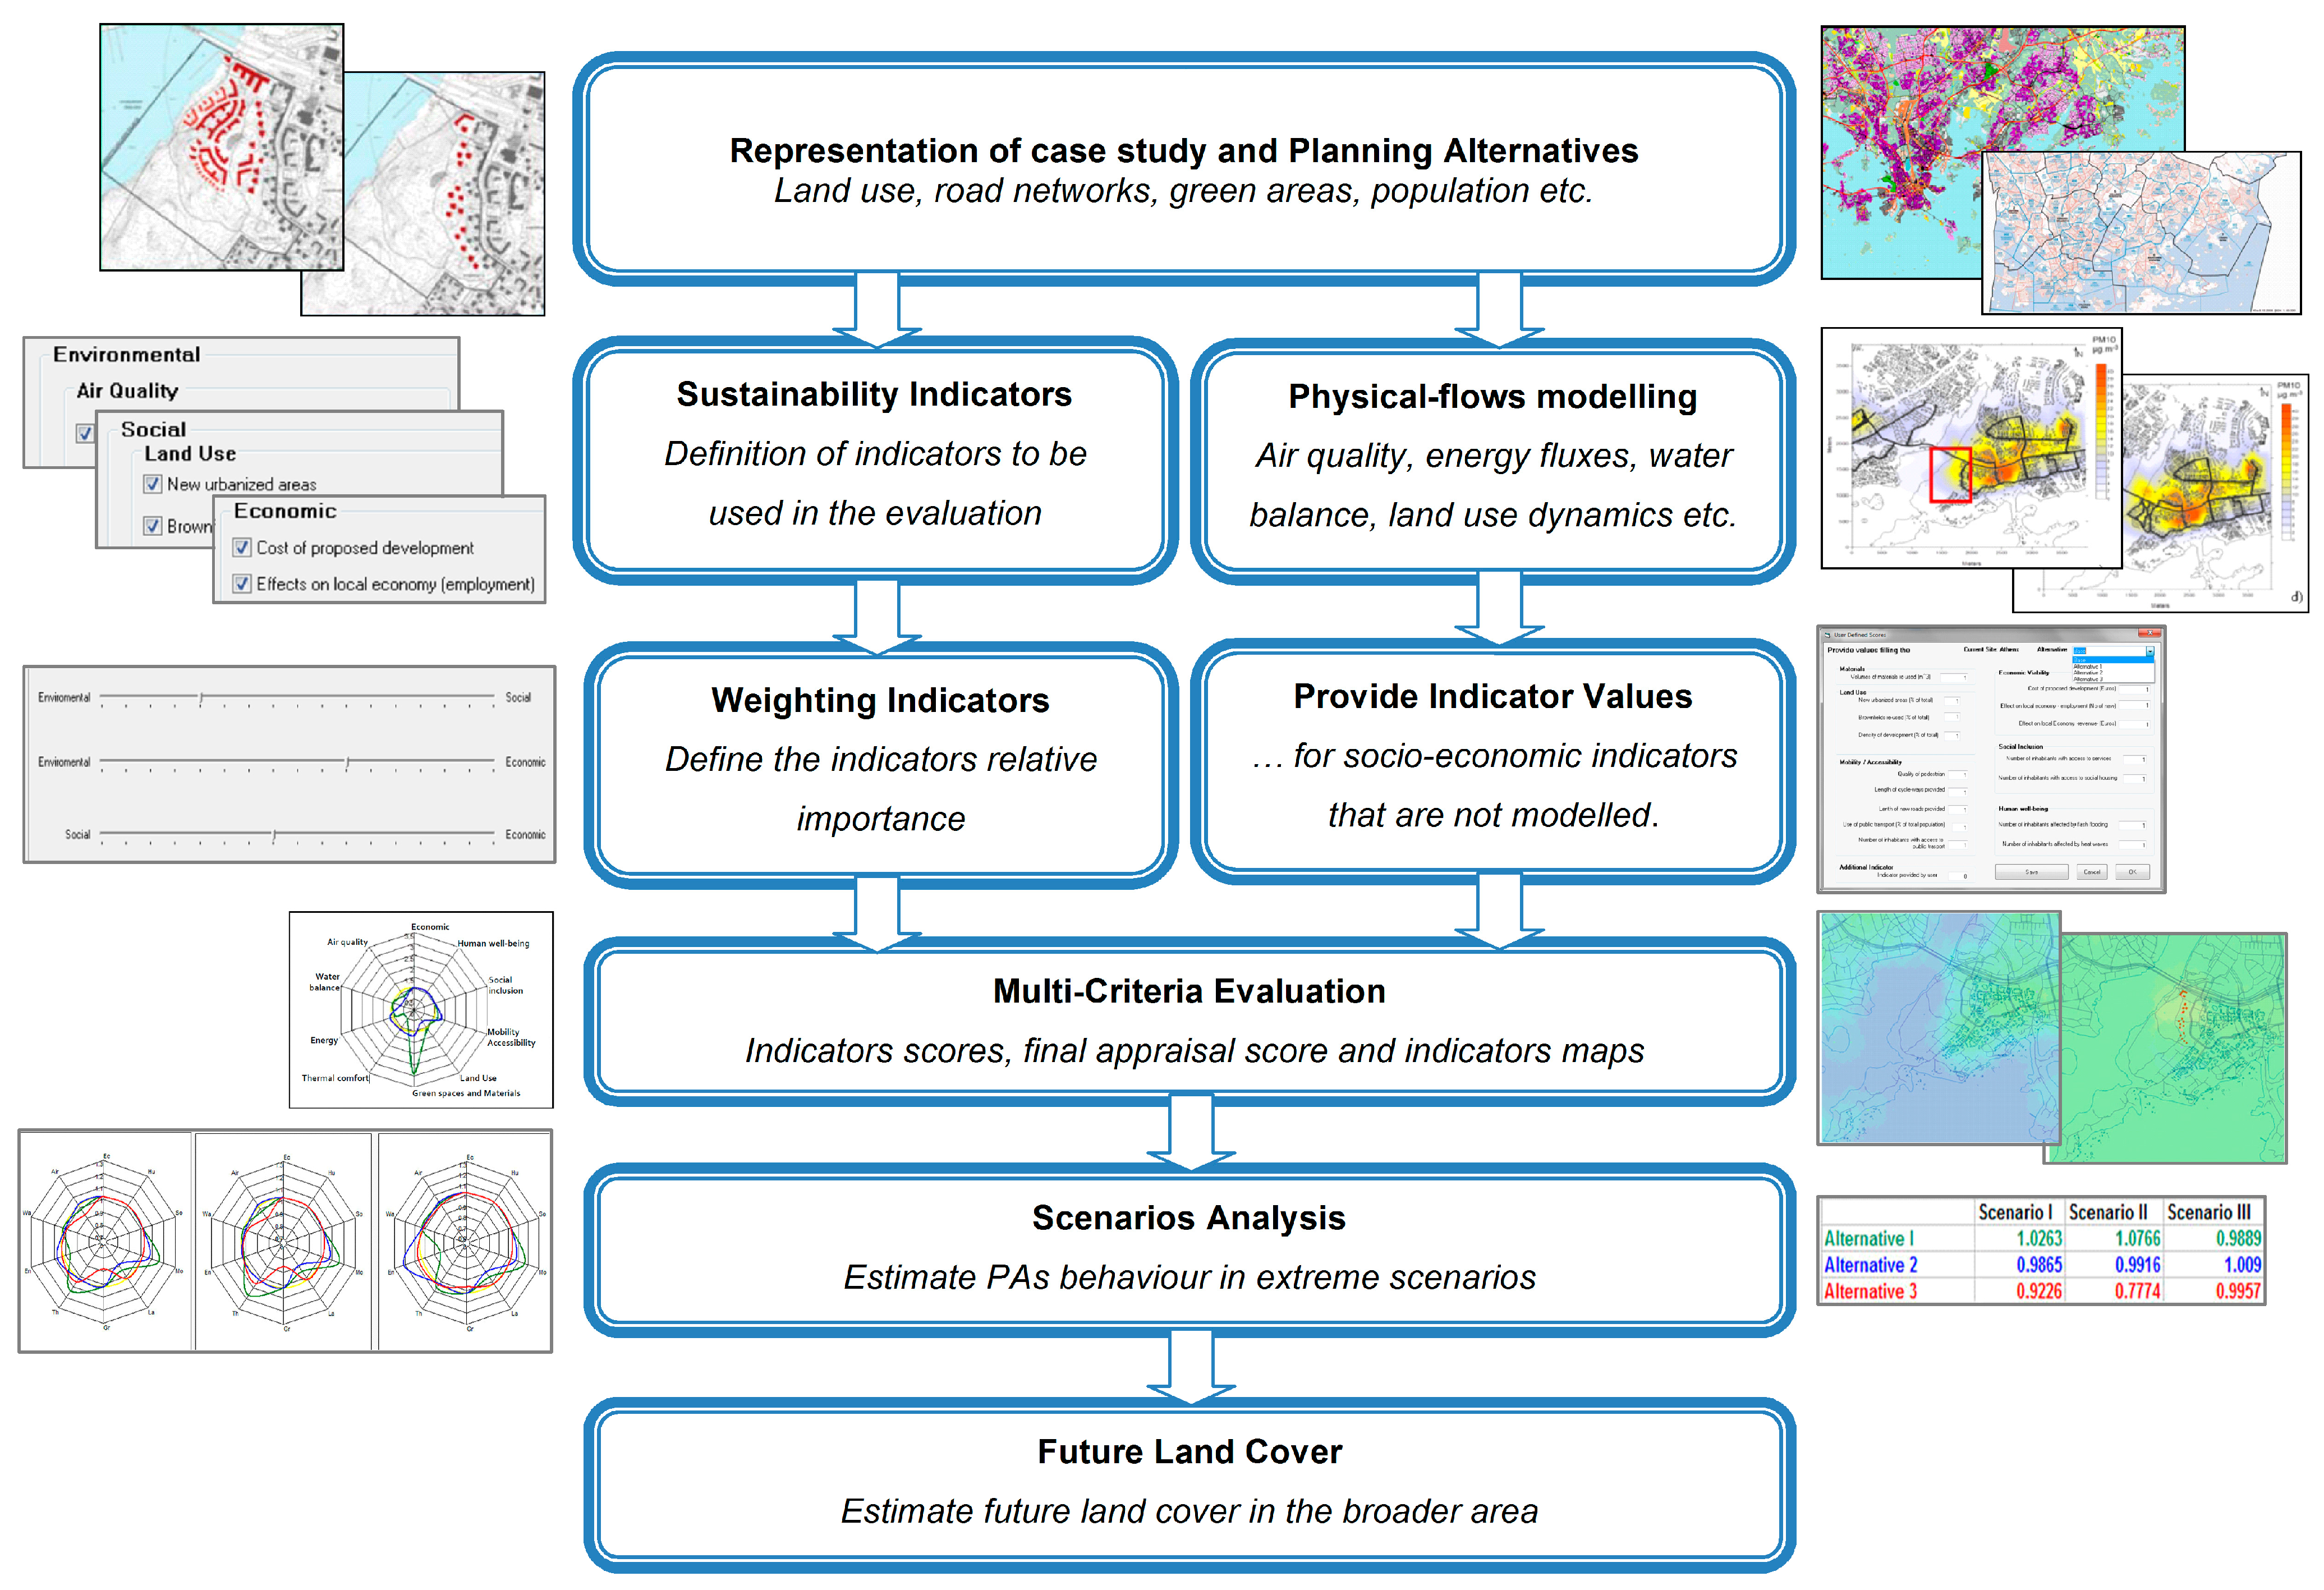
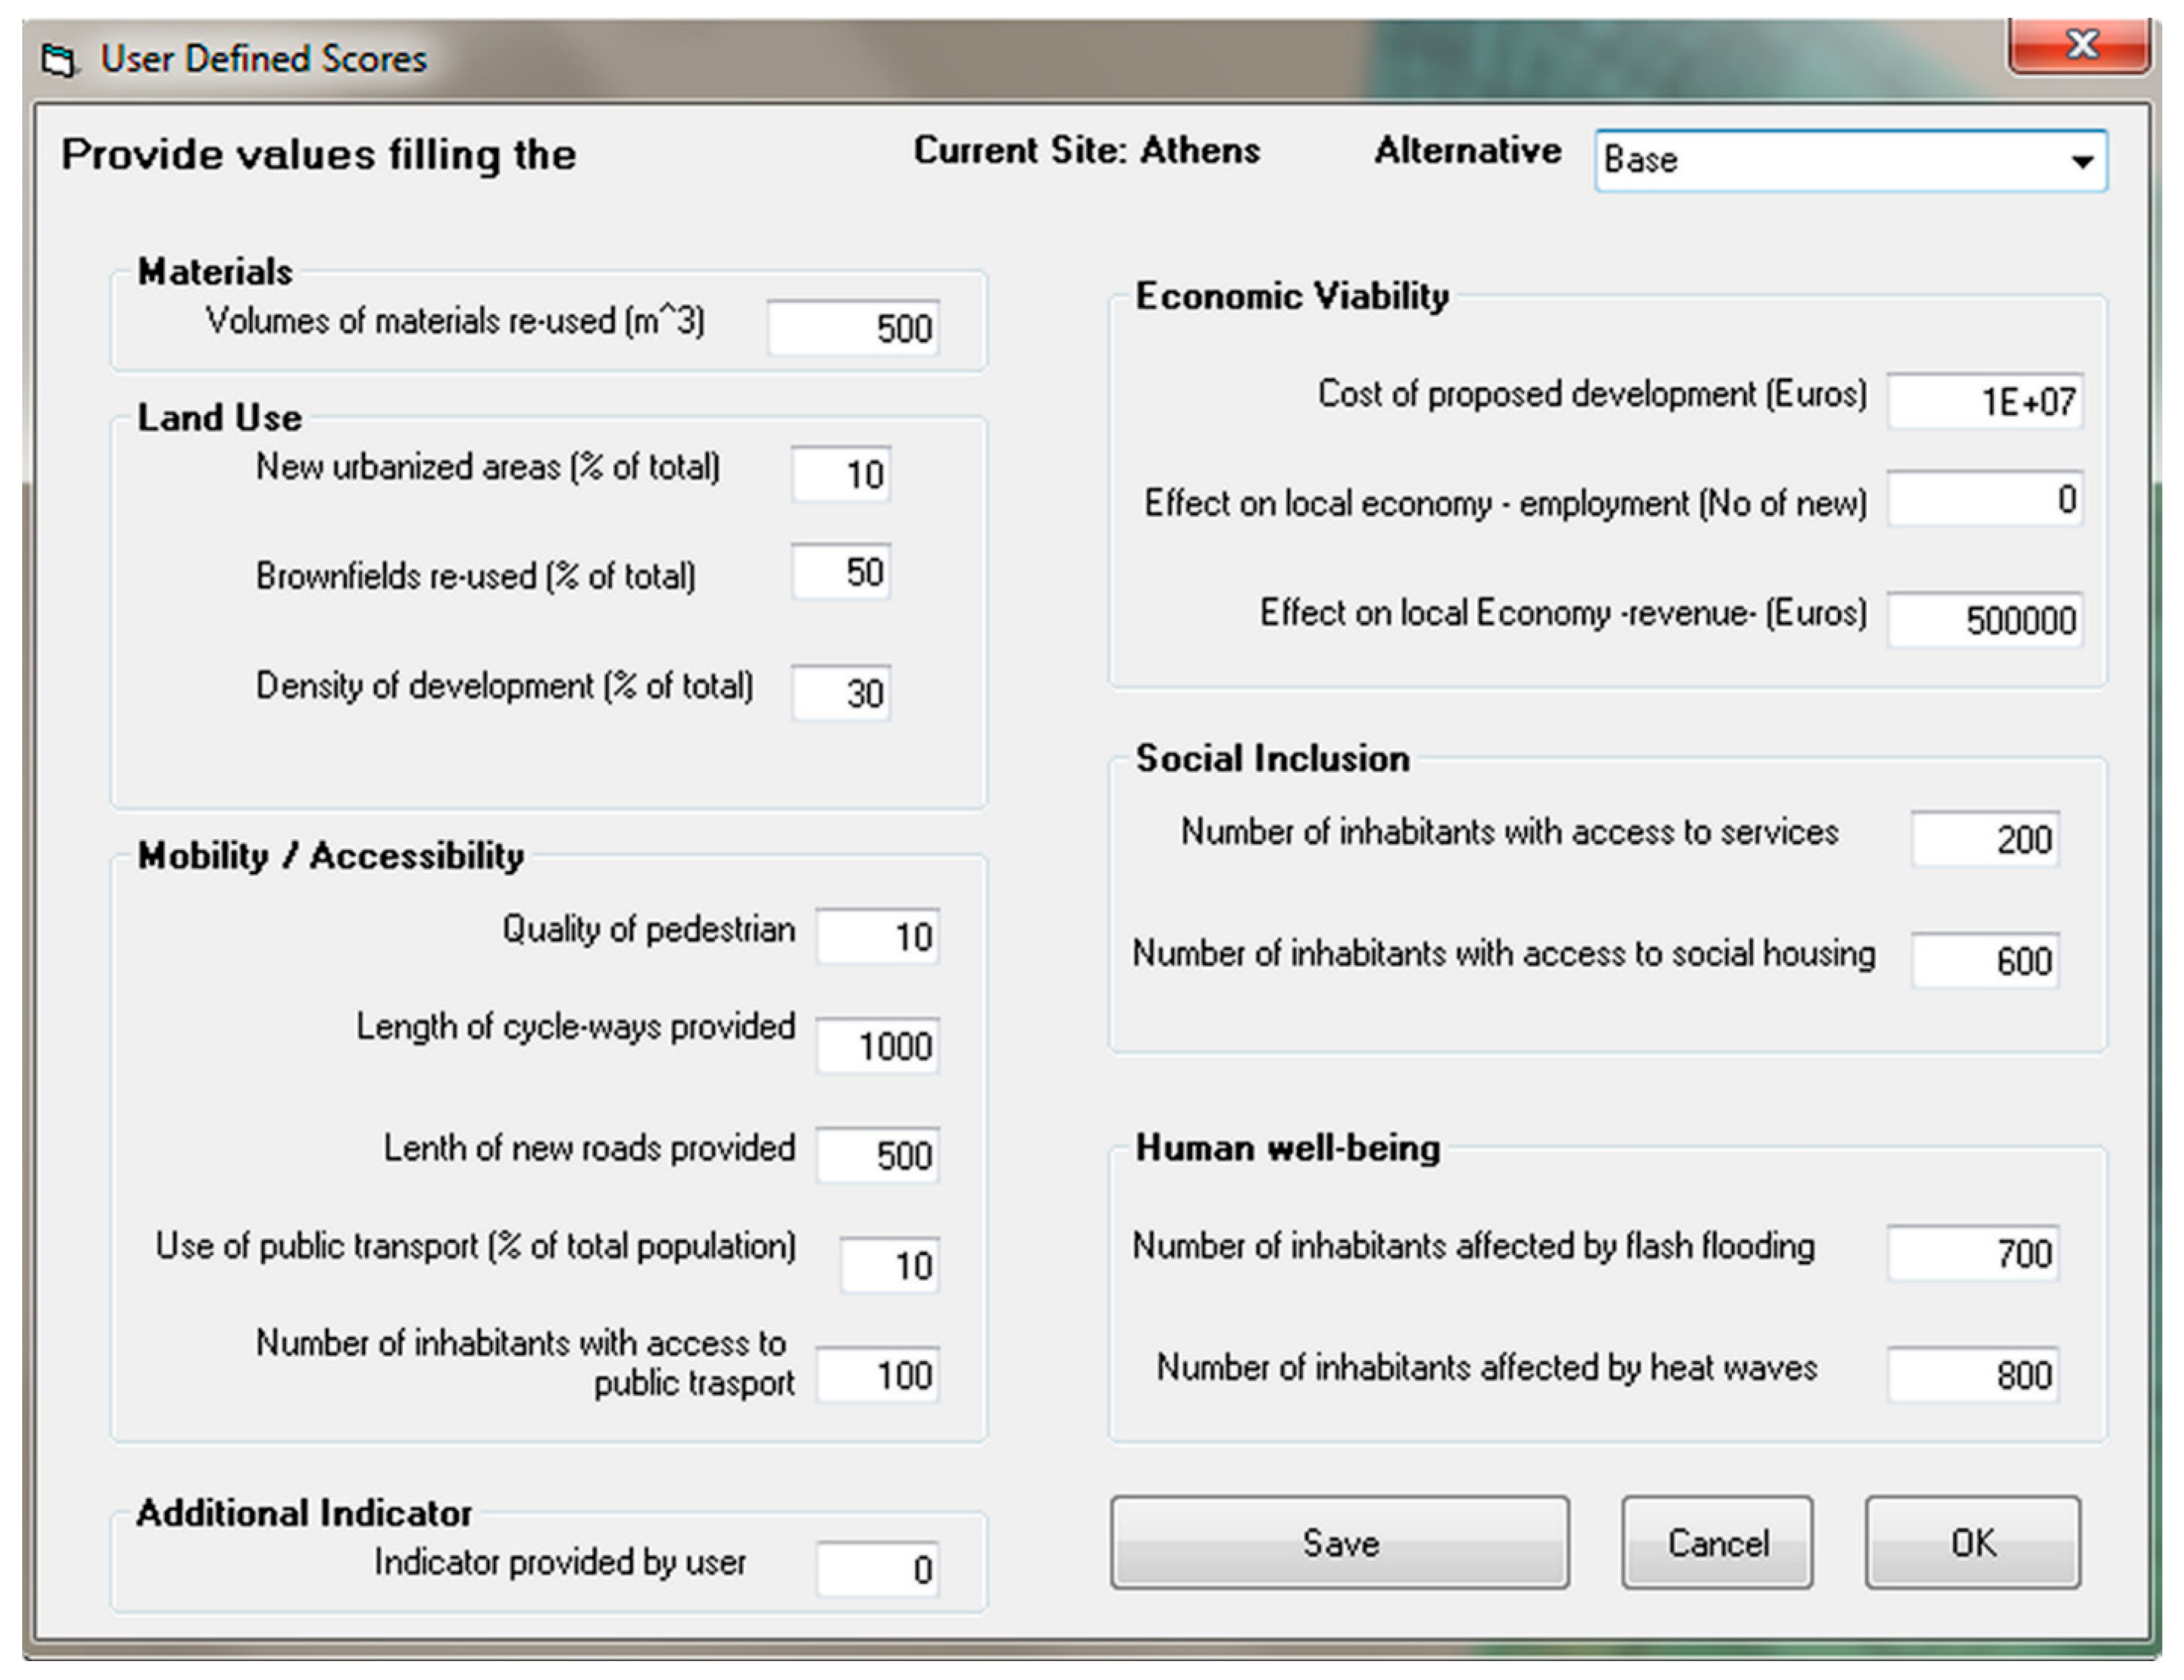
3.2. Implementation
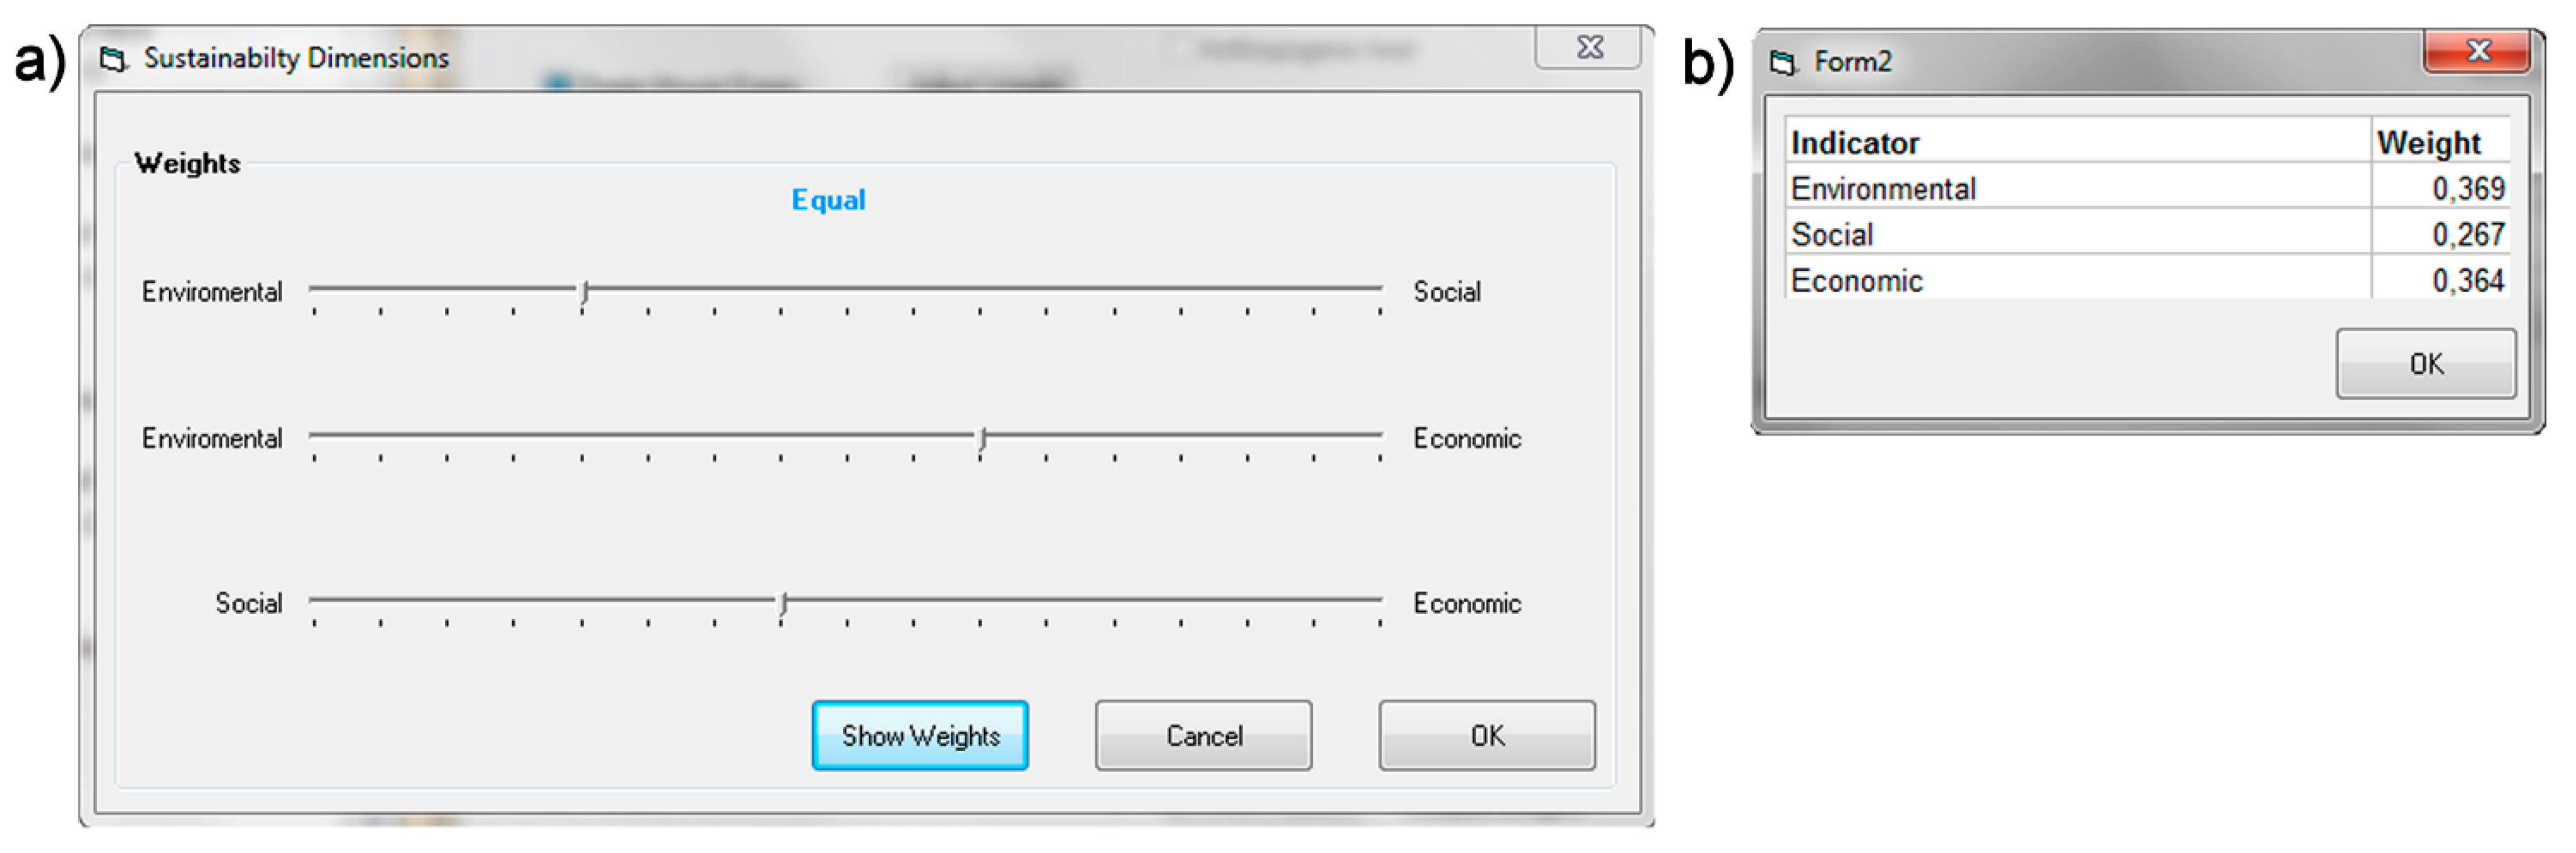
3.2.1. MCE Procedure


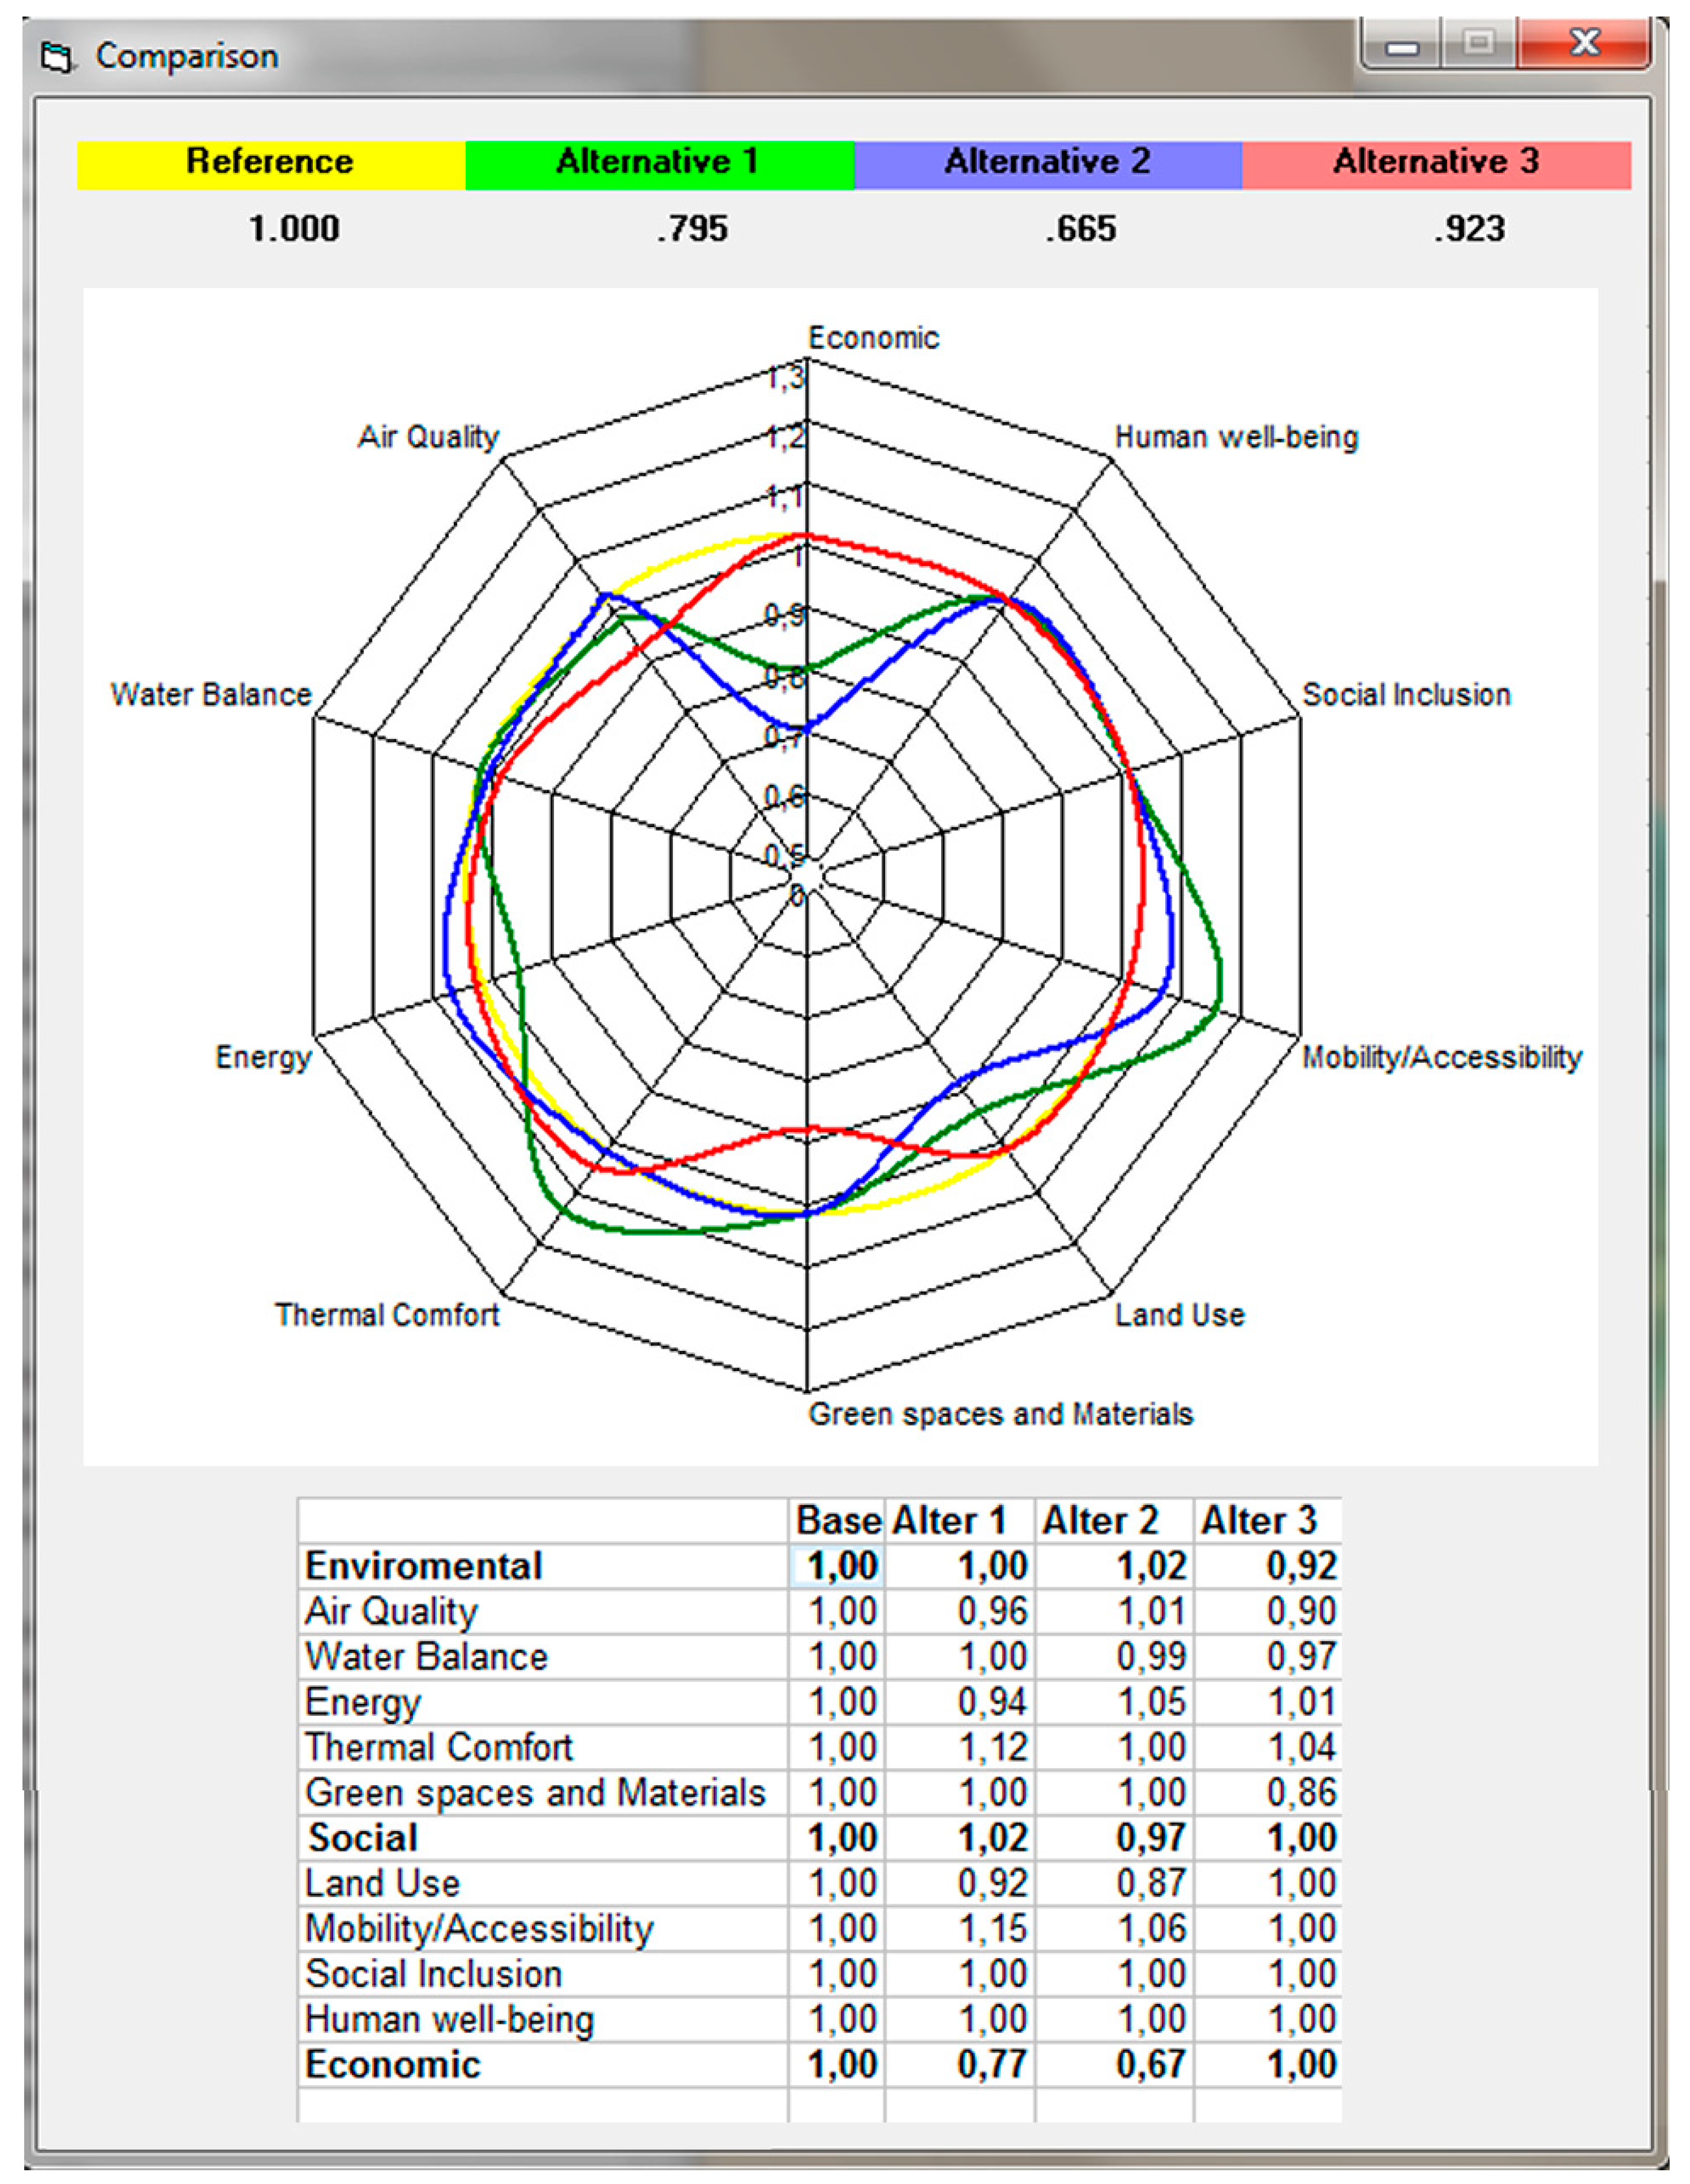
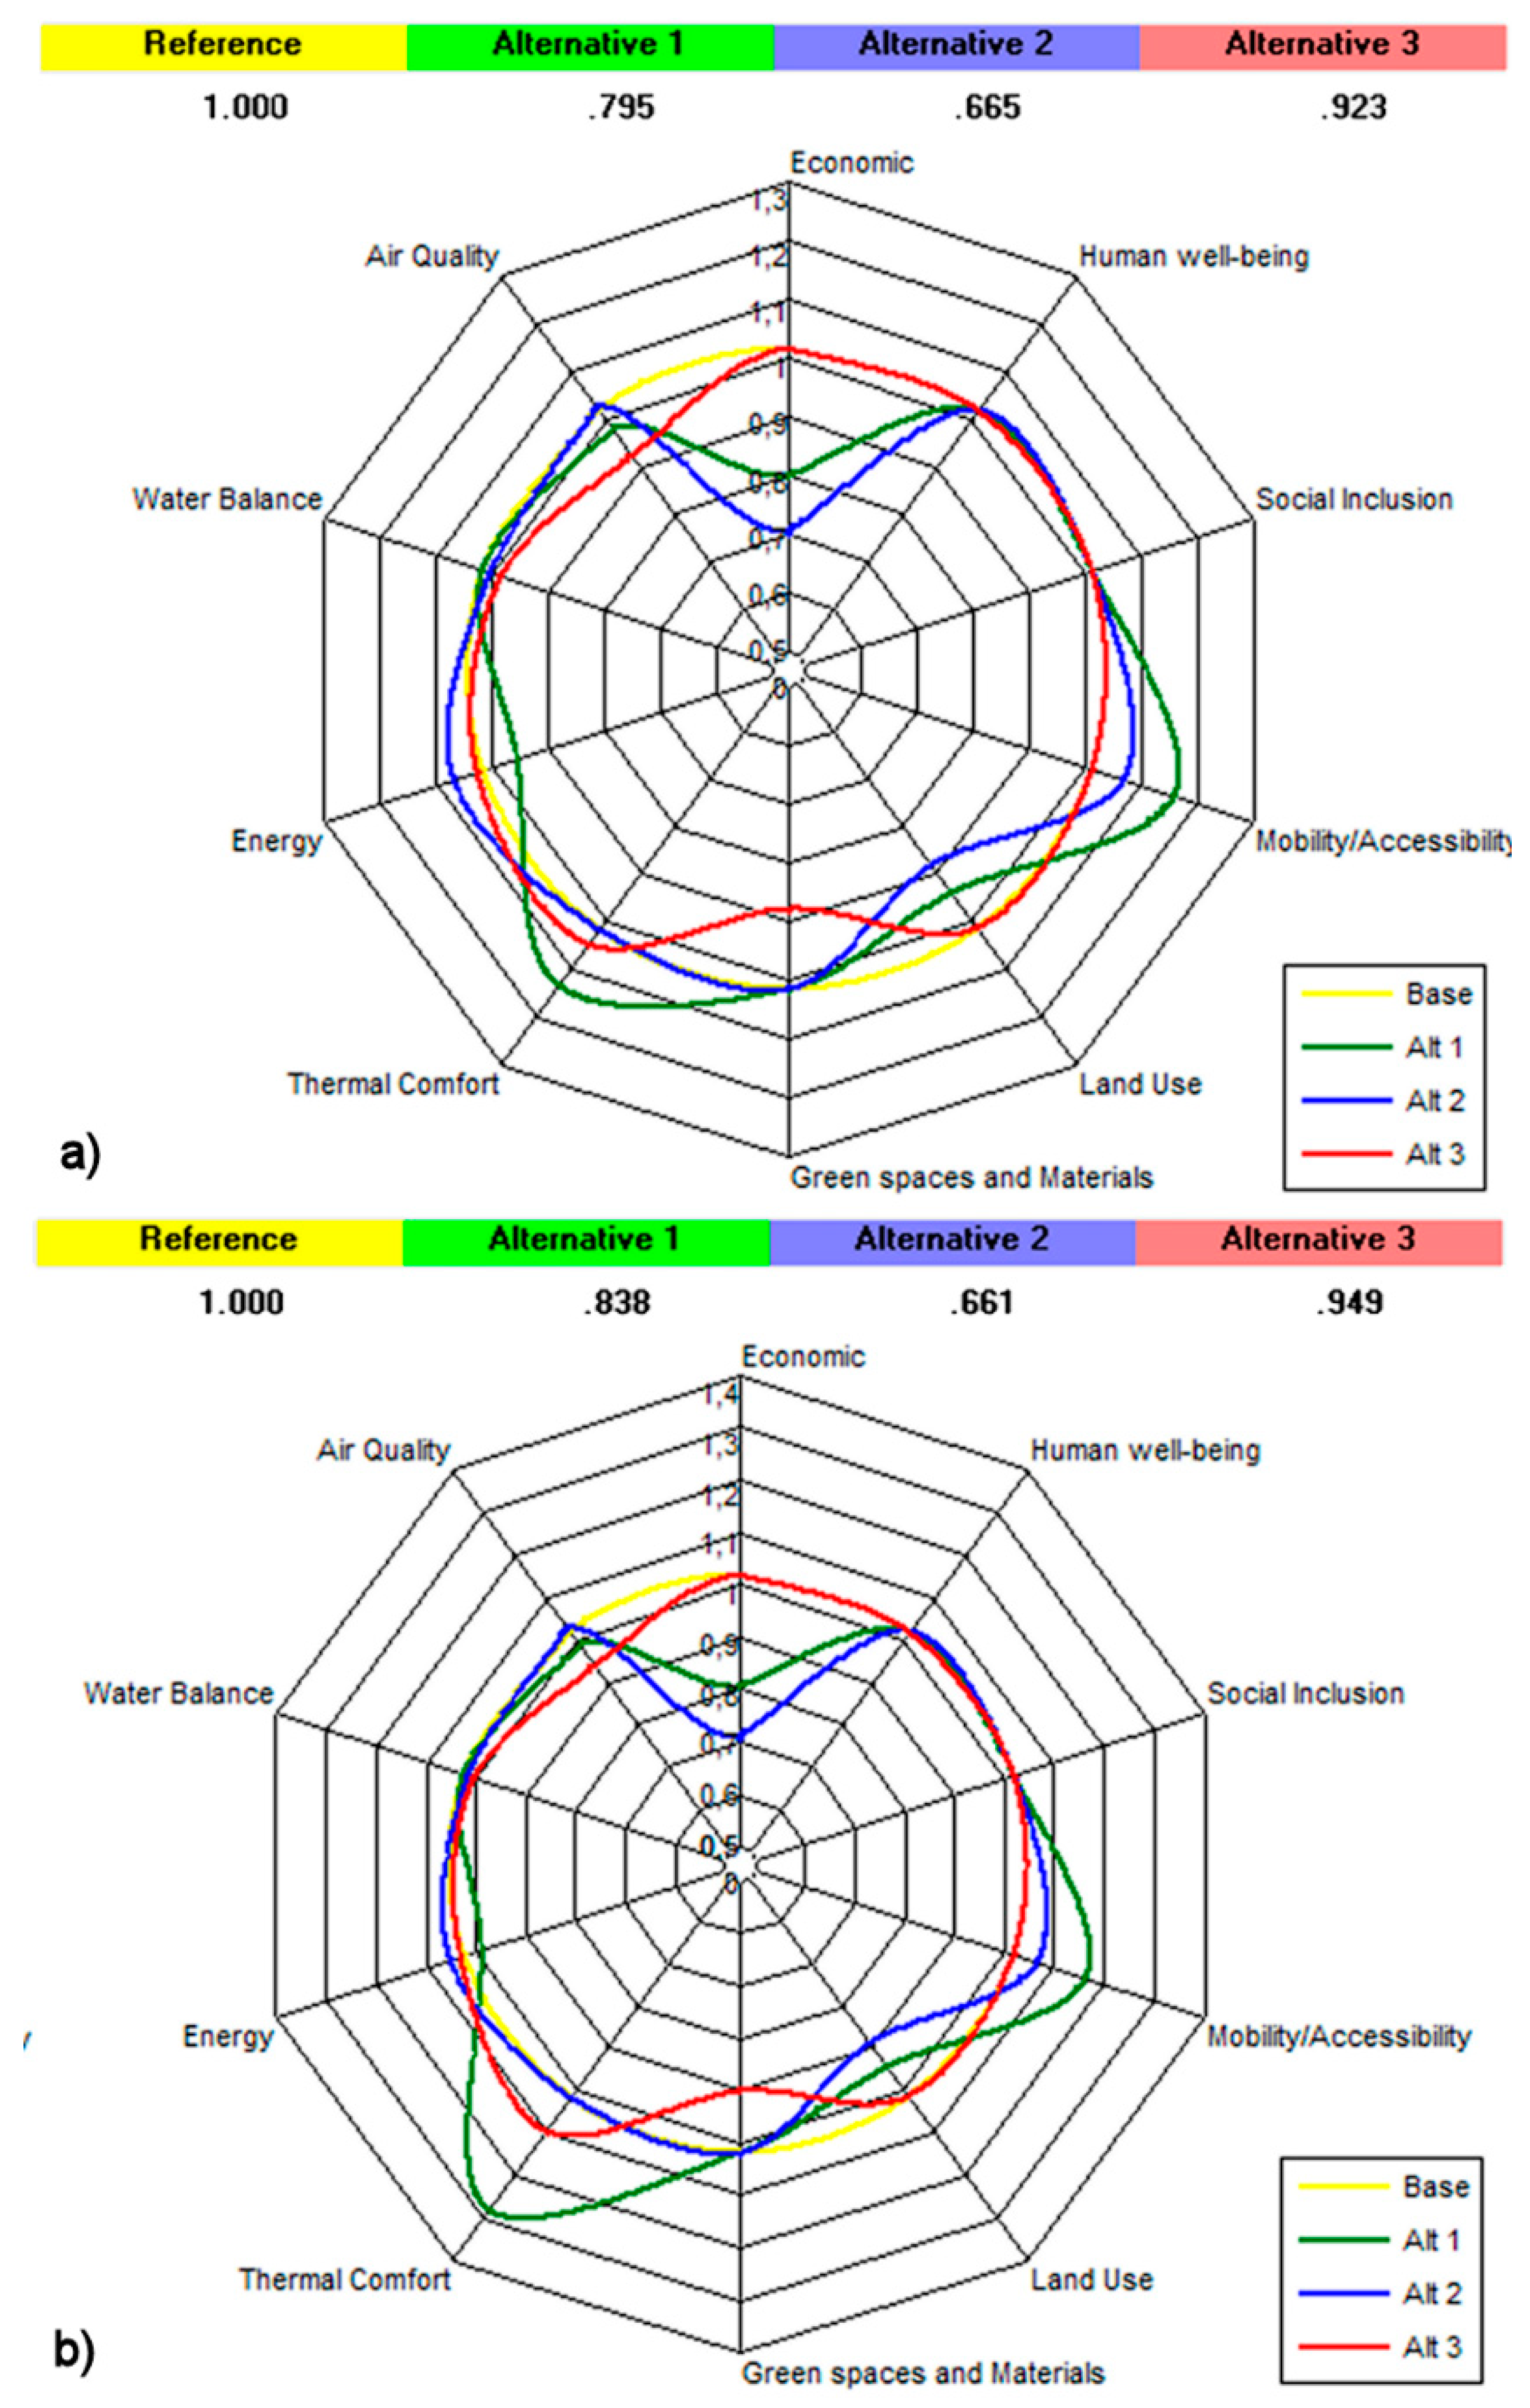
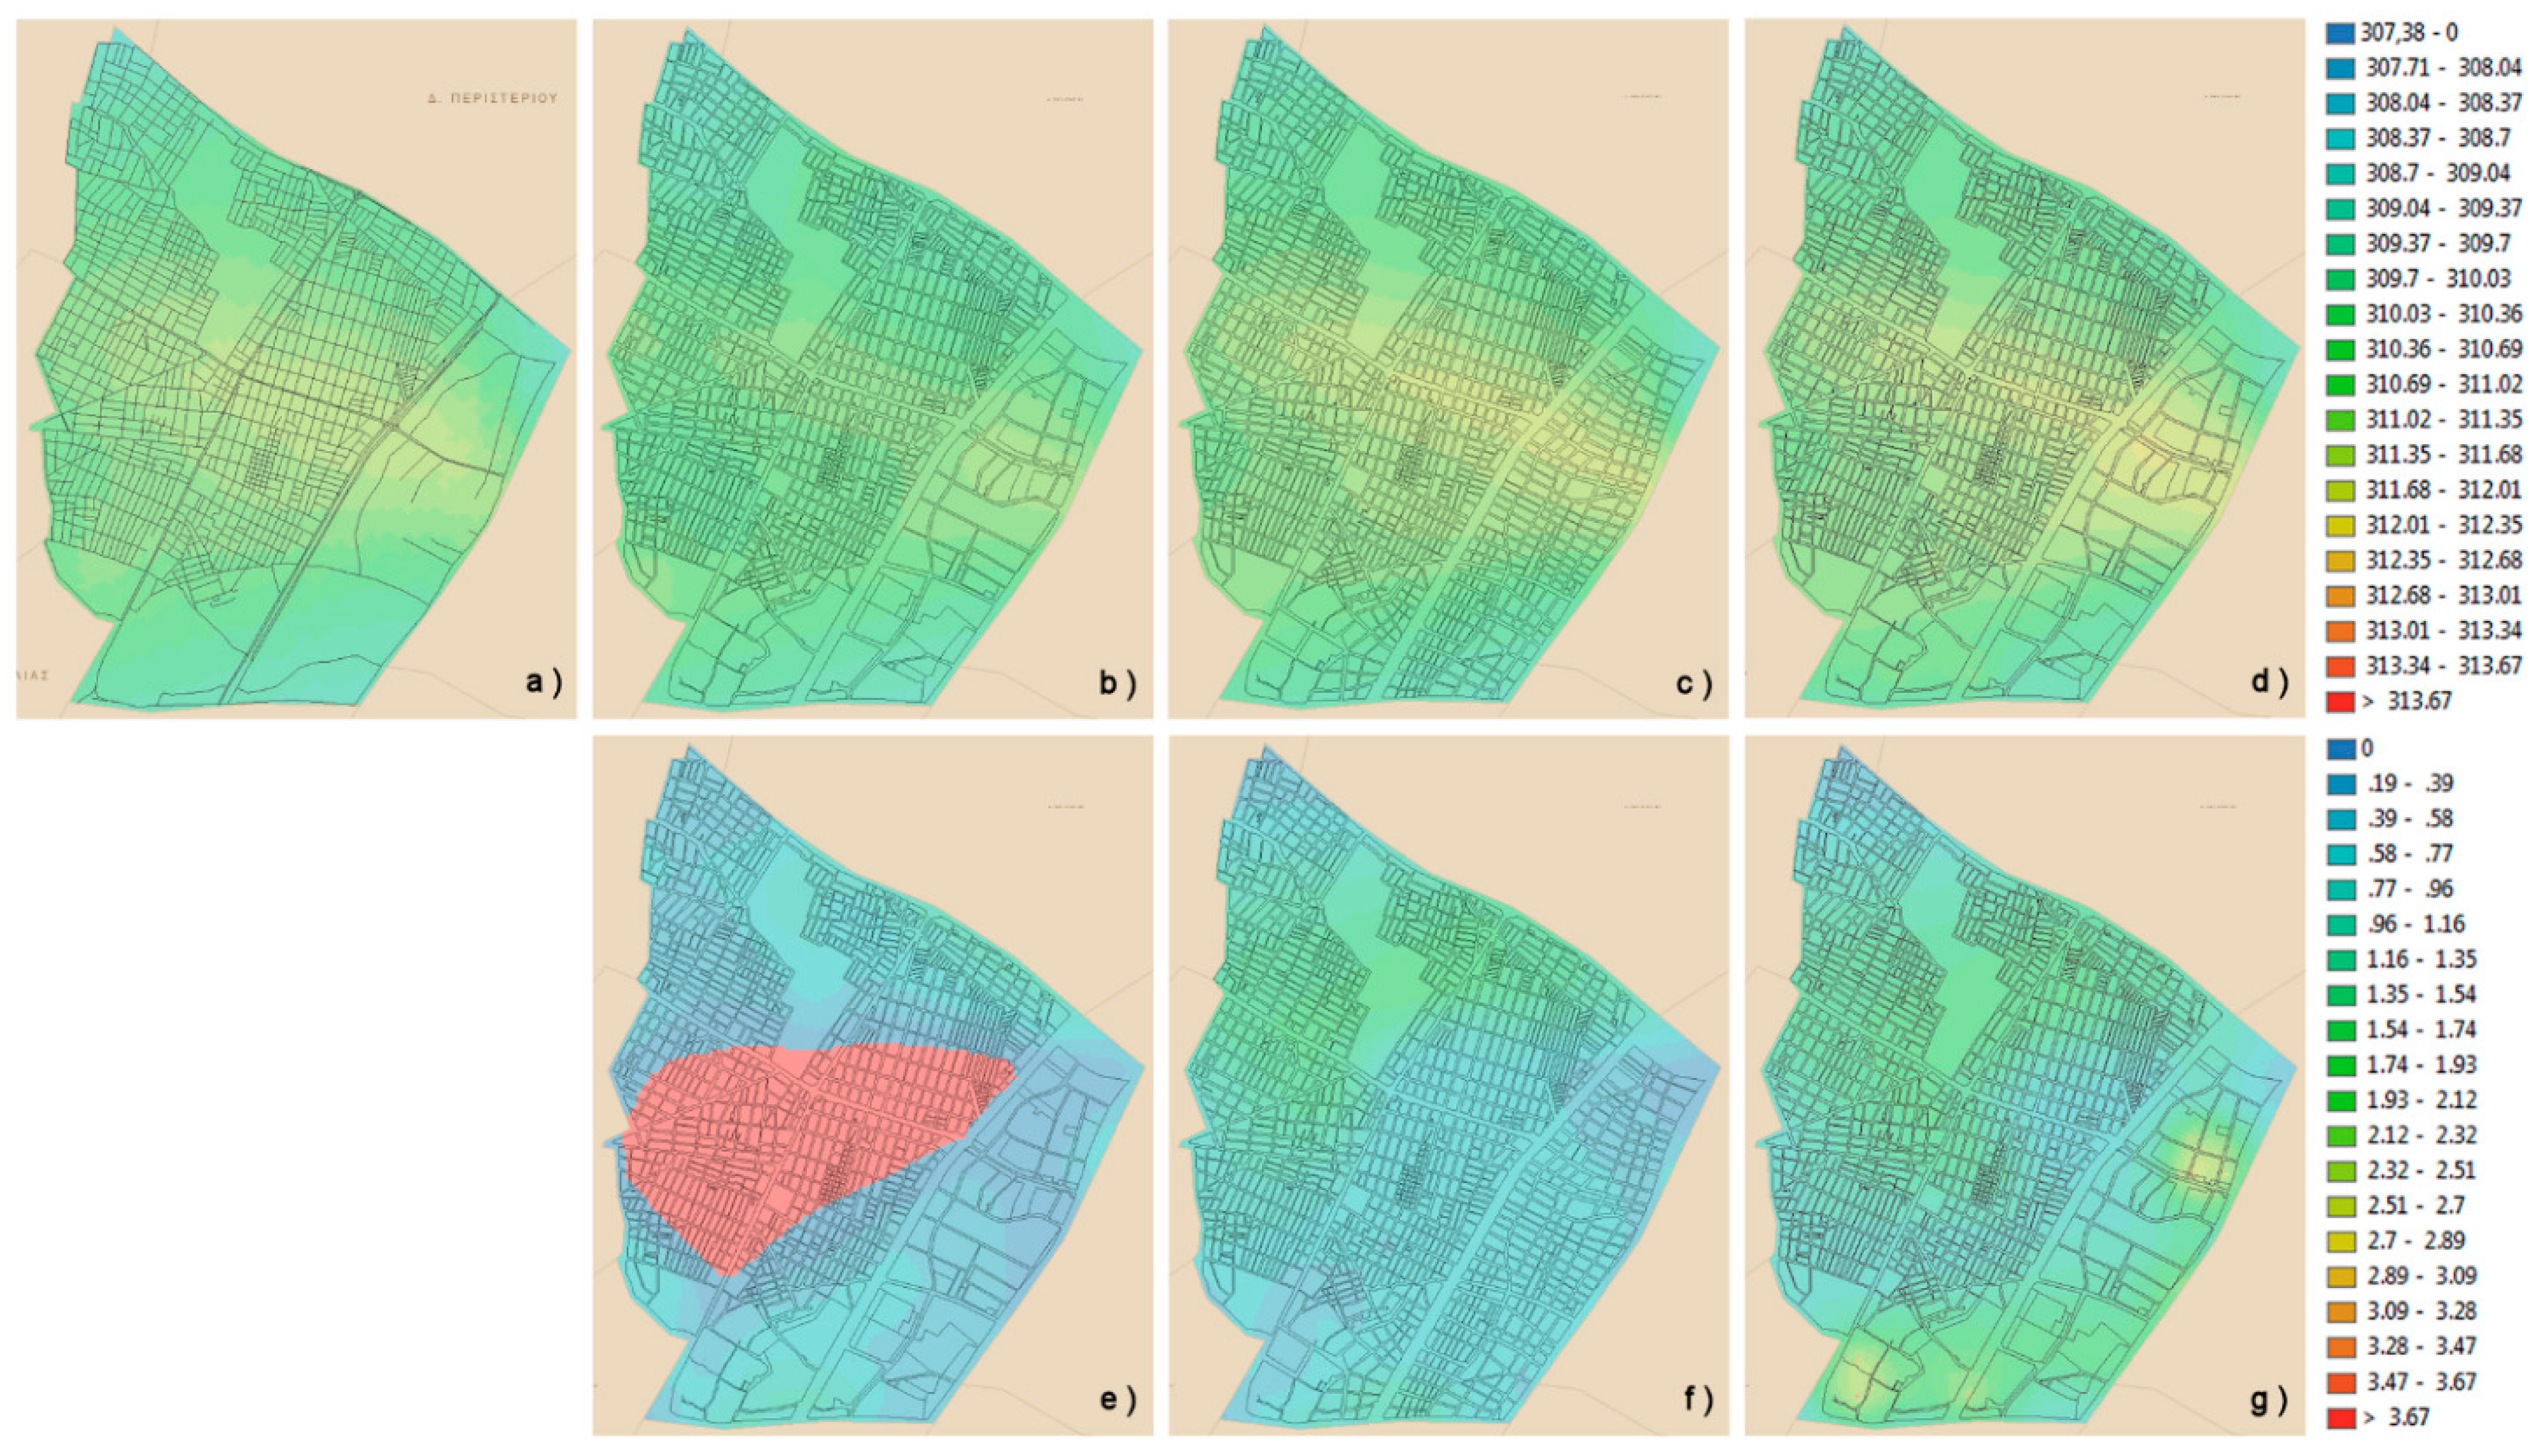
3.2.2. Evaluation Outputs

3.2.3. Further Analysis of MCE Outputs
| Scenarios | Climate Change | Energy/Technological Development | Economy |
|---|---|---|---|
| Scenario I: BRIDGE in Wonderland | + | + | + |
| Scenario II: Climate change is a burning issue | - | + | + |
| Scenario III: Lack of energy in freezing the economy | + | - | - |

4. Results and Discussion


| Case Study | Scenario | PA1 | PA2 | PA3 |
|---|---|---|---|---|
| Gliwice | Scenario I | 1.00 | 1.01 | 1.33 |
| Scenario II | 1.00 | 1.02 | 1.05 | |
| Scenario III | 1.00 | 1.08 | 1.37 | |
| Helsinki | Scenario I | 1.00 | 0.99 | 0.98 |
| Scenario II | 1.00 | 1.10 | 1.12 | |
| Scenario III | 1.00 | 1.14 | 1.15 |

5. Conclusions
Acknowledgments
Author Contributions
Conflicts of Interest
References
- Chrysoulakis, N.; Lopez, M.; San Josè, R.; Grimmond, C.S.B.; Jones, M.; Magliulo, E.; Klostermann, J.; Synnefa, A.; Mitraka, Z.; Castro, E.; et al. Sustainable Urban Metabolism as a link between bio-physical sciences and urban planning: The BRIDGE project. Landsc. Urban Plan. 2013, 112, 100–117. [Google Scholar] [CrossRef]
- Newman, P.W. Sustainability and cities: Extending the metabolism model. Landsc. Urban Plan. 1999, 44, 219–226. [Google Scholar] [CrossRef]
- Stone, B. Land Use as Climate Change Mitigation. Environ. Sci. Technol. 2009, 43, 9052–9056. [Google Scholar] [CrossRef] [PubMed]
- Kennedy, C.; Cuddihy, J.; Engel-Yan, J. The changing metabolism of cities. J. Ind. Ecol. 2007, 22, 43–59. [Google Scholar] [CrossRef]
- Eliasson, I. The use of climate knowledge in urban planning. Landsc. Urban Plan. 2000, 48, 31–44. [Google Scholar] [CrossRef]
- Stevens, D.; Dragicevic, S.; Rothley, K. iCity: A GIS–CA modelling tool for urban planning and decision making. Environ. Model. Softw. 2007, 22, 761–773. [Google Scholar]
- Carsjens, G.J.; Ligtenberg, A. A GIS-based support tool for sustainable spatial planning in metropolitan areas. Landsc. Urban Plan. 2007, 80, 72–83. [Google Scholar] [CrossRef]
- Cowen, D. GIS versus CAD versus DBMS: What are the differences? Photogramm. Eng. Rem. S. 1988, 54, 1551–1555. [Google Scholar]
- Jankowski, P. Integrating Geographical Information Systems and Multiple Criteria Decision-making Methods. Int. J. Geogr. Inf. Syst. 1995, 9, 251–273. [Google Scholar]
- Batty, M. Planning Support Systems, Progress, Predictions and Speculations on the Shape of Things to Come. In Planning Support Systems for Cities and Regions; Brail, R.K., Ed.; Lincoln Institute of Land Policy: Cambridge, MA, USA, 2008. [Google Scholar]
- Nyerges, T. Regional and Urban GIS: A Decision Support Approach; Guilford Publications, Inc.: New York, NY, USA, 2010. [Google Scholar]
- González, A.; Donnelly, A.; Jones, M.; Chrysoulakis, N.; Lopes, M. A decision-support system for sustainable urban metabolism in Europe. Environ. Impact Asses. 2013, 38, 109–119. [Google Scholar] [CrossRef]
- Gonzalez, A.; Donnelly, A.; Jones, M.; Klostermann, J.; Groot, A.; Breil, M. Community of Practice approach to developing urban sustainability indicators. JEAPM 2011, 13, 591–617. [Google Scholar]
- Grell, G.A.; Emeis, E.; Stockwell, W.R.; Schoenemeyer, T.; Forkel, R.; Michalakes, J.; Knoche, R.; Seidl, W. Application of the multiscale, coupled MM5/chemistry model to the complex terrain of the VOTALP valley campaign. Atmos. Environ. 2000, 34, 1435–1453. [Google Scholar] [CrossRef]
- Morris, R.E.; Yarwood, G.; Emery, C.; Koo, B.; Wilson, G.M. Development of the CAMx One-Atmosphere Air Quality Model to Treat Ozone, Particulate Matter, Visibility and Air Toxics and Application for State Implementation Plans. In Proceedings of the Air and Waste Management Association Air Quality Model Guidelines Conference, Mystic, CT, USA, 22–24 October 2003.
- Vautard, R.; Honore, C.; Beekmann, M.; Rouil, L. Simulation of ozone during the August 2003 heat wave and emission control scenarios. Atmos. Environ. 2005, 39, 2957–2967. [Google Scholar] [CrossRef]
- Byun, D.W.; Ching, J.K.S. (Eds.) Science Algorithms of the EPA Models-3 Community Multiscale Air Quality (CMAQ) Modeling System; U.S. Environmental Protection Agency, Office of Research and Development: Washington, DC, USA, 1999.
- Loridan, T.; Grimmond, C.S.B.; Offerle, B.D.; Young, D.T.; Smith, T.E.L.; Järvi, L.; Lindberg, F. Local-scale urban meteorological parameterization scheme (LUMPS): Longwave radiation parameterization and seasonality related developments. J. Appl. Meteorol. 2012, 51, 219–241. [Google Scholar] [CrossRef]
- Masson, V. Urban surface modelling and the meso-scale impact of cities. Theor. Appl. Climatol. 2006, 84, 35–45. [Google Scholar] [CrossRef]
- Pyles, R.D.; Weare, B.C.; Paw, U.K.T.; Gustafson, W. Coupling between the University of California, Davis, Advanced Canopy-Atmosphere-Soil Algorithm (ACASA) and MM5: Preliminary Results for July 1998 for Western–North America. J. Appl. Meteorol. 2003, 42, 557–569. [Google Scholar] [CrossRef]
- Borrego, C.; Martins, H.; Tchepel, O.; Salmim, L.; Monteiro, A.; Miranda, A.I. How urban structure can affect city sustainability from an air quality perspective. Environ. Modell. Softw. 2006, 21, 461–467. [Google Scholar] [CrossRef]
- Walsum, P.E.V.; Groenendijk, P. Quasi Steady-State Simulation of the Unsaturated Zone in Groundwater Modeling of Lowland Regions. Vadose Zone J. 2008, 7, 769–781. [Google Scholar] [CrossRef]
- Staszewski, T.; Bubak, A.; Nikinmaa, E.; Synnefa, A.; Santamouris, M.; Grimmond, S.; Toscano, P. GIS data and maps on spatial, socio-economic development and impact indicators. Document deliverable D.3.3.3. Sustainable urban planning decision support accounting for urban metabolism, EU Seventh Framework Programme. Available online: http://www.bridge-fp7.eu/images/reports/BRIDGE%20D.3.3.3.pdf (accessed on 4 November 2014).
- Saaty, T.L. What is the analytic hierarchy process? In Mathematical Models for Decision Support NATO ASI Series; Springer: Berlin, Germany, 1988; Volume 48, pp. 109–121. [Google Scholar]
- Mitraka, Z. DSS Design Report. Document deliverable D.6.1. Sustainable urban planning decision support accounting for urban metabolism, EU Seventh Framework Programme. Available online: http://www.bridge-fp7.eu/images/reports/BRIDGE%20D.6.1.pdf (accessed on 4 November 2014).
- ESRI (Environmental Systems Resource Institute). ArcMap 9.3, ESRI: Redlands, CA, USA, 2009.
- Mitraka, Z. Final DSS Prototype—Users Guide. Document deliverable D.6.3. Sustainable urban planning decision support accounting for urban metabolism, EU Seventh Framework Programme. Available online: http://www.bridge-fp7.eu/images/reports/BRIDGE%20D.6.3%20Final%20DSS%20Prototype%20-%20Users%20Guide.pdf (accessed on 4 November 2014).
- Blecic, I.; Cecchini, A.; Trunfio, G.A. A General-purpose Geosimulation Infrastructure for Spatial Decision Support. In Transaction on Computational Science VI; Springer: Berlin, Germany, 2009; Volume 5730, pp. 200–218. [Google Scholar]
- Castro, E. Strategic Scenario Analysis. BRIDGE Deliverable D.7.1. Sustainable urban planning decision support accounting for urban metabolism, EU Seventh Framework Programme. Available online: http://www.bridge-fp7.eu/images/reports/BRIDGE%20D.7.1.pdf (accessed on 4 November 2014).
- IPCC (Intergovernmental Panel on Climate Change). Emissions Scenarios; Nakicenovic, N., Swart, R., Eds.; Cambridge University Press: Cambridge, UK, 2000; p. 570. [Google Scholar]
- San Jose, R. Model Implementation Report. BRIDGE Deliverable D.4.2. Document Reference: 211345-017-TR-UPM. Available online: http://www.bridge-fp7.eu/images/reports/BRIDGE%20D.4.2.pdf (accessed on 4 November 2014).
© 2014 by the authors; licensee MDPI, Basel, Switzerland. This article is an open access article distributed under the terms and conditions of the Creative Commons Attribution license (http://creativecommons.org/licenses/by/4.0/).
Share and Cite
Mitraka, Z.; Diamantakis, E.; Chrysoulakis, N.; Castro, E.A.; Jose, R.S.; Gonzalez, A.; Blecic, I. Incorporating Bio-Physical Sciences into a Decision Support Tool for Sustainable Urban Planning. Sustainability 2014, 6, 7982-8006. https://doi.org/10.3390/su6117982
Mitraka Z, Diamantakis E, Chrysoulakis N, Castro EA, Jose RS, Gonzalez A, Blecic I. Incorporating Bio-Physical Sciences into a Decision Support Tool for Sustainable Urban Planning. Sustainability. 2014; 6(11):7982-8006. https://doi.org/10.3390/su6117982
Chicago/Turabian StyleMitraka, Zina, Emmanouil Diamantakis, Nektarios Chrysoulakis, Eduardo Anselmo Castro, Roberto San Jose, Ainhoa Gonzalez, and Ivan Blecic. 2014. "Incorporating Bio-Physical Sciences into a Decision Support Tool for Sustainable Urban Planning" Sustainability 6, no. 11: 7982-8006. https://doi.org/10.3390/su6117982