Optimized Renewable and Sustainable Electricity Generation Systems for Ulleungdo Island in South Korea

 ,
, 
Abstract
:1. Introduction
2. Status of Ulleungdo Island
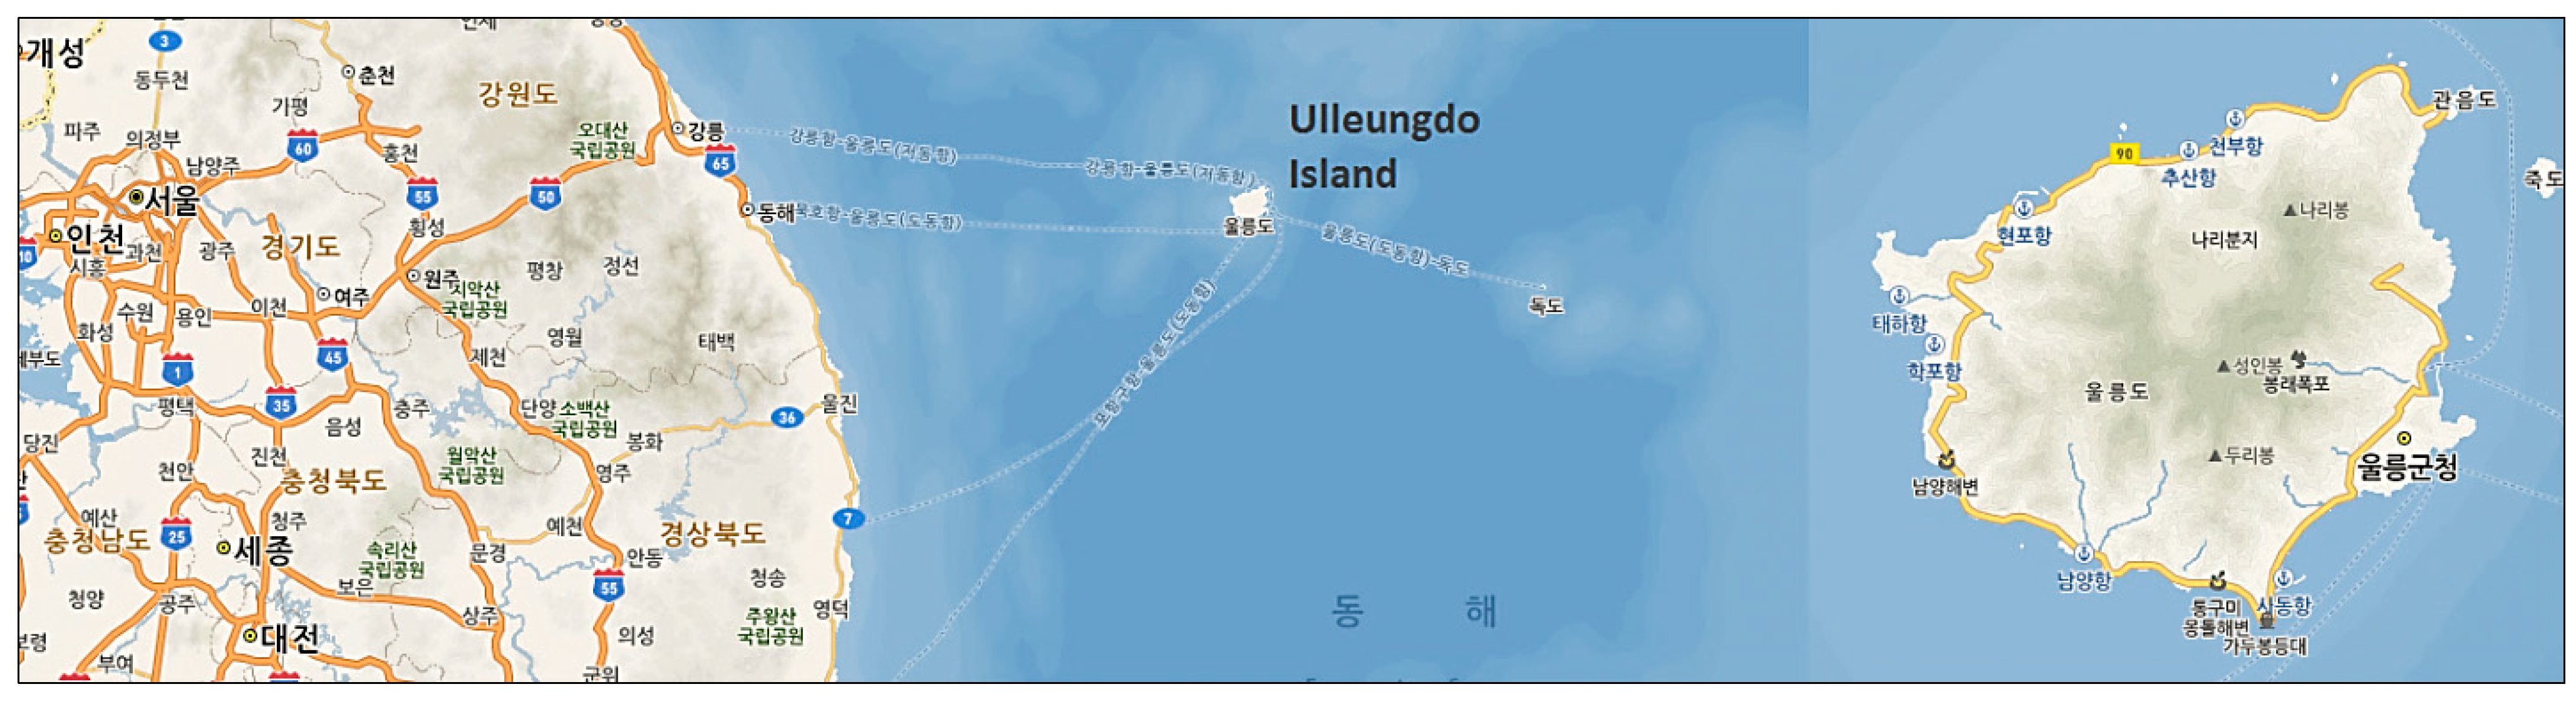
2.1. Location and Population

2.2. Load Information
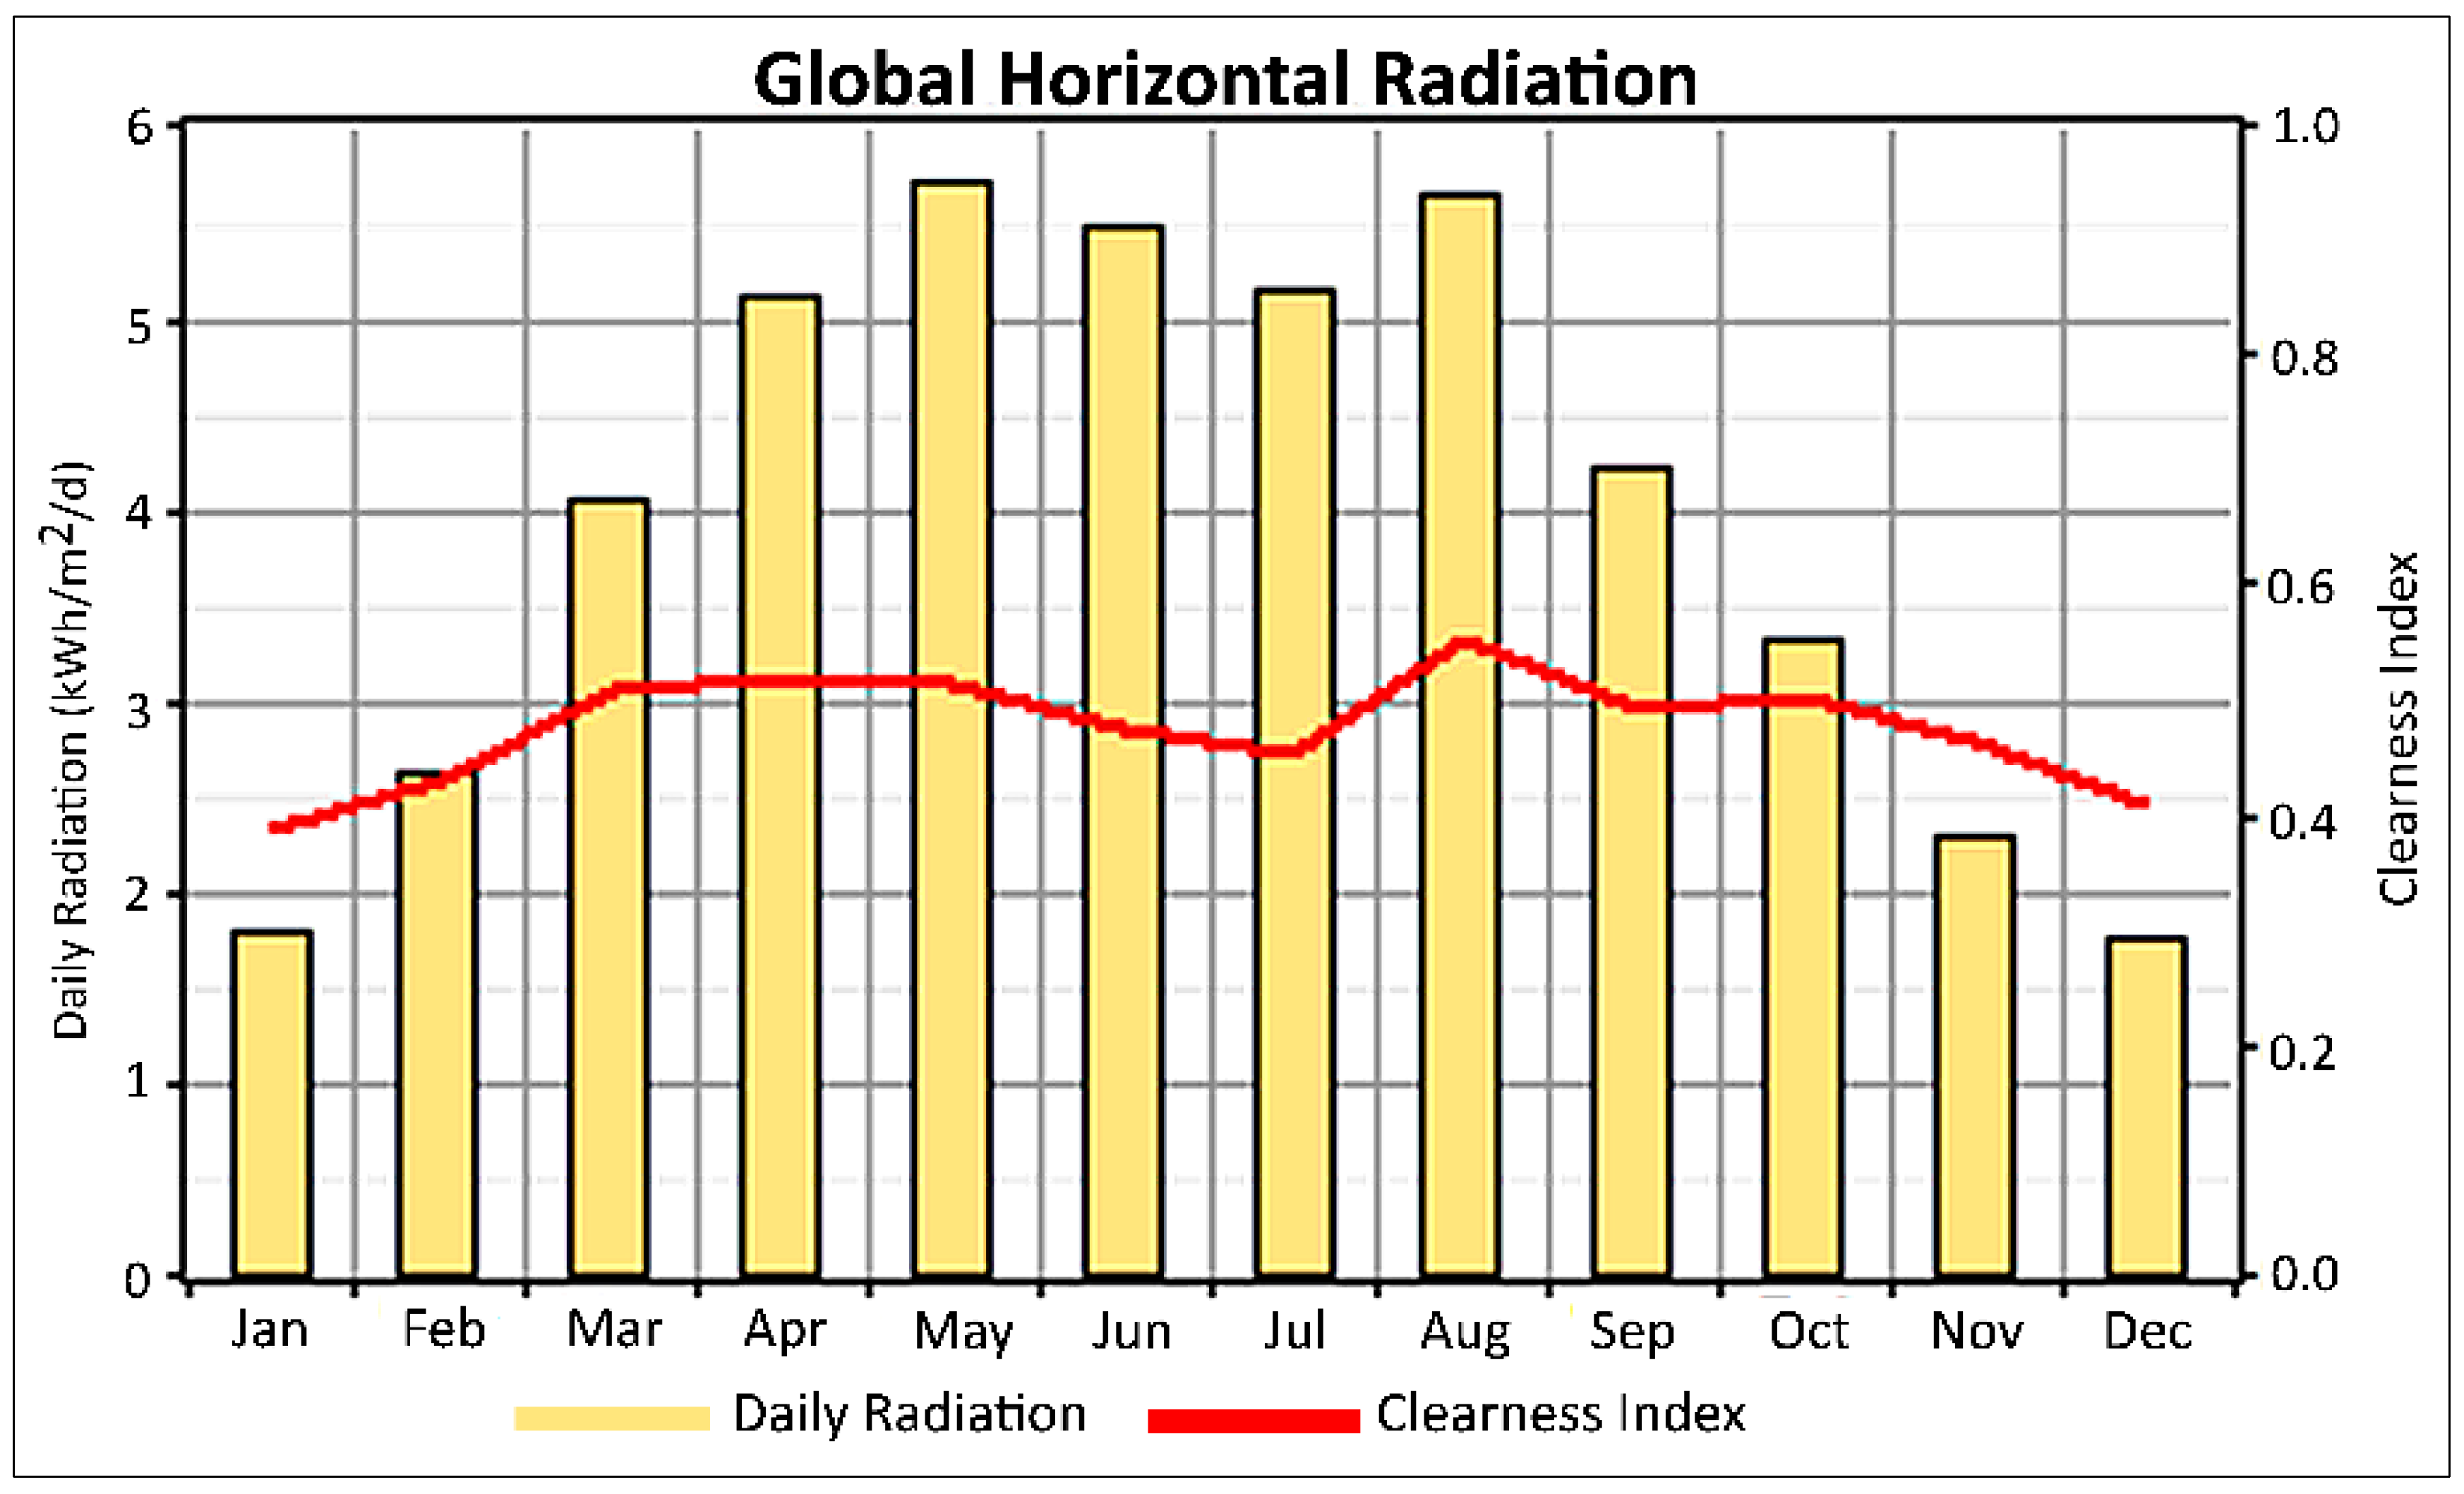
2.3. Solar Energy
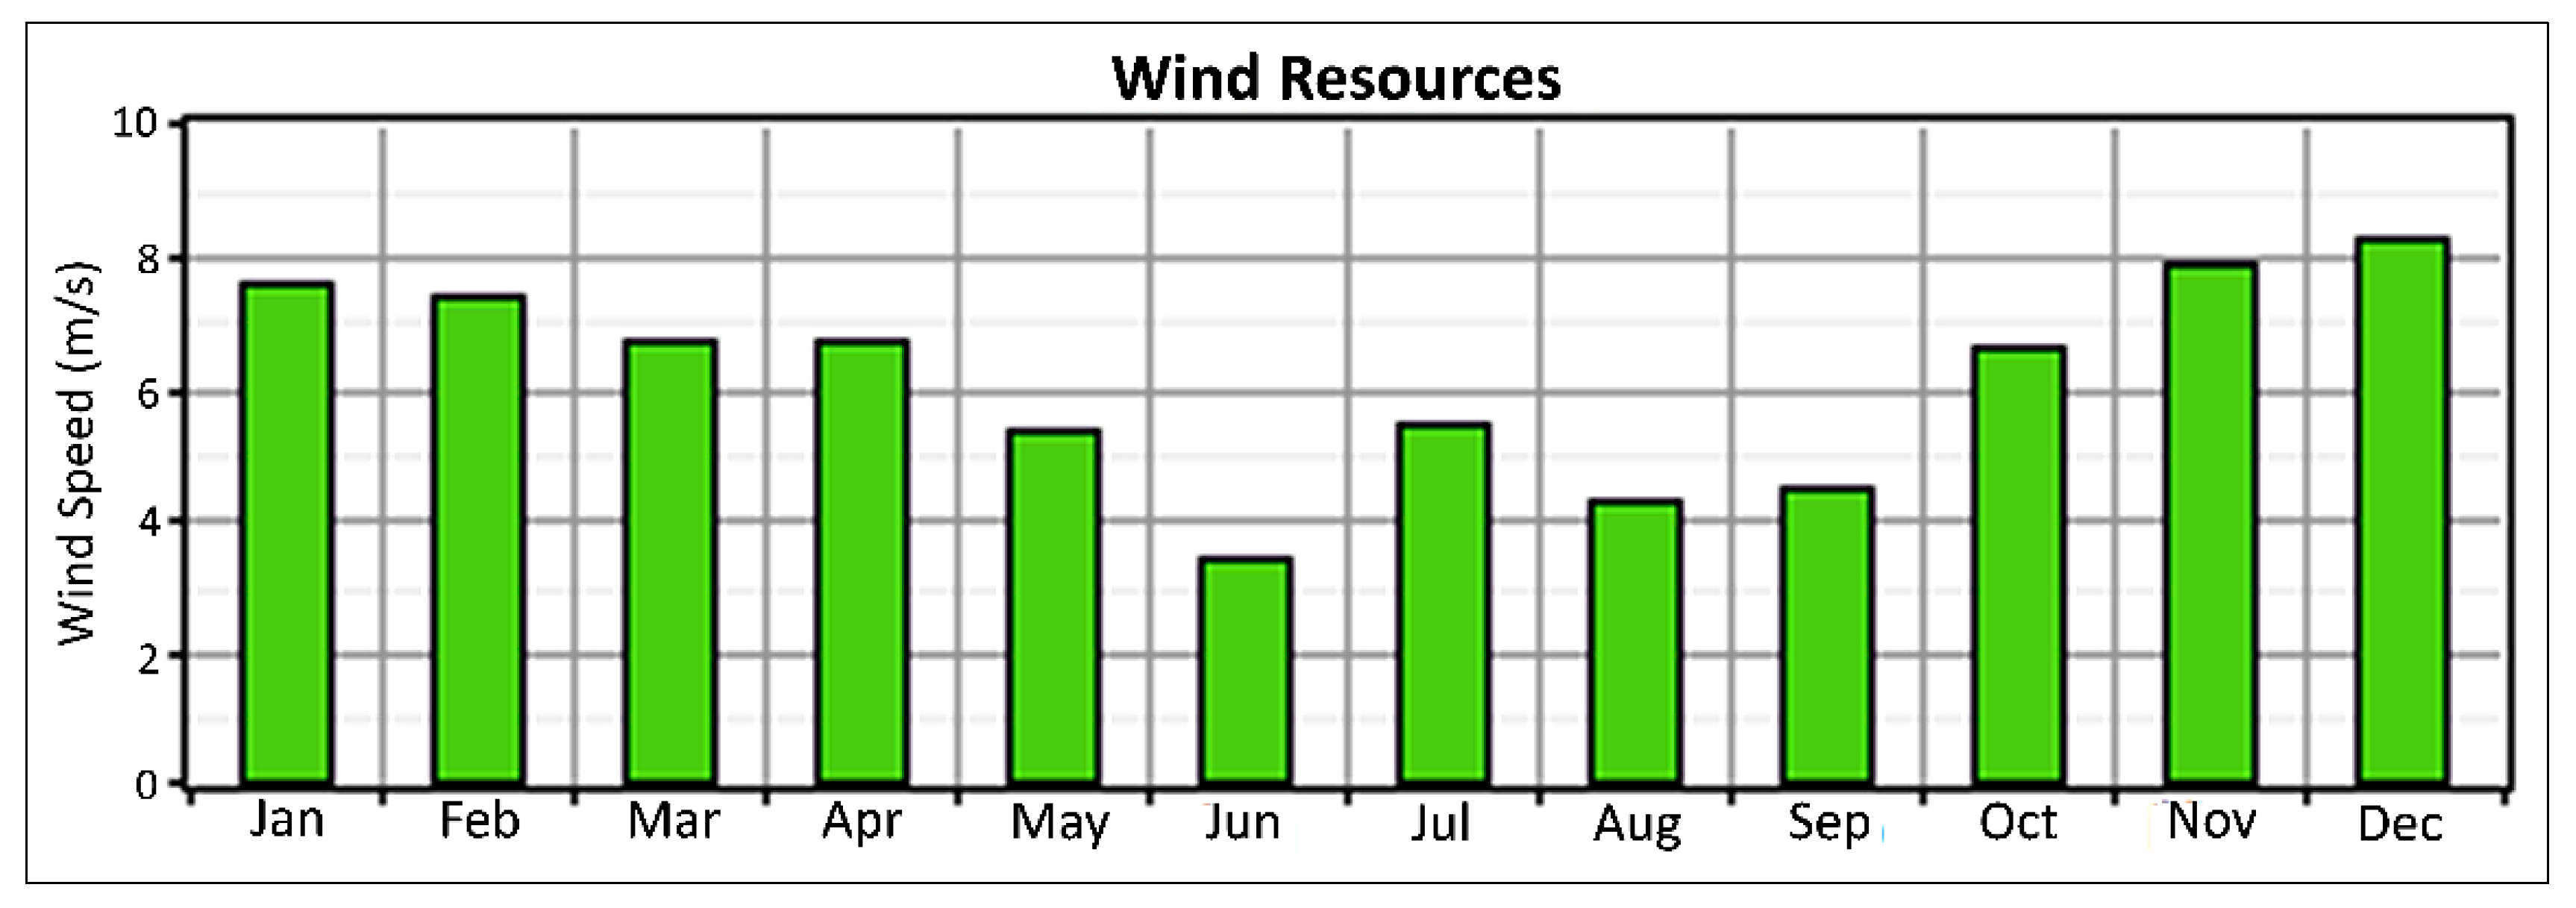
2.4. Wind Speed

2.5. Hydro Resources
3. Key Parameters for the Economic Analysis
3.1. Annual Real Interest Rate
3.2. Cost of Energy (COE) and Net Present Cost (NPC)
3.3. Diesel Price

| Component | Model Type | Size or Quantity | Capital Cost ($) | Replacement Cost ($) | Operation & Management Cost ($/year) | Lifetime | Other |
|---|---|---|---|---|---|---|---|
| PV panel | - | 1 kW | 1800 | 1800 | 25 | 20 years | 80% derating factor; 37.48° slope with no tracking system; a range of 0 to 30,000 PW is considered. |
| Wind turbine | Generic 10 kW | 2 units | 29,000 | 25,000 | 400 | 15 years | 25 m hub height; a range of 0 to 2500 turbines is considered. |
| Battery | Surrette 6CS25P | 1 unit | 1229 | 1229 | 10 | - | 6 V nominal voltage; 1156 Ah (6.94 kWh) nominal capacity; 9645 kWh lifetime throughput; a range of 0 to 50,000 battery-units is considered. |
| Diesel generator 1 (currently operating) | - | 1 kW | 0 | 450 | 0.2 | 15,000 h | 30% minimum load ratio; the capacity of the current diesel generator is 8000 kW. |
| Diesel generator 2 (currently operating) | - | 1 kW | 0 | 450 | 0.2 | 15,000 h | 30% minimum load ratio; the capacity of the current diesel generator is 4000 kW. |
| Hydro turbine (currently operating) | - | - | 0 | 0 | 0 | 25 years | 95 m available head, 75% efficiency, and 15% pipe head loss. |
| Converter | - | 1 kW | 800 | 800 | 10 | 15 years | 90% efficiency; a range of 0 to 5000 kW is considered. |
4. Renewable Power Generation Systems
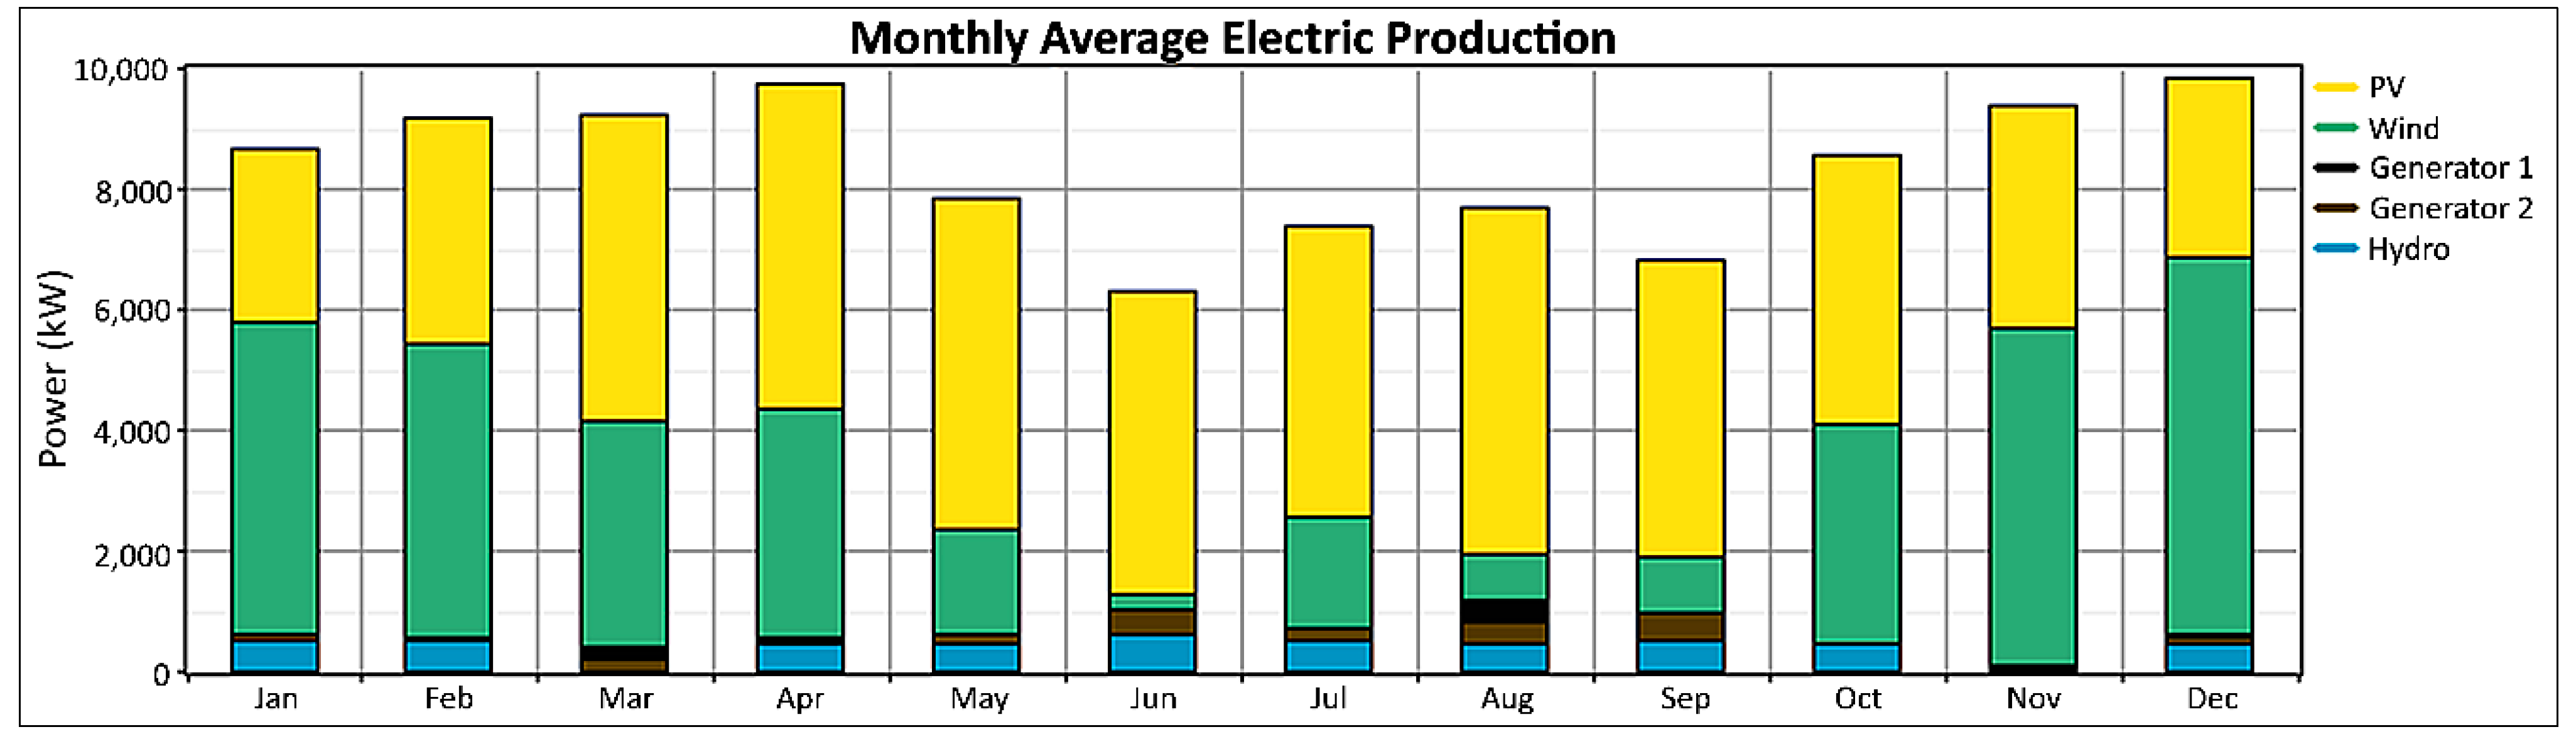
5. Results
| Components | Index |
|---|---|
| Hydro (kW) | 700 |
| Wind (# of turbines) | 1725 |
| PV (kW) | 31,065 |
| Diesel generator 1 (currently used, kW) | 8000 |
| Working hours (diesel generator 1) | 64 |
| Diesel generator 2 (currently used, kW) | 4000 |
| Working hours (diesel generator 2) | 474 |
| Consumed diesel (L) | 696,396 |
| Battery (# of units) | 32,765 |
| Converter (kW) | 5975 |
| Initial Capital ($) | 125,977,680 |
| Operating Cost ($/year) | 6,250,551 |
| Total NPC ($) | 234,819,440 |
| COE ($/kWh) | 0.334 |
| Ren. Frac. | 0.97 |
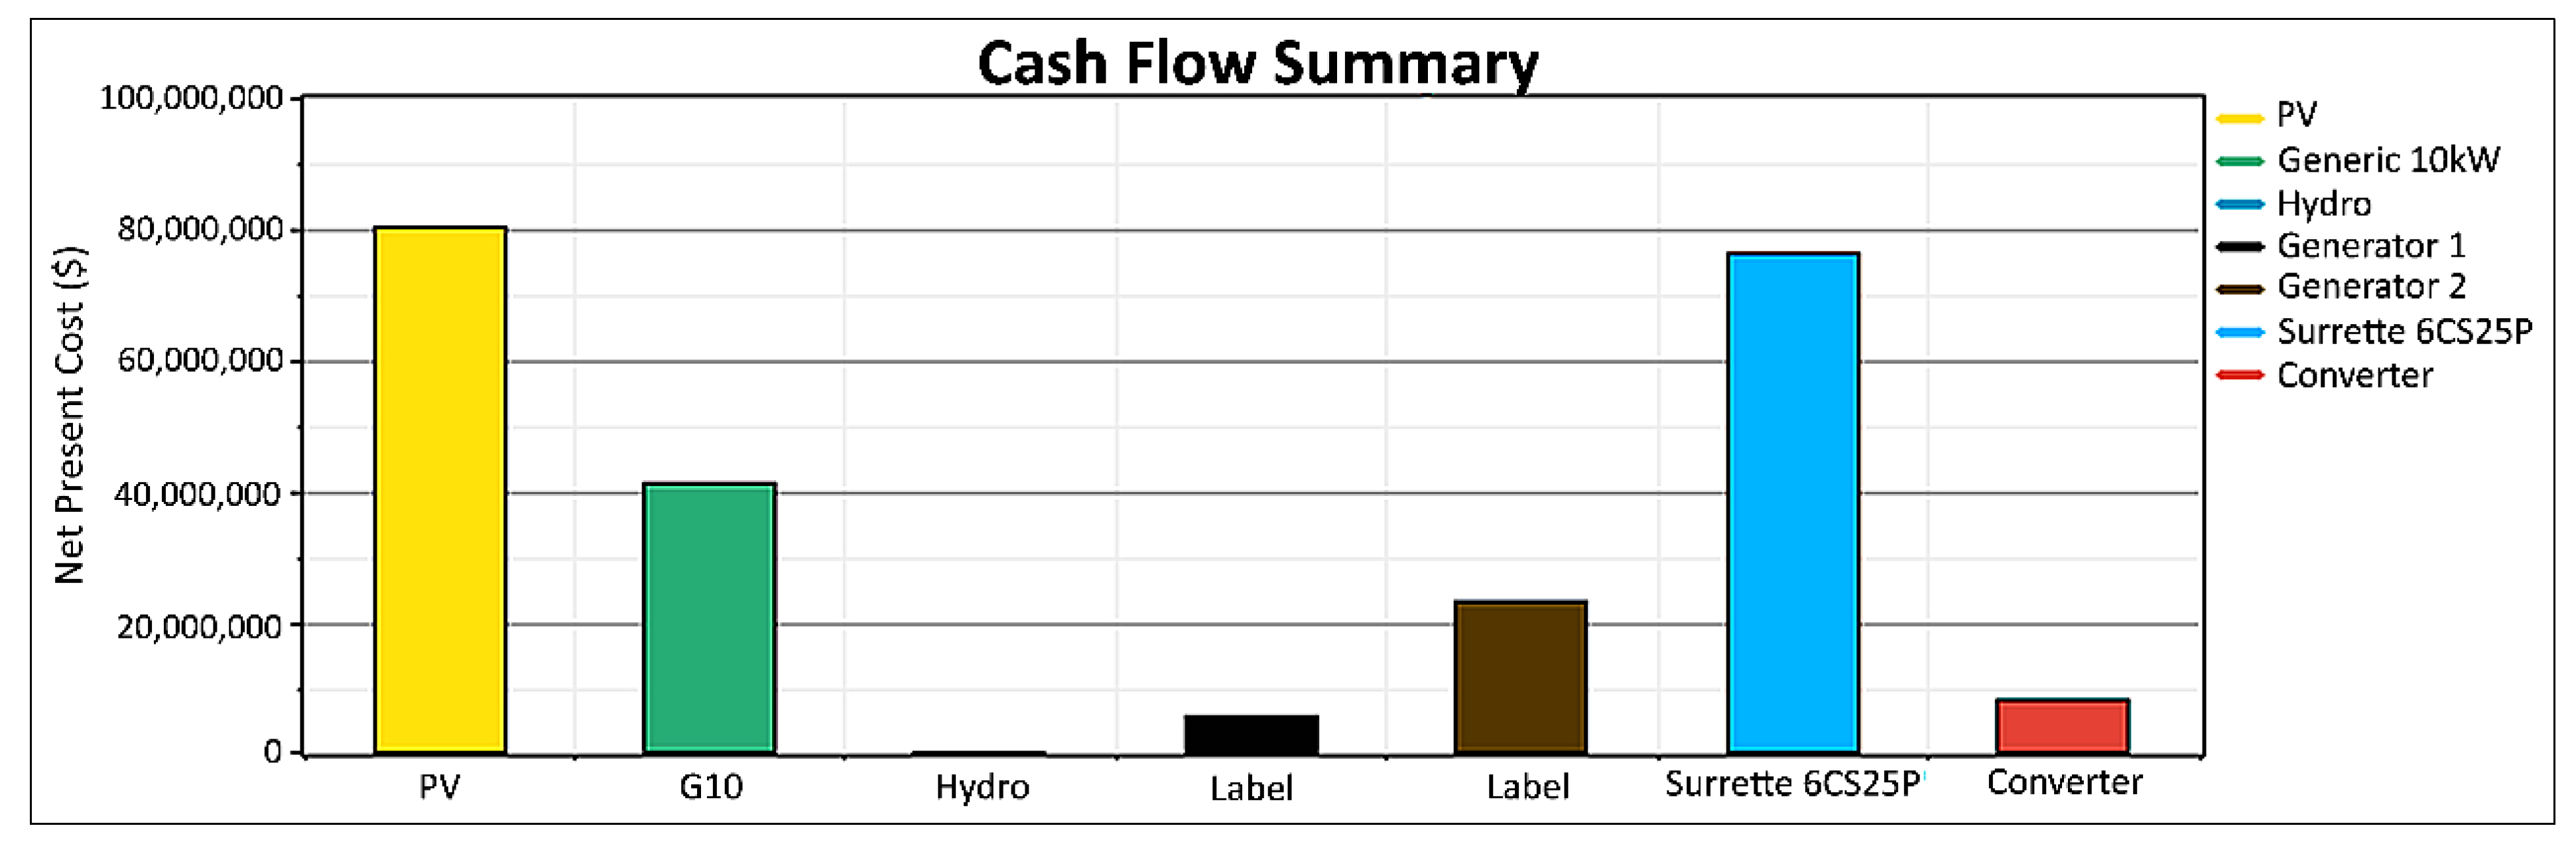
| Components | Capital ($) | Replacement ($) | O&M ($) | Fuel ($) | Salvage ($) | Total ($) |
|---|---|---|---|---|---|---|
| PV | 55,917,000 | 30,959,904 | 13,523,491 | - | −20,029,718 | 80,370,672 |
| Wind | 25,012,500 | 13,840,154 | 6,007,538 | - | −3,432,793 | 41,427,396 |
| Hydro | - | - | - | - | - | - |
| Generator 1 | - | - | 1,783,107 | 5,295,827 | −1,535,981 | 5,542,954 |
| Generator 2 | - | - | 6,603,068 | 16,531,792 | −180,535 | 22,954,328 |
| Battery | 40,268,184 | 48,052,596 | 5,705,420 | - | −17,629,630 | 76,396,552 |
| Converter | 4,780,000 | 3,068,102 | 1,040,436 | - | −760,985 | 8,127,552 |
| System | 125,977,688 | 95,920,752 | 34,663,060 | 21,827,620 | −43,569,644 | 234,819,456 |
| Components | Capital ($/year) | Replacement ($/year) | O&M ($/year) | Fuel ($/year) | Salvage ($/year) | Total ($/year) |
|---|---|---|---|---|---|---|
| PV | 3,211,194 | 1,777,961 | 776,625 | - | −1,150,264 | 4,615,517 |
| Wind | 1,436,415 | 794,811 | 345,000 | - | −197,138 | 2,379,087 |
| Hydro | - | - | - | - | - | - |
| Generator 1 | - | - | 102,400 | 304,128 | −88,208 | 318,320 |
| Generator 2 | - | - | 379,200 | 949,386 | −10,368 | 1,318,218 |
| Battery | 2,312,516 | 2,759,558 | 327,650 | - | −1,012,432 | 4,387,292 |
| Converter | 274,505 | 176,195 | 59,750 | - | −43,702 | 466,748 |
| System | 7,234,631 | 5,508,525 | 1,990,626 | 1,253,514 | −2,502,112 | 13,485,182 |
| Component | Production (kWh/year) | Fraction |
|---|---|---|
| PV panels | 39,623,320 | 54% |
| Wind turbines | 28,159,934 | 38% |
| Hydro turbine | 3,675,421 | 5% |
| Diesel generator 1 | 512,000 | 1% |
| Diesel generator 2 | 1,503,026 | 2% |
| Total | 73,473,696 | 100% |
| Quantity | Value | Units |
| Excess electricity | 25,494,698 | kWh/year |
| Unmet load | 0.0886 | kWh/year |
| Renewable fraction | 0.973 | - |

6. Conclusions
- -
- The suggested optimal solution consists of 1725 wind turbines (generic 10 kW model), 31,065 kW PV panels, a 5975 kW converter, 32,765 batteries (Surrette S6CS25P), and the retention of the two operating diesel generators (8000 kW and 4000 kW) and hydro turbine (700 kW).
- -
- The simulation results predict an operating cost of $6,250,551 per year, an initial capital of $125,977,680, a total NPC of $234,819,440, and a renewable fraction of 97% at a $0.334 per kWh COE.
- -
- Diesel fuel use is significantly reduced, from over 14,500,000 L to less than 700,000 L, in the simulation. It also reduces other costs, such as that of transporting fuels.
- -
- Achieving the optimal level will require that gradual development plans be prepared for the island.
- -
- Reducing the island’s dependency on diesel generators will require that the reliability of its electricity system be improved and that further planning consider various other energy sources.
- -
- After a certain level of renewable energy use has been achieved, the local government and island communities should aim to install more renewable power generation facilities as an alternative to the current diesel generators.
7. Limitations
Acknowledgments
Author Contributions
Conflicts of Interest
References
- Klessmann, C.; Held, A.; Rathmann, M.; Ragwitz, M. Status and perspectives of renewable energy policy and deployment in the European Union—What is needed to reach the 2020 targets? Energ. Policy 2011, 39, 7637–7657. [Google Scholar]
- Koo, J.; Park, K.; Shin, D.; Yoon, E.S. Economic evaluation of renewable energy systems under varying scenarios and its implications to Korea’s renewable energy plan. Appl. Energy 2011, 88, 2254–2260. [Google Scholar]
- Kim, G.; Lee, M.E.; Lee, K.S.; Park, J.; Jeong, W.M.; Kang, S.K.; Soh, J.; Kim, H. An overview of ocean renewable energy resources in Korea. Renew. Sustain. Energy Rev. 2012, 16, 2278–2288. [Google Scholar]
- Park, N.; Yun, S.; Jeon, E. An analysis of long-term scenarios for the transition to renewable energy in the Korean electricity sector. Energy Policy 2013, 52, 288–296. [Google Scholar]
- Hernández, T.P. 100% Renewable Energy Islands. A Practical Case: El Hierro. In 100% RES: A Challenge for Island Sustainable Development; Marín, C., Alves, L.M., Zervos, A., Eds.; UNESCO Center of the Canary Islands: Lisbon, Portugal, 2005; pp. 23–26. [Google Scholar]
- Sánchez, A.B. Sustainability in the Global Tourism Industry: Good Practice Initiatives from the Private and Public Sector. El Hierro 100% Renewable Energies. In Proceedings of the International Student Conference in Tourism Research (ISCONTOUR 2014), Tourism Research Perspectives, Krems, Austria, 5 May 2014; pp. 203–211.
- Kim, H.; Baek, S.; Park, E.; Chang, H.J. Optimal green energy management in Jeju, South Korea—On-grid and off-grid electrification. Renew. Energy 2014, 69, 123–133. [Google Scholar]
- Kim, G.; Jeong, W.M.; Lee, K.S.; Jun, K.; Lee, M.E. Offshore and nearshore wave energy assessment around the Korean Peninsula. Energy 2011, 36, 1460–1469. [Google Scholar]
- Korea Meteorological Administration. Weather Information. Available online: http://web.kma.go.kr/eng/weather/forecast/current_korea.jsp (accessed on 15 September 2014).
- The Bank of Korea. The National Finance Information. Available online: http://www.bok.or.kr/main/korMain.action (accessed on 15 September 2014).
- Dursun, B. Determination of the optimum hybrid renewable power generating systems for Kavakli campus of Kirklareli University, Turkey. Renew. Sustain. Energy Rev. 2012, 16, 6183–6190. [Google Scholar]
- Ani, V.A.; Nzeako, A.N.; Obianuko, J.C. Energy Optimization at Datacenters in Two Different Locations of Nigeria. Int. J. Energy Eng. 2012, 2, 151–164. [Google Scholar]
- Bekele, G.; Tadesse, G. Feasibility study of small Hydro/PV/Wind hybrid system for off-grid rural electrification in Ethiopia. Appl. Energ. 2012, 97, 5–15. [Google Scholar]
- Demiroren, A.; Yilmaz, U. Analysis of change in electric energy cost with using renewable energy sources in Gökceada, Turkey: An island example. Renew. Sustain. Energy Rev. 2010, 14, 323–333. [Google Scholar]
- Ngan, M.S.; Tan, C.W. Assessment of economic viability for PV/wind/diesel hybrid energy system in southern Peninsular Malaysia. Renew. Sustain. Energy Rev. 2012, 16, 634–647. [Google Scholar]
- Patterson, T.; Esteves, S.; Dinsdale, R.; Guwy, A. An evaluation of the policy and techno-economic factors affecting the potential for biogas upgrading for transport fuel use in the UK. Energy Policy 2011, 39, 1806–1816. [Google Scholar]
- Huh, S.; Lee, C. Diffusion of renewable energy technologies in South Korea on incorporating their competitive interrelationships. Energy Policy 2014, 69, 248–257. [Google Scholar]
- Shin, J.; Woo, J.; Huh, S.; Lee, J.; Jeong, G. Analyzing public preferences and increasing acceptability for the Renewable Portfolio Standard in Korea. Energy Econ. 2014, 42, 17–26. [Google Scholar]
- Kim, J.; Park, J.; Kim, H.; Heo, E. Assessment of Korean customers’ willingness to pay with RPS. Renew. Sustain. Energy Rev. 2012, 16, 695–703. [Google Scholar]
- Qiu, Y.; Anadon, L.D. The price of wind power in China during its expansion: Technology adoption, learning-by-doing, economies of scale, and manufacturing localization. Energy Econ. 2012, 34, 772–785. [Google Scholar]
- Martinsen, T. Technology learning in a small open economy—The systems, modelling and exploiting the learning effect. Energy Policy 2011, 39, 2361–2372. [Google Scholar] [Green Version]
© 2014 by the authors; licensee MDPI, Basel, Switzerland. This article is an open access article distributed under the terms and conditions of the Creative Commons Attribution license (http://creativecommons.org/licenses/by/4.0/).
Share and Cite
Yoo, K.; Park, E.; Kim, H.; Ohm, J.Y.; Yang, T.; Kim, K.J.; Chang, H.J.; Del Pobil, A.P. Optimized Renewable and Sustainable Electricity Generation Systems for Ulleungdo Island in South Korea. Sustainability 2014, 6, 7883-7893. https://doi.org/10.3390/su6117883
Yoo K, Park E, Kim H, Ohm JY, Yang T, Kim KJ, Chang HJ, Del Pobil AP. Optimized Renewable and Sustainable Electricity Generation Systems for Ulleungdo Island in South Korea. Sustainability. 2014; 6(11):7883-7893. https://doi.org/10.3390/su6117883
Chicago/Turabian StyleYoo, Kyeongsik, Eunil Park, Heetae Kim, Jay Y. Ohm, Taeyong Yang, Ki Joon Kim, Hyun Joon Chang, and Angel P. Del Pobil. 2014. "Optimized Renewable and Sustainable Electricity Generation Systems for Ulleungdo Island in South Korea" Sustainability 6, no. 11: 7883-7893. https://doi.org/10.3390/su6117883