Planning Landscape Corridors in Ecological Infrastructure Using Least-Cost Path Methods Based on the Value of Ecosystem Services

Abstract
:1. Introduction
2. Methods
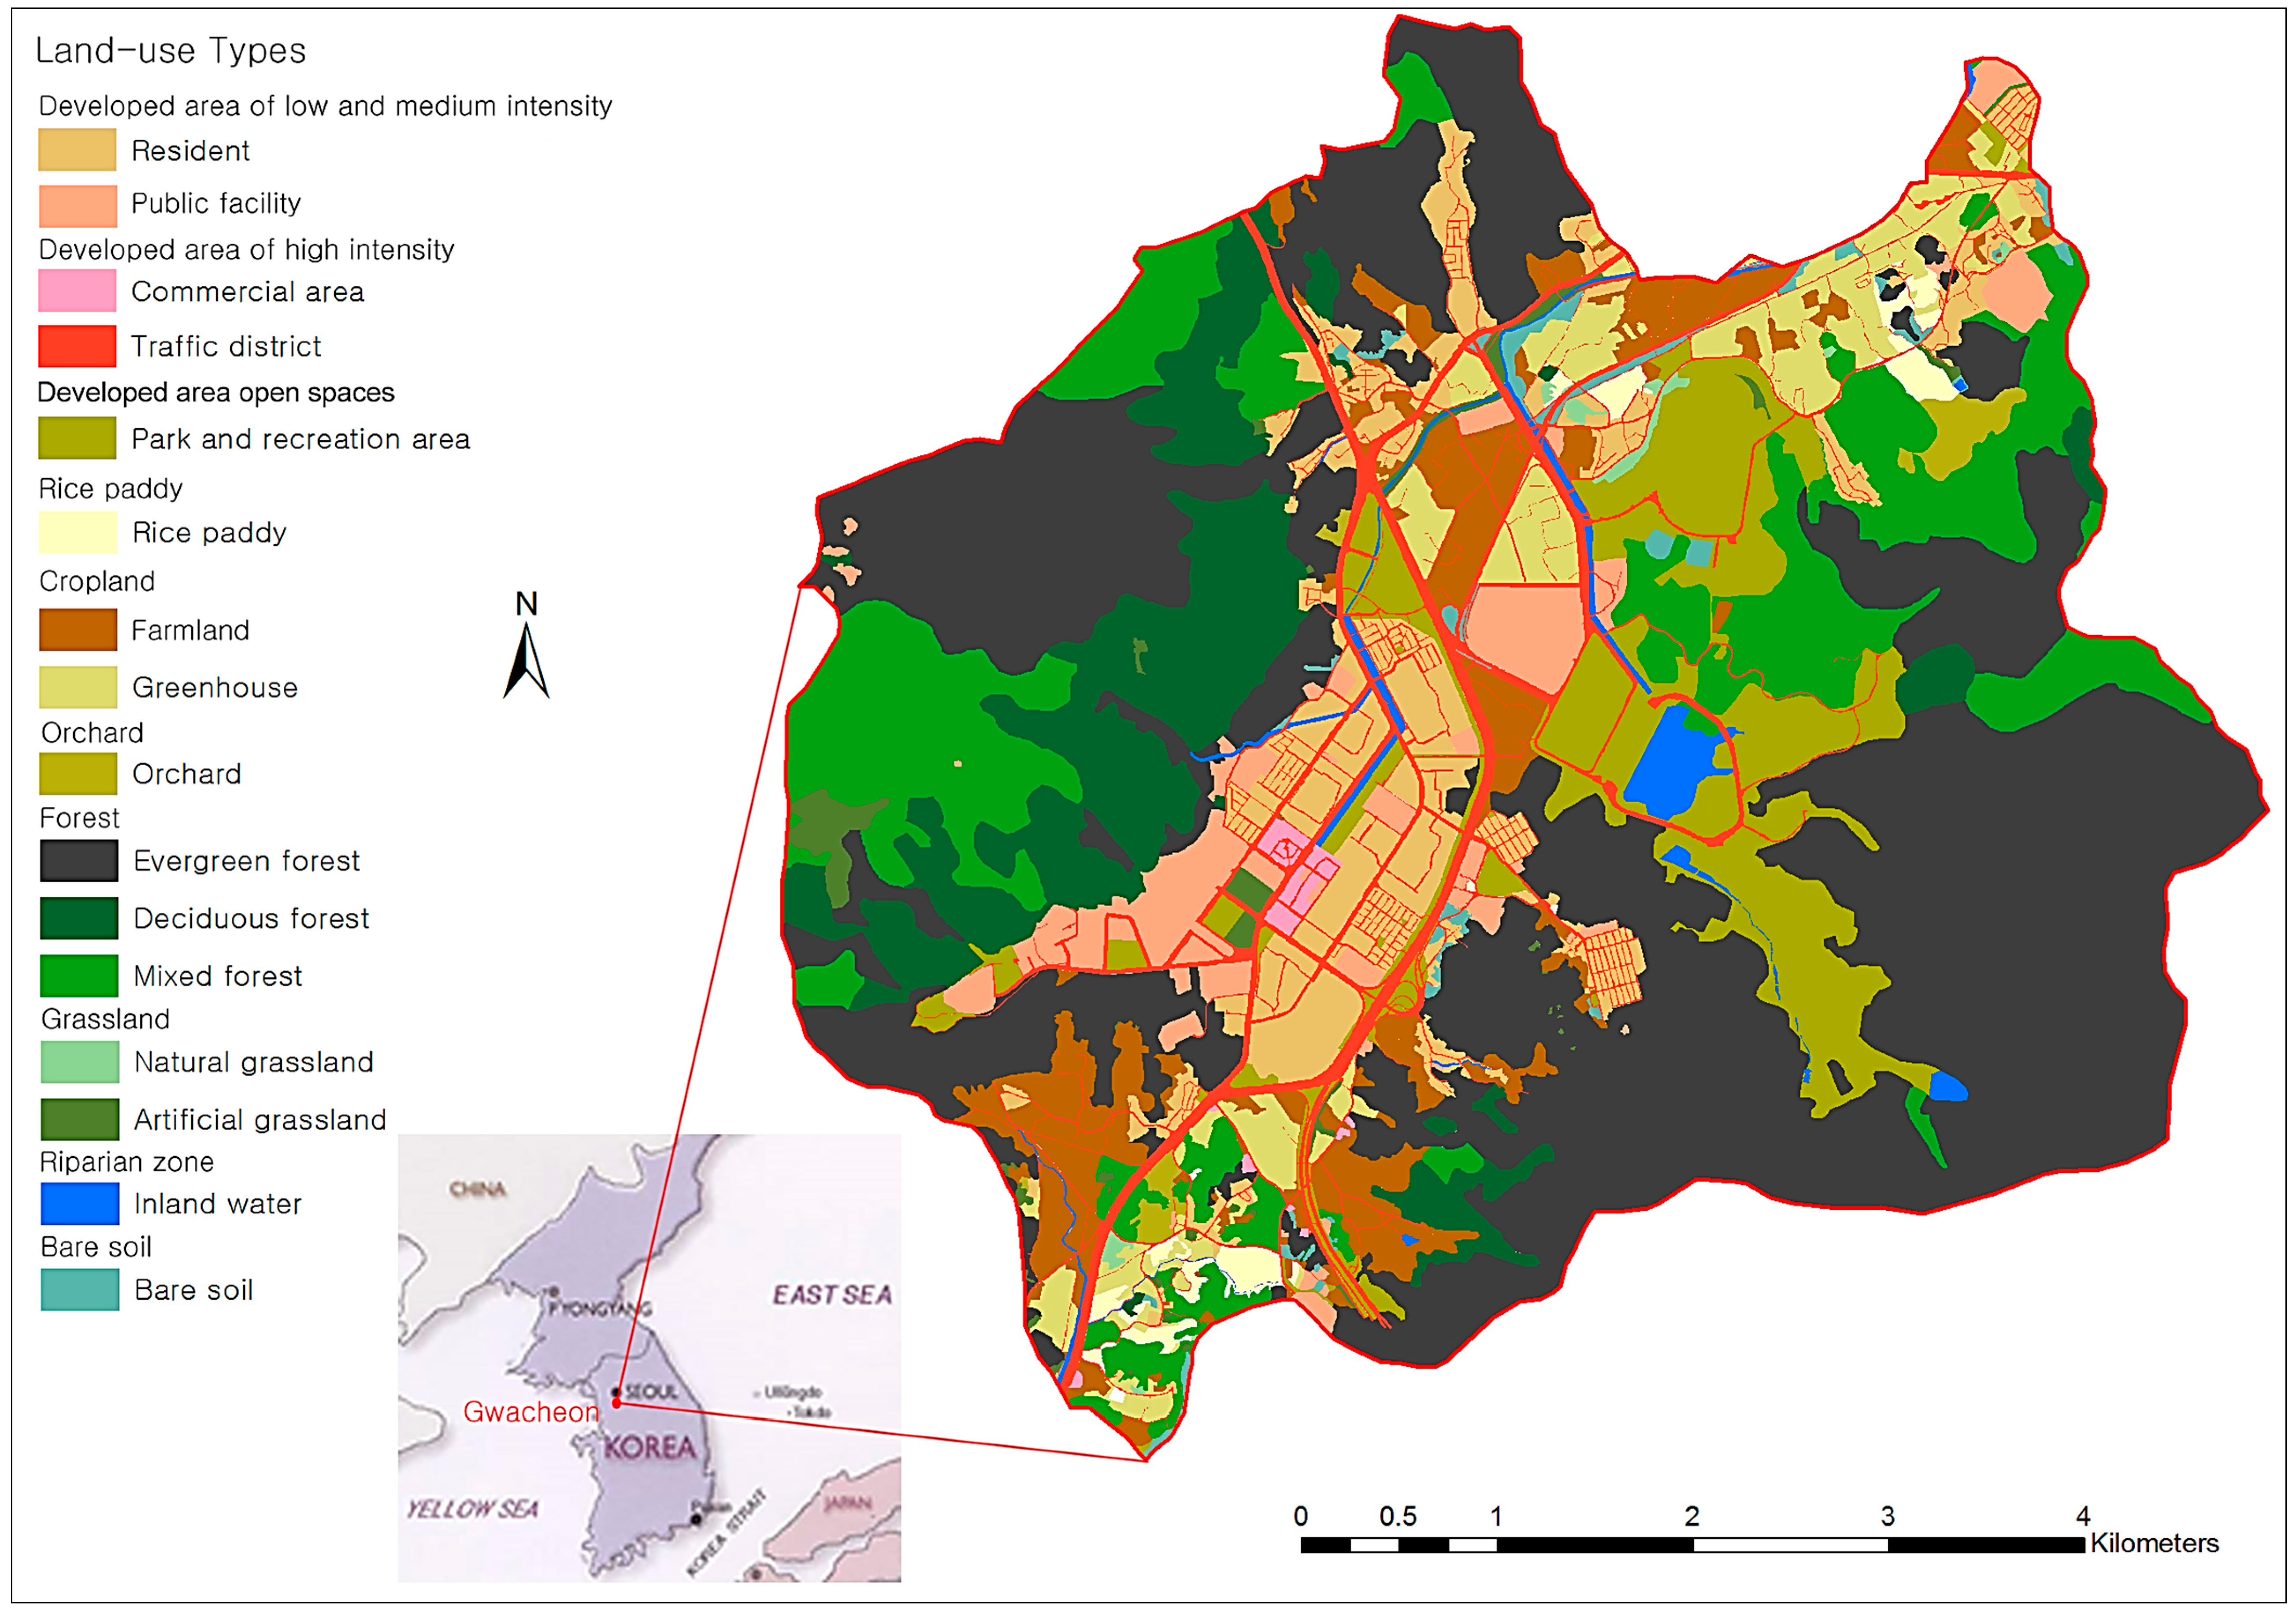
2.1. Study Area
2.2. Geospatial Data
2.3. Planning Landscape Corridors in the Ecological Infrastructure
2.3.1. Estimated Value of Ecosystem Services

| Land Use Typology a | Definition b | Total of Service Means Values (2011 US$/ha/Year) | Total SD of Means (2011 US$/ha/Year) | Source |
|---|---|---|---|---|
| Developed areas of low and medium intensity | Includes areas with a mixture of constructed materials and vegetation. Impervious surfaces account for 20%–79% of the total cover. | 0 | 0 | [6,67,72] |
| Developed areas of high intensity | Includes highly developed areas where people reside or work in high numbers. Impervious surfaces account for 80%–100% of the total cover. | 0 | 0 | [6,67,72] |
| Developed area open spaces | Includes areas with a mixture of constructed materials, but mainly contains vegetation in the form of lawn grasses. Impervious surfaces account for less than 20% of the total cover. | 2130.67 | 1189.36 | [6,77] |
| Rice paddies | Areas where perennial herbaceous vegetation accounts for more than 80% of the vegetative cover and the soil or substrate is periodically saturated with or covered with water, such as rice paddies. | 5131.91 | 1540.98 | [6,68,78,79,80,81,82] |
| Croplands | Areas being used for the production of crops other than rice. Plantations with cash crops, such as herbal teas or horticultural products. | 413.07 | 162.33 | [6,68,83,84,85] |
| Orchards | Areas being used for food production by planting trees and shrubs, such as Malus pumila Mille, Pyrus serotina Rehder and Diospyros kaki. | 594.80 | 16.48 | [6,67] |
| Forests | Includes natural forest plantations. Lands with tree-canopy cover account for more than 20%. The trees should be able to reach a minimum height of 5 m. | 1937.03 | 1719.01 | [6,67,78,85,86,87,88,89,90,91,92,93,94,95,96,97,98,99,100,101,102,103] |
| Grasslands | Includes infertile or degraded land where no trees or shrubs grow. | 315.19 | 65.96 | [6,67,68,83] |
| Riparian zones | All areas of open water, including riparian buffer zones, generally with less than 25% vegetation or soil cover | 7312.16 | 5836.06 | [6,68,91,104,105,106,107,108,109,110] |
| Bare soils | Areas of bedrock, desert pavement, scarps, talus, slides, volcanic material, glacial debris, sand dunes, strip mines, gravel pits and other accumulations of earthen material. Vegetation generally accounts for less than 15% of the total cover. | 25.98 | 0.00 | [6,68] |
2.3.2. Least-Cost Path Method
3. Results and Discussion
3.1. Ecosystem Service Estimates for the City of Gwacheon
| Land Use Type | Component | Estimated Value (2011 US$/ha) | Area (ha) | Value of Ecosystem Services (2011 US$) |
|---|---|---|---|---|
| Developed areas of low and medium intensity | Residential | 235.36 | 0.00 | |
| Developed areas of high intensity | Commercial/traffic district/parks and recreation | 198.36 | 0.00 | |
| Developed area open spaces | Public facilities | 2130.67 | 422.31 | 899,803.25 |
| Rice paddies | Rice paddy | 5131.91 | 34.03 | 174,638.90 |
| Croplands | Farmland/greenhouse | 413.27 | 342.06 | 141,363.14 |
| Orchards | Orchard | 594.80 | 22.39 | 13,317.57 |
| Forests | Evergreen/deciduous/mixed | 1937.03 | 2133.28 | 4,132,227.36 |
| Grasslands | Natural/artificial | 315.19 | 42.2 | 13,301.02 |
| Riparian zones | Inland water | 7312.16 | 40.71 | 297,678.03 |
| Bare soils | Bare soil | 25.98 | 26.85 | 697.56 |
| Total | 17861.01 | 3497.55 | 5,673,026.83 |
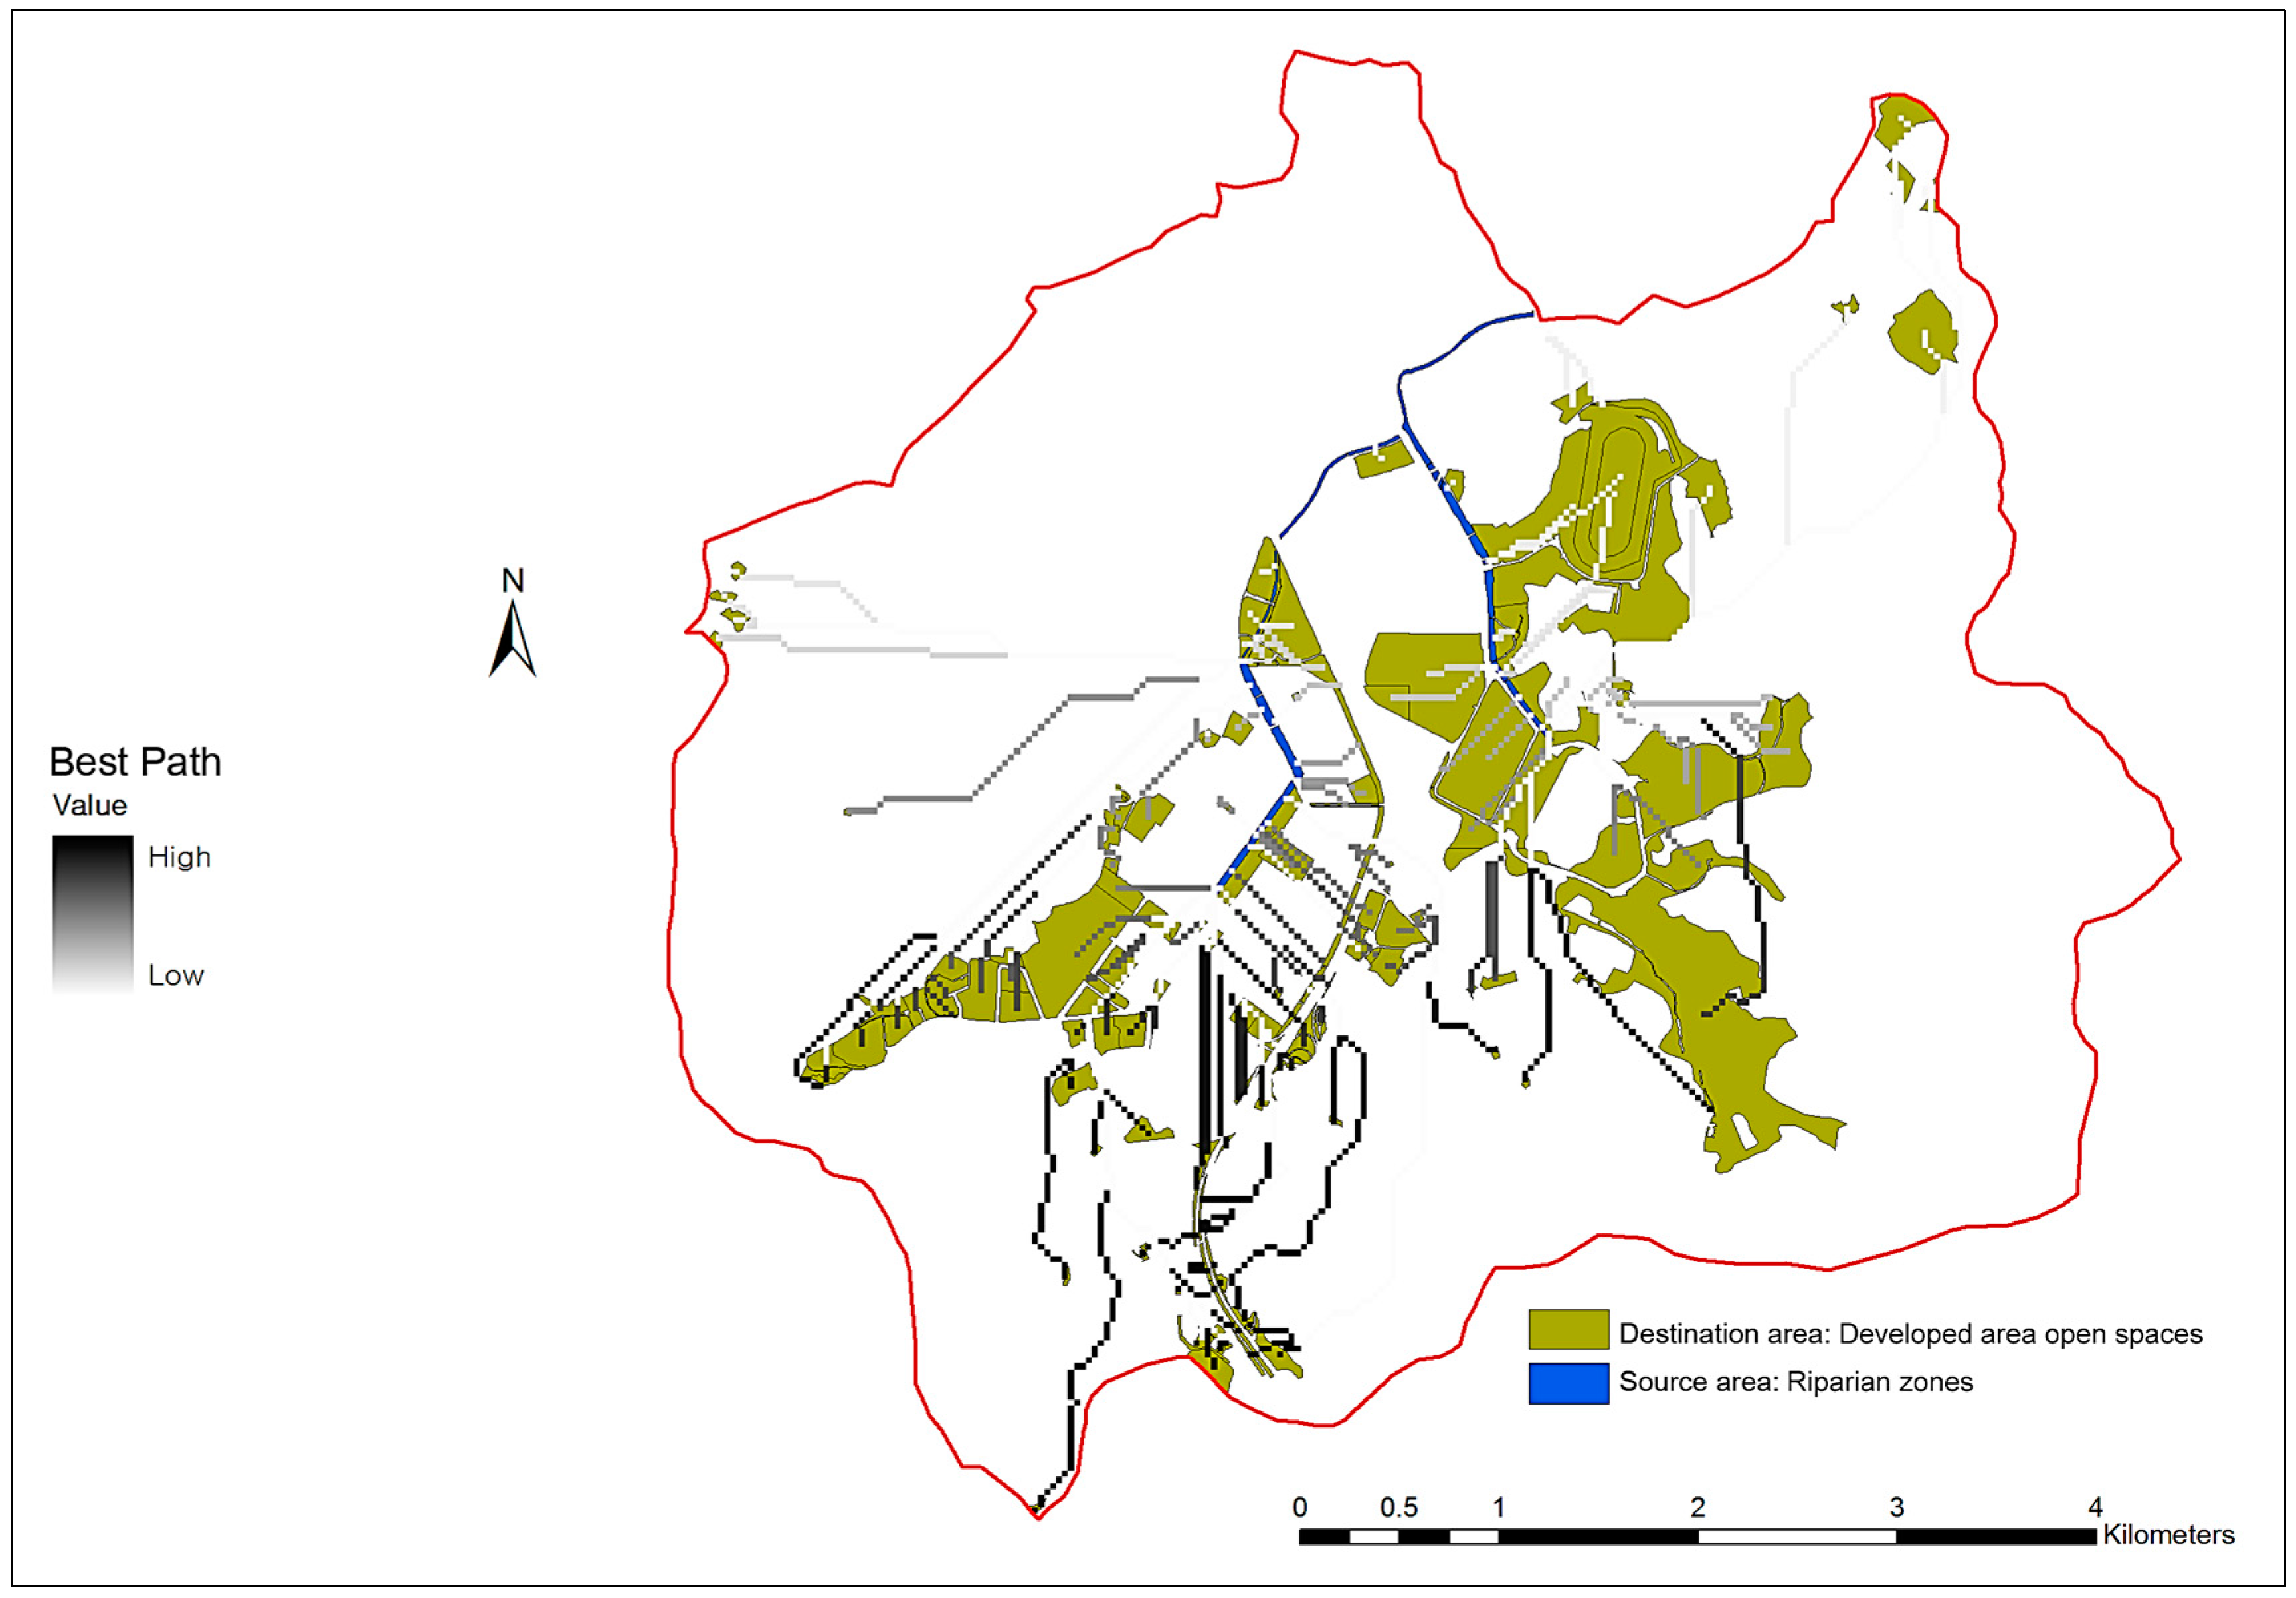
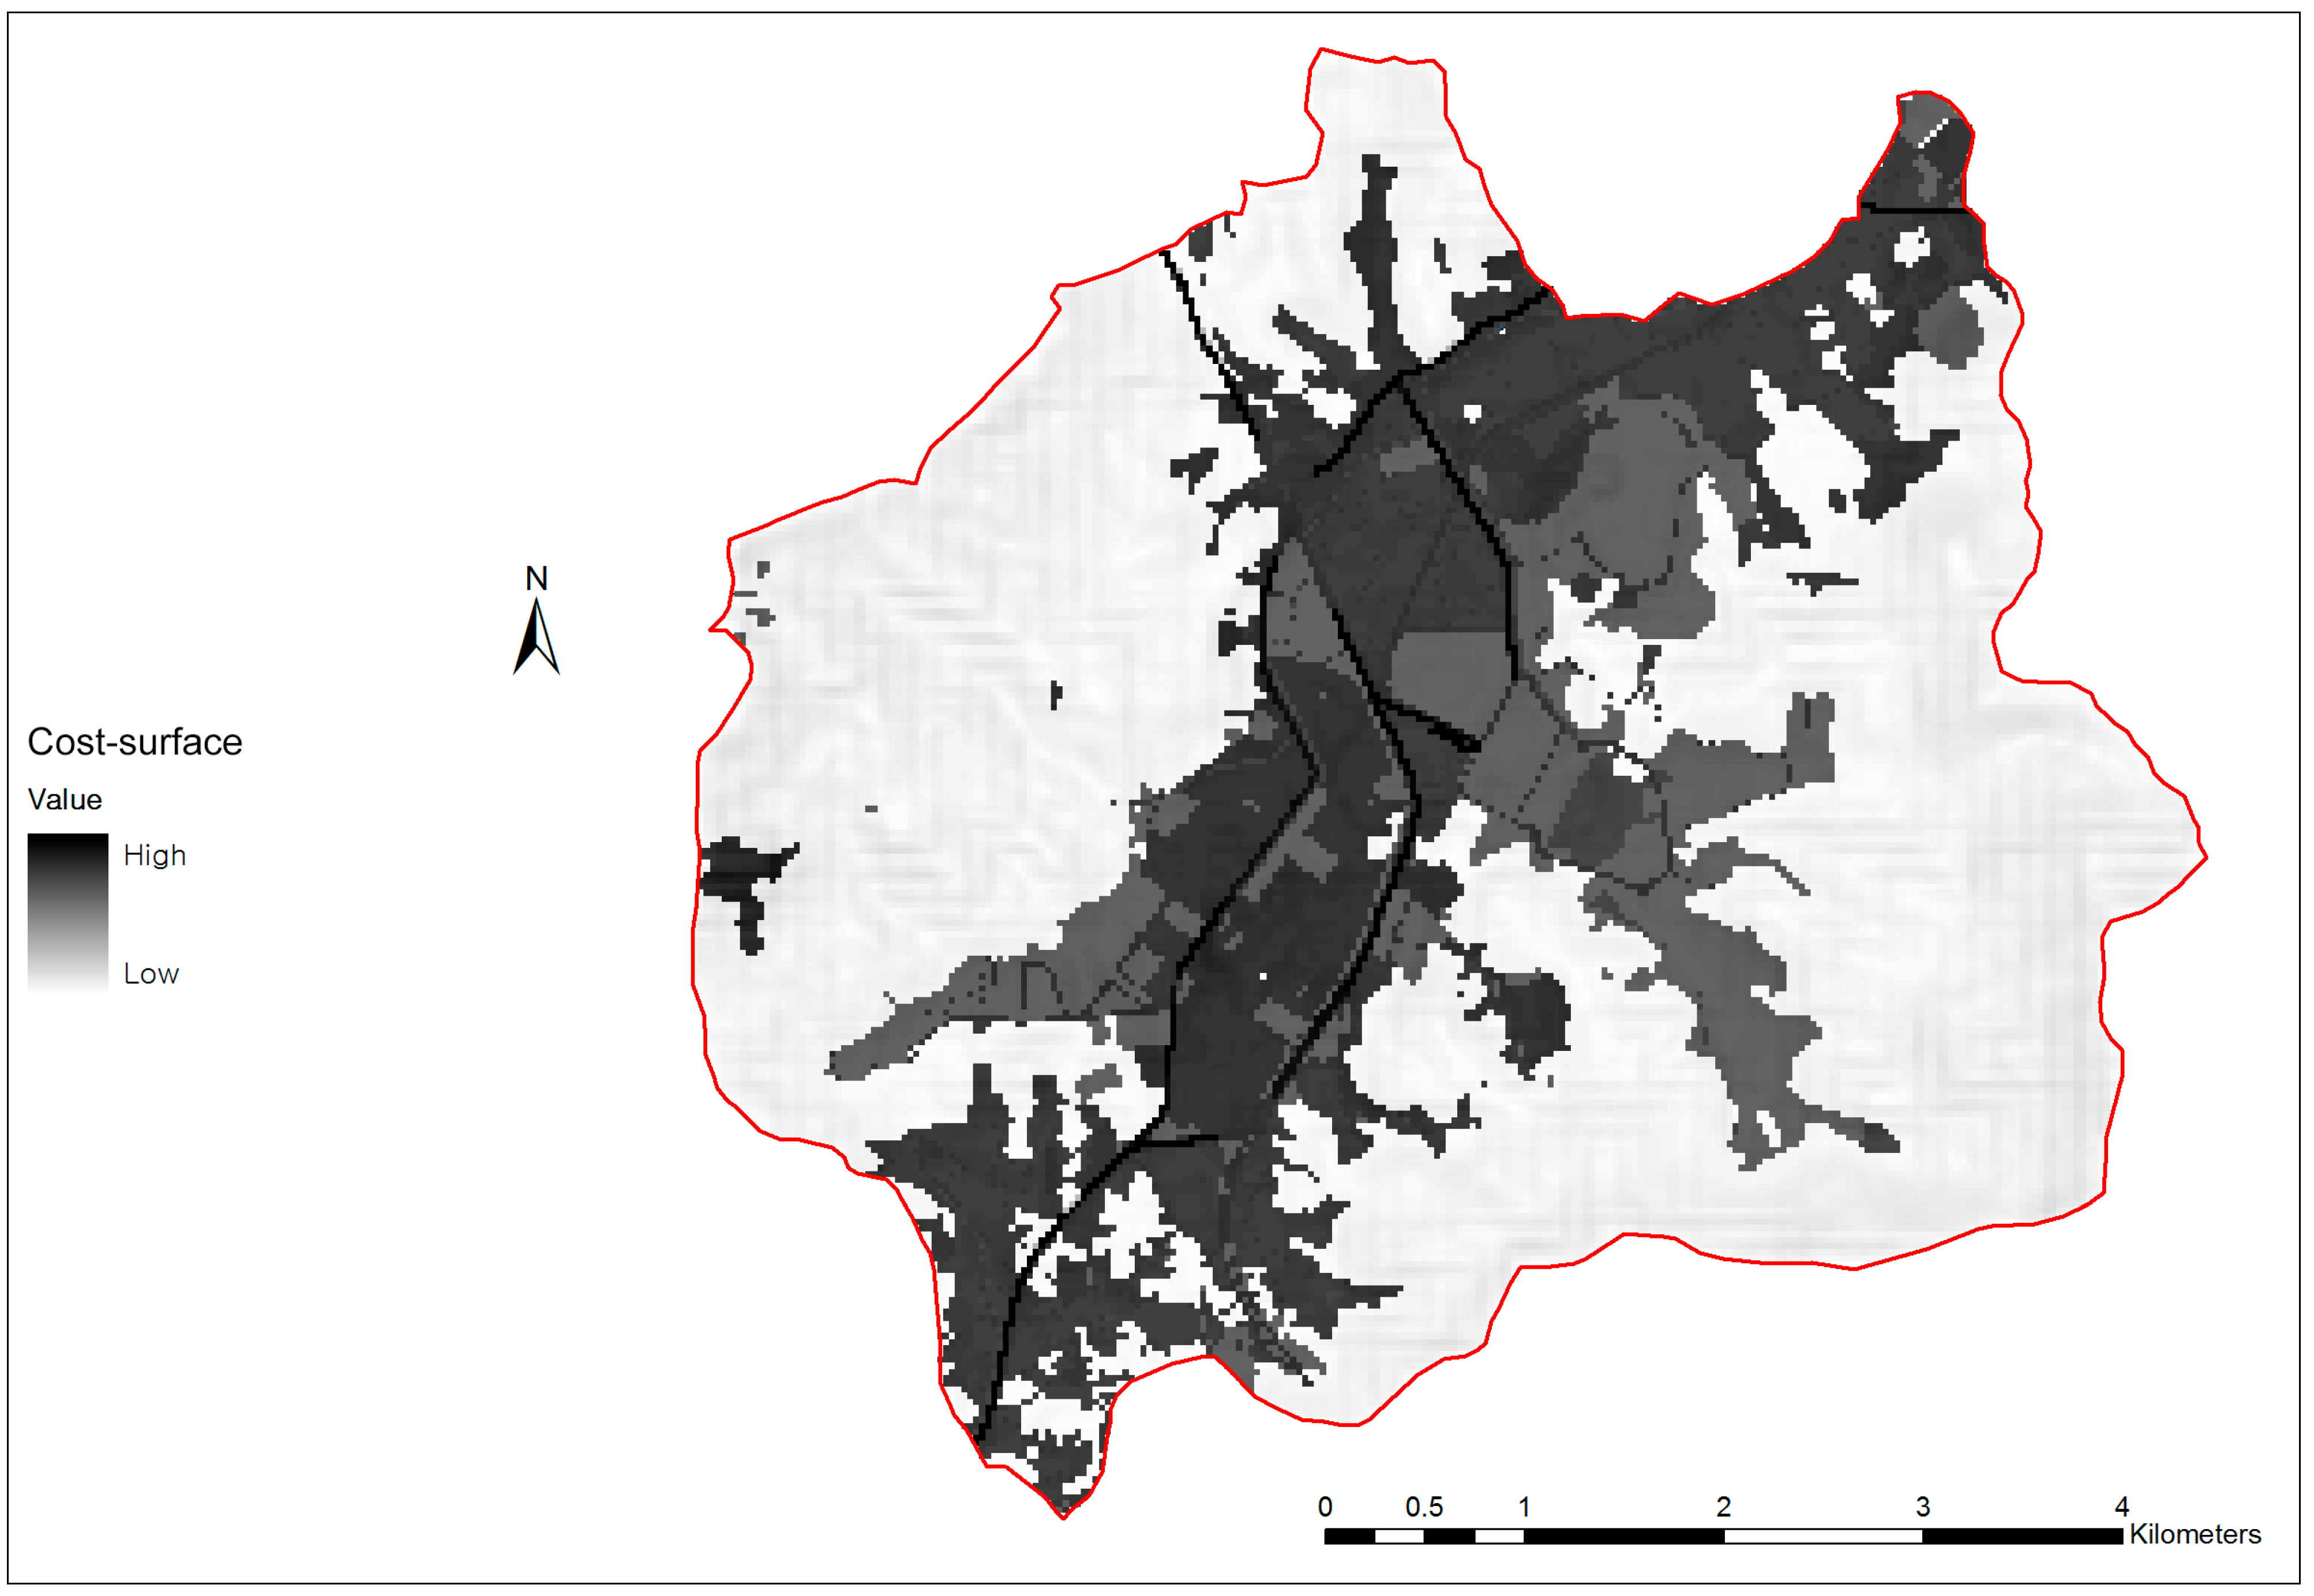
3.2. Planning Landscape Corridors within the Ecological Infrastructure
| Component | Weight Value | ||
|---|---|---|---|
| Land use type | Developed areas of low and medium intensity | 100.00 | 0.65 |
| Developed areas of high intensity | 100.00 | ||
| Developed area open spaces | 84.14 | ||
| Rice paddies | 96.92 | ||
| Croplands | 97.51 | ||
| Orchards | 99.77 | ||
| Forests | 27.16 | ||
| Grasslands | 99.77 | ||
| Riparian zones | 94.75 | ||
| Bare soils | 99.99 | ||
| Density of road | 0–1 km/km2 | 1 | 0.15 |
| 1–2 km/km2 | 2 | ||
| 2–4 km/km2 | 5 | ||
| 4–6 km/km2 | 7 | ||
| More than 6 km/km2 | 10 | ||
| Highway | Less than eight lanes | 100 | |
| More than eight lanes | 200 | ||
| Slope | 10(1.0—(1.0/1.0 + e(-(slope-30)/7))) | 0.2 | |

4. Conclusions
Acknowledgments
Author Contributions
Conflicts of Interest
References
- Schäfer, R.B. Biodiversity, ecosystem functions and services in environmental risk assessment: Introduction to the special issue. Sci. Total Environ. 2012, 415, 1–2. [Google Scholar] [CrossRef]
- Costanza, R.; Daly, H.E. Natural capital and sustainable development. Conserv. Biol. 1992, 6, 37–46. [Google Scholar] [CrossRef]
- Daly, H.E.; Farley, J. Ecological Economics: Principles and Applications, 2nd ed.; Island Press: Washington, DC, USA, 2010; pp. 74–75. [Google Scholar]
- Balmfor, A.; Rodrigues, A.S.L.; Walpole, M.; ten Brink, P.; Kettunen, M.; Braat, L.; de Groot, R.S. The Economics of Ecosystems and Biodiversity: Scoping the Science; European Commission: Cambridge, UK, 2008; pp. 29–34. [Google Scholar]
- Fisher, B.; Turner, R.K.; Morling, P. Defining and classifying ecosystem services for decision making. Ecol. Econ. 2009, 68, 643–653. [Google Scholar] [CrossRef]
- Costanza, R.; d’Arge, R.; de Groot, R.; Farber, S.; Grasso, M.; Hannon, B.; Limburg, K.; Naeem, S.; O’Neill, R.V.; Paruelo, J. The value of the world’s ecosystem services and natural capital. Nature 1997, 387, 253–260. [Google Scholar] [CrossRef]
- Van Wijnen, H.J.; Rutgers, M.; Schouten, A.J.; Mulder, C.; de Zwart, D.; Breure, A.M. How to calculate the spatial distribution of ecosystem services: Natural attenuation as example from The Netherlands. Sci. Total Environ. 2012, 415, 49–55. [Google Scholar] [CrossRef] [PubMed]
- Daily, G.C. Nature’s Services: Societal Dependence on Natural Ecosystems; Daily, G.C., Ed.; Island Press: Washington, DC, USA, 1997; pp. 1–10. [Google Scholar]
- Willemen, L.; Verburg, P.H.; Hein, L.; van Mensvoort, M.E.F. Spatial characterization of landscape functions. Landsc. Urban Plan. 2008, 88, 34–43. [Google Scholar] [CrossRef]
- De Groot, R.S. Functions of Nature, Evaluation of Nature in Environmental Planning, Management and Decision Making; Wolters-Noordhoff: Groningen, The Netherlands, 1992; pp. 340–345. [Google Scholar]
- Millennium Ecosystem Assessment. In Ecosystems and Human Well-Being: A Framework for Assessment; Island Press: Washington, DC, USA, 2003; pp. 26–84.
- Antrop, M. Background concepts for integrated landscape analysis. Agric. Ecosyst. Environ. 2000, 77, 17–28. [Google Scholar] [CrossRef]
- MacGarigal, K.; Marks, B. FRAGSTATS: Spatial Pattern Analysis Program for Quantifying Landscape Structure; U.S. Department of Agriculture: Portland, OR, USA, 1995; pp. 12–20. [Google Scholar]
- De Groot, R.S.; Alkemade, R.; Braat, L.; Hein, L.; Willemen, L. Challenges in integrating the concept of ecosystem services and values in landscape planning, management and decision making. Ecol. Complex. 2010, 7, 260–272. [Google Scholar] [CrossRef]
- Chan, K.M.A.; Shaw, M.R.; Cameron, D.R.; Underwood, E.C.; Daily, G.C. Conservation planning for ecosystem services. PLoS Biol. 2006, 4, 2138–2152. [Google Scholar]
- Gret-Regamey, A.; Walz, A.; Bebi, P. Valuing ecosystem services for sustainable landscape planning in Alpine regions. Mt. Res. Dev. 2008, 28, 156–165. [Google Scholar] [CrossRef]
- Lant, C.L.; Roberts, R. Greenbelts in the Cornbelt: Riparian wetlands, intrinsic values, and market failure. Environ. Plan. 1990, 22, 1375–1388. [Google Scholar] [CrossRef]
- Termorshuizen, J.W.; Opdam, P.; van den Brink, A. Incorporating ecological sustainability into landscape planning. Landsc. Urban Plan. 2007, 79, 374–384. [Google Scholar] [CrossRef]
- Benedict, M.A.; McMahon, E.T. Green Infrastructure: Linking Landscapes and Communities; Island Press: Washington, DC, USA, 2006; pp. 57–84. [Google Scholar]
- Gómez-Baggethun, E.; Barton, D.N. Classifying and valuing ecosystem services for urban planning. Ecol. Econ. 2013, 86, 235–245. [Google Scholar] [CrossRef]
- Haddad, N.M.; Tewksbury, J.J. Low-quality habitat corridors as movement conduits for two butterfly species. Ecol. Appl. 2005, 15, 250–257. [Google Scholar] [CrossRef]
- Jongman, R.H.G.; Pungetti, G. Ecological Networks and Greenways; Cambridge University Press: Cambridge, MA, USA, 2005. [Google Scholar]
- Rapport, D.J.; Costanza, R.; McMichael, A.J. Assessing ecosystem health. Trends. Ecol. Evol. 1998, 13, 397–402. [Google Scholar] [CrossRef] [PubMed]
- Bolund, P.; Hunhammar, S. Ecosystem services in urban areas. Ecol. Econ. 1999, 29, 293–301. [Google Scholar] [CrossRef]
- Grimm, N.B.; Faeth, S.H.; Golubiewski, N.E.; Redman, C.L.; Wu, J.G.; Bai, X.M.; Briggs, J.M. Global change and the ecology of cities. Science 2008, 319, 756–760. [Google Scholar] [CrossRef] [PubMed]
- Niemela, J.; Saarela, S.R.; Soderman, T.; Kopperoinen, L.; Yli-Pelkonen, V.; Vare, S.; Kotze, D.J. Using the ecosystem services approach for better planning and conservation of urban green spaces: A Finland case study. Biodivers. Conserv. 2010, 19, 3225–3243. [Google Scholar] [CrossRef]
- Nowak, D.J.; Crane, D.E. Carbon storage and sequestration by urban trees in the USA. Environ. Pollut. 2002, 116, 381–389. [Google Scholar] [CrossRef] [PubMed]
- Ayres, R.U.; van den Bergh, J.C.J.M. A theory of economic growth with material/energy resources and dematerialization: Interaction of three growth mechanisms. Ecol. Econ. 2005, 55, 96–118. [Google Scholar] [CrossRef]
- Krausmann, F.; Gingrich, S.; Eisenmenger, N.; Erb, K.H.; Haberl, H.; Fischer-Kowalski, M. Growth in global materials use, GDP and population during the 20th century. Ecol. Econ. 2009, 68, 2696–2705. [Google Scholar] [CrossRef]
- Fuchs, V.J.; Mihelcic, J.R.; Gierke, J.S. Life cycle assessment of vertical and horizontal flow constructed wetlands for wastewater treatment considering nitrogen and carbon greenhouse gas emissions. Water Res. 2011, 45, 2073–2081. [Google Scholar] [CrossRef] [PubMed]
- Ko, J.Y.; Day, J.W.; Lane, R.R.; Day, J.N. A comparative evaluation of money-based and energy-based cost benefit analyses of tertiary municipal wastewater treatment using forested wetlands vs. sand filtration in Louisiana. Ecol. Econ. 2004, 49, 331–347. [Google Scholar] [CrossRef]
- Shao, L.; Chen, G.; Hayat, T.; Alsaedi, A. Systems ecological accounting for wastewater treatment engineering: Method, indicator and application, Ecological Indicators. Ecol. Econ. 2014, 47, 32–42. [Google Scholar]
- Zhu, X.D.; Ye, Y.P. Estimate of life-cycle greenhouse gas emissions from a vertical subsurface flow constructed wetland and conventional wastewater treatment plants: A case study in China. Ecol. Eng. 2011, 37, 248–254. [Google Scholar] [CrossRef]
- Chen, B.; Chen, Z.M.; Zhou, Y.; Zhou, J.B.; Chen, G.Q. Emergy as embodied energy based assessment for local sustainability of a constructed wetland in Beijing. Commun. Nonlinear Sci. Numer. Simul. 2009, 14, 622–635. [Google Scholar] [CrossRef]
- Chen, G.Q.; Shao, L.; Chen, Z.M.; Li, Z.; Zhang, B.; Chen, H.; Wu, Z. Low-carbon assessment for ecological wastewater treatment by a constructed wetland in Beijing. Ecol. Eng. 2011, 37, 622–628. [Google Scholar]
- Chen, Z.M.; Chen, G.Q.; Chen, B.; Zhou, J.B.; Yang, Z.F.; Zhou, Y. Net ecosystem services value of wetland: Environmental economic account. Commun. Nonlinear Sci. Numer. Simul. 2009, 14, 2837–2843. [Google Scholar] [CrossRef]
- Forman, R.T.T.; Godron, M. Landscape Ecology; John Wiley and Sons, Inc.: New York, NY, USA, 1986; pp. 3–23. [Google Scholar]
- Larkin, J.L.; Maehr, D.S.; Hoctor, T.S.; Orlando, M.A.; Whitney, K. Landscape linkages and conservation planning for the black bear in west-central Florida. Anim. Conserv. 2004, 7, 23–34. [Google Scholar] [CrossRef]
- LaRue, M.A.; Nielsen, C.K. Modelling potential dispersal corridors for cougars in midwestern North America using least-cost path methods. Ecol. Modell. 2008, 212, 372–381. [Google Scholar] [CrossRef]
- Meegan, R.P.; Maehr, D.S. Landscape conservation and regional planning for the Florida panther. Southeast Natl. 2002, 1, 217–232. [Google Scholar] [CrossRef]
- Penrod, K.; Wildlands, S.C. South Coast Missing Linkages Project: A Linkage Design for the Santa Monica-Sierra Madre Connection; South Coast Wildlands: Idyllwild, CA, USA, 2006; pp. 20–52. [Google Scholar]
- Schadt, S.; Knauer, F.; Kaczensky, P.; Revilla, E.; Wiegand, T.; Trepl, L. Rule-based assessment of suitable habitat and patch connectivity for the Eurasian lynx. Ecol. Appl. 2002, 12, 1469–1483. [Google Scholar] [CrossRef]
- Cook, E.N.; van Lier, H.N. Landscape Planning and Ecological Networks; Elsevier Science Ltd: New York, NY, USA, 1994; p. 354. [Google Scholar]
- Singleton, P.H.; Gaines, W.L.; Lehmkuhl, J.F. Landscape Permeability for Large Carnivores in Washington: A Geographic Information System Weighted-Distance and Least-Cost Corridor Assessment; USDA Forest Service, Pacific Northwest Research Station: Portland, OR, USA, 2002. [Google Scholar]
- Anton, C.; Young, J.; Harrison, P.A.; Musche, M.; Bela, G.; Feld, C.K.; Harrington, R.; Haslett, J.R.; Pataki, G.; Rounsevell, M.D. Research needs for incorporating the ecosystem service approach into EU biodiversity conservation policy. Biodivers. Conserv. 2010, 19, 2979–2994. [Google Scholar] [CrossRef]
- Costanza, R.; Wilson, M.A.; Troy, A.; Voinov, A.; Liu, S.; D’Agostino, J. The value of New Jersey’s ecosystem services and natural capital. In Gund Institute for Ecological Economics; University of Vermont and New Jersey Department of Environmental Protection: Trenton, NJ, USA, 2006; pp. 8–52. [Google Scholar]
- Hoffmeister, T.S.; Vet, L.E.; Biere, A.; Holsinger, K.; Filser, J. Ecological and evolutionary consequences of biological invasion and habitat fragmentation. Ecosystems 2005, 8, 657–667. [Google Scholar] [CrossRef]
- Teng, M.; Wu, C.; Zhou, Z.; Lord, E.; Zheng, Z. Multipurpose greenway planning for changing cities: A framework integrating priorities and a least-cost path model. Landsc. Urban Plan. 2011, 103, 1–14. [Google Scholar] [CrossRef]
- Vos, C.C.; Verboom, J.; Opdam, P.F.; Ter Braak, C.J. Toward ecologically scaled landscape indices. Am. Nat. 2001, 157, 24–41. [Google Scholar] [CrossRef] [PubMed]
- Corry, R.C.; Lafortezza, R.; Brown, R.D. Ecological functionality of landscapes with alternative rehabilitations of depleted aggregate sites. Int. J. Min. Reclam. Environ. 2010, 24, 216–232. [Google Scholar] [CrossRef]
- Jesus, R.G.; Gabriel, D.B.; Beatriz, D. Assessing functional landscape connectivity for disturbance propagation on regional scales-A cost-surface model approach applied to surface fire spread. Ecol. Modell. 2008, 211, 121–141. [Google Scholar] [CrossRef]
- Weber, T.; Sloan, A.; Wolf, J. Maryland’s green infrastructure assessment: Development of a comprehensive approach to land conservation. Landsc. Urban Plan. 2006, 77, 94–110. [Google Scholar] [CrossRef]
- Forester, J.D.; Ives, A.R.; Turner, M.G.; Anderson, D.P.; Fortin, D.; Beyer, H.L.; Smith, D.W.; Boyce, M.S. State-space models link elk movement patterns to landscape characteristics in Yellowstone National Park. Ecol. Monogr. 2007, 77, 285–299. [Google Scholar] [CrossRef]
- Schick, R.S.; Loarie, S.R.; Colchero, F.; Best, B.D.; Boustany, A.; Conde, D.A.; Halpin, P.N.; Joppa, L.N.; McClellan, C.M.; Clark, J.S. Understanding movement data and movement processes: Current and emerging directions. Ecol. Lett. 2008, 11, 1338–1350. [Google Scholar] [CrossRef] [PubMed]
- Wu, H.; Li, B.; Springer, T.A.; Neill, W.H. Modelling animal movement as a persistent random walk in two dimensions: Expected magnitude of net displacement. Ecol. Modell. 2000, 132, 115–124. [Google Scholar] [CrossRef]
- Zetterberg, A.; Mörtberg, U.M.; Balfors, B. Making graph theory operational for landscape ecological assessments, planning, and design. Landsc. Urban Plan. 2010, 95, 181–191. [Google Scholar] [CrossRef]
- Zhang, L.; Wang, H. Planning an ecological network of Xiamen Island (China) using landscape metrics and network analysis. Landsc. Urban Plan. 2006, 78, 449–456. [Google Scholar] [CrossRef]
- Kong, F.; Yin, H.; Nakagoshi, N.; Zong, Y. Urban green space network development for biodiversity conservation: Identification based on graph theory and gravity modeling. Landsc. Urban Plan. 2010, 95, 16–27. [Google Scholar] [CrossRef]
- Turner, M.G. Landscape ecology: The effect of pattern on process. Annu. Rev. Ecol. Syst. 1989, 20, 171–197. [Google Scholar] [CrossRef]
- Arcmap 10.1, Institute, E.S.R.: Redlands, CA, USA, 2012.
- De Groot, R.S.; Wilson, M.A.; Boumans, R.M.J. A typology for the classification, description and valuation of ecosystem functions, goods and services. Ecol. Econ. 2002, 41, 393–408. [Google Scholar] [CrossRef]
- Troy, A.; Wilson, M.A. Mapping ecosystem services: Practical challenges and opportunities in linking GIS and value transfer. Ecol. Econ. 2006, 60, 435–449. [Google Scholar] [CrossRef]
- Millennium Ecosystem Assessment. In Ecosystems and Human Well-Being: Synthesis; Island Press: Washington, DC, USA, 2005; pp. 39–88.
- Heal, G.M.; Barbier, E.B.; Boyle, K.J.; Covich, A.P.; Gloss, S.P.; Hershner, C.H.; Hoehn, J.P.; Pringle, C.M.; Polasky, S.; Segerson, K.; et al. Valuing Ecosystem Services: Toward Better Environmental Decision Making; The National Academies Press: Washington, DC, USA, 2005; pp. 33–58. [Google Scholar]
- Villa, F.; Wilson, M.A.; de Groot, R.; Farber, S.; Costanza, R.; Boumans, R.M.J. Designing an integrated knowledge base to support ecosystem services valuation. Ecol. Econ. 2002, 41, 445–456. [Google Scholar] [CrossRef]
- Kreuter, U.P.; Harris, H.G.; Matlock, M.D.; Lacey, R.E. Change in ecosystem service values in the San Antonio area, Texas. Ecol. Econ. 2001, 39, 333–346. [Google Scholar] [CrossRef]
- Li, T.; Wenkai, L.; Zhenghan, Q. Variations in ecosystem service value in response to land use changes in Shenzhen. Ecol. Econ. 2010, 69, 1427–1435. [Google Scholar] [CrossRef]
- Portela, R.; Rademacher, I. A dynamic model of patterns of deforestation and their effect on the ability of the Brazilian Amazonia to provide ecosystem services. Ecol. Modell. 2001, 143, 115–146. [Google Scholar] [CrossRef]
- Tong, C.; Feagin, R.A.; Lu, J.; Zhang, X.; Zhu, X.; Wang, W.; He, W. Ecosystem service values and restoration in the urban Sanyang wetland of Wenzhou, China. Ecol. Eng. 2007, 29, 249–258. [Google Scholar] [CrossRef]
- Rosenberger, R.S.; Stanley, T.D. Measurement, generalization, and publication: Sources of error in benefit transfers and their management. Ecol. Econ. 2006, 60, 372–378. [Google Scholar] [CrossRef]
- Fitter, A.; Elmqvist, T.; Haines-young, R.; Poschin, M.; Rinaldo, A.; Setala, H.; Stoll-Kleemann, S.; Zobel, M.; Murlis, J. Ecosystem Services; Harrison, R.M., Hester, R.E., Eds.; Royal Society of Chemistry: Cambridge, UK, 2010; pp. 1–28. [Google Scholar]
- Liu, S.; Costanza, R.; Troy, A.; D’Aagostino, J.; Mates, W. Valuing New Jersey’s ecosystem services and natural capital: A spatially explicit benefit transfer approach. Environ. Manag. 2010, 45, 1271–1285. [Google Scholar] [CrossRef]
- Yang, W.; Chang, J.; Xu, B.; Peng, C.; Ge, Y. Ecosystem service value assessment for constructed wetlands: A case study in Hangzhou, China. Ecol. Econ. 2008, 68, 116–125. [Google Scholar] [CrossRef]
- Chen, N.; Li, H.; Wang, L. A GIS-based approach for mapping direct use value of ecosystem services at a county scale: Management implications. Ecol. Econ. 2009, 68, 2768–2776. [Google Scholar] [CrossRef]
- Sutton, P.C.; Costanza, R. Global estimates of market and non-market values derived from nighttime satellite imagery, land cover, and ecosystem service valuation. Ecol. Econ. 2002, 41, 509–527. [Google Scholar] [CrossRef]
- Turner, R.; Daily, G. The ecosystem services framework and natural capital conservation. Environ. Resour. Econ. 2008, 39, 25–35. [Google Scholar] [CrossRef]
- Shrestha, R.K.; Loomis, J.B. Meta-analytic benefit transfer of outdoor recreation economic values: Testing out-of-sample convergent validity. Environ. Resour. Econ. 2003, 25, 79–100. [Google Scholar] [CrossRef]
- Bergstrom, J.C.; Taylor, L.O. Using meta-analysis for benefits transfer: Theory and practice. Ecol. Econ. 2006, 60, 351–360. [Google Scholar] [CrossRef]
- De Groot, R.; Brander, L.; van der Ploeg, S.; Costanza, R.; Bernard, F.; Braat, L.; Christie, M.; Crossman, N.; Ghermandi, A.; Hein, L.; et al. Global estimates of the value of ecosystems and their services in monetary units. Ecosyst. Serv. 2012, 1, 50–61. [Google Scholar] [CrossRef]
- MeasuringWorth. Available online: http://www.measuringworth.com (accessed on 5 May 2013).
- Penrod, K.; Cabanero, C.; Beier, P.; Luke, C.; Spencer, W.; Rubin, E.; Paulman, C. A Linkage Design for the Joshua Tree-Twentynine Palms Connection; South Coast Wildlands: Fair Oaks, CA, USA Unpublished Report. Available online: http://www.scwildands.org (accessed on 5 March 2013).
- Finke, J.; Sonnenschein, M. Information Technologies in Environmental Engineering; Gomez, J.M., Sonnenschein, M., Muller, M., Welsch, H., Rautenstrauch, C., Eds.; Springer: Berlin, Germany, 2007; pp. 433–444. [Google Scholar]
- Tyrväinen, L. Economic valuation of urban forest benefits in Finland. J. Environ. Manag. 2001, 62, 75–92. [Google Scholar] [CrossRef]
- Creel, M.; Loomis, J. Recreation value of water to wetlands in the San Joaquin Valley: Linked multinomial logit and count data trip frequency models. Water Resour. Res. 1992, 28, 2597–2606. [Google Scholar] [CrossRef]
- Mahan, B.L.; Polasky, S.; Adams, R.M. Valuing urban wetlands: A property price approach. Land Econ. 2000, 76, 100–113. [Google Scholar] [CrossRef]
- Mendoza-González, G.; Martínez, M.; Lithgow, D.; Pérez-Maqueo, O.; Simonin, P. Land use change and its effects on the value of ecosystem services along the coast of the Gulf of Mexico. Ecol. Econ. 2012, 82, 23–32. [Google Scholar] [CrossRef]
- Natuhara, Y. Ecosystem services by paddy fields as substitutes of natural wetlands in Japan. Ecol. Eng. 2013, 56, 97–106. [Google Scholar] [CrossRef]
- Alvarez-Farizo, B. Estimating the benefits of agri-environmental policy: Econometric issues in open-ended contingent valuation studies. J. Environ. Plan. Manag. 1999, 42, 23–43. [Google Scholar] [CrossRef]
- Bergstrom, J.C.; Stoll, J.R.; Titre, J.P.; Wright, V.L. Economic value of wetlands-based recreation. Ecol. Econ. 1990, 2, 129–147. [Google Scholar] [CrossRef]
- Su, S.; Xiao, R.; Jiang, Z.; Zhang, Y. Characterizing landscape pattern and ecosystem service value changes for urbanization impacts at an eco-regional scale. Appl. Geogr. 2012, 34, 295–305. [Google Scholar] [CrossRef]
- Amigues, J.-P.; Desaigues, B.; Gauthier, C.; Keith, J.E. The benefits and costs of riparian analysis habitat preservation: A willingness to accept/willingness to pay contingent valuation approach. Ecol. Econ. 2002, 43, 17–31. [Google Scholar] [CrossRef]
- Azar, C.; Sterner, T. Discounting and distributional considerations in the context of global warming. Ecol. Econ. 1996, 19, 169–184. [Google Scholar] [CrossRef]
- Bennett, R. The value of footpath provision in the countryside: A case-study of public access to urban-fringe woodland. J. Environ. Plan. Manag. 1995, 38, 409–418. [Google Scholar] [CrossRef]
- Bishop, K. Assessing the benefits of community forests: An evaluation of the recreational use benefits of two urban fringe woodlands. J. Environ. Plan. Manag. 1992, 35, 63–76. [Google Scholar] [CrossRef]
- Fankhauser, S. The social costs of greenhouse gas emissions: An expected value approach. Energy J. 1994, 157–184. [Google Scholar]
- Garrod, G.D.; Willis, K.G. The non-use benefits of enhancing forest biodiversity: A contingent ranking study. Ecol. Econ. 1997, 21, 45–61. [Google Scholar] [CrossRef]
- Hope, C.; Maul, P. Valuing the impact of CO2 emissions. Energ. Policy 1996, 24, 211–219. [Google Scholar] [CrossRef]
- Hougner, C.; Colding, J.; Söderqvist, T. Economic valuation of a seed dispersal service in the Stockholm National Urban Park, Sweden. Ecol. Econ. 2006, 59, 364–374. [Google Scholar] [CrossRef]
- Maddison, D. A cost-benefit analysis of slowing climate change. Energ. Policy 1995, 23, 337–346. [Google Scholar] [CrossRef]
- Newell, R.G.; Pizer, W.A. Discounting the distant future: How much do uncertain rates increase valuations? J. Environ. Plan. Manag. 2003, 46, 52–71. [Google Scholar]
- Nordhaus, W.D.; Popp, D. What is the value of scientific knowledge? An application to global warming using the PRICE model. Energy J. 1997, 18, 1–46. [Google Scholar] [CrossRef]
- Plambeck, E.L.; Hope, C. PAGE95: An updated valuation of the impacts of global warming. Energ. Policy 1996, 24, 783–793. [Google Scholar] [CrossRef]
- Prince, R.; Ahmed, E. Estimating individual recreation benefits under congestion and uncertainty. J. Leis. Res. 1989, 21, 61–76. [Google Scholar]
- Reilly, J.M.; Richards, K.R. Climate change damage and the trace gas index issue. Environ. Resour. Econ. 1993, 3, 41–61. [Google Scholar] [CrossRef]
- Roughgarden, T.; Schneider, S.H. Climate change policy: Quantifying uncertainties for damages and optimal carbon taxes. Energ. Policy 1999, 27, 415–429. [Google Scholar] [CrossRef]
- Schauer, M.J. Estimation of the greenhouse gas externality with uncertainty. Environ. Resour. Econ. 1995, 5, 71–82. [Google Scholar] [CrossRef]
- Tol, R.S. The marginal costs of greenhouse gas emissions. Energy J. 1999, 20, 61–81. [Google Scholar]
- Willis, K.G.; Garrod, G. An individual travel-cost method of evaluating forest recreation. J. Agric. Econ. 1991, 42, 33–42. [Google Scholar] [CrossRef]
- Cordell, H.K.; Bergstrom, J.C. Comparison of recreation use values among alternative reservoir water level management scenarios. Water Resour. Res. 1993, 29, 247–258. [Google Scholar] [CrossRef]
- Duffield, J.W.; Neher, C.J.; Brown, T.C. Recreation benefits of instream flow: Application to Montana’s Big Hole and Bitterroot Rivers. Water Resour. Res. 1992, 28, 2169–2181. [Google Scholar] [CrossRef]
- Kahn, J.R.; Buerger, R.B. Valuation and the consequences of multiple sources of environmental deterioration: The case of the New York striped bass fishery. J. Environ. Manag. 1994, 40, 257–273. [Google Scholar] [CrossRef]
- Oster, S. Survey results on the benefits of water pollution abatement in the Merrimack River Basin. Water Resour. Res. 1977, 13, 882–884. [Google Scholar] [CrossRef]
- Patrick, R.; Fletcher, J.; Lovejoy, S.; Beek, W.V.; Holloway, G.; Binkley, J. Estimating regional benefits of reducing targeted pollutants: An application to agricultural effects on water quality and the value of recreational fishing. J. Environ. Manage. 1991, 33, 301–310. [Google Scholar] [CrossRef]
- Ribaudo, M.O.; Epp, D.J. The importance of sample discrimination in using the travel cost method to estimate the benefits of improved water quality. Land Econ. 1984, 60, 397–403. [Google Scholar] [CrossRef]
- Sanders, L.D.; Walsh, R.G.; Loomis, J.B. Toward empirical estimation of the total value of protecting rivers. Water Resour. Res. 1990, 26, 1345–1357. [Google Scholar] [CrossRef]
- Johnson, K.A.; Polasky, S.; Nelson, E.; Pennington, D. Uncertainty in ecosystem services valuation and implications for assessing land use tradeoffs: An agricultural case study in the Minnesota River Basin. Ecol. Econ. 2012, 79, 71–79. [Google Scholar] [CrossRef]
- Ives, C.D.; Hose, G.C.; Nipperess, D.A.; Taylor, M.P. Environmental and landscape factors influencing ant and plant diversity in suburban riparian corridors. Landsc. Urban Plan. 2011, 103, 372–382. [Google Scholar] [CrossRef]
- Baschak, L.A.; Brown, R.D. An ecological framework for the planning, design and management of urban river greenways. Landsc. Urban Plan. 1995, 33, 211–225. [Google Scholar] [CrossRef]
- Little, C.E. Greenways for America; Johns Hopkins University Press: Baltimore, MD, USA, 1995; pp. 81–104. [Google Scholar]
- OECD. Multifunctionality Towards an Analytical Framework; OECD: Paris, France, 2001; p. 158. [Google Scholar]
- Justin, K.; Lant, C.; Shaikh, S.; Wang, G. The geography of ecosystem service value: The case of the Des Plaines and Cache River wetlands, Illinois. Appl. Geogr. 2011, 31, 303–311. [Google Scholar] [CrossRef]
- Taylor, P.D.; Fahrig, L.; Henein, K.; Merriam, G. Connectivity is a vital element of landscape structure. Oikos 1993, 68, 571–573. [Google Scholar] [CrossRef]
- With, K.A.; Gardner, R.H.; Turner, M.G. Landscape connectivity and population distributions in heterogeneous environments. Oikos 1997, 78, 151–169. [Google Scholar] [CrossRef]
- Lee, J.; Kim, J.; Yoo, M.; Kim, E.; Chon, J. Satisfaction and anticipated benefits on a community-based riparian greenway. Seoul Stud. 2010, 11, 15–28. [Google Scholar]
- Wolf, K.L.; Noe, G.B.; Ahn, C. Hydrologic Connectivity to Streams Increases Nitrogen and Phosphorus Inputs and Cycling in Soils of Created and Natural Floodplain Wetlands. J. Environ. Qual. 2013, 42, 1245–1255. [Google Scholar] [CrossRef] [PubMed]
© 2014 by the authors; licensee MDPI, Basel, Switzerland. This article is an open access article distributed under the terms and conditions of the Creative Commons Attribution license (http://creativecommons.org/licenses/by/4.0/).
Share and Cite
Lee, J.A.; Chon, J.; Ahn, C. Planning Landscape Corridors in Ecological Infrastructure Using Least-Cost Path Methods Based on the Value of Ecosystem Services. Sustainability 2014, 6, 7564-7585. https://doi.org/10.3390/su6117564
Lee JA, Chon J, Ahn C. Planning Landscape Corridors in Ecological Infrastructure Using Least-Cost Path Methods Based on the Value of Ecosystem Services. Sustainability. 2014; 6(11):7564-7585. https://doi.org/10.3390/su6117564
Chicago/Turabian StyleLee, Jung A, Jinhyung Chon, and Changwoo Ahn. 2014. "Planning Landscape Corridors in Ecological Infrastructure Using Least-Cost Path Methods Based on the Value of Ecosystem Services" Sustainability 6, no. 11: 7564-7585. https://doi.org/10.3390/su6117564