1. Introduction
During the last few years the consumption of fish has been continuously growing due both to its nutritional qualities and the techniques of capture, storage and transport, which have been improved, allowing for the export of fish over long distances while still maintaining its nutritional quality.
Due to the appreciation of fish as a healthy food, the world fish food supply has grown significantly during the last few years, with an average growth rate of 3.2 percent per year in the period between 1961 and 2009, reaching the worldwide value of about 148 million metric tons of fish supplied by capture fisheries and aquaculture in 2010 (with a total value of US $217.5 billion), about 128 million metric tons of which have been used as food for people [
1].
The increased consumption of fish has been supported over time by the knowledge that aquatic resources, although renewable, are not infinite, and must be adequately managed, if their contribution to the nutritional, economic and social well-being of the world’s growing population is to be sustained [
2].
There is evidence of the beneficial effects of fish consumption for the prevention of cardiovascular diseases [
3], diabetes [
4] and some types of cancers [
5].
In fact, fish and fishery products represent a valuable source of nutrients of fundamental importance for diversified and healthy diets not only as a source of high-value protein, but also as a source of vitamins such as choline, biotin and vitamin B12, A, D and E, various trace elements like selenium and iodine and polyunsaturated omega-3 fatty acids (docosahexaenoic acid and eicosapentaenoic acid) [
6,
7].
The entire human system relies on resources and services provided by the Biosphere, from which it cannot be dissociated. Besides its rigorous scientific conceptual framework industrial ecology, referring to all human activities occurring within modern society, can be seen as a practical approach to sustainability. Industrial ecology represents precisely one of the paths that could provide concrete solutions [
8].
The development of modern fishing should aim to ensure the functionality of ecosystems considering that each economic activity in the marine and coastal areas (both fishing and aquaculture) depends on the ability of marine and coastal ecosystems to provide fish for human consumption. In this article, we review estimates of marine and coastal areas taken for use by Italian Mediterranean marine fisheries.
2. Literature Review and Analysis of Indicators
The concept notes on the European Union of 2014 provide a general overview on the fisheries sector in Europe: in the last few years the European Union has seen a slight fall in fish production, whose level is around 6.2 million metric tons, corresponding to approximately 3.3% of world production. The total value of the captures on a global level in the last years corresponds to about 88.6 million metric tons, while the captures of the European Union correspond to about 5.6% of this value, that is 4.9 million metric tons. The European Union can be considered the largest single market in the world for fish products. In fact, it is a net importer of such products and covers 40% of the world imports [
9].
As regards the Italian situation, since 2008 there has been a significant reduction in fish consumption. In fact, Italians tend to sacrifice more and more fish in their diet because of the economic crisis. According to the analysis carried out by “Coldiretti Impresa—Pesca” based on Ismea data, in Italy fish consumption is lower than in other member States with outlets on the Mediterranean Sea. For the first time since 2000, consumption has dropped to below 20 kg
per capita, compared to 60 kg of Portugal, 49 kg of Spain and 30 kg of France [
10].
In particular, data concerning captures reveal a significant decrease in the level of fish production in Italy since 2008. Information related to 2011, when production amounted to 210,324 metric tons, equivalent to approximately 1090 million euros, highlighted, for the first time, a reduction in captures despite an increase of about 5% of the total days of fishing during the year, compared to 2010 [
11].
After the negative figure of 2011, the national fish production marked another decline in 2012 (−5.7%); in addition, the decreasing trend continues to affect not only marine fisheries (captures dropped of 6.8% compared to 2011), but also raised products (−4.4%). Foreign trade in the domestic field also suffered the global recession in 2012, with exports and imports in significant decline. In particular, Italian imports of fresh fish products decreased by more than 8% compared to 2011; on the exports side, the decline for fresh products was much higher than that of processed products (respectively −20.7% and −2.6% in value), also due to the difficult year of production. As a result of the decline in imports, the trade deficit improved, dropping from almost 3.86 to 3.71 billion euros (−4%) [
12].
The state of the global marine ecosystem is not encouraging: 90% of all large predatory fish have disappeared, forcing Countries to descend to lower and lower levels of food webs to meet their growing demand for fish products [
13].
Humanity is doing little to stop the depletion of marine resources and to implement proper management of fisheries. A first step to reverse these trends is the development of indicators that could be able to help people understand the extent of the problem and assess the possible solutions.
The Marine Ecological Footprint measures the area of the marine ecosystem that human populations take possession of to meet the demand for fish products. The calculation of the Marine Ecological Footprint can be done on a global, regional or local (referring, for example, to a single city) scale and focus on specific activities, such as aquaculture, live fish trade or captures [
14].
Although the Marine Ecological Footprint is not able to express all the problems related to the marine ecosystem, such as pollution levels of the fish, it appears anyway to be a tool that allows people to understand and communicate in an immediate way the environmental impact concerning the consumption of fish and other marine-based products and services by humans and, thanks to these characteristics, it appears to be an easily understood metric for policymakers to gauge demand and associated impacts but also the behavior of individual consumers [
15].
The Marine Ecological Footprint calculation began to evolve in the late Eighties. Studies conducted over time differ among themselves, depending on the activity they refer to, the measurement system, the amplitude and the purpose (
Table 1).
Table 1.
Previous studies and literature about Marine Ecological Footprint classification and methodology.
Table 1.
Previous studies and literature about Marine Ecological Footprint classification and methodology.
| Marine Footprint Studies Classification | Studies Methodology | References |
|---|
| Activities addressed | - -
mariculture; - -
catches.
| Larsson et al. [16];
Folke [17];
Tyedmers [18]. |
| Metrics | - -
spatial to spatial fishprint; - -
spatial to weight fishprint.
| Larsson et al. [16];
Berg et al. [19];
Bunting [20];
Weber [21]. |
| Scale | - -
global; - -
local.
| Folke et al. [19];
Folke et al. [22];
Folke et al. [17]. |
| Scope | - -
comparison between fishery management; - -
comparison between footprint and biocapacity.
| Folke et al. [22];
Warren-Rhodes [14]. |
Regarding studies based on the type of activity, Tyedmers [
18], for example, has calculated the footprint per metric tons of four species of salmon coming from capture and breeding, considering the biological, work, fossil fuels and electricity aspects.
From the point of view of metrics, studies realized are divided into two categories defined “spatial to spatial fish print” and “spatial to weight fish print” [
16,
19,
20,
21]. The former is particularly widespread in the field of mariculture and it calculates the area of the marine ecosystem in hectares needed to support a certain number of hectares of superficial cultivation, while the latter calculates the area required for the production of a certain weight of fish, produced or caught.
The classification of studies according to the scale, on the other hand, distinguishes the operations, the individual activities, the production and the consumption of cities, regions, nations and the world. Folke
et al. was one of the first to consider the Marine Ecological Footprint of the whole fish production in a region by calculating the required primary production in the North Sea and the Baltic Sea for salmon capture and breeding [
17].
Moreover, studies have different scopes since many of them consider the footprint in order to compare alternative fisheries management systems or different consumption models, while others compare the footprint with biocapacity, in order to express evaluations about the environmental sustainability of production and consumption, in line with the general methodology of Ecological Footprint Analysis [
14,
22].
The
standard calculation of the Marine Ecological Footprint needs three types of data:
The metric tons of various species of fish consumed by a given Country (T), reported in the annual statistics of the FAO;
A global performance factor ( in metric tons per hectare, calculated as the total amount of fish divided by the total area of fishing in a given year;
An equivalence factor (EQF) needed to convert a hectare of marine fisheries area into standard global hectares, calculated, for each biome, dividing the average productivity of the biome by the world average productivity.
For N Country, in the year y, the Marine Footprint (MEF) is simply:
Productivity at a world level is measured in terms of agricultural potential, which is determined by the Agricultural Ecological Global Zone (GAEZ) system of the FAO. As regards the Marine Ecological Footprint, an equivalence factor equal to 0.35 is assigned to the sea fishing areas, and from that it follows that the productivity of these areas corresponds to 35% of the overall average. The biocapacity of marine fisheries (MBC) of the N Country, in the year y, it results from the following equation:
(Exclusive Economic Zone), according to the UNCLOS (United Nations Convention on the Law of the Sea) is the area in which a Country exercises the exclusive sovereign rights for the purpose of exploring and exploiting, conserving and managing the natural resources, whether living or non-living, of the waters superjacent to the seabed and of the seabed and its subsoil, and with regard to other activities for the economic exploitation and exploration of the zone, such as the production of energy from the water, currents and winds.
represents the relationship between the yield per hectare of the N Country with reference to its own EEZ and the global average. It highlights the fact that the productivity of fishing grounds varies greatly from one Country to another and can be understood as an equivalence factor inside the biome. In contrast, the EQF allows us to make comparisons among biomes [
13].
Any changes to this standard model for calculating the footprint and the biocapacity come from the need to implement the analysis the changes in the average trophic levels both globally and in the individual Countries considering, therefore, as a basis for calculating, metric tons of primary productivity instead of metric tons of the various consumed species of fish. The Primary Production Required (PPR) is the function of the trophic level of the species that are caught and it follows that, since the transfer efficiency among trophic levels in the ocean is relatively low (10%), a greater primary production is required to provide a metric tons of fish with a high trophic level, than a fish with a low trophic level. The PPR is calculated separately for each species (or group of species) and for the fleets of all the countries operating in the Exclusive Economic Zone (EEZ) of a given Country and it is expressed in terms of the Primary Production of the EEZ. Taking into consideration the metric tons of primary production in the calculation of the footprint, we move from a consumption-based footprint to a captures-based footprint.
In a standard approach, the situation of over-exploitation of marine resources for a single Country with a footprint higher than its biocapacity is mathematically (though not conceptually) impossible, and this is recognized as one of the major limitations of the Ecological Footprint Analysis, leading to doubt about the utility of the Ecological Footprint as a tool for assessing the sustainability of fish production both globally and nationally.
As a remedy to the impossibility of the standard approach to measure the over-exploitation of the marine ecosystem on a global or national level, there are four distinct patterns of calculation of the footprint on a global or national level that introduce some elements that can detect the imbalance between footprint and biocapacity, based on the following three criteria:
- (1)
The model must distinguish between sustainable use and non-sustainable use of fisheries resources on a global or national level;
- (2)
The biocapacity should have its maximum extension until it reaches a state of overshoot and, once this level is exceeded, it should decrease during the periods of overfishing and increase in the moment in which the pressure of fishing activities is reduced;
- (3)
Assuming that the ecological productivity is constant, the footprint should increase as global fish capture increases. If a model succeeds in meeting one of these conditions, it could potentially show the imbalance between the global footprint and biocapacity.
The first model introduces the concept of the Ecologically Sustainable Yield Threshold (ESYT) for fishing on a global or national level. It is the level of global or national captures, expressible both in terms of metric tons and of Primary Productivity Request (PPR), beyond which the ecological sustainability is compromised. Thanks to the introduction of an ESYT in the calculation of the footprint, it is therefore possible that it exceeds the biocapacity in the moment in which there is an over-exploitation of marine resources. This model ensures that the captures below or above the ESYT could result in a less or greater footprint than the biocapacity and that footprint increases as captures increase. The identification of a suitable ESYT, however, is not easy or immediate, considering the heterogeneity of fishing activities and the natural fluctuations of the ecological productivity [
23].
The second model is very similar to the first one, but it adds a further factor that contributes to the creation of an imbalance between footprint and biocapacity. This operation is realized by deducting an amount equal to 20% of the biocapacity of all the Exclusive Economic Zones, considering that it is intended to represent a “reserve” for other species. The scale obtained is called “adjusted biocapacity” (
. The introduction of this adjustment to the biocapacity is necessary for the protection of the marine ecosystem in the long run, but the figure of 20% is, at the moment, completely arbitrary [
24].
The third model reflects the assumption according to which the biocapacity can be considered a fixed size until the level of over-exploitation is reached, and beyond which, biocapacity is reduced and can increase only in the case in such over-exploitation stops. In this model, the “unsustainably used” area is yearly subtracted from the biocapacity, defined as the area required to generate the amount of fish exceeding the ESYT. The main limitation of this model consists in the fact that it does not recognize that a certain amount of time lapses between the occurrence of an over-exploitation of marine resources and the ecological collapse, as well as between the reduction of captures and the ecological recovery: the effects are considered instantaneous, with a reduction in biocapacity, during the year in which over-exploitation occurs, and an increase in the year in which a reduction in captures occurs [
23].
The fourth model has the goal of making the Marine Ecological Footprint compliant to the Ecological Footprint Analysis. In the traditional version of this analysis, on the basis of the assumption that every hectare of the Earth’s surface can fulfill only one function at a time, the imprint of humanity can never exceed the Earth’s surface. Actually, each hectare is able to perform multiple functions, such as carbon sinks and food supply. Therefore, if both functions are carried out fully, our footprint is two hectares for every hectare of land. For this reason, the fourth model poses a constraint on the size of the footprint, making it match the biocapacity (which does not receive the adjustments provided in the previous models) in the year of maximum capture, and deducting previous years proportionally to this level, based on the following equation:
The footprint of the fourth model
is therefore equal to the biocapacity of 1999 (33.94 billion gha), multiplied by the ratio between the footprint of a given year
calculated on the base of models 1 and 3, and the footprint of 1999
[
23].
3. Material and Methods
The analysis of this work defines the Marine Ecological Footprint (MEF) based on the primary production that is required to generate the Italian catches of marine fisheries. The Primary Production Required (PPR), as proposed by Pauly and Christensen is calculated from [
25]:
where
Ci represents the catch of species
i;
CR is the conversion rate of wet weight to carbon; TE is the trophic transfer efficiency; TL
i is the trophic level of species
i and
n is the number of species caught. We applied a 9:1 ratio for CR and 10% for TE [
26]. Species-specific trophic levels documented in this analysis are those currently used by the
Sea Around Us Project team for their analysis of fisheries impacts on marine ecosystems and express where fish and other organisms tend to operate in their respective food web [
27].
In order to estimate the TL of fish or invertebrates, we must consider both their diet composition, and the TL of their food item(s). The TL of a given group of animals is therefore estimated from:
where the mean is weighted by the contribution of the different food items. According to a convention established in the 1960s by the International Biological Program, primary producers and detritus have a definitional TL of 1.
Annual catch data for each species
Ci were taken from the Italian database
Check up Ittico 2013 published by ISMEA (2013) (Istituto di Servizi per il Mercato Agricolo Alimentare) [
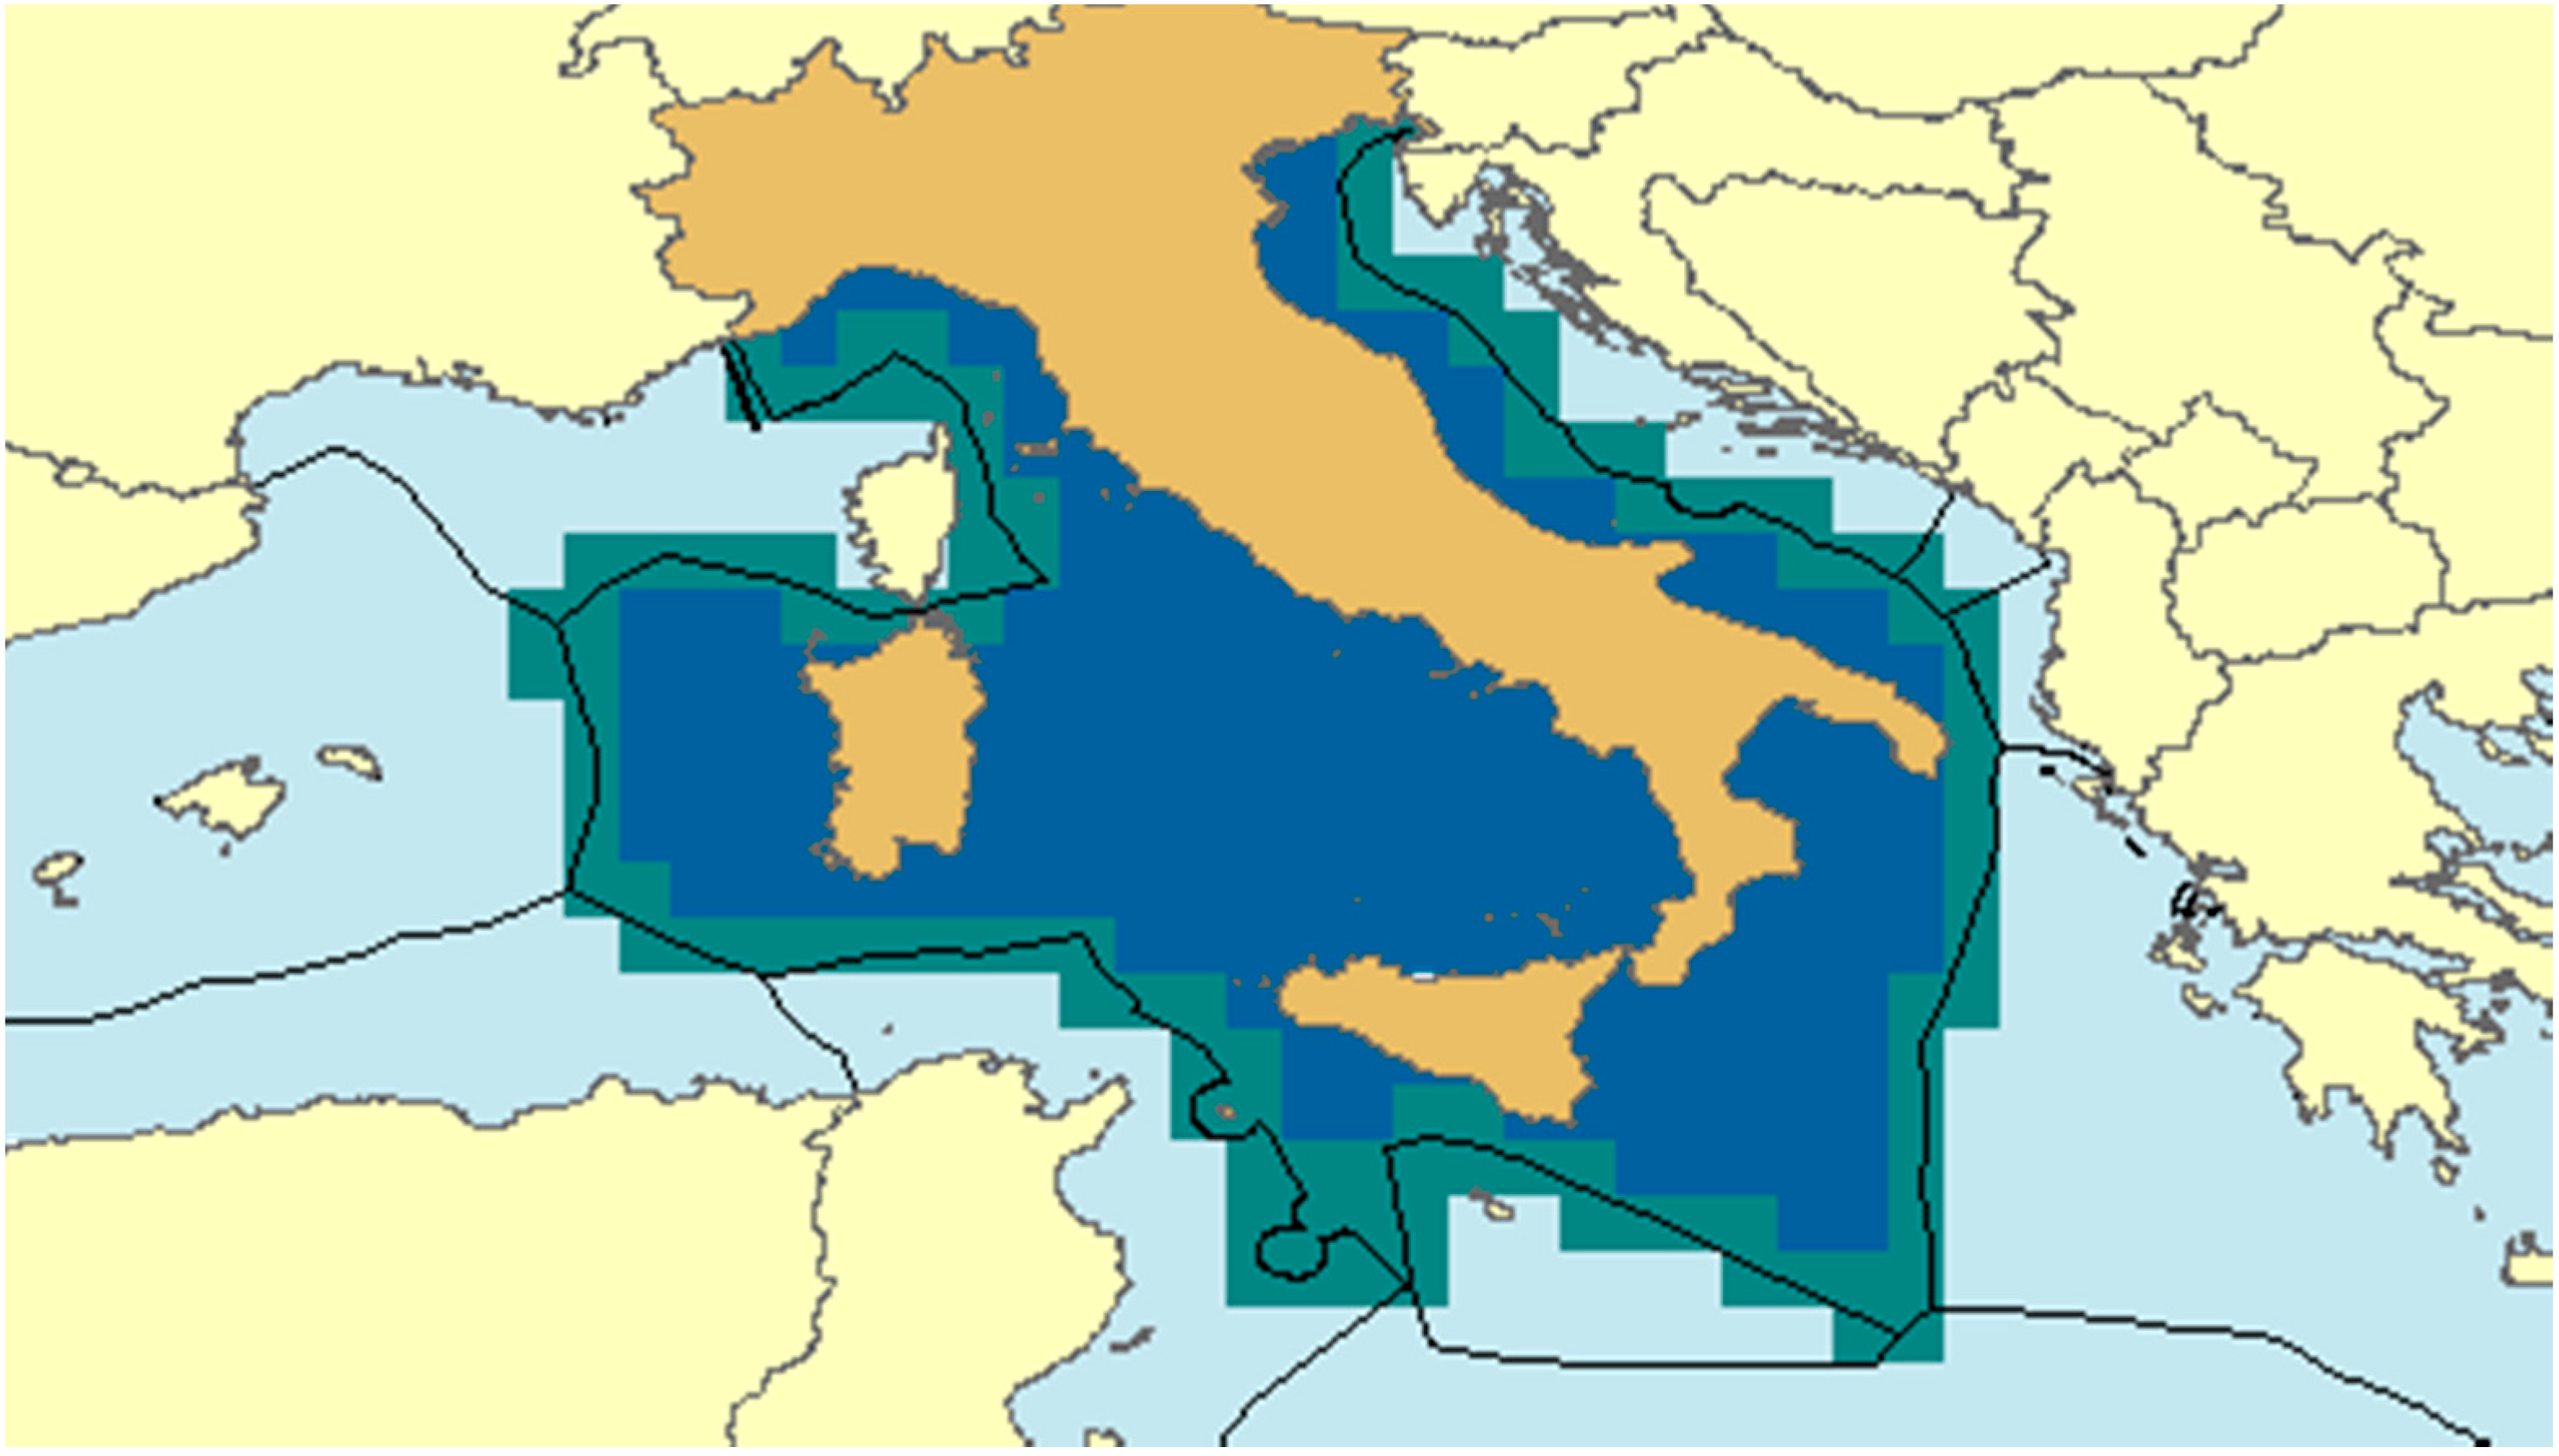
12] and observed in the Italian Economic Exclusive Zone (EEZ) (
Figure 1) [
28,
29].
In
Table 2 the analyzed species are indicated with their correspondent scientific name, while annual catch data per species is expressed in terms of metric tons and in terms of percentage over the total catches.
The PPR of a given catch data taken at a given EEZ in terms of
, as defined in this study, also allows us to express the level of marine “exploitation” as a fraction or percent of the primary production observed at a local level. In fact, the standardization of fisheries catches in PPR enables footprints of various fisheries management models to be compared to the primary productivity of marine ecosystem on which they rest [
30].
Figure 1.
Economic exclusive zone of Italy.
Figure 1.
Economic exclusive zone of Italy.
Source: Sea Around US project [
27].
Table 2.
Metric tons vs. PPR metric tons per specific-species caught in Italian EEZ.
Table 2.
Metric tons vs. PPR metric tons per specific-species caught in Italian EEZ.
| Species | Trophic-Level | Catches |
|---|
| Metric tons | % | PPR |
|---|
| Engraulis encrasicolus | 3.11 | 42,800 | 21.85 | 612,634 |
| Tapes decussatus | 2.27 | 20,028 | 10.23 | 41,438 |
| Sardina pilchardus | 3.10 | 19,947 | 10.19 | 279,020 |
| Merluccius merluccius | 4.42 | 9393 | 4.80 | 2,745,123 |
| Parapenaeus longirostris | 3.31 | 8267 | 4.22 | 187,545 |
| Mullus barbatus barbatus | 3.33 | 5861 | 2.99 | 139,229 |
| Mugil cephalus | 2.13 | 4874 | 2.49 | 7305 |
| Squilla mantis | 2.60 | 4751 | 2.43 | 21,016 |
| Sepia officinalis | 3.55 | 4172 | 2.13 | 164,476 |
| Xiphias gladius | 4.49 | 4018 | 2.05 | 1,379,645 |
| Trachurus | 3.69 | 3032 | 1.55 | 165,001 |
| Octopus vulgaris | 3.55 | 3010 | 1.54 | 118,665 |
| Loligo | 3.99 | 2593 | 1.32 | 281,553 |
| Aristeus antennatus | 3.29 | 2377 | 1.21 | 51,498 |
| Musky Eledone | 3.67 | 2217 | 1.13 | 115,219 |
| Boops boops | 3.00 | 2137 | 1.09 | 23,744 |
| Nephros norvegicus | 2.88 | 2051 | 1.05 | 17,287 |
| White Eledone | 3.67 | 1820 | 0.93 | 94,586 |
| Mullus surmuletus | 3.35 | 1641 | 0.84 | 40,819 |
| Others | 3.34 | 50,850 | 25.97 | 1,227,130 |
| Total | | 195,839 | 100.00 | 7,712,933 |
Our analysis, in particular, expresses the Marine Ecological Footprint as the ratio between the total PPR in metric ton of Italian Mediterranean catches in 2012 and Primary Production (PP) of Italian EEZ, highlighting the Italian fisheries exploitation level of the marine ecosystem, as in the equation:
Primary production (PP) estimates, expressed in
, have been extracted from the
Sea Around Us database, derived using the model described by Platt and Sathyendranath, whose parameterization varies between biomes and biogeochemical provinces [
31] and were processed at the Inland and Marine Waters Unit (IMW), Institute for Environment & Sustainability, EU Joint Research Center (JRC), Ispra, Italy.
Note that neither the catch data extracted from ISMEA [
12] nor the Primary Production values extracted from the Sea Around US project database distinguish between territorial waters and the EEZ, tending to include territorial waters into EEZ areas [
27].
Using PPR equation and PP estimates, we evaluated the proportion of primary production exploited by fisheries in Italian EEZ for 2012, assessing the value of MEF based on threshold levels and positioning Italy in the theoretical framework proposed by Tudela to evaluate its ecosystem overfishing level [
32].
4. Results and Discussion
Primary production required is a product of the carbon-converted catch mass and the conversion ratio for the trophic level of the taxa involved. This means that the PPR needed to produce one metric ton of tuna is significantly greater than that of a metric ton of sardines, since tuna are much higher up on the food chain.
The PPR, expressed in metric tons, linked to the Italian catches in 2012 disaggregated by species is showed in
Table 2.
Basing the catch on PPR rather than metric tons, provides a way to measure the fishing down food webs phenomenon [
33], which is ubiquitous and much stronger than previously believed [
34].
This effect, in certain exploitational and environmental conditions, can be combined with a trophic cascade, which occurs when the abundance of a lower trophic level increases due to the removal of predators at the higher trophic level and propagates through various trophic levels.
Andersen and Pedersen confirm that fishing may determine a propagation of “
trophic cascade” effects, both from top to bottom, and
vice versa (“
top-down” or “
bottom-up”), depending on a combination of changes that result from predation mortality or food limitation [
35].
For some time, ecologists have debated on what controlled the processes determining the production of biomass in the sea, that is, if the primary control was exercised by the availability of forage resources (bottom-up) or by predators (top-down). For many authors, the top-down control mechanism proved to be explanatory to describe the structure and functioning of lakes and marine ecosystems with an influence on more than one trophic level in the “trophic cascade” process.
On the other hand, other authors, as well as the present study, state that the key is the availability of forage resources and primary production (PP), able to propagate widely in the system, affecting all trophic levels and population dynamics.
The condition of ecosystem overfishing occurs when the composition per species and the dominance are significantly modified by fishing and when the trophic level decreases (that is, when there is a reduction of the large and long-lived species—predators—and therefore, an increase in the small and short-life species that occupy the lower trophic levels occurs).
To place PPR values in perspective we need to compare them with the underlying productivity (PP) available within the fished area.
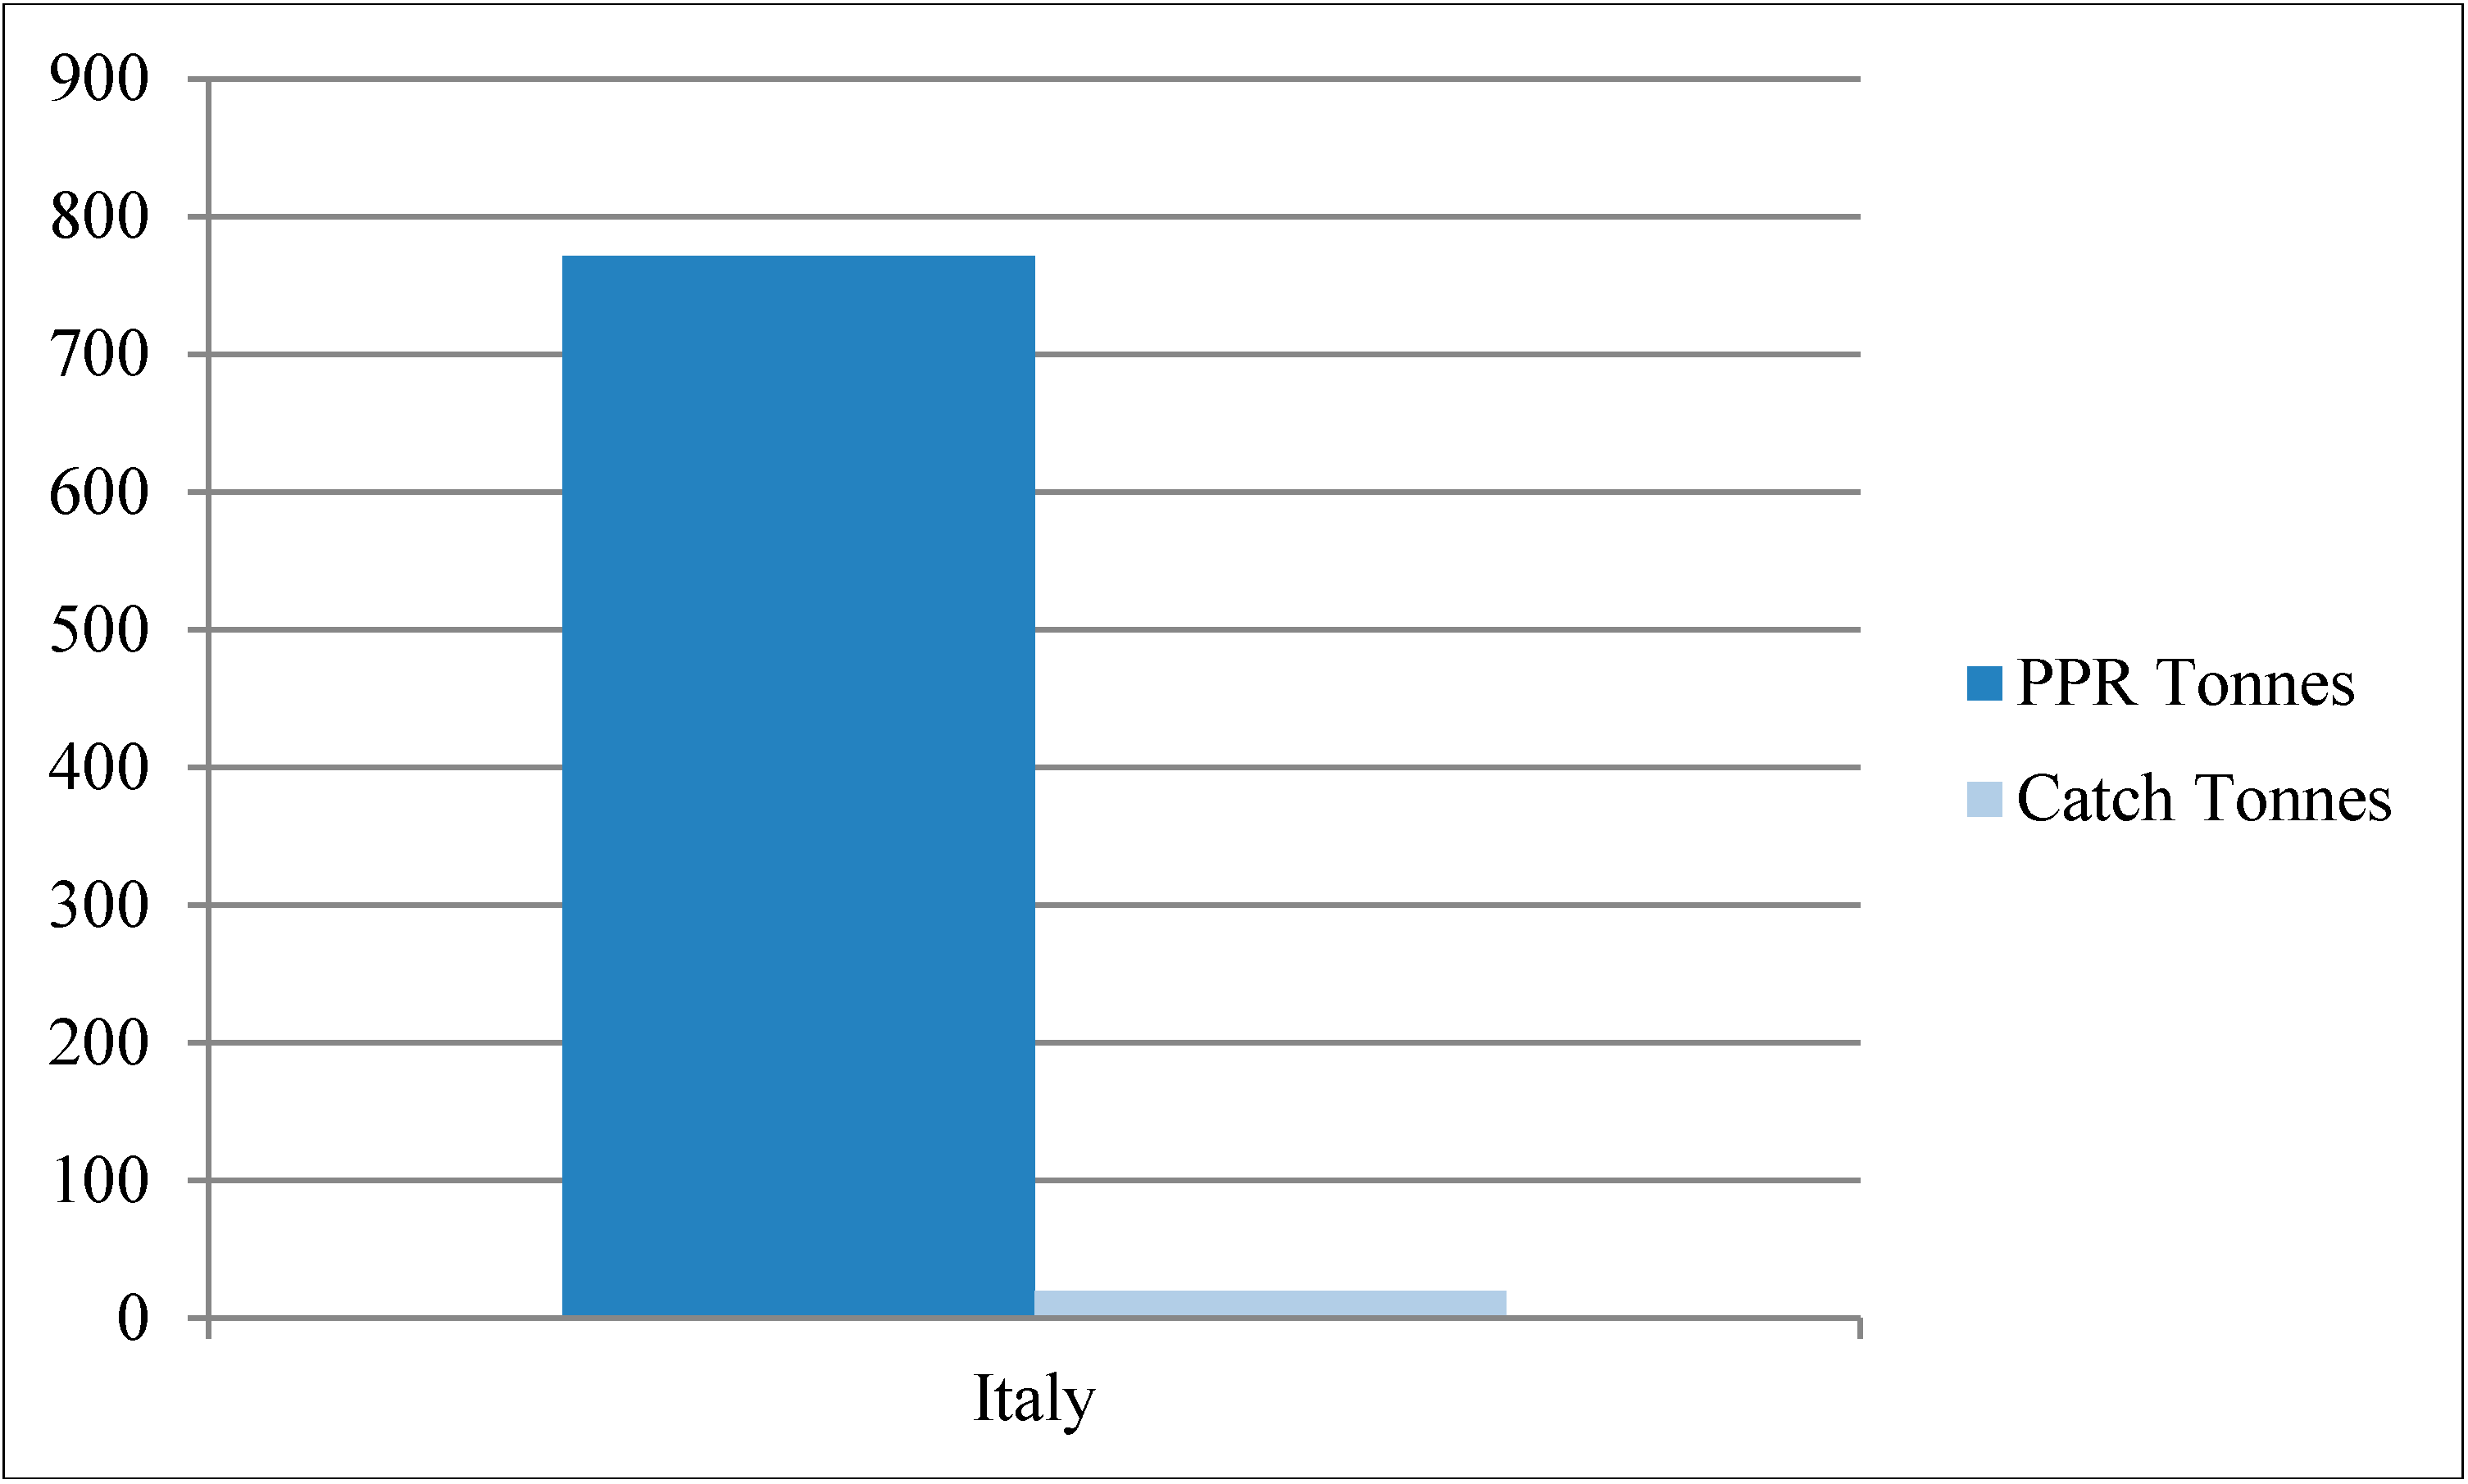
The PPR to sustain the Italian catches of 195,839 metric tons in the 2012 amounts to 7,712,933
. Therefore, our study shows that Italy, with a level of 195,839 catch metric tons in 2012, requires 7,712,933 metric tons of PP (
Figure 2), highlighting that our fisheries are more concentrated in medium trophic level species with an weighted average Trophic Level of 315.
Figure 2.
Catches vs. Primary Production Required expressed in ten thousand metric tons.
Figure 2.
Catches vs. Primary Production Required expressed in ten thousand metric tons.
The estimation of annual average PP data for the Italian EEZ was extracted by the Sea Around Us database and had a value of 452 .
Multiplying this data by the surface area of Italian EEZ amounted to 537,932 km2, and multiplying by 365, and dividing it by 1000, we obtained the total PP of Italian EEZ expressed in metric tons of carbon per year, amounting to 88,748,021.36 .
PPR compared to the available PP of the Italian EEZ gives an important indication of the exploitation level of Italian marine ecosystems and launches a debate about the future perspective of Italian fisheries management.
The Marine Ecological Footprint (MEF) of Italian Mediterranean fisheries, expressed as the ratio between the PPR and the PP, amounts to 0.09. It means that Italian EEZ marine ecosystems are exploited at a level in which the PPR of fisheries is 9% of the PP.
The primary production required to sustain landings in the Mediterranean Sea Large Marine Ecosystem (LME) reached in 1994, 20% of the observed primary production, but has since declined to 15% in 2008. Italy has the largest footprint in the LME of Mediterranean Sea contributing today with its 9%, leaving the residual footprint equally distributed among the other Countries [
36].
Swartz
et al. [
30] suggest that relatively low thresholds (between 10% and 30%) of PPR are sufficient to induce, and thus also track, expansion of fisheries.
These thresholds are more significant than they seem, because the ecological impact of fishing depends on how much of the local primary production is available to sustain seafood production. For instance, only 41% of coastal phytoplankton is consumed by herbivores and moves up the food chain [
37].
Therefore, the value of MEF, expressed as %PPR, presented in this study, is only a fraction of the actual proportion of primary production that is available for seafood production.
With the aim of developing ecosystem-based reference functions suitable for fisheries management Tudela
et al. [
32] proposed a quantitative index consisting of the difference between the percentage of primary production required to sustain fisheries and the average trophic level of catches (TL
c) which can be expressed:
For Italy, this index amounts to 5.85, showing a sustainable level of catches. In fact, according to Tudela
et al. [
38], sustainably fished ecosystems are limited by values of TL
c ranging from 3.0 to 4.1, and of MEF (%PPR) ranging from 0.3 to 14.7.
The positioning of Italian fisheries shows a level of sustainability near the threshold value. Therefore next scientific studies should be directed at identifying trends in order to track a reliable scenario of the marine ecosystem, which can stimulate appropriate management measures to reduce human impact.


