Article

Environmental Sustainability and Economic Benefits of Dairy Farm Biogas Energy Production: A Case Study in Umbria

Department of Agricultural, Food and Environmental Sciences, University of Perugia, 06100 Perugia, Italy
*
Author to whom correspondence should be addressed.
Sustainability 2014, 6(10), 6696-6713; https://doi.org/10.3390/su6106696
Submission received: 30 June 2014 / Revised: 22 August 2014 / Accepted: 29 August 2014 / Published: 29 September 2014

Abstract

:
Accelerating demand to reduce the environmental impact of fossil fuels has been driving widespread attention to renewable fuels, such as biogas. In fact, in the last decade numerous policy guidelines and laws regarding energy, the environment and agriculture have been issued to encourage the use of animal sewage as a raw material for the production of biogas. The production of energy from biogas in a dairy farm can provide a good opportunity for sustainable rural development, augmenting the farm’s income from traditional sources and helping to reduce the overall environmental impact of the energy sector. This paper investigates the trade-off between the environmental and economic benefits of an agro-energy farm in the Umbria region of Italy that employs livestock sewage and manure, dedicated energy crops (corn and triticale silage) and olive waste. The environmental analysis was performed using the LCA methodology, while the economic investigation was carried out by reconstructing the economic balance of the agro-energetic supply chain based on the budgets of each activity performed. The LCA results show, on the one hand, the predominant weight of producing dedicated crops compared to all other processes in the supply chain and, on the other hand, a significant reduction in environmental impact compared to that caused by energy production from fossil fuels. Economic analysis revealed that the results depend significantly on what rate per kWh the government incentives guarantee to agricultural producers of renewable energy.

1. Introduction

In the European Union, the great interest in the field of bioenergy arises from the need to increase the use of renewable energy sources in order to achieve a number of objectives: (i) reduced reliance on fossil fuels by using a diversified energy supply; (ii) environmental protection by reducing emissions responsible for climate change; (iii) development of the agro-forestry sector by proposing new sources of income; and (iv) efficient disposal of waste materials [1]. In recent years, modern bioenergy applications have become increasingly important to countries as a low-carbon, distributed, renewable component of national energy sources [2].
Over the years, financial incentives in many European countries have encouraged farmers to produce heat and/or electricity from biogas, exploiting a “multifunctional” concept by which farmers not only carry on the traditional farm activities, cultivating crops and raising livestock, but also produce biogas energy, potentially augmenting their earnings and generating environmental benefits for society as a whole.
Highly efficient anaerobic processing of organic matrices, such as manure, agricultural by-products, pruning and shoot residuals, and crops especially raised for the purpose, such as grass and corn, produces not only biogas, but also digestate, the material remaining after the anaerobic digestion, which has physical and chemical characteristics similar to manure compost [3].
The anaerobic digestion of animal manure and slurries is thought to improve their quality as fertilizer and reduces odors and pathogens [4], but probably the most important environmental benefits of agricultural biogas utilization accrue from the reduction in CH4 emissions from the natural decomposition of these organic substances [5] and, of course, from the overall reduction in CO2 emissions by using alternative energy sources to conventional fossil fuels.
However, these benefits are not easily quantified. Obtaining renewable energy is particularly complex, involving different types of biomass raw materials, including organic waste from the food industry, municipal organic waste, agricultural harvesting residues, manure and crops, as well as a number of chemical, physical and thermal processes for digestion technologies [6]. Similarly complex are the decisions about the best uses for the digestate and the biogas produced [7].
Because of this complexity, there are many challenges to conducting energy and environmental systems analysis of biogas production systems, which identifies and quantifies all energy and material input and outputs in a product’s life cycle. Nonetheless, all stakeholders involved agree that the study and analysis of new methodologies and empirical case studies is strategic for optimizing production of this form of renewable energy.
Even as this research moves forwards, several caveats remain to be resolved. There are still open questions about whether biomass-based energy generation is a good environmental choice in terms of the impact on greenhouse gas emissions and whether there are negative consequences of using agricultural land to raise dedicated crops for biogas production rather than to produce food [8]. This latter point also raises ethical questions about competition between energy and food production [8].
On a practical and, perhaps, less emotional level, there are also economic and organizational issues to resolve regarding the cost-effectiveness of using residual biomasses for energy production [9].
The number of biogas plants on livestock farms in Italy rose from 56 to 521 in the ten years from 2001 to 2011 [10], with a particularly striking leap between 2010 and 2011 prompted by government incentives for renewable energy that gave priority subsidies to the agricultural sector and rewarded greater use of by-products from livestock raising or food farming. Most of these plants (58%) are based on the co-digestion of manure, energy crops and by-products, while only a small proportion (13%) use energy crops and/or agro-industrial by-products.
Biogas is arguably a more versatile renewable energy source than wind, solar and other energies, primarily because it is not limited by the geographical area and season [11]. It can be used directly for heating and electricity generation, and the digestate left over from the process provides a good alternative to energy-intensive mineral fertilization, reducing greenhouse gas emissions [12].
This paper offers a case study of biogas energy production at a dairy farm in Italy’s Umbria region, evaluating whether it is possible to increase the farm’s income and to contribute to reducing the environmental impact of energy production and use. The environmental analysis was performed using the LCA methodology, while the economic investigation was carried out by reconstructing the balance sheet of the agro-energetic supply chain based on the budgets for each activity performed.

Life Cycle Assessment (LCA) Applied to Biogas Plants

Proponents of biogas argue that the CO2-neutral nature of fuels produced from energy crops and manure mean minimal negative impact on the environment, but others claim that this benefit is not always as significant as expected [13], questioning the sustainability of these bioenergy pathways [14,15,16], because the conversion of biomass to bioenergy has input and output flows that may affect its overall environmental performance [2]. To obtain a concrete analysis of the sustainability of bioenergy chains, researchers have increasingly made use of life cycle assessment (LCA), an analytical tool able to capture complexity and inter-dependencies and, thus, providing a comprehensive and objective picture of the situation [17].
Though LCA of bioenergy chains can be useful for evaluating the whole system from “cradle to grave”, as observed by Cherubini and Strømman [2] and by Muench and Guenther [18], there is the risk that methodological assumptions might distort the results or render comparisons nearly impossible. Moreover, according to the latter [18], many LCAs do not fulfill the ISO 14040-14044 guidance required. In fact the method entails some intrinsic uncertainties linked to the exogenous data used to model the background system (normally from commercial databases) and to the approach used to model the system and the unavoidable assumptions that underlie it [19].
Many studies in the literature have examined bioenergy production and connected environmental sustainability, using the LCA methodology. They define the fundamental parameters for evaluating the specific inventories of the agricultural activity, energetic production, transport and management of residuals, apply these parameters to specific case studies and compare energetic production from renewable systems with that from conventional ones [17].
Several studies have sought to include the entire bioenergy chain and offer up-to-date and precise knowledge about both the use of LCA methodology and the progress in this field.
In several Polsch et al. studies [11,20,21], the authors conducted an attributional LCA of multiple biogas production and utilization pathways against specific base scenarios. Different approaches were used to quantify the effects of a number of parameters, including: (i) single feedstock digestion; (ii) co-digestion of multiple feedstocks, for example combining energy crops with manure in small (<500 kWel) and large-scale (>500 kWel) biogas plants; (iii) different biogas utilization pathways; and (iv) digestate management options.
In this complete and detailed work, the authors underline that in order to minimize the environmental damage associated with feedstock type in all impact categories considered and simultaneously maintain a positive energy balance, co-digestion of residues from agriculture (cattle manure and straw) and the food industry residues with municipal solid waste (MSW) is most appropriate for both small and large-scale biogas plants. They judged that co-digestion of waste and residues accounted for just 1% of the estimated impacts on agricultural land occupation, compared to the co-digestion of feedstock predominantly from energy crops, such as corn silage, grass silage and whole wheat plant silage; they also found that such co-digestion reduced the climate change impacts by almost 30%.
In another attributional LCA study, Jury et al. [13] compared the climate change impact of biomethane production and injection into the grid against natural gas importation and found that the 30%–40% (500a time horizon) or 10%–20% (100a) lower impact of the biomethane system depended mainly on the biogas yield, the amount of readily available nitrogen in the digestate and the type of agricultural practices.
Blengini et al. [17] noted the lack of LCA studies of bioenergy systems in Italy and proposed a methodology that includes the whole bioenergy chain, with particular attention to the end-of-life (EOL) of digestate, which had often been disregarded or underestimated in previous LCAs.
Based on their results, they concluded that the potential in terms of greenhouse gas (GHG) savings depends on several factors and is heavily influenced by the reference non-renewable energy to be substituted. How the digestate is finally used influences the overall picture of GHG emissions from bioenergy. This also is related to the overall nitrogen and sulfur emissions from biogas production and their impact on the ecosystem [17].
In sum, the common conclusion of these studies is that the LCA methodology must carefully consider all life cycle steps and subsystems in evaluating the environmental sustainability of bioenergy chains. In fact, there is no single dominating item or aspect, but rather, several of them play an important role in the overall sustainability [17]. Furthermore, Polsch et al. [21] highlight that judicious selection of feedstock resources and biogas conversion and that the utilization methods are crucial for sustainable biogas distribution.
Furthermore, according to the references, it appears that the various forms of bioenergy do not automatically qualify as effective forms of sustainable energy, as there can be significant differences in their environmental impact.

2. Method and Data

The environmental analysis was performed using the LCA methodology, while the economic investigation was carried out by reconstructing the economic balance of the agro-energy supply chain based on the budgets of each activity performed.
Life cycle assessment is broadly recognized as the methodology for assessing the environmental impact of a product or a process [22,23]. LCA covers the whole life cycle of the product from “cradle to grave”, as it were, encompassing the extraction and processing of raw materials, production, transportation and distribution of the product, its use, reuse and upkeep, recycling and the final disposal of the product after use [24].
This analytical tool helps us understand how the life cycle of a product is related to environmental sustainability in terms of air, water and soil pollution and the consumption of resources, such as raw materials, energy, water and land [25].
In this case study, the LCA was performed according to the ISO14040 and 14044 standards [22,26] using the SimaPro 7.3.3. software and Ecoinvent database v2.0 [27].

2.1. Goal and Scope of the Research

The goal of this study was to analyze the environmental sustainability of the agro-energy chain in a dairy farm that produces energy from biogas, comparing its environmental effects with those caused by energy production from fossil fuels, and to investigate the trade-off between the environmental sustainability and economic benefits for the farm.

2.1.1. Description and Characteristics of the Biogas Plant and Dairy Farm

The biogas plant based on anaerobic digestion that uses 620 KWel of power is located in the Pietrarossa area of the district of Trevi in the province of Perugia.
The “Agricola Pietrarossa” firm owns the plant, which is located on the property of the “Agricola Zootecnica” Cooperative, which also manages the structure.
Annually, the plant is fed by approximately 19,400 tons of a biomass mixture of cattle slurry, also called cow sewage (manure in liquid form with storm water) (44%), cattle manure (6%), corn silage (41%), triticale silage (8%) and solid residues from olive oil production (1%) (Table 1).
Table 1. Raw materials and their origin for digestor feeding, year 2012.
BiomassQuantity (t)Source
Cow sewage8600From farm
Cow manure1200From farm
Corn silage5530From farm
Triticale silage1500From farm
Corn silage2370From other providers
Olive Residues200From other providers
Total19,400
Source: Farm s.r.l. Agrienergia Pietrarossa Trevi Perugia.
The farm provides 87% of the biomass, while other sources furnish the remaining 13%. In particular, manure and sewage come from the dairy farm of Italian Friesian dairy cows raised by the Agricola Zootecnica Cooperative in a cowshed near the biogas plant. The stock includes 520 cows, 287 of which are lactating. The maize to produce maize silage is cultivated on a number of farms. The “Agrienergia Pietrarossa” dedicates 78 hectares to maize production, the Agricola Zootecnica Cooperative 44 hectares (in both cases the fields are about 6 kilometers from the farm) and nearby farms 53 hectares. The triticale for triticale silage comes from an area of 60 hectares also managed by “Agrienergia Pietrarossa”. The olive residues arrive from oil mills in the surrounding area.
The cowshed is equipped with manure removal systems based on mechanical scrapers. In this way, the cattle sewage is continuously removed by scrapers and accumulated in the storage tanks, from which it is then pumped into the main digester. The manure, instead, is rarely removed by mechanical means; it is accumulated in a dunghill and subsequently dumped into the system. The silage crop cycles are entirely carried out by the two farms using their farms machinery. After the harvest, corn and triticale outputs are chopped up and then transported to silos located near the digesters and stored there before being fed into the digester for the anaerobic digestion process. Close to the biogas plant is a composting plant where the digestate from the anaerobic fermentation undergoes aerobic fermentation.

2.1.2. Functional Unit and Allocation

The functional unit of the analysis is energy, quantified as electricity and heat, and measured in kWh. In this study, pollutant emissions are quantified in CO2 eq per kWh of energy produced. The definition of the functional unit is essential for comparing the production of energy from the biogas plant with the production of energy from fossil fuels.
Energy is the main product where all the impacts are allocated.

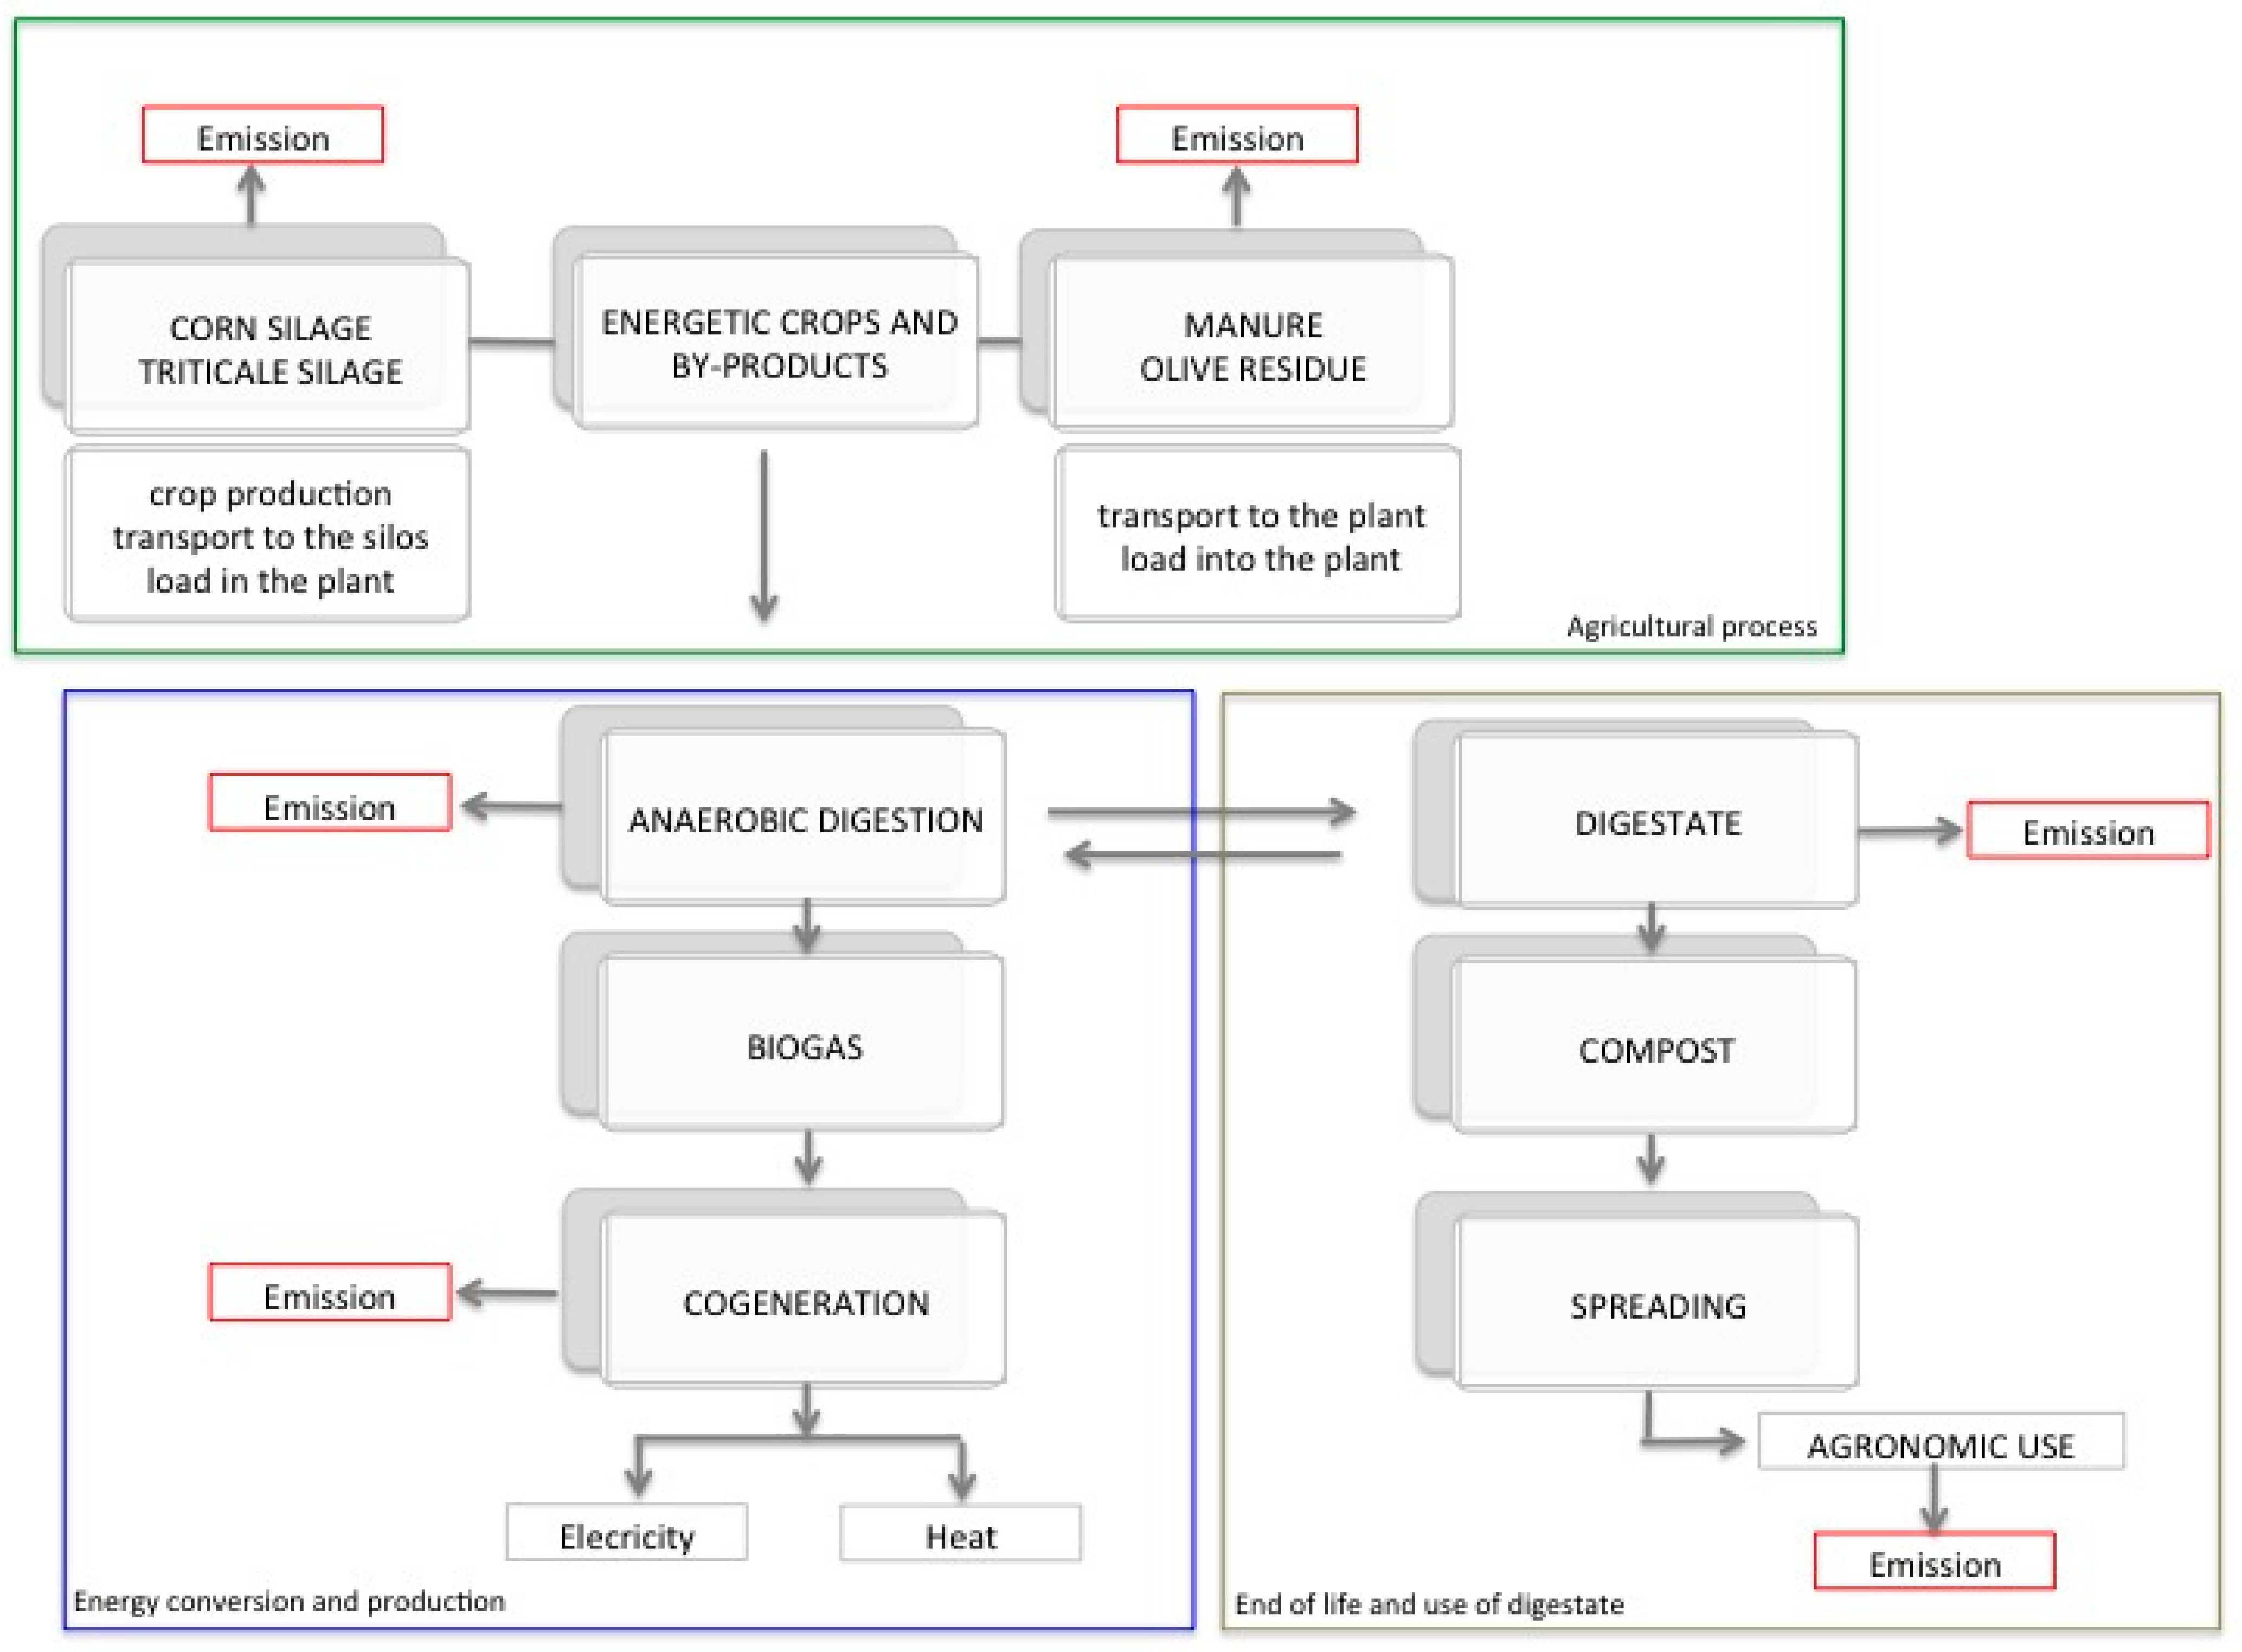
2.1.3. System Boundaries

The system boundaries of the agro-energy chain investigated are shown in Figure 1. The study covers the life cycle of the agro-energy chain “from cradle to grave”, which can be divided into three main parts:
(1)
Agricultural process: (i) production processes for corn and triticale silage; (ii) manure handling systems; (iii) transport of corn silage and solid olive residues from sources outside the farm; (iv) feeding materials into the digester;
(2)
Energy conversion: (i) anaerobic digestion (AD); (ii) biogas production; (iii) co-generation (production of electricity and heat);
(3)
End-of-life of digestate: (i) storage; (ii) spreading; (iii) agronomic use.
The study does not examine the processes related to animal husbandry, as they are considered to be related to milk and meat production, while manure is considered a by-product (or waste product) of the husbandry phase.
Figure 1. System boundary of the agro-energy chain.
Sustainability 06 06696 g001
Source: our elaboration from Blengini et al. [17].

2.2. Life Cycle Inventory

The data were collected from the farms for a period of one year, in 2012. The SimaPro 7.3.3 software [27] supplied the database on greenhouse gas emissions of raw materials, fuel, energy, transport and production processes. The Eco-indicator 99 (E) v2.08 method [27] and the Report n.15 in SimaPro 7.3.3 [27] were used to quantify the emissions of the main greenhouse gases (carbon dioxide, methane and nitrous oxide) in the air, water and soil. Table 2 summarizes all of the process examined by the life cycle inventory (LCI).
Table 2. Process examined by the life cycle inventory (LCI).
Crops and By-ProductsOperationMachineryOperating Rate (h ha−1)Diesel Consumption (kg ha−1)Diesel Consumption (kg km−1)Diesel Consumption (kg h−1)Material (kg ha−1)Water Consumption (mc ha−1)Water Pump Consumption (kW h ha−1)
Maize silagePloughingTractor (157 kW) + ploughshare4.516.6
HarrowingTractor (157 kW) + disc harrow1.514.94
DressingTractor (60 kW) + fertilizer spreader14.98 Ammonium phosphate200
Sulfate ammonium400
DressingTractor (60 kW) + tank35.5 Cow sewage9000
Tractor (60 kW) + manure spreader34.46 Cow manure6500
SowingTractor (60 kW) + sower18.3 Seeds24
Weed controlTractor (60 kW) + field sprayer18.3 Pendimethalin3
Crop protectionTractor (60 kW) + field sprayerCombine with sowingCombine with sowing Pyrethroids8
Sprinkler irrigation 1000
HarvestingCombine harvester1.541.5
Transport to the silosTractor (60 kW) + tractor trailer 0.23
Feeding material into the digesterTelescopic handler
Triticale silagePloughingTractor (157 kW) + ploughshare314.94
HarrowingTractor (157 kW) + disc harrow112.45
SowingTractor (60 kW) + sower18.3 Seeds200
HarvestingCombine harvester141.5
Transport to the silosTractor (60 kW) + tractor trailer 0.25
Feeding material into the digesterTelescopic handler
Cow manureTransport to the plantTractor (60 kW) + tractor trailer 0.25
Feeding material into the digesterFront loader
Olive residuesTransport to the plantTank truck 0.33
Feeding material into the digesterFront loader
2.49

2.2.1. Agricultural Process

The agricultural process includes: (i) maize silage production; (ii) triticale silage production; and (iii) the supply of manure and solid olive residues. For maize production, the study analyzed all of the inputs (raw materials and infrastructure) for plowing, harrowing, fertilization, weeding, plant protection (pesticides, herbicides), irrigation, harvest and transport. Fertilization and plant protection were not evaluated separately for triticale, since it took advantage of the maize agricultural process.
For manure and solid olive residues, we considered only their transport to the plant.
Data about diesel and lubrification oil consumption and their prices were based respectively on information provided about each model of farm machine and the average prices of diesel and oil in 2012.

2.2.2. Energy Production

The anaerobic digestion process takes place in two different phases and in separated fermenters (digesters). In the first phase, the organic substance goes through the process of hydrolysis and acetogenesis in a mesophilic environment; in the second one, the methanogenesis process to produce biogas takes place in a thermophilic environment. Between the two stages, there is a sanitation and thermal disintegration stage. Two power cogeneration units, called combined heat and power (CHP) plants, which run on 620 kWel of power, produce electricity and heat simultaneously.
Hence, the system consists of two main fermenters: the first power cogeneration unit that runs on 250 KWel and the second one that runs on 370 kWel.
The system operates 350 days a year (8400 h/year) producing annually 4,700,000 kWhe of electricity, 5,200,000 kWht of heat and about 16,200 m3 of digestate.
The national grid receives 90% of the electricity produced by the plant. The other 10% is consumed by the system. The thermal energy produced by the plant is used in part for heating the fermenters (30%) and for most of the composting (70%).

2.2.3. End-of-Life of the Digestate

The digestate undergoes a mechanical separation of solids from liquids, so that the solid part can be injected and mixed with the lignocellulosic substrate present in the compost tank. The liquid part, biologically stabilized, is used as a fertilizer in two ways. It can be applied by drip fertigation or, because of its lower viscosity, it can be injected into the ground, a process that allows faster infiltration and prevents ammonia emissions from volatilization.
In the composting system, the digestate is continuously mixed and oxygenated for 3–4 months to reduce the moisture content and to form stable humic-like substances, yielding a form of compost ready for use as a fertilizer.

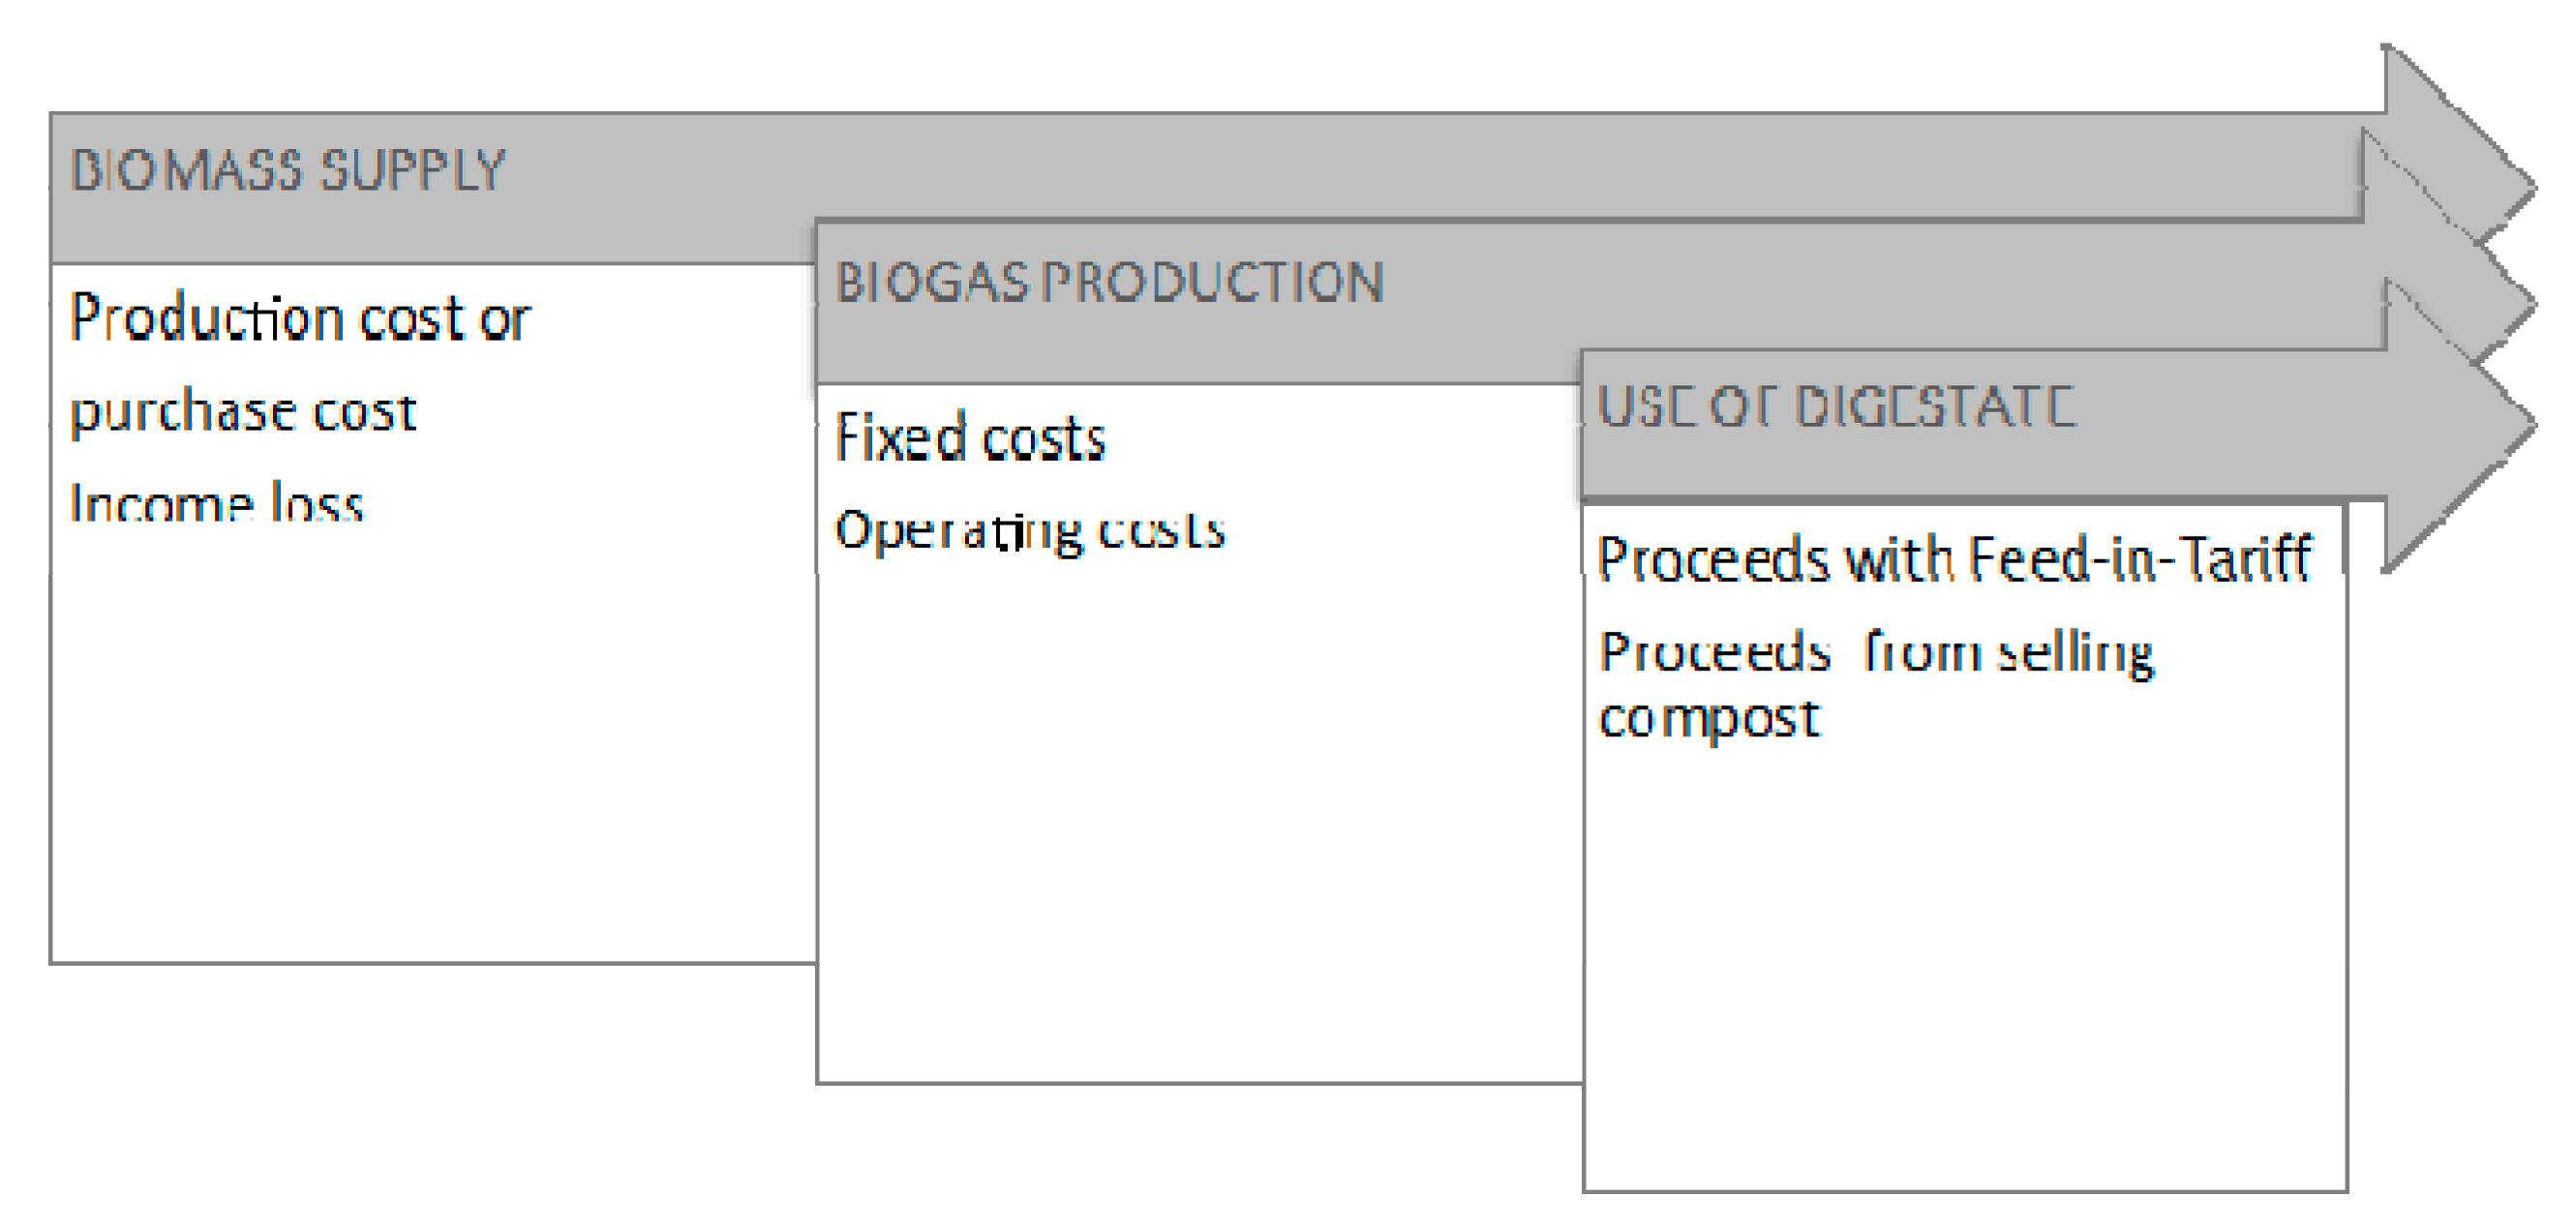
2.3. Economic Analysis

To assess the economic viability, we analyzed the balance sheet for biomass supply, biogas production and the use of the digestate, and we estimated the expense items, that is, the costs and loss of income, as well as the active items, namely the proceeds from sale and government incentives. In particular, the economic values examined for the biomass supply process were production cost, purchase cost and loss of income estimated according to the market value of corn silage, triticale silage and cow manure. The values analyzed for the biogas production process were fixed costs associated with the investment, plant operating costs and earnings from feed-in-tariff proceeds, or in other words, the sale of electricity at special government incentive prices. The values studied for the use of the digestate process were the proceeds from compost sale (Figure 2).
Figure 2. Economic analysis.
Sustainability 06 06696 g002

3. Results

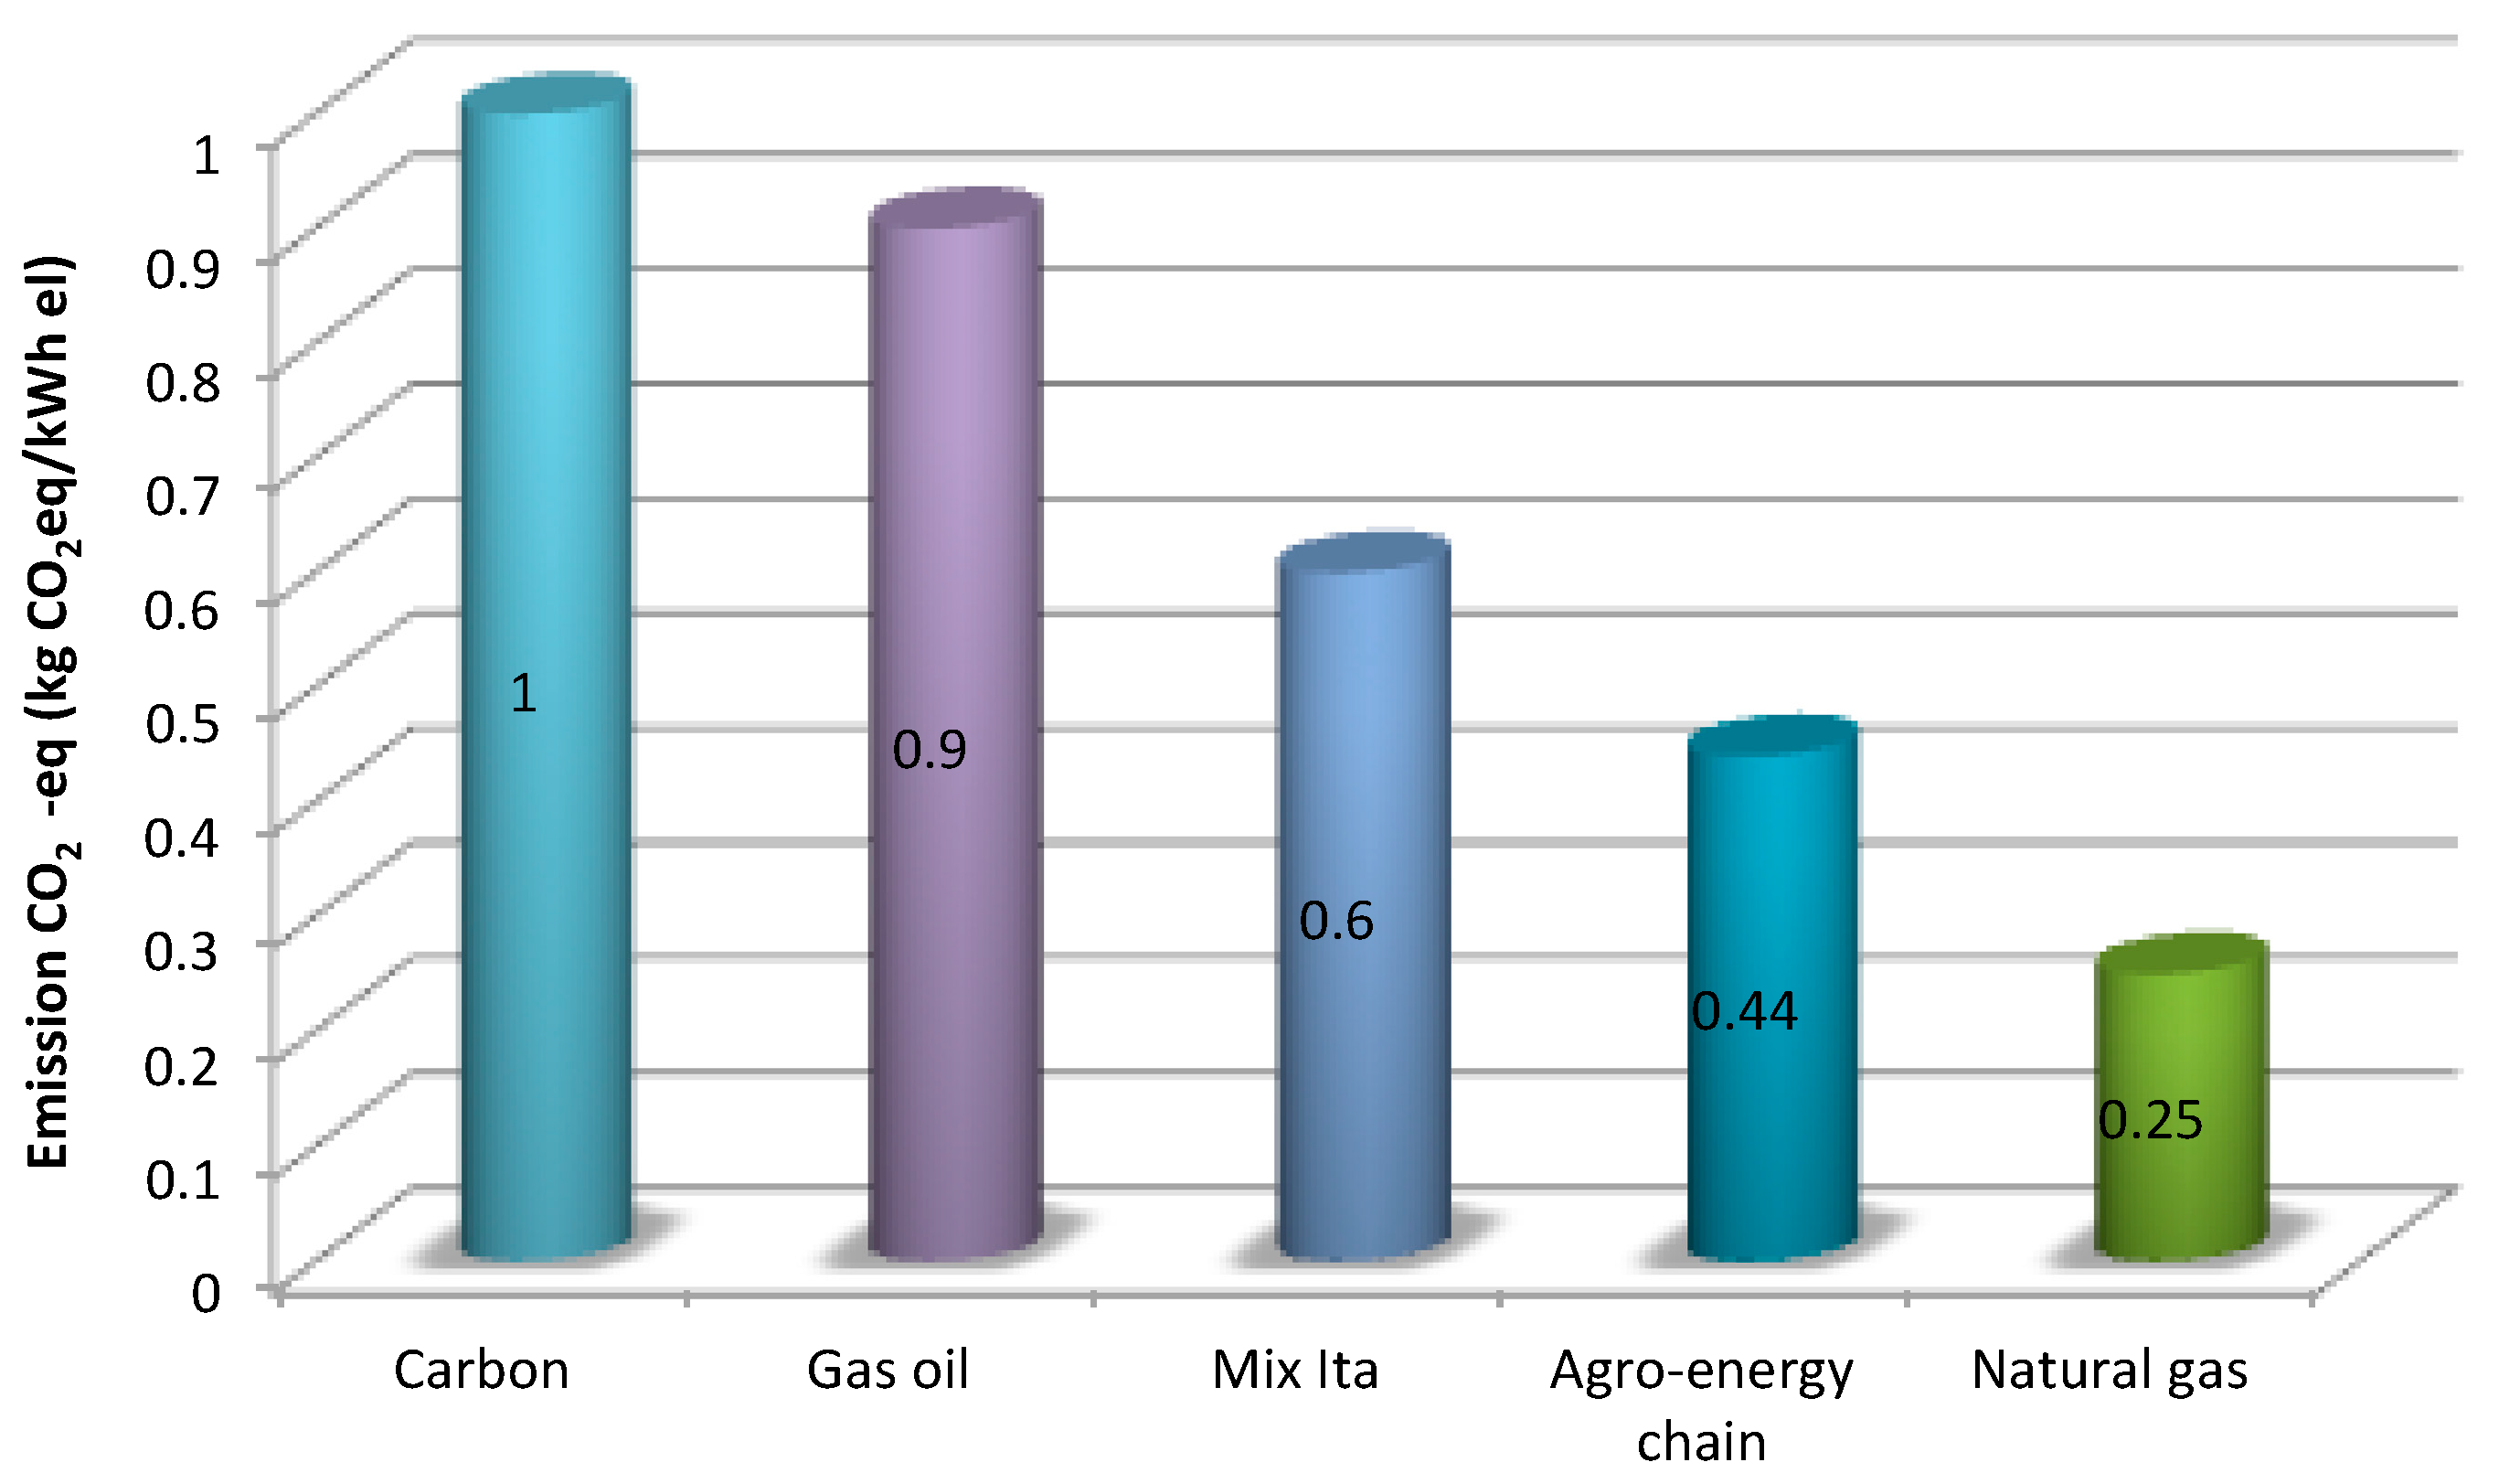
3.1. Environmental Impact of the Agro-Energetic Chain

The use of Ecoindicator 99 (E) v2.08 [27] made it possible to estimate the greenhouse gas emissions (carbon dioxide CO2, nitrous oxide N2O and methane CH4) of the agro-energy chain as a whole and the different production stages of which it is composed.
According to the network data regarding CO2 emissions from fossil fuel, it appears that the agro-energy chain studied causes 305,000 kg of carbon dioxide emissions annually, largely driven by corn silage production (Table 3).
Table 3. CO2 eq (kg) in each stage of the agro-energy chain.
ProcessesStage of agro— energy chainCO2 Emissions (kg)N2O Emissions in CO2 eq (kg)CH4 Emissions in CO2 eq (kg)CO2 eq (kg) Total emissions
Biomass supplyCorn silage from the farm193,000521,250 714,250
Corn silage from other providers141,000380,800 521,800
Triticale silage36409830 13,470
Manure5940 5940
Olive residues1630 1630
Biogas ProductionLoading materials into the plants8940 8940
Anaerobic digestion (*)- 578,250578,250
Use of digestateComposting34,200 34,200
Spreading digestate (**)- 64,25064,250
Total304,810911,880642,5001,859,380
* Caused by the digesters and the exhaust gasses from the CHP unit; ** CO2 emissions due to the spreading of the digestate are included in the organic fertilization of maize silage.
This dominance in CO2 emissions is explained by the huge outflow of resources required for the cultivation of 175 hectares of corn silage, namely seeds, fertilizers, herbicides, pesticides and fuel consumed by farm vehicles used in the various processes.
In particular, fertilization, irrigation and the distribution of insecticides are the most responsible for CO2 emissions into the atmosphere.
The high value of the fertilization emission is explained by the massive use of chemical fertilizers (105,000 kg in 175 hectares). The SimaPro software [27] takes into account CO2 emissions due to the use of fossil fuels during industrial production of these chemical fertilizers, as well as the fuel consumption of the fertilizer spreaders.
As explained for fertilization, the distribution of insecticides and herbicides is also responsible for significant CO2 emissions. In addition, the CO2 emissions caused by irrigation are attributable to the pumps, which are powered by electricity generated from fossil fuels.
The “network” data regarding N2O emissions shows that the agro-energy chain causes yearly nitrous oxide emissions of 3060 kg.
Nitrogen oxide has a dramatically higher contribution to the greenhouse effect than that of carbon dioxide: the contribution to the greenhouse effect caused by 1 kg of N2O is equivalent to that of 298 kg of CO2 [27]. For the agro-energy chain studied, the annual emissions of N2O amounts to 911,880 kg of CO2 eq.
The emissions are caused by chemical and organic fertilizing during the production of maize silage. In this case, the N2O emissions are mainly caused during the production of maize silage by fertilizing with chemical products (ammonium phosphate and ammonium sulfate) and organic ones (liquid digestate). In response to these fertilizers, the microorganisms in the soil carry out processes of nitrification and denitrification. The N2O emissions also derive from the processing and use of agricultural soils.
According to the “network” of CH4 emissions, the agro-energy chain causes methane emissions equal to 25,700 kg of CH4, which corresponds to 642,500 kg of CO2 eq (1 kg of CH4 is equal to 25 kg of CO2 eq).
About 90% of CH4 emissions (23,300 kg) are caused by the leakage of the digester and the exhaust gas from the cogeneration unit in which the energy production takes place. On the other hand, 10% of the emissions (2420 kg) are caused by the liquid digestate spread on the fields, where the spontaneous process of anaerobic digestion takes place.
Overall, the agro-energy chain produces emissions of 1,859,380 kg of CO2 eq, which in relation to the functional unit (1 kWh) means an emission of 0.44 kg CO2 eq/kWh.
This result indicates that the environmental impact of the agro-energy chain from emissions is less than half of that caused by the use of traditional fossil fuels, as shown in Figure 3, where the result obtained is compared with the unitary emission of the production of electricity arising from different fossil sources [10].
In addition, the unitary emissions of the agro-energy chain are also lower than the national mean for all electricity from any source (Mix Ita), while they are higher than the emissions caused by the production of energy from natural gas (methane).
Figure 3. Comparison between unitary emissions.
Sustainability 06 06696 g003
Source: Our elaboration and data from the Centre for Research on Animal Production (CRPA), 2011.

3.2. Economic Sustainability

The biogas plant began operations before 31 December 2012, and therefore, it still benefits from an incentive scheme based on “green certificates” (GCs) or the so-called “feed-in-tariff” (FT) in which renewable energy producers are paid a favorable price for the electricity they supply to the grid.
The GCs are marketable securities issued by the Italian Energy Services Company (Gestore dei servizi energetici (GSE)) to producers of electricity from renewable sources. The securities are qualified as system powered by renewable sources (SPRS), and they are quantified on the basis of the production of electricity fed into the grid.
In this case study, the biogas plant fed 3,780,000 kWh of electricity into the grid, and the price of about 0.28 €/kWh accorded with the incentive feed-in-tariff, which means earnings of 1,058,680 €/year. In addition to earnings from the sale of electricity to the grid, the biogas plant could also profit from the sale of the 2100 tons of digestate produced annually, which, at 20 €/t for unpackaged digestate, could bring in 42,000 €/year (Table 4).
The annual costs of the plant is €960,120; thus, it runs at €2630 a day.
Almost half of the cost (41%) is due to biomass supply. This takes into consideration: (i) the production costs of corn and triticale silage (28 €/t) and the incomes loss in terms of what could have been earned had the product been sold on the market rather than used for biogas production (12 €/t); (ii) the costs of buying corn silage from other sources (40 €/t); (iii) the income loss for using the manure for biogas production rather than selling it or using it for other purposes (6 €/t); (iv) the cost of procuring the olive residue, that is the cost of transport (0.1 €/t).
Over half of the cost (54%) is related to operating the biogas plant, not considering the electricity and heat produced and consumed in the system itself.
Annual operating costs amount to €362,400 (Table 4) as follows: (i) €160,000 for manpower and services; (ii) €120,000 for financing to build the plant (100% bank loan at a rate of 4%); (iii) €70,000 for plant assistance, chemical and physical analyses and maintenance service of electromechanical systems; (iv) €12,400 for loading materials into the plant.
Table 4. Annual balance sheet in Euros.
ProcessesStage of agro-energy chainProduction costs or purchase costsIncome lossFixed
costs
Operating costsRevenue with feed-in tariff
Cost analysis
Biomass supplyCorn silage 153,99066,360
Corn silage, outside providers94,800
Triticale silage41,77018,000
Manure 16,800
Olive residues2000
Biogas productionLoading materials into the plants 12,400
Anaerobic digestion 152,500350,000
Digestate productionComposting 47,5004000
Spreading digestate
Revenue analysis
Energy productionProduction of electricity fed into the grid 1,058,680
Digestate productionDigestate production 42,000
Total costs 295,560101,160200,000366,400
Total revenues1,100,680
Source: our elaboration, year 2012.
The remaining 5% of the costs is associated with biogas plant operations for the production of digestate. It is split into operating (€4000) and fixed (€47,500) costs, without considering the thermal energy produced by the plant and used by composting.
Instead, the fixed costs amount to 152,500 €/year. They were estimated considering the biogas and digestate investment costs (Table 5) and a salvage value equal to 24% of their initial value, with the assumption that the plants will be efficient for fifteen years.
Table 5. Biogas and digestate investment costs.
Biogas plant/digestate/compostingEuro
Planning and authorization50,000
Biogas plant1,950,000
Hydraulic and electrical system120,000
Civil works80,000
Construction of access road5000
Contingence (10% cost of the plant)195,000
Composting plant600,000
Total3,000,000
Source: our elaboration, year 2012.
Comparing the proceeds and the costs, one can deduce an operating profit of €140,560 and, thus, a 5% return on investment (ROI).
It should be emphasized that this net profit is derived from the Italian government’s special incentive rate of 0.28 €/kWh for electricity fed into the grid, valid for biogas plants that began operations before 31 December 2012.
Given that the biogas plant’s actual cost for generating electricity was 0.229 €/kWh and the price stipulated in the latest government provision for renewable energy from agricultural plants was 0.254 €/kWh of electricity fed into the grid, this meant a profit for the venture.
In 2013, the government changed the value of the incentives. The method of calculating the special rate paid to producers of renewable energy from biogas plants remained the same as stipulated in Ministerial Decree of 6 July2012 (the Fifth Energy Act) [28], an “all-inclusive” method that depended on the type and amount of raw materials used and on the size of the plant, but the rate paid to these producers was effectively lowered. If the new rate of 0.23 €/kWh, calculated as a base rate plus premium, were to be applied to the biogas plant of our case study, it would mean a much lower incentive and would have generated an annual operating loss of €90,720 with a negative return on investment of 3%.

4. Discussions and Recommendations

The results of the analysis show that energy production from biogas produces less than half of the greenhouse gas emissions of the energy generation from fossil fuels.
The LCA indicates the strong environmental weight of the cultivation of energy crops used for biogas production, which accounts for fully 70% of the greenhouse gas emissions of the whole agro-energy chain (0.56 square meters of land are needed to produce 1 kWh of electricity). On the other hand, the high yield obtained with energy crops and the difficulties of supplying livestock manure and sewage will probably mean that the production of energy crops will remain important for the economic sustainability of the agro-energy sector.
The environmental benefits of the agro-energy sector could be increased by using the digestate directly at the farm as a fertilizer, replacing the chemical fertilizers responsible for significant emissions into the air and into the ground.
The production of energy from biogas in a dairy farm can provide a good opportunity for augmenting the farm’s income. In fact, in the case study, comparing the proceeds and the costs, one can deduce an operating profit of €140,560, which implies a 5% return on investment (ROI).
Unfortunately, the economic sustainability of the plant depends on the old incentive system; the more recent one stipulates a less advantageous rate and bears negatively on the plant’s economic viability.
In the case of biogas production, we recommend that the government establish a certification system that involves the entire agro-energy chain. Furthermore, better use of digestate as an agronomic fertilizer through the local supply chain should be encouraged.

Acknowledgments

This research was conducted with financial support from the Umbria Region under the Rural Development Plan 2007–2013, for the “Exploitation of agro-energy chain products” research project (Byproenergy). We would like to thank Sheila Beatty for editing the English usage in the manuscript.

Author Contributions

The study was conceived and designed by Biancamaria Torquati and Sonia Venanzi. Francesco Diotallevi and Vincenzo Tamburi contributed equally to the data collection. Sonia Venanzi contributed to the environmental analysis while Biancamaria Torquati contributed to the economic analysis. Biancamaria Torquati and Sonia Venanzi contributed equally to write up of the paper and response to reviewer comments. Adriano Ciani contributed in writing the discussions and recommendations and also did the proof reading of the finalized manuscript. All authors have read and approved the final manuscript.

Conflicts of Interest and Notes

The authors declare no conflict of interest.

References and Notes

  1. Pellerano, A.; Pantaleo, A.; Tenerelli, P.; Carone, M.T. Studio Per La Valorizzazione Energetica Di Biomasse Agro Forestali Nelle Regione Puglia; Dipartimento PROGESA, Università di Bari: Bari, Italy, 2007. (In Italian) [Google Scholar]
  2. Cherubini, F.; Strømman, A.H. Life cycle assessment of bioenergy systems: State of the art and future challenges. Bioresour. Technol. 2011, 102, 437–451. [Google Scholar] [CrossRef]
  3. Piccinini, S.; Vismara, S. Il biogas nel piano di azione nazionale per le energie rinnovabili e il parco impianti in Europa e in Italia. In Biogas Da Agrozootecnia E Agroindustria; Vismara, R., Canziani, R., Malpei, F., Piccinini, S., Eds.; Dario Flaccovio Editore: Palermo, Italy, 2011; pp. 1–17. (In Italian) [Google Scholar]
  4. Holm-Nielsen, J.B.; Al Seadi, T.; Oleskowicz-Popiel, P. The future of anaerobic digestion and biogas utilization. Bioresour. Technol. 2009, 100, 5478–5484. [Google Scholar] [CrossRef]
  5. Iglinski, B.; Buczkowski, R.; Iglinska, A.; Cichosz, M.; Piechota, G.; Kujawski, W. Agricultural biogas plants in Poland: Investment process, economical and environmental aspects, biogas potential. Renew. Sustain. Energy Rev. 2012, 16, 4890–4900. [Google Scholar] [CrossRef]
  6. Frascarelli, A. Le energie rinnovabili in agricoltura. Agriregionieuropa anno. 2011, 7. No. 24. Available online: http://agriregionieuropa.univpm.it/content/article/31/24/le-energie-rinnovabili- agricoltura (accessed on 11 September 2014). (In Italian)
  7. Berglund, M.; Borjesson, P. Assessment of Energy performance in the life-cycle of biogas production. Biomass Bioenergy 2006, 30, 254–266. [Google Scholar] [CrossRef]
  8. Kimming, M.; Sundberg, C.; Nordberg, A.; Baky, A.; Bernesson, S.; Nore, O.; Hansson, P.A. Biomass from agriculture in small-scale combined heat and power plants e A comparative life cycle assessment. Biomass Bioenergy 2011, 35, 1572–1581. [Google Scholar] [CrossRef]
  9. Chiodo, E.; Nardella, N. Valorizzazione energetica di residui e sottoprodotti della filiera vitivinicola in Italia. Agriregionieuropa anno. 2011, 7, pp. 22–25. Available online: http://agriregionieuropa.univpm.it/content/article/31/24/valorizzazione-energetica-di-residui-e-sottoprodotti-della-filiera (accessed on 11 September). (In Italian)
  10. CRPA Project: Sustainable and Innovative European Biogas Environment (SEBE), 2011
  11. Pöschl, M.; Ward, S.; Owende, P. Evaluation of energy efficiency of various biogas production and utilization pathways. Appl. Energy J. 2010, 87, 3305–3321. [Google Scholar] [CrossRef]
  12. Institute for Energy and Environment-IEE. Ecological analysis of biogas utilization from renewable resources, Leipzig (Germany): Institute for Energy and Environment, by order of Agency for Renewable Resources, 2006
  13. Jury, C.; Benetto, E.; Koster, D.; Schmitt, B.; Welfring, J. Life cycle assessment of biogas production by monofermentation of energy crops and injection into the natural gas grid. Biomass Bioenergy 2009, 34, 54–66. [Google Scholar] [CrossRef]
  14. Cherubini, F. GHG balances of bioenergy systems–overview of key steps in the production chain and methodological concerns. Renew. Energy 2010, 35, 1565–1573. [Google Scholar] [CrossRef]
  15. Petrou, E.C.; Pappis, C.P. Biofuels: A survey on pros and cons. Energy Fuels 2009, 23, 1055–1066. [Google Scholar] [CrossRef]
  16. Sheehan, J.J. Biofuels and the conundrum of sustainability. Curr. Opin. Biotechnol. 2009, 20, 318–324. [Google Scholar] [CrossRef]
  17. Blengini, G.A.; Brizioc, E.; Cibrario, M.; Genon, G. LCA of bioenergy chains in Piedmont (Italy): A case study to support public decision makers towards sustainability. Resour. Conserv. Recycl. 2011, 57, 36–47. [Google Scholar] [CrossRef]
  18. Muench, S.; Guenther, E. A systematic review of bioenergy life cycle assessments. Appl. Energy 2013, 112, 257–273. [Google Scholar] [CrossRef]
  19. Battini, F.; Agostini, A.; Boulamnati, A.K.; Giuntoli, J.; Amaducci, S. Mitigating the environmental impacts of milk production via anaerobic digestion of manure: Case study of a dairy farm in the Po Valley. Sci. Total Environ. 2014, 481, 196–208. [Google Scholar] [CrossRef]
  20. Pöschl, M.; Ward, S.; Owende, P. Environmental impacts of biogas deployment—Part I: Life cycle inventory for evaluation of production process emissions to air. J. Clean. Prod. 2012, 24, 168–183. [Google Scholar] [CrossRef]
  21. Pöschl, M.; Ward, S.; Owende, P. Environmental impacts of biogas deployment—Part II: Life cycle assessment of multiple production and utilization pathways. J. Clean. Prod. 2012, 24, 184–201. [Google Scholar] [CrossRef]
  22. International Organization for Standardization (ISO). Environmental Management–Life Cycle Assessment–Principles and Framework; ISO 14040:2006; ISO: Geneva, Switzerland, 2006. [Google Scholar]
  23. Institute for Environment and Sustainability IES (IES). International Reference Life Cycle Data System (ILCD) Handbook–General guide for Life Cycle Assessment–Detailed Guidance; Publications Office of the European Union: Luxemburg, Luxemburg, 2010. [Google Scholar]
  24. Society of Environmental Toxicology and Chemisty (SETAC). Guidelines for Life-Cycle Assessment: A Code of Practice; SETAC: Brussels, Belgium, 1993. [Google Scholar]
  25. United Nations Environment ProgrammeUNEP. Life Cycle Management: How business uses it to decrease footprint, create opportunities and make value chains more sustainable. Available online: http://www.unep.fr/shared/publications/pdf/DTIx1208xPA-LifeCycleApproach-Howbusinessusesit.pdf (accessed on 11 September 2014).
  26. International Organization for Standardization (ISO). Environmental Management–Life Cycle Assessment–Requirements and Guidelines; ISO 14044:2006; ISO: Geneva, Switzerland, 2006. [Google Scholar]
  27. SimaPro Software and Sustainability Consulting. Available online: http://www.pre.nl/ (accessed on 11 September 2014).
  28. Decreto Ministeriale del 6 luglio 2012—Nuovo sistema di incentivi per la produzione di energia da fonti rinnovabili elettriche non fotovoltaiche. Available online: http://www.sviluppoeconomico.gov.it/images/stories/normativa/DM_6_luglio_2012_sf.pdf (accessed on 11 September 2014). (In Italian)

