Growth Is the Problem; Equality Is the Solution

School of Environment, McGill University, 3534 University Street, Montréal, Québec H3A 2A7, Canada
Sustainability 2013, 5(2), 432-439; https://doi.org/10.3390/su5020432
Submission received: 30 November 2012
/
Revised: 21 January 2013
/
Accepted: 22 January 2013
/
Published: 30 January 2013
(This article belongs to the Special Issue 40th Anniversary of 'The Limits to Growth')
Abstract
:While the world economy has become more efficient in one sense, i.e., ecological damage per dollar's worth of economic output, growth in human population size and per-capita production and consumption of goods and services have together far outpaced these gains. Grievous environmental harm has resulted, whether measured in terms of human sustainability through the ecological footprint, or non-human welfare through such indicators as the living planet index and the number of threatened species. Many have therefore called for a reorientation of economic priorities away from growth, and toward equality as a more environmentally-friendly way to enhance human well-being. In this paper, I test the merits of this proposal through analysis of a few key national economic and ecological variables across time and space. The results confirm the hypothesis that equality does far less harm to ecosystems than growth does. In fact, equality seems to benefit one crucial aspect of environmental quality, namely biological diversity.
1. Introduction
The Limits to Growth should have inspired “mankind” to identify and implement alternative economic systems that lack the grow-or-die imperative inherent to capitalism [1]. But the bosses of our current system revolted against calls for serious action of this kind [2], and instead engineered the resurgence of corporate power known as neoliberalism [3]. As a result, humanity now consumes more resources and produces more waste than the Earth can possibly sustain [4]—right on schedule according to the dire, cautionary projections offered by Meadows et al. [5].
Another essential feature of capitalism is massive economic and therefore political inequality [6]. Progressive taxation and public spending can of course mitigate this feature to some extent. Because different governments have implemented such policies to different degrees, it is now possible to gauge the effects of equality on a variety of health and social variables [7]. These manifestly positive effects, along with concern for justice and fairness, have led ecological economists to call for a reorientation of priorities toward equality as a more environmentally-friendly route to human well-being than growth [8].
In this paper, I test the environmental side of this proposal, through analysis of a few key national socioeconomic and ecological variables across space and time. The socioeconomic variables are human population size, per-capita gross domestic product (GDP), equality of net household income, and changes over time in these three variables since 1980, which is the earliest year for which the World Bank has made the relevant GDP figures available. A positive change in either population or GDP/capita constitutes “growth” in that dimension. I use data on equality of income, rather than wealth, because standardized measures of the former are now available for a large number of countries and years [9]. The ecological variables are ecological footprint, carbon dioxide emission, and number of threatened species. A country’s ecological footprint quantifies its demand on nature for resource supply and waste absorption. CO2 emission is well-correlated with, but less comprehensive than, ecological footprint. But countries’ CO2 emissions are known for longer periods of time than are their ecological footprints. Number of threatened species indicates the effects of human economic activity on our fellow life forms.
2. The World over Time
Before country-level analysis, let us take a brief look at the big picture. Ehrlich and Holdren [10] pointed out that humanity's overall environmental impact (I) is a function of human population size (P), per-capita production and consumption of goods and services (subsequently termed “affluence”, A), and technological (in-)efficiency (T): I = PAT. Data from the UN [11], World Bank [12], and Global Footprint Network (GFN) [13] allow us to quantify each of these variables for both countries at a single point in time (2008), and the world as a whole over time (1980–2008).
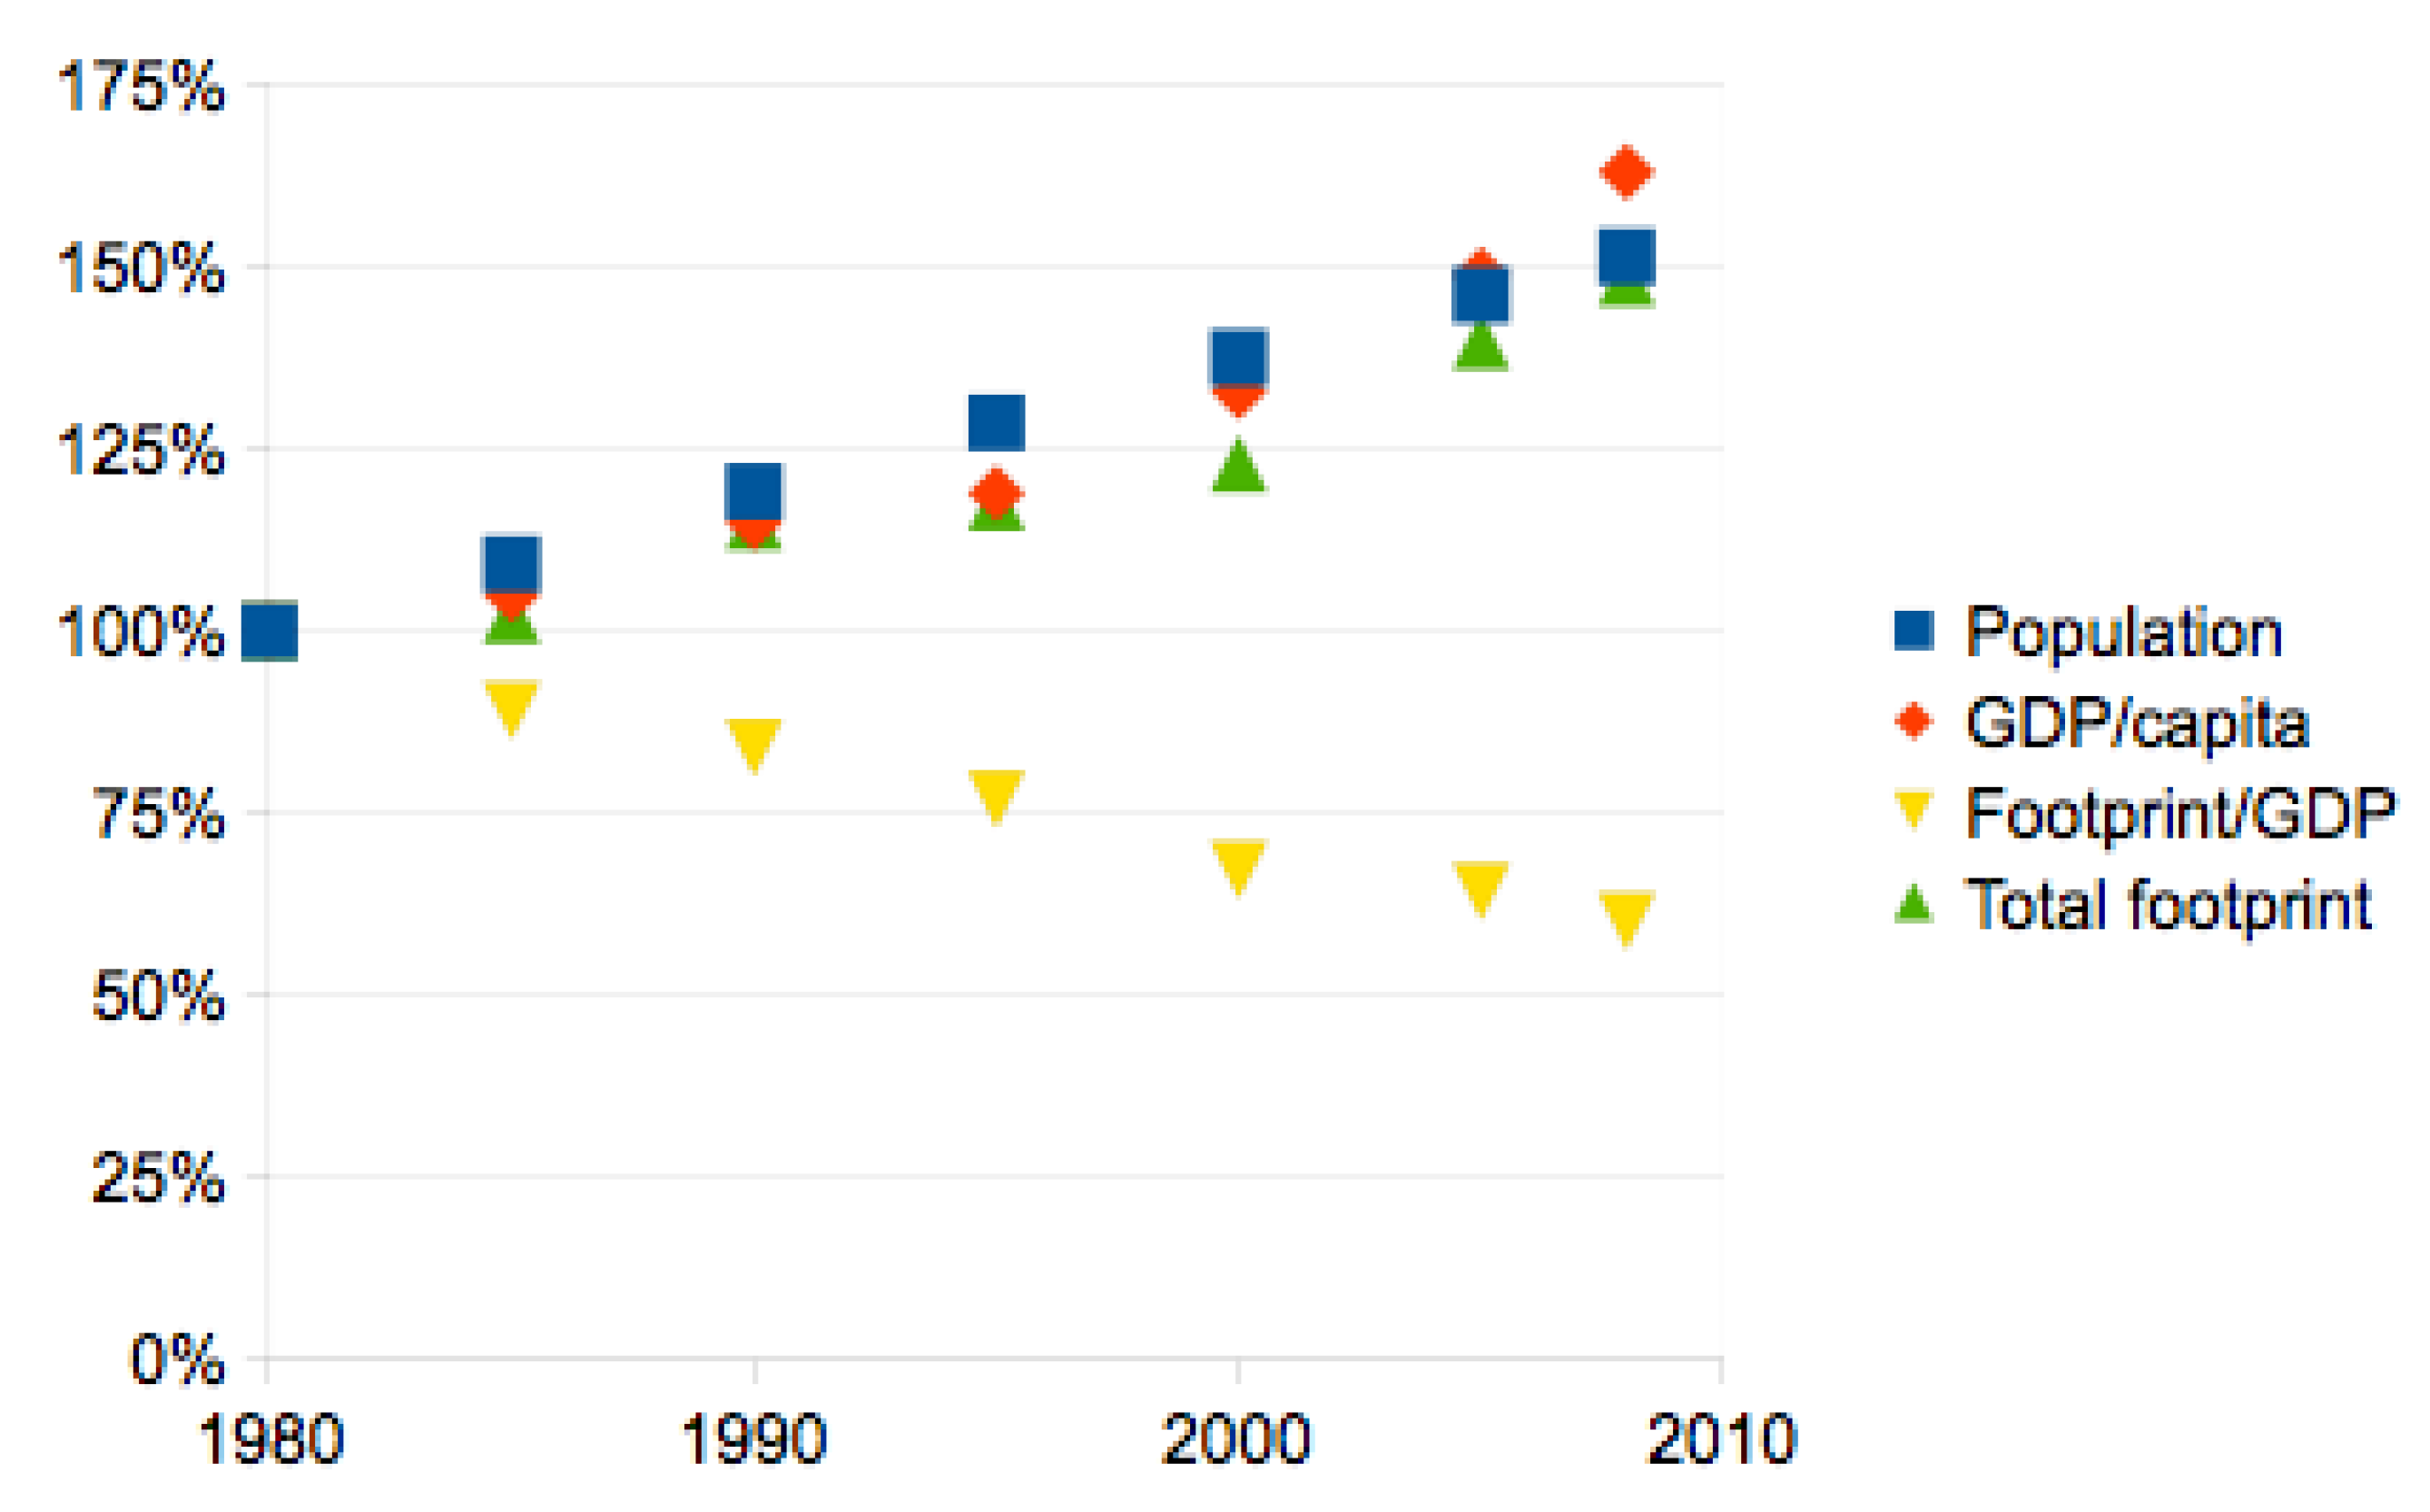
Between 1980 and 2008, world human population size increased by 51%, from under 4.5 to over 6.7 billion. Per-capita gross domestic product (GDP), corrected for both inflation (constant 2005 $) and purchasing power (PPP), increased even more—by 63%, from less than $6,000 to nearly $10,000. Overall technological efficiency improved in the sense that ecological footprint per $10,000 of GDP declined by 40%, from 4.7 to 2.8 global hectares (gha). However, because of planned obsolescence, it is not clear how much improvement in genuine functionality per unit of ecological damage this actually represents [14]. Regardless, although efficiency gains in terms of footprint per GDP would have offset either population growth or per-capita GDP growth alone, it fell far short of offsetting both together. As a result, the amount of land needed to sustain our total resource consumption and waste production rose by 48%, from around 12 billion to over 18 billion gha—more than 1.5 Earths’ worth. See Figure 1 for a graph of these trends.
Figure 1.
Proportional changes in global environmental impact and its determinants since 1980 (data from [11,12,13]).
Not only has the human footprint thus now far exceeded the biosphere’s ability to sustain us, but we have also grievously harmed our fellow species in the process. From 1980 to 2008, wild vertebrate populations declined by an average of 30% per species, worldwide [4]. And by 2012, nearly one third (20,219) of species evaluated by the International Union for the Conservation of Nature (IUCN; 65,518) had become threatened with extinction [15].
3. Countries across the Globe
The effects of population, affluence, and technology on environmental impact can also be assessed with data on different countries at a single point in time, using the generalization of Ehrlich and Holdren’s IPAT formula espoused by York et al. [16]. Rather than treating the formula as a mathematical identity, and therefore necessarily true, York et al. suggest using log-log regressions to gauge mathematically contingent effects of P, A, and T—as well as other variables—on I. I applied this technique to the country-level data supplied by the same sources named above [11,12,13], along with data on economic inequality provided by Solt [17], and on threatened species by the IUCN [18]. Including technological efficiency (T), as defined above, would make IPAT a mathematical identity. Because this would render regression redundant and indeed impossible, I dropped T from the country-level analyses. In its place, I added a measure of economic equality (E: one minus the Gini index of net household income inequality).
4. Results
Among the data for 2008, P (population size) and A (GDP/capita) have highly significant statistical relationships with I (ecological footprint; p < 10−36 and 10−15, respectively), whereas E (income equality) does not come close to statistical significance (p = 0.88 ). Dropping E from the regression for this reason yields the following estimate of the relationships between P, A, and I (R2 = 0.96, n = 104 countries):
I = 0.12 P0.94A0.46
It should surprise no one that China, the most populous country in the sample with 1.3 billion people in 2008, had a total ecological footprint more than three orders of magnitude greater than that of Swaziland, the least populated with only 1.2 million people. But it may be harder for some to accept the fact that the United Arab Emirates (UAE), the richest country in the sample with a per-capita GDP of more than $51,000, had an ecological footprint almost eight times larger than that of the much poorer Burundi (GDP/capita = $515), despite having a smaller population size than Burundi's. In contrast, the relative equality or inequality of different countries had no detectable effect on their ecological footprints. Data from 2005, when a larger number of equality figures are available, and on CO2 emissions rather than ecological footprint as a measure of environmental impact, yield similar results. They all lend support to the notion of economic equality as a route to human well-being that is more environmentally benign than economic growth.
We can more rigorously test the connection between growth and environmental destruction, and the dis-connection between equality and such destruction, by looking at changes over time in P, A, E, and I. Because the GFN does not supply figures on individual countries' ecological footprints over time, for this analysis I used the closely-related measure of CO2 emissions instead [19]. While changes in population and per-capita GDP from 1980 to 2005 correlate very significantly with changes in CO2 emissions over the same period (p < 10−9 and 10−7, respectively), changes in income equality do not (p = 0.31). Thus again dropping the equality factor, the equation relating changes over time in P, A, and I (R2 = 0.50, n = 127 countries) is:
I2005/I1980 = 0.70(P2005/P1980)1.68(A2005/A1980)0.97
To illustrate, it happens that the richest country in the dataset—the UAE—also had the highest rate of population growth, with over four times more people in 2005 than in 1980. The UAE’s total CO2 emissions rose nearly as much, i.e., 3.5-fold. At the other extreme of population change, Bulgaria lost 13% of its population size, and its emissions fell even faster, i.e., by 46%. China's per-capita GDP rose faster than any other country’s—nearly eight-fold—and its CO2 emissions also increased massively—almost four-fold. At the low end of per-capita GDP change, Liberia's dropped by 73%, and its emissions declined more than proportionally, by 77%.
Finally, both human population size and per-capita GDP also correlate significantly (though GDP/capita marginally so) with the number of threatened plant and animal species in each country (p < 10−13 and 0.09, respectively). But in this case, economic equality also has a significant connection with environmental impact: a negative one (p < 10−5). The more equal the country, the fewer the species in it that are threatened with extinction (R2 = 0.51, n = 98):
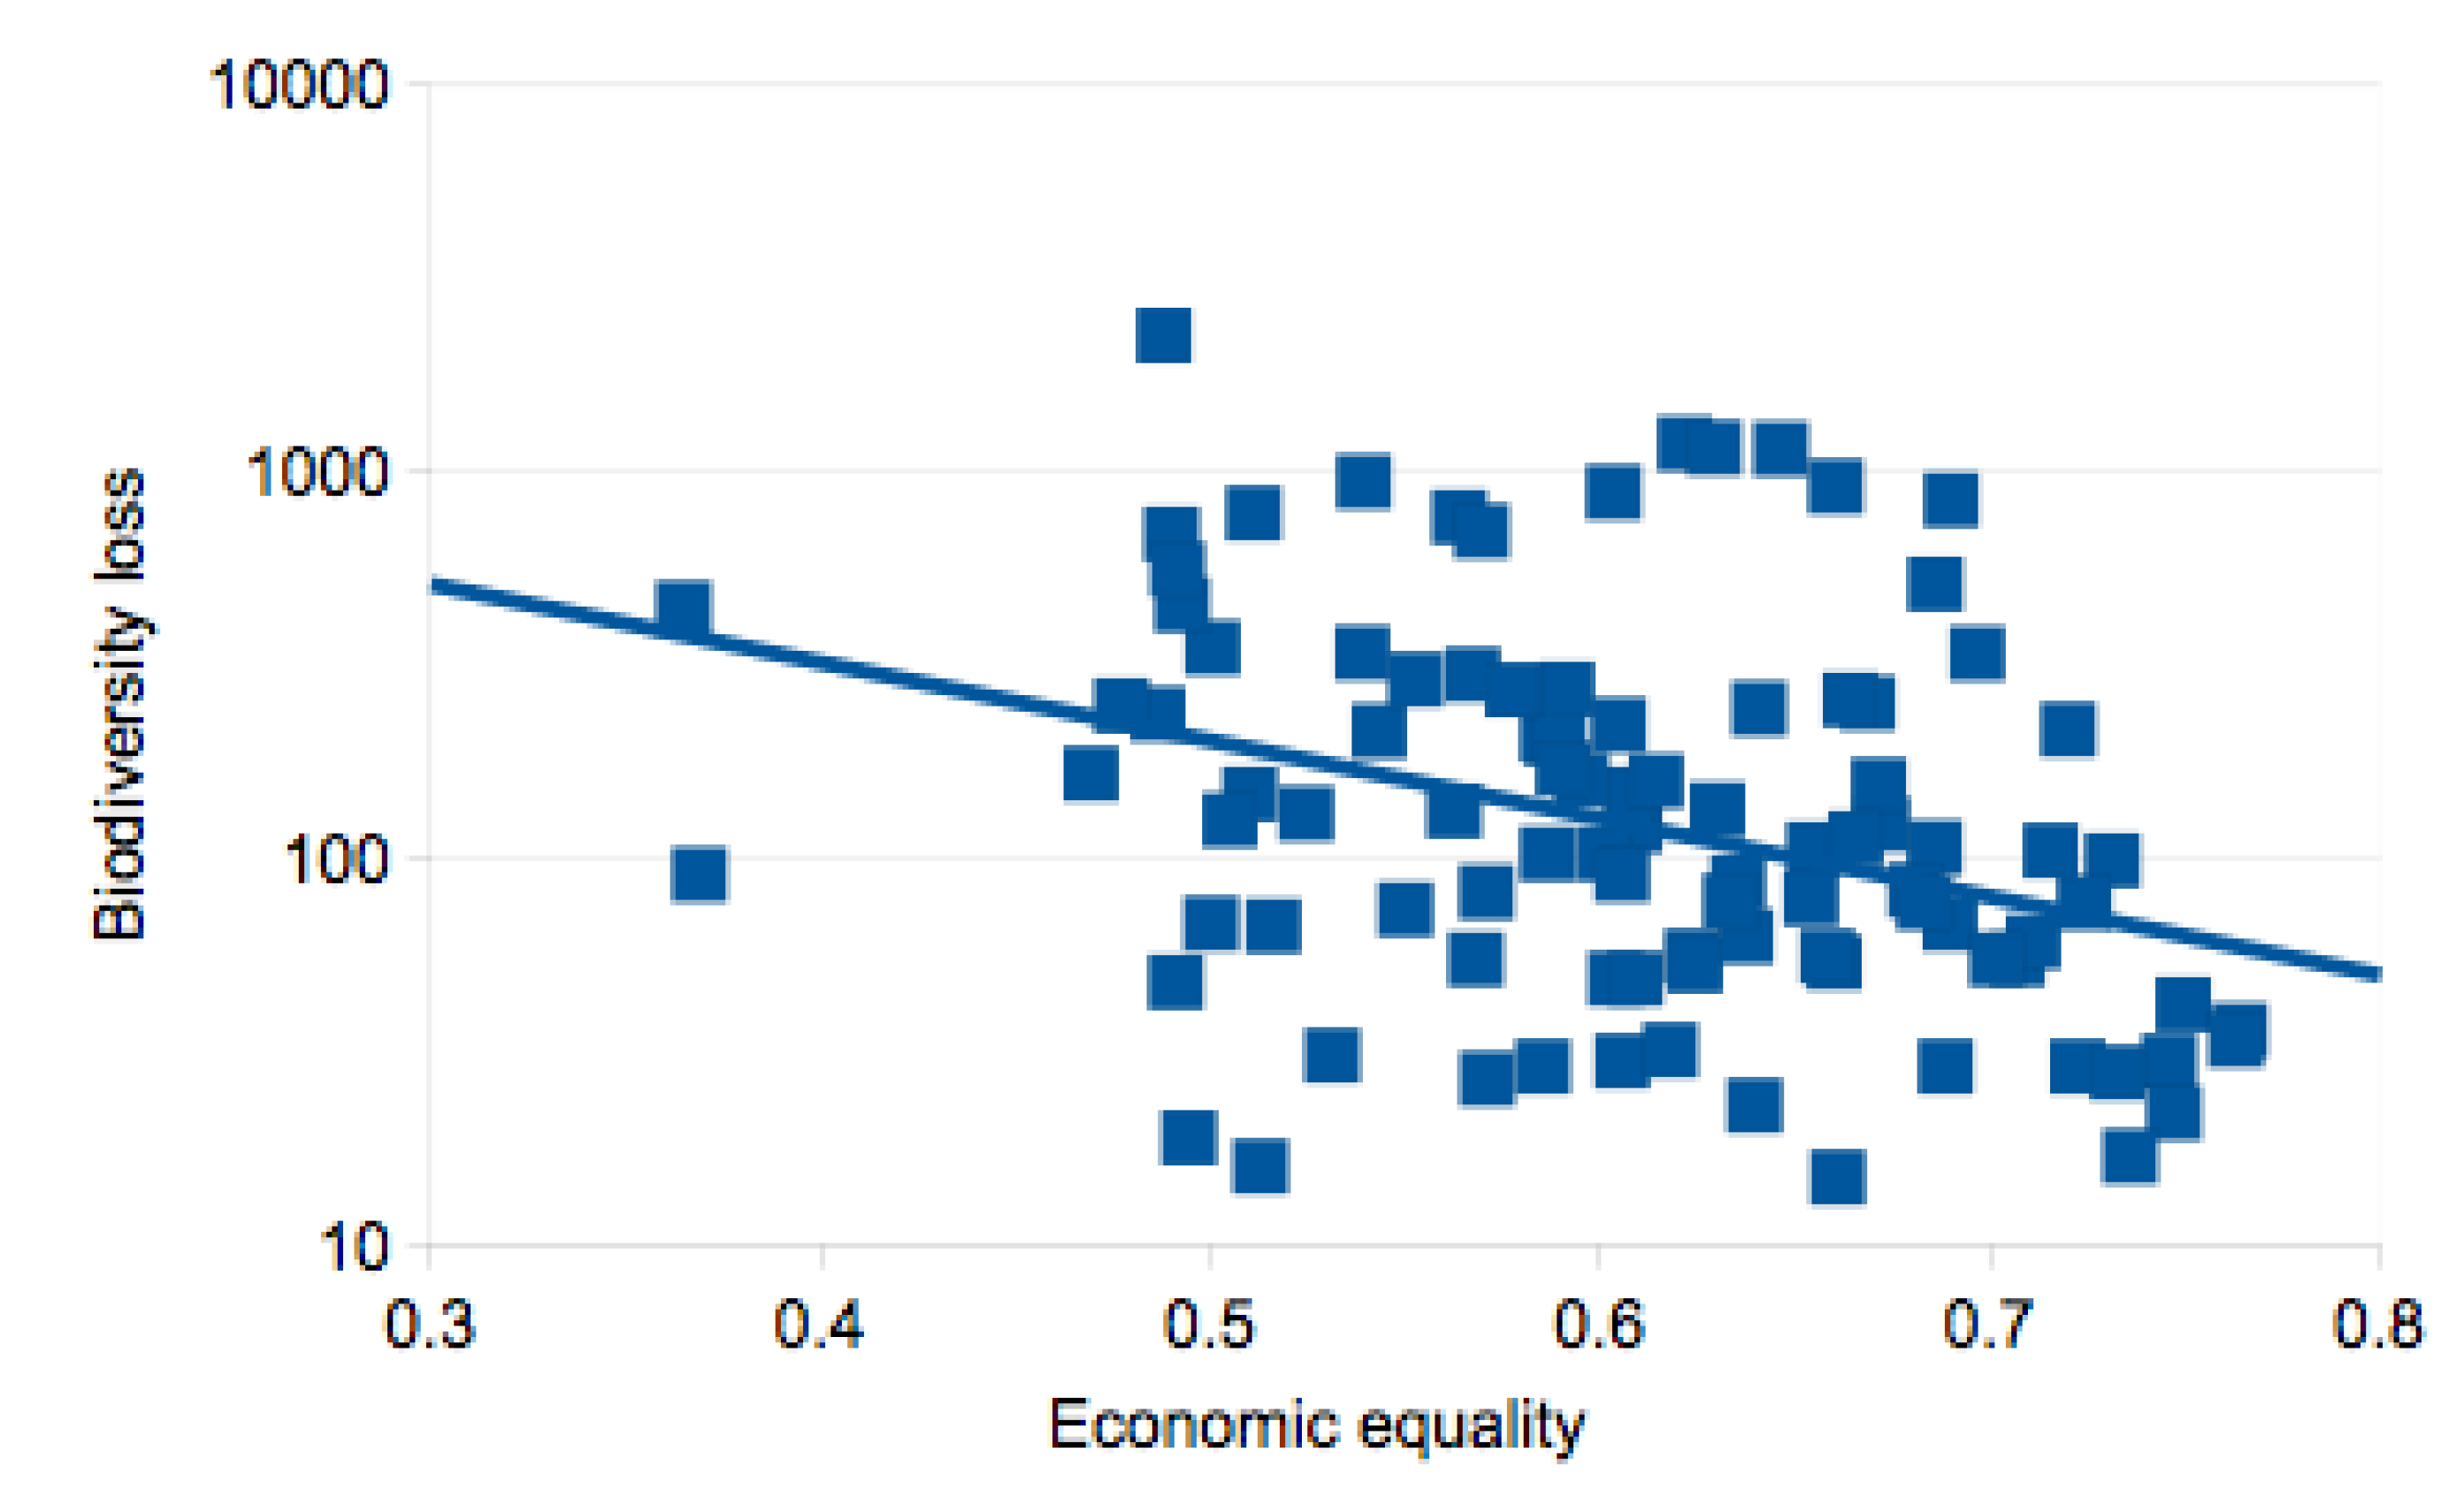
Note that while the exponents for P and A are positive, the one for E is negative. Again, the right side of the equation represents data from 2005, for which more equality figures are available than for 2008. But similar results obtain for 2008 as well. Because comprehensive data are not available on how numbers of threatened species have changed over time, it is impossible to perform an analysis of changes over time for that variable as I report above for carbon emissions. But the figures for 2005 (or 2008) imply that, rather than simply being neutral with respect to biological diversity as it is for ecological footprint and carbon emissions, economic equality actually helps wild species maintain healthy population sizes (see Figure 2). Beyond the negative correlation between equality and threatened species reported above, the mechanisms outlined by Mikkelson et al. [20] provide additional evidence for a causal influence of equality on biodiversity.
Number of threatened species = 0.01 P0.44A0.12E−3.2
Figure 2.
Negative relationship between economic equality (one minus the Gini index of net household income inequality) and biodiversity loss (number of threatened plant and animal species) across 98 countries (data from [17,18]). The line shown is the best-fit regression line of log(Threatened species) on (1—Gini).
5. Discussions
Despite many economists’ attachment to the idea of the “environmental Kuznets curve”, it is already well-established that growth in both human population size and per-capita production and consumption of market goods and services exacerbates at least some of the broadest aspects of environmental damage (see, e.g., [16]). Above, I hope to have contributed a useful new synthesis of the resulting patterns at the global level over time, the country level at a given point in time, and the country level over time. The results shown above also lend strong support to ecological economists' call for a turn away from growth, and toward equality, in order to enhance human well-being while relieving and then reversing the unsustainable and immoral trends toward ever-greater resource consumption and waste production. See References 1, 6–8, and 20 for thoughts on how best to re-orient economies away from growth and toward equality.
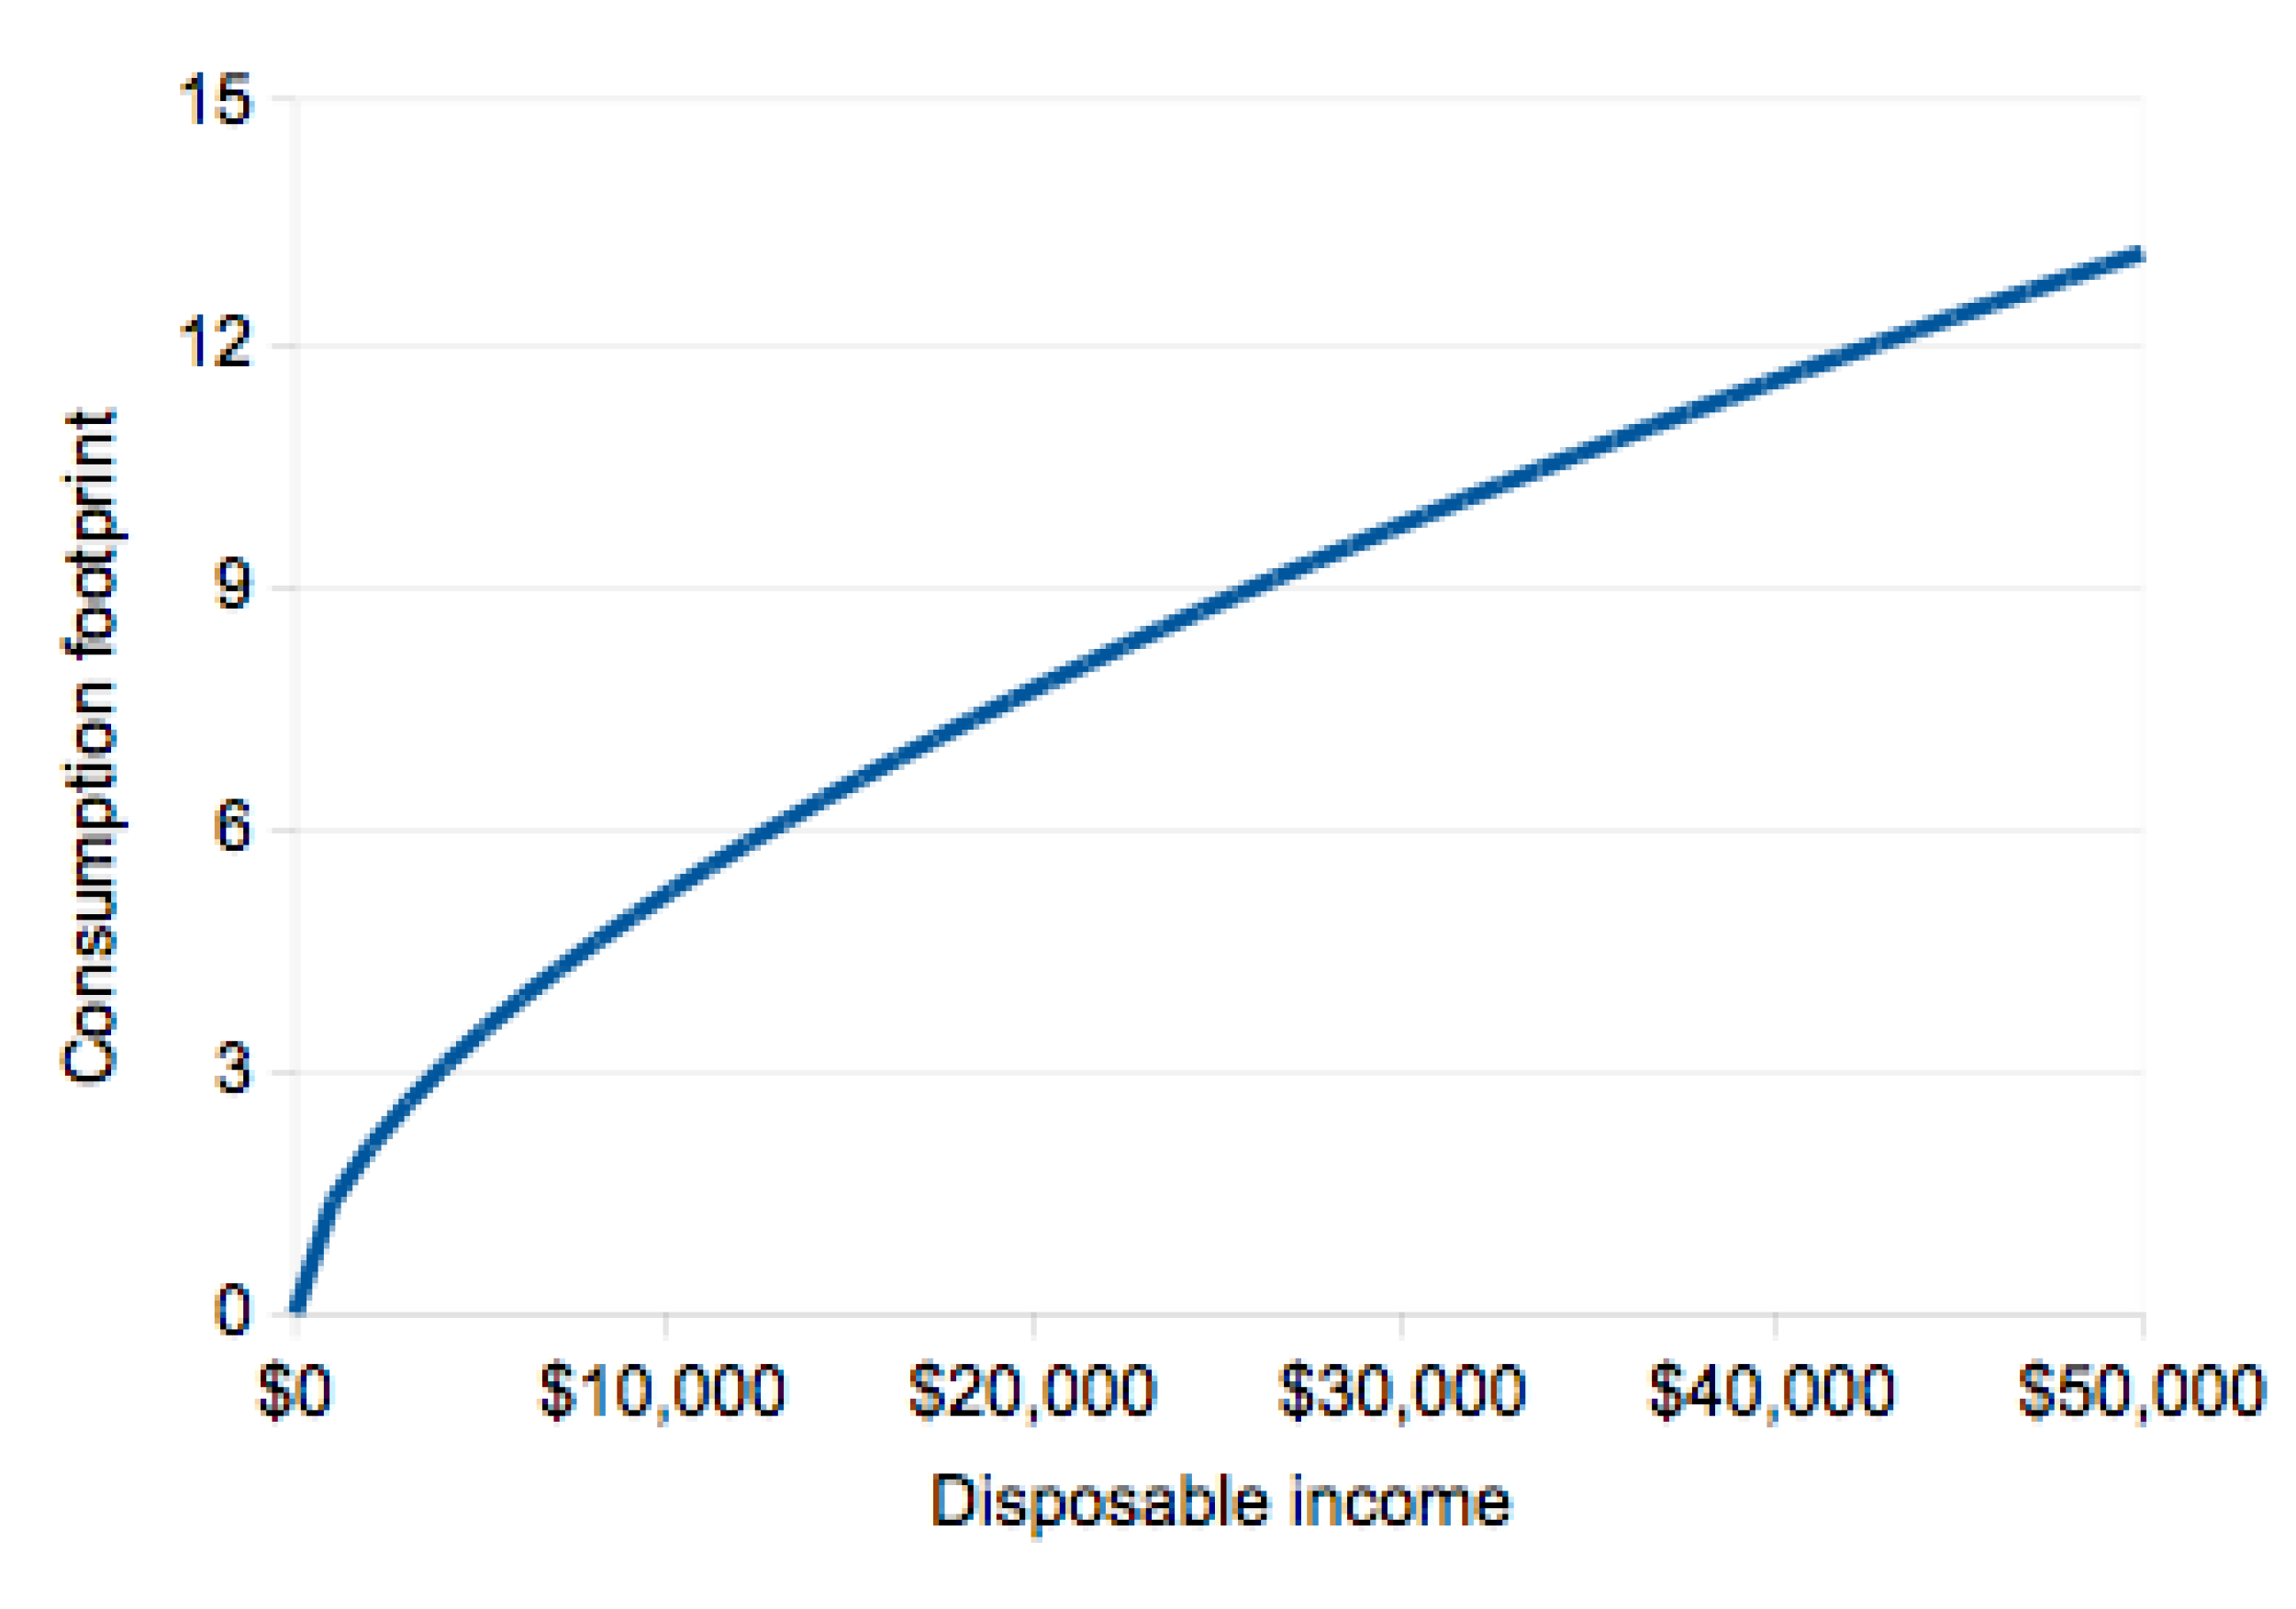
At least two remaining puzzles merit further consideration here. First, while the current study suggests a positive effect of per-capita GDP on numbers of threatened species, previous studies have yielded a mix of evidence suggesting positive [21], neutral [22], or even negative [23] relationships. Second, among studies showing a positive relationship between per-capita income or GDP and ecological damage, that relationship curves downward (see [24] and Figure 3 below for the pattern within Canada; and [16] and the three equations featured above for the pattern across countries). As I explain below, this fact makes the neutral and negative relationships between economic equality and environmental harm reported above surprising, intriguing, and worth further exploration.
Figure 3.
Positive but downward-curving relationship between individual Canadians' disposable income in 2002 (market income, minus taxes, plus government transfers) and average ecological footprint of market goods and services consumed (data from [24]). The curve shows the best-fit power model [Footprint = Coefficient x (Income) Exponent].

Naidoo and Adamowicz [21] showed that past a certain point, per-capita GDP generally relates positively to numbers of threatened species. However, neither Mikkelson et al. [22] nor Holland et al. [23] were able to confirm this finding. Mikkelson et al. noted that this failure may have resulted from the smaller sample size in their own analysis (45 countries as opposed to over 100 in Naidoo and Adamowicz’s). This explanation might apply to Holland et al. as well, since their study included only 50 countries. The expanded sample size used in the current study (98 countries) confirms the positive contribution of per-capita GDP to species loss. However, as noted above, the relationship is relatively weak (p = 0.09). I speculate that this weakness results partly from the fact that countries with high per-capita GDP have already extirpated many of their native species, and therefore have fewer left to show up on lists of threatened species.
As noted above, MacKenzie et al. [24] found that, within Canada, the ecological footprint of goods and services consumed by individuals has a positive but downward-sloping relationship with income. This suggests that if income were more equally distributed, Canada’s total ecological footprint would actually increase. This is because individual consumption would rise more, per dollar, as some people went from poor toward middle-class, than consumption would fall as others went from rich toward middle-class. How can this be reconciled with the fact that equality does not seem to affect countries' total footprints at all, and seems to actually mitigate, rather than exacerbate, biodiversity loss?
Two possibilities present themselves: individual investment may prove equally or perhaps even important compared to individual consumption, and/or social-level mechanisms may override the individualistic effects of income on environmental damage. Although consumption increases more slowly than income, investment increases faster. In other words, while the poor must spend most or all of their income on food, housing, and other necessities; the rich have the luxury of devoting an ever-greater proportion of their income to investments designed to make them even richer. Just as consumption increases a country’s environmental impact, so too must investment.
But perhaps social-level mechanisms will turn out to be more important than the relationship between income and either individual consumption or individual investment, when it comes to explaining the (dis-)connections between economic equality and ecological harm. This would jibe with the findings of Wilkinson and Pickett [7] about the relationship between equality and health. They argued that social-level variables such as trust between citizens and well-functioning public institutions go much further toward explaining why more equal societies have better health statistics, than does the mere fact that individual health has a positive but downward-sloping relationship with individual income.
References
- Schweickart, D. Is sustainable capitalism an oxymoron? Perspect. Global Dev. Tech. 2009, 8, 559–580. [Google Scholar] [CrossRef]
- Powell, L.F., Jr. Attack of American Free Enterprise System. 1971. Available online: www.pbs.org/wnet/supremecourt/personality/print/sources_document13.html (accessed on 25 January 2013).
- George, S. A short history of neoliberalism: Twenty years of elite economics and emerging opportunities for structural change. In Global Finance: New Thinking on Regulating Speculative Capital Markets; Bello, W., Bullard, N., Malhotra, K., Eds.; Zed. Grabel: London, UK, 2000. [Google Scholar]
- World Wide Fund for Nature (WWF), Living Planet Report: Biodiversity, Biocapacity, and Better Choices; WWF International: Gland, Switzerland, 2012.
- Meadows, D.H.; Meadows, D.L.; Randers, J.; Behrens, W.W., III. The Limits to Growth: A Report for the Club of Rome’s Project on the Predicament of Mankind; Universe: New York, NY, USA, 1972. [Google Scholar]
- Schweickart, D. After Capitalism; Rowman and Littlefield: Lanham, MD, USA, 2011. [Google Scholar]
- Wilkinson, R.G.; Pickett, K.E. The Spirit Level: Why More Equal Societies Almost Always Do Better; Penguin: New York, NY, USA, 2009. [Google Scholar]
- Daly, H.E.; Farley, J. Ecological Economics: Principles and Applications; Island: Washington, DC, USA, 2011. [Google Scholar]
- Solt, F. Standardizing the world income inequality database. Soc. Sci. Q. 2009, 90, 231–242. [Google Scholar] [CrossRef]
- Ehrlich, P.R.; Holdren, J.P. Impact of population growth. Science 1971, 3977, 1212–1217. [Google Scholar]
- United Nations (UN). World Population Prospects: The 2010 Revision. 2011. Available online: esa.un.org/unpd/wpp/unpp/panel_population.htm (accessed on 25 January 2013).
- World Bank. GDP per Capita, PPP (Constant 2005 International $). 2011. Available online: data.worldbank.org/indicator/NY.GDP.PCAP.PP.KD (accessed on 25 January 2013).
- Global Footprint Network. National Footprint Accounts. 2011. Available online: www.footprintnetwork.org/en/index.php/GFN/page/footprint_data_and_results (accessed on 30 November 2012).
- Leonard, A. The Story of Stuff: How Our Obsession with Stuff Is Trashing the Planet, Our Communities, and our Health—And a Vision for Change; Free Press: New York, NY, USA, 2010. [Google Scholar]
- International Union for the Conservation of Nature (IUCN). Numbers of Threatened Species by Major Groups of Organisms (1996–2012). 2012. Available online: www.iucnredlist.org/documents/summarystatistics/2012_2_RL_Stats_Table_1.pdf (accessed on 25 January 2013).
- York, R.; Rosa, E.A.; Dietz, T. Footprints on the Earth: The environmental consequences of modernity. Am. Socio. Rev. 2003, 68, 279–300. [Google Scholar]
- Solt, F. Standardized World Income Inequality Database. 2011. Available online: myweb.uiowa.edu/fsolt/swiid/swiid.html (accessed on 25 January 2013).
- International Union for the Conservation of Nature (IUCN). Number of Extinct, Threatened and other Species of Animals in each Red List Category in Each Country and Number of Extinct, Threatened and other Species of Plants in each Red List Category in Each Country. 2011. Available online: www.iucnredlist.org/documents/summarystatistics/2011_2_RL_Stats_Table_6a.pdf (accessed on 15 January 2012).
- World Resources Institute (WRI). Climate Analysis Indicators Tool. 2009. Available online: cait.wri.org (accessed online 15 January 2010).
- Mikkelson, G.M.; Billé, R.; Kleitz, G. Homage to Red Green: Economic equality as a condition for biodiversity conservation. In The Social Aspects of Sustainable Development; Tubiana, L., Voituriez, T., Raphael, J., Martimort-Asso, B., Biagiotti, I., Eds.; Teri: New Delhi, India, 2013. [Google Scholar]
- Naidoo, R.; Adamowicz, W.L. Effects of economic prosperity on numbers of threatened species. Conservat. Biol. 2001, 15, 1021–1029. [Google Scholar] [CrossRef]
- Mikkelson, G.M.; Gonzalez, A.; Peterson, G.D. Economic inequality predicts biodiversity loss. PLoS ONE 2007, 2, e444. [Google Scholar] [CrossRef]
- Holland, T.G.; Peterson, G.D.; Gonzalez, A. A cross-national analysis of how economic inequality predicts biodiversity loss. Conservat. Biol. 2009, 23, 1304–1313. [Google Scholar] [CrossRef]
- Mackenzie, H.; Messinger, H.; Smith, R. Size Matters: Canada’s Ecological Footprint, by Income. Canadian Centre for Policy Alternatives: Ottawa, Canada, 2008. [Google Scholar]
© 2013 by the authors; licensee MDPI, Basel, Switzerland. This article is an open access article distributed under the terms and conditions of the Creative Commons Attribution license (http://creativecommons.org/licenses/by/3.0/).
Share and Cite
MDPI and ACS Style
Mikkelson, G.M. Growth Is the Problem; Equality Is the Solution. Sustainability 2013, 5, 432-439. https://doi.org/10.3390/su5020432
AMA Style
Mikkelson GM. Growth Is the Problem; Equality Is the Solution. Sustainability. 2013; 5(2):432-439. https://doi.org/10.3390/su5020432
Chicago/Turabian StyleMikkelson, Gregory M. 2013. "Growth Is the Problem; Equality Is the Solution" Sustainability 5, no. 2: 432-439. https://doi.org/10.3390/su5020432