“Decent Living” Emissions: A Conceptual Framework

1
International Institute for Applied Systems Analysis (IIASA), Schlossplatz 1, A2361 Laxenburg, Austria
2
School of Public Policy at Georgia Institute of Technology, D. M. Smith Building, 685 Cherry Street, Atlanta, GA 30332, USA
*
Author to whom correspondence should be addressed.
Sustainability 2012, 4(4), 656-681; https://doi.org/10.3390/su4040656
Submission received: 2 February 2012
/
Revised: 4 April 2012
/
Accepted: 9 April 2012
/
Published: 18 April 2012
(This article belongs to the Special Issue Sustainable Policy on Climate Equity)
Abstract
: There is very little elaboration in literature of the phrase “equitable access to sustainable development” that is referenced in the Cancun Agreement on climate change. We interpret this at a minimum as people’s right to a decent living standard, which gives rise to claims by countries to an exemption from mitigation for the energy and emissions needed to provide a decent life to all. We elaborate a conceptual framework for a comprehensive quantification of such an energy requirement, including the energy required to build out infrastructure to support these living standards. We interpret decent living as the consumption by households of a set of basic goods including adequate nutrition, shelter, health care, education, transport, refrigeration, television and mobile phones. We develop universal indicators for these activities and their infrastructure requirements, and specify a methodology to convert these to energy requirements using energy input-output analysis. Our main recommendations include estimating bottom-up, country-specific energy and emissions requirements, incorporating a minimum for methane emissions, and using international benchmarks at the sector level to encourage the reduction of countries’ energy and emissions intensity.
1. Introduction
Debates about appropriate climate policy are inseparable from debates about sustainable development. The United Nations Framework Convention on Climate Change (UNFCCC) makes countless references to sustainable development, and even asserts that “parties have a right to, and should, promote sustainable development” [1]. The Cancun Agreement also states that parties agree to aim to restrict emissions on the basis of “equitable access to sustainable development”. This has historically been interpreted by developing countries as claims to the earth’s carbon emissions absorption capacity [2], which recently have included claims to both past and future absorption capacity [3].
Yet, the emissions “space” that these claims entail for countries depends on how much of earth’s absorption capacity is left to allocate (which depends on the stringency of a global target for climate stabilization), and how much space they can retrospectively claim (which depends on how much past emissions count). This space does not derive from or necessarily correlate with the emissions to which countries’ development would in fact give rise.
Given this reality, the question arises as to what claims to current and future emissions space this “right to sustainable development” should actually protect. It is in this light that we see the relevance of our project: the elaboration of a conceptual framework to quantify the energy and emissions associated with a defensible account of a “decent life” for all, which we call “decent living emissions”. We suggest that the minimal requirement of a fair climate regime is that the allocation of emissions rights (directly or indirectly) must protect the ability of countries to provide the necessary energy services to reach and maintain this decent life for all. Put differently, we suggest that there must be a threshold of exemption (from mitigation obligations) that applies to emissions associated with “decent living activities”.
We do not in this paper provide a comprehensive estimate of the total emissions space required [4]. Rather we focus on the description and justification of a conceptual framework that links “decent living activities” to energy services and thence to emissions, and on the demonstration of methods that can be used to build up the necessary estimates (particularly of required energy services).
We set out a relatively minimalist standard, but we seek to consider not only the energy and emissions associated with individual consumption—“maintenance emissions”—but also the “development emissions” associated with the construction and maintenance of the infrastructure (physical and human resources) needed to provide the shared- and public-goods components and enable individual consumption That is, in contrast with individually-based accounts of basic needs, we seek to establish a basis for discussing basic needs, and indeed “development”, as a concrete social entitlement.
We identify ten major categories of consumption that comprise “decent living activities”: food, shelter, safe water and sanitation, health care, education, transportation, clothing, refrigeration, television and mobile phones. We suggest a methodology to estimate the energy and emissions associated with the achievement and maintenance of these activities in different countries, and give examples for several of the categories. Obviously “decent living” includes other important human activities, such as recreation, social relations and involvement in the political process. We do not aim to offer an exhaustive list of goods in this minimal basket, but instead to capture those components that matter most for a climate change regime. Our selection is thus guided by resource use, and focuses on energy-intensive consumption. We believe that there is both objective justification and empirical support for what people want that can provide the basis for a reasonable lower bound on the energy and emissions requirements for decent living standards. Equally important in our proposal is a feasible analytical approach that policymakers can use even if they were to choose a variant of this basket of decent living activities.
This article proceeds as follows. In Section 2, we discuss the literature on the right to decent living that provides much of the justification of our approach. In Section 3, we specifically identify the goods and services that make up our minimal basket of “basic goods.” In Section 4, we outline a methodology for estimation with illustrations for food, housing and residential energy, water and sanitation, transport and health care. Section 5 concludes with some thoughts on incorporating such an emissions threshold in a burden-sharing agreement for climate mitigation.
2. Background
This project is motivated by the strong support in the climate ethics literature for a global response to climate change that respects persons’ right to a basic living standard, and the concomitant lack of studies that quantify what such a threshold must entail for energy use and related emissions. The goal of establishing a moral minimum for mitigation agreements is to apportion mitigation responsibility in a manner that does not infringe on the poor’s basic rights. The goal of a regime that implements such a principle would be to assign and implement national mitigation commitments in a manner that leaves people whole with respect to these basic rights, so that they needn’t bear the burden of reducing the GHG emissions that arise from enjoying these rights. This requires defining what basic rights deserve protection, and how much emissions their protection entails.
2.1. Support for a “Moral Minimum”
The notion of exempting a certain category of people from mitigation burdens derives from a human rights view that humans are entitled to a set of ‘goods’ that enables them to enjoy a basic minimum level of well-being. This view has considerable support in the climate ethics literature, but also has its roots in the broader literature on global distributive justice.
Basic rights are the morality of the depths. They specify the line beneath which no one is allowed to sink.Henry Shue (1980), Basic Rights
Henry Shue’s statement above characterizes the spirit of a moral threshold. What does respect for human dignity demand that all humans have regardless of their culture, nationality, location in history or place? Of interest here and in the global distributive justice literature are the types of duties that such claims raise for states towards people in other states. In particular, we focus on negative duties—duties to respect, or not infringe on, other states’ abilities to fulfill these rights for their own people. That is, there is little justification, except under extenuating circumstances, for knowingly infringing on others’ basic entitlements.
There are two senses in which a morally justified threshold of exemption is a ‘minimum’ in a mitigation burden-sharing framework. The most important sense is that this principle has lexical priority over all other distributive principles that are invoked to determine a fair allocation of mitigation burdens [5]. Another sense in which an exemption threshold is a minimum is that respect for such a threshold is the least, and most compelling, of justice considerations that a global climate mitigation regime ought to incorporate, if one had to eschew all other considerations. When viewed from this perspective, a morally justified threshold for exemption from mitigation burdens has potential to serve as a common ground for agreement.
2.2. Minimum Level of “What?”: Decent Living Standards
The “Equality of What?” debate—what features of the human condition should count in basic entitlements—is larger than the domain of climate change, and reviewed elsewhere in literature [6,7]. For a climate mitigation regime, we find sufficient support for defining a set of basic goods that is more expansive than mere subsistence, and includes some measure of decent living standards.
Philosophers differ widely on the content of basic entitlements. Henry Shue defines subsistence rights as comprising physical and economic security, on which humans’ survival depends [8]. In the climate ethics literature, Shue indirectly supports a subsistence-based moral threshold by differentiating “subsistence emissions” from luxury emissions [9]. A number of scholars hold a more inclusive view of human rights, defined by what is instrumental to ensuring a decent quality of life beyond mere subsistence [10,11,12,13]. Simon Caney [14], more recently, casts human rights as claims to decent living standards, or to the emissions that are required to enjoy decent living standards. However, none of these scholars elaborate on the meaning of “decency.” An even more inclusive perspective avers that humans ought to have rights to certain “capabilities” for carrying out functions that are the ultimate source of human flourishing [15,16]. However, there is considerable ambiguity in this work even on what capabilities ought to be given protection, let alone how one would operationalize such entitlements [17].
International law also lends moral and political support to a right to decent living standards. The International Covenant on Economic, Social and Cultural Rights (ICESCR) includes the right of people to be “free from hunger” (Article 11.2), the right to the “enjoyment of the highest attainable standard of physical and mental health” (Article 12.1), and the “right of everyone to an adequate standard of living for himself and his family, including adequate food, clothing and housing, and to the continuous improvement of living conditions” (Article 11.1). Though this treaty is not easily enforced, it has political influence. Politicians would be hard pressed to publicly oppose a position that only demanded forbearance from infringing these basic rights. Indeed, in climate negotiations politicians have de facto supported this principle by not demanding the participation of the poorest countries in mitigation agreements [18].
2.3. Collective Requirements for Individual Entitlements
How do shared resources fit into this individualist view of basic needs? In our view, these are derivative requirements of individual rights, but not rights in and of themselves. The provision of the basic goods that comprise decent living standards may require the existence of institutions and infrastructure in a society in addition to the raw materials that fashion these goods. This is one motivation for a viewpoint that frames basic entitlements as “development rights,” which include economic, social and political entitlements to individuals, and a collective entitlement to a process of change that leads to the progressive realization of these individual rights [19]. The problem is that there is little theoretical guidance (and much political controversy) as to what types of institutions such a collective entitlement should entail, let alone how much energy (and by extension emissions) these entitlements require.
Our approach is more modest, and rests on the empirical observation that the realization of individual basic rights typically requires the use of shared economic resources and systems (such as electricity grids and road networks) to meet people’s basic needs. Most people—other than pure subsistence farmers—buy food and clothes in markets, go to public schools and receive health care in hospitals along with others. That these shared resources are not easily attributable to individuals, and vary by geography, level of development, and culture (among other factors) motivates their separate categorization as “collective entitlements” but also raises the challenge we explore in this paper of deriving them from individual entitlements.
3. A “Basic Goods” Approach
We define human entitlements to decent living for our present purpose in terms of the consumption of a specific bundle of “basic goods,” which we take to include both physical goods and services. This is in contrast to the capabilities approach, as discussed earlier, and to subjective approaches that view individuals’ preferences as necessary for defining well-being [20]. Our approach follows and builds on the minimalist basic goods approach of Kenneth Reinert, which appeals to both objectivist and subjectivist traditions and is particularly appropriate for assessing development policy [21].
The minimalist basic goods approach is consistent with the capabilities view because these basic goods can be thought of as material preconditions (the means) for more abstract functionings (the ends). Nussbaum does define a set of central human capabilities, which include physical health, but are otherwise relatively abstract [22]. Our approach is also consistent with subjective views because, with some exceptions, we expect that most people would want their basic needs satisfied. There is indeed evidence that people do “irrationally” choose harmful goods over those that are supposedly essential. For example, the extremely poor in India who earn less than $1/day and suffer from malnutrition spend a few percent of their income on festivals, tobacco, and intoxicants [23]. However, for the purposes of policy, and particularly the assessment of energy requirements, the share of income that people spend on these indulgences is so low, we expect that the material impact on energy will likely be negligible.
Our set of basic goods departs from Reinert’s by including not just those goods that are essential to meet physiological needs but also a select few that support these needs and whose inclusion is driven primarily by their universal appeal among non-essential consumer goods and their high energy needs.
The basic goods approach shares some aspects with the common use in the development and climate literature of a “poverty line” based on income as a basis for defining a moral threshold, though it also differs in important ways. We do use expenditure as a metric for several decent living activities, but we consider private and public expenditure where applicable, and we allow for differences across countries. A universal poverty line based on purchasing power parity (PPP) can implicitly assign different living standards in different countries, because PPP is a poor levelizer across countries when applied to just the basket of goods that the poor consume [24].
The specific goods and their justification are elaborated next.
3.1. What Constitute Basic Goods?
We consider decent living activities to include the consumption of the following goods and services: food, safe water and sanitation, shelter, health care, education, clothing, television, refrigeration and mobile phones. Food includes the means to cook at home, while shelter includes adequate space conditioning and lighting to make a home livable. Thus, direct energy use by households that enables households to cook food and enjoy the comfort of their homes is a derivative entitlement. We define this entitlement in terms of energy services, which entails that people have access to both modern energy and the appliances that provide these services. Another derived household entitlement is for transport services needed to attend school, visit health care facilities, and pursue livelihoods. In addition, we define a set of collective requirements for countries, which derive from the provision of basic goods to individuals. At a minimum, this includes the public infrastructure required to provide the basic goods and services (buildings for housing, hospitals and schools; utilities such as electric grids, water distribution systems and communications networks; and transportation systems such as roads, rail and vehicles).
The first four elements—food, safe water and sanitation, shelter, and health care—are widely accepted as physiologically motivated ‘basic needs’. Reinert refers to Griffin’s definition of basic needs “as what we need to survive, to be healthy, to avoid harm, to function properly” [25]. Along with education, these categories comprise the elements of other formulations of “basic needs” [21]. Clothing, while included in Universal Declaration of Human Rights (Article 25), is in fact not consistently present in detailed accounts of basic needs or poverty indices. Furthermore, the emissions for clothing relative to these other essentials is relatively small (3 percent or less) in most countries [26]. Therefore, on pragmatic grounds, we exclude clothing from our subsequent analysis.
The last three goods—television, refrigeration and mobile phones—are a departure from “basic needs”. However, we justify their inclusion because they have important health benefits, universal appeal, and are all part of the living standard indicators of the Multi-Poverty Index [27]. Refrigeration enables food and medicines to be preserved. Television viewing by women has been shown to enhance their health knowledge to the point of demonstrably reducing fertility levels [28]. This also makes it an educational tool, which would be consistent to include along with schools and other education-related goods. Mobile phones have been shown to provide quicker emergency medical response (where such care exists) and save lives. This makes them comparable to other elements of adequate health care services.
Refrigerators, televisions and mobile phones have steep penetration rates worldwide where they are affordable [29]. According to the World Bank, in developing countries across Africa and Asia, television is the first appliance after lighting that people acquire upon receiving electricity access [30]. Refrigerators are the next choice, and have a penetration of 94% among urban Chinese households [31], and virtually 100 percent in developed countries. Mobile phone penetration is concentrated more among high- and middle-income households in developing countries, but growth rates have been exponential, and an increasing share of new subscribers are from low-income households [32]. For example, between 2000 and 2005, penetration rates doubled in most developing regions, but tripled in sub-Saharan Africa [33].
It is worth noting that all of these basic goods are available and consumed in forms that resemble luxury goods. We aim to include only the most basic types of these goods that meet the standard of decent living. For instance, in regions where fans are inadequate to bring temperature and humidity to acceptable levels, air conditioning would be assumed necessary. However, gourmet food, cosmetic surgery and iPhones, for instance, would not count as basic goods. Finally, we re-emphasize that the above list of basic goods is not exhaustive, but rather a minimal set adequate for a first-order quantification.
4. Estimating a Decent Living Energy and Emissions Requirement
Embedded within this exercise is the task of estimating the minimum per capita energy requirement for providing people with decent living standards. Our focus is specifically to calculate “bottom-up” what decent living requires in terms of both direct and indirect energy, which to our knowledge has very few precedents. Moving from energy needs to emissions raises additional issues about how to treat countries’ fuel endowments and non-energy-related emissions. We don’t focus on these topics, but we do introduce the idea of a methane emissions threshold in recognition of the dependence of the poor on livestock for subsistence in many societies. In Africa and Asia respectively, methane emissions from agriculture accounted for 39 percent and 10 percent of GHG emissions in 2005 [34].
One challenge with defining a universal resource requirement is that people’s needs differ. In seeking aggregate estimates for countries, we aim to select activity levels that on average meet our definition of decent living standards. That qualification notwithstanding, our methodology does leave room for the possibility that these averages can differ by country.
4.1. Previous Work
In the climate literature, most recently Costa et al. estimate country-specific emissions requirements for achieving a human development index (HDI) threshold of 0.8 by extrapolating statistically estimated historical relationships between countries’ emissions and HDI [35]. They propose that countries should be exempt from mitigation until they reach this threshold. However, besides income the HDI covers only health and education, which neglect living conditions. Using an embodied emissions input-output analysis similar to ours, Druckman and Jackson estimate emissions associated with a “minimum income” standard for the UK in 2004 to be 17 tons CO2eq/household (~120 GJ/cap) [36]. The income level is derived from a “decent life” standard, which is based on social participation rather than on material needs. None of the previous burden-sharing proposals for climate mitigation that incorporate a moral threshold constructs it “bottom-up” from all its constituents. Chakravarty et al.’s threshold of one ton CO2eq focuses only on a minimum residential energy requirement [37]. Müller et al. use two tons CO2eq, based on the average of developing countries’ energy-related emissions rather than on moral grounds [38]. Baer et al. propose the most expansive threshold on the basis of a right to development, whose value ($20/day, or $7,500/year, PPP-adjusted) is intended to reflect a level of welfare beyond basic needs, but not affluence (a “safe” threshold that would in rare circumstances jeopardize basic needs). However, this figure is derived in part from the world average income, rather than from its constituent parts [12].

| Activity | Goldemberg et al. (1985) | Zhu/Pan (2007) | Druckman-Jackson (2010) | This Study |
|---|---|---|---|---|
| Geographic Scope | Universal | China | UK | Country-specific |
| Per capita Energy Rqmts (GJ/yr/cap) | 32 | 77 | 120 a | - b |
| Infrastructure build-out included | Y | Y | N | Y |
| Direct Energy—Household | ||||
| Cooking | X | X | X | X |
| Electricity | ||||
| Lighting | X | X | X | |
| Space cooling (fans) | X | X | ||
| Television | X | X | ||
| Mobile phones | X | |||
| Refrigeration | X | X | ||
| Space heating | X | |||
| Transport (motorized) | X | X | X | X |
| Primary (Embodied) Energy | ||||
| Food | X | X | X | X |
| Water | X | X | X | |
| Housing | X | X | X | |
| Health care | X | X | X | |
| Education | X | X | X | |
| Clothing | X | X | ||
| Other services | X | |||
| Primary (Embodied) Energy (Infrastructure Expansion) | ||||
| Utilities infrastructure | X | |||
| Electricity | X | X | ||
| Communication | X | X | ||
| Water/Sanitation | X | X | ||
| Transport | ||||
| Road | X | X | ||
| Rail | X | X | ||
| Buildings | ||||
| Hospitals | X | X | ||
| Schools | X | X | ||
| Residential homes | X | X | X | |
Categories marked X are included in the study. When spanning multiple cells, the relevant categories are included in aggregate form, but not broken down numerically; a Study estimates GHG emissions per capita of 17 tons CO2eq per household. Per capita energy has been backed out from this figure using the average emissions intensity of energy of 2.4 kg CO2/kgoe and average household size of 2.4 in the UK; b Not yet estimated. This study outlines an analytical framework for estimation.
Outside the domain of climate change, two studies have estimated comprehensive per capita energy requirements that include infrastructure build-outs, but are based on different premises and scopes (see Table 1 for a comparison). Goldemberg et al. proposed “one kilowatt” (32 GJ/cap) as a universal energy allocation to meet basic human needs and allow for additional growth [39,40]. The authors derive this figure from the relationship between an average quality of life index and income growth. They calculate that individuals would require 500 W per capita, and assume, rather than estimate, the indirect energy requirements, including for infrastructure expansion, to be double that amount. Zhu and Pan estimate a minimum energy requirement of ~80 GJ/cap to meet a decent living standard in China [41]. They conduct a bottom-up activity-based account of basic needs, using life-cycle analysis to estimate the energy intensities of activities, but often rely on material needs from European countries as a basis for their estimates. Finally, Smil uses broad correlation between human development indicators and energy use to suggest that societies typically need no less than 50–70 GJ/cap to provide basic rights and opportunities [42]. But this estimate does not consider the need for an infrastructure build-out.
Other studies estimate direct energy requirements (for cooking and appliances) for households, based on “engineering approaches” that build up the energy requirements from technology characteristics and typical household consumption patterns [43]. However, many of these studies focus less on normative judgments about what constitute basic needs than on accounting for regional and income-dependent conditions that affect energy use. Furthermore, we suggest including the indirect energy requirements associated with providing energy services of a certain standard (e.g., reliability of supply), which these other studies neglect.
4.2. Our Conceptual Approach and Scope
As mentioned, we separately calculate development emissions (the one-time “stock” of emissions required to bridge the infrastructure gap and provide all citizens with access to decent living standards) and maintenance emissions (the annual “flow” of emissions required to operate the systems that support decent living activities) using the same bottom-up methodology. We assess per capita energy requirements as the sum of direct household energy use and the embodied energy use in other decent living activities. We use a subset of the well-known IPAT identify to translate economic activities into indirect energy and then emissions (see Table 2) [44].

With the exception of direct energy use in households to cook and power appliances, all other “activity levels”, or quantities, of basic goods shown in Table 2 are translated into expenditures, either private of public, which represent final demand in the parlance of national accounts. The expenditure levels for a given activity may differ within countries, due to heterogeneity in prices, population density (which matter for infrastructure requirements) or other conditions. In the least, it may be important to separately determine and then aggregate the expenditure levels for urban and rural areas, and to take into account the rate of rural to urban migration.
| Basic Goods | Derived Demand | Standard for Decent Living |
|---|---|---|
| Food | Adequate Nutrition | |
| Cooking Energy | ~2 MJ/cap/day a, Gas b | |
| Methane | -c | |
| Water/ Sanitation | ~50l potable/per cap/month, HH d access to latrine/flush | |
| Shelter | Floor space | ~10 m2/cap |
| Lighting | ~100 Lumens/m2 | |
| Space Conditioning | (20–27°C) | |
| Health Care | 70 yr Life Expectancy | |
| Education | - | |
| Clothing | - | |
| Television | Electricity | ~100 kWh/month/HH (for all appliances) e |
| Refrigerator | Electricity | |
| Mobile phone | Electricity | |
| Mobility | Vehicle | Motorized |
a Useful energy; b LPG or biomass gasifier; c Not estimated yet; d HH: Household; e Example for Indian conditions; Actual value would vary with local requirements. See text for details.
The embodied energy can be estimated using this final demand based on energy input-output analysis, which captures energy used in production based on the current technological and structural characteristics of economies. This is a standard and widely used approach in estimating household energy use, and is well suited to capture country-specific determinants of energy intensity, as discussed further in Section 4.5. It has the advantage over “top-down” statistical approaches of not being limited to existing aggregate indicators and enabling estimates based on custom specifications for decent living conditions. The benefit of using energy input-output over life-cycle analysis to estimate energy use is having available in national accounts the comprehensive indirect energy needed for producing decent living goods and services. The data on these energy intensities of activities are available for 112 countries through the Global Trade Analysis Project (GTAP), which contains a database of country input-output tables that incorporate international trade and energy flows. This means that the calculated consumption energy intensities would include energy intensities of imports.
However, notwithstanding these benefits, there are a few downsides of using this approach. Energy input-output analysis captures only a snapshot of the economy. Multi-year projections would require dynamic simulation in order to capture technological trends, and its long-term application in a treaty regime would necessitate periodic recalculations. Despite the availability of GTAP, the data requirements for this exercise are extensive, particularly for determining the infrastructure gap within countries. International data sources, such as the World Development Indicators, provide a good start, but would need to be supplemented by within-country data sources.
We also focus this analysis on developing countries, since that is where the stakes are highest for granting ‘carbon space’ for development. This focus makes the infrastructure build-out component assume greater significance. Defining such a threshold for developed countries is nevertheless important as well and raises additional moral and practical challenges. However, we set these aside for future consideration.
4.2.1. Universal Entitlements, Country-specific Energy Requirements
We define universal indicators of well-being, but propose country-specific requirements for energy. There is compelling evidence to suggest that energy consumption characteristics for broadly comparable goods and services are unique to countries, and do not exhibit universal patterns of variation [45]. But this approach has trade-offs. Using country-specific consumption data accounts for structural (e.g., manufacturing share of GDP), institutional (e.g., markets and subsidies) and cultural determinants of energy use, but runs the risk of letting countries ‘off the hook’ by not requiring them to exploit viable opportunities for energy efficiency (“no regrets”). As we discuss in Section 4.5, we suggest using existing energy intensities as baselines and imposing comparative benchmarks in specific sectors for encouraging energy efficiency.
Finally, our scope here is largely conceptual, and the purpose of the subsequent elaboration is illustrative and exploratory. For both maintenance and development emissions, we have selected a few of the constituent basic goods that cover the important estimation challenges that we foresee. In particular, we focus on food, household energy, transport and health care for maintenance emissions, and on residential and hospitals buildings and electricity grid expansion for development emissions.
4.3. Maintenance Emissions: Estimating Annual Energy Needs
Maintenance emissions refer to the annual, recurring emissions associated with the production and consumption of basic goods and services, and the operation of the infrastructure used to provide them.
4.3.1. Food
Food comprises up to 20 percent of households’ indirect energy use in developed countries [46,47] but over 40 percent in developing countries [48,49]. Food is also the bulk of what low-income households spend their money on. We suggest here that the food expenditure associated with an income elasticity-based income threshold (proxied by household expenditure) could serve as a reasonable basis for a food adequacy norm. A calorie-based norm for defining minimum dietary requirements, as used by Goldemberg et al. and Zhu and Pan, does not account for a balanced diet. In India, for example, at low income levels calorie-sufficient diets (by their standard) comprise almost entirely cereals (e.g., grains) and cereal substitutes. As household expenditures rise, the calorie intake from cereals plateaus, and that of other food groups increase. However, with rising expenditure, at some point the consumption of these non-cereal foods reflects discretionary expenditure beyond that required for a well-balanced diet.
One way to identify this threshold is from the income elasticity of total food expenditure. Globally, low income countries tend to have a higher elasticity of these goods to total expenditure than wealthier countries [50]. In India, the income elasticity of food expenditure rises with increasing total expenditure at the lowest expenditure levels and then flattens thereafter. The leveling off can be interpreted as representing diminishing utility of further expenditure. If this pattern holds in other developing countries (which seems to be the case in Brazil, as seen in [51]), then the expenditure level where income elasticity of food expenditure levels off could serve as reasonable parameter with which to define a food sufficiency norm.
Since these estimates are country-specific, for a given expenditure the resulting per capita energy and emissions may vary with lifestyles, culture, climate and other factors that determine food consumption baskets. If these influences are substantial, this would raise further questions of what lifestyle choices ought to be subject to normative judgments about their importance for decent living. For instance, comparing India and Brazil from the above-mentioned country studies gives threshold food-related energy values of 3.5 GJ per capita in India, and 2 GJ per capita in Brazil [52]. However, if one considers total food-related GHG emissions, the average Brazilian’s exceeds that of the average Indian’s by one ton, which is explained largely by the almost five-fold difference in their per capita food-related methane emissions [53]. This highlights the importance of meat consumption, which is the critical difference between Indian and Brazilian diets, and one of the most pertinent lifestyle choices concerning climate change. Notably, the energy intensity of meat-intensive diets is not substantially higher than non-meat diets (see Section 4.5).
Should Decent Living Emissions Include a Methane Minimum?
Methane emissions from agriculture can exceed total national carbon dioxide emissions in poor countries by up to factors of 4 to 5 in very poor countries such as Cambodia and the Congo, and are between 40 and 90 percent in meat-eating cultures in Latin America. Agricultural methane emissions come primarily from livestock, which provide mechanical power (e.g., for irrigation), dairy products, and meat. Of these, meat consumption is the fastest-growing, but also most debatably an essential food item.
Meat consumption is driven both by income and cultural preferences. The former suggests it is a discretionary expenditure, while the latter suggests that it may be an essential part of even low-income diets. Consider that the correlation between GDP and meat consumption (per capita) is 78 percent at a national level [54]. But, on a per capita basis, Vietnam has a lower GDP but almost six times the meat consumption of India, while Turkey has twice the GDP of China, but a little more than a third of its meat consumption. In Latin American countries as well, meat is an essential element of diet at all income levels.
Given that methane emissions are comparable (in CO2 equivalent terms) to food-related CO2 emissions, methane emissions, like energy emissions, may be a candidate for an exemption threshold. What level such a threshold should be demands further empirical analysis of livestock production and consumption in poor societies.
4.3.2. Household Energy
Household energy use includes direct energy for space heating and cooling to keep homes within acceptable comfort levels, cooking energy to cook food and heat water for ablutions, and electricity for lighting and powering appliances. Space conditioning energy requirements can be calculated “bottom-up” from the required heating degree days and cooling degree days relative to an acceptable temperature range or from empirical surveys of actual energy use. However, air conditioning should be included in basic goods only if acceptable comfort levels cannot otherwise be attained. Some studies show that with fans, ventilation and minor adaptations, such as clothing, humans are comfortable in a range of 20–27 °C in tropical climates, with the optimal temperature being proportional to the outside temperature [55]. Space heating needs for developing countries range widely. For instance, they are negligible in countries located near the equator, such as India [48], but as high as 15 GJ/cap for China, as calculated by Zhu and Pan [41]. Households should have access to modern gas-based stoves for cooking to avoid the adverse health impacts of traditional solid fuel stoves. Van Ruijven et al. find that households’ cooking energy clusters around 1.7–2.7 MJ/day per household in India [56]. Taking 2 MJ as a baseline, households would require about 5 GJ/capita/year of cooking fuel. Lighting needs can also be determined based on floor space and acceptable illuminance standards, such as those set by the U.S. Illumination Engineering Society of North America (IESNA) for homes. The main novelty of our approach is to assess energy needs on the basis of minimum acceptable standards for household energy delivery. This represents a departure from literature for electricity, which we therefore describe below.
Electricity Supply
We suggest two departures from previous estimates of electricity requirements for household energy appliances:
- Electricity services for “minimally decent living” should be limited to lighting, fans or air-conditioners (where necessary) for space cooling, refrigeration, television and mobile phones. As one reference, we estimate an average of 100 kWh per month for an average Indian household [57].
- Decent living requires electricity to be provided with a minimum level of reliability and quality, whose energy requirements have not been previously assessed.
The second point requires some elaboration. Based on a World Bank survey of 55 developing countries, consumers on average experience 30 days of cumulative supply interruptions per year [58]. These outages have numerous quantifiable and unquantifiable impacts on livelihoods, economic growth and quality of life. These real conditions under which people receive electricity “access” reveal the sobering gap in electrification today—even the staggering figure of 1.4 billion who lack any electricity access according to the International Energy Agency [59] is a gross underestimate of the real gap. Poor power quality, such as regular drops in frequency, low power factors and power surges all cause untold amounts of equipment failures in countries with poor electricity grid infrastructure, which also is a drag on economic growth and human development. To a large extent, these service conditions reflect underinvestment in the electricity grid, both in supply, and more importantly in transmission and distribution. Poor distribution system design and inadequate maintenance contribute to long outages, particularly in regions served by common grids with high heterogeneity in supply reliability.
There are rules of thumb for the proportions in which over time developed countries invest in generation, transmission and distribution in a fully developed grid (i.e., not counting the build-out requirements to provide access to areas without electricity). For instance, the IEA estimated that North American and European countries spend on transmission and distribution (T&D) about 50 and 75 percent respectively of what they invest in generation. In comparison, India spent about 45–60 percent in 2007–2009, but this includes grid expansion for the 40 percent of the country that still lacks electricity access [60]. This rule of thumb can be used as a proxy for the shortfall in countries’ upkeep of their electricity grid.
4.3.3. Transport (Household)
Transport energy needs derive from the mobility requirements of households to perform decent living activities. The maintenance energy/emissions from freight transport are accounted for in the calculation of embodied energy use from the decent living activities. With growing income, countries consistently show an increase in private vehicle ownership and average distance traveled [61]. Transport contributed 22 percent of global CO2 emissions in 2008 [62]. In contrast, in India transport contributed only 7 percent of emissions. This difference arises in part due to the fact that a quarter and over half of trips in urban and rural India respectively are non-motorized. Non-motorized transport is time-consuming and reduces the leisure and productive time available to households. Thus while we don’t disparage the importance of making non-motorized transportation, such as bicycling, safer and healthier, we still suggest that decent living requires that all households have access to a motorized form of transport. Besides this stipulation, we see no well-established basis to define a universal standard for transport energy use.
Transport energy use depends additionally on the energy intensity of activity, which depends on the shares of motorized modes in transport activity, and the fuel types and efficiencies for each mode. Two key normative questions for these categories are: how much of the explosive growth in private vehicles in emerging economies is necessary for decent living; and to what extent would better urban planning, more efficient engines and cleaner fuel types provide enough local co-benefits to justify their inclusion in “business-as-usual” development plans? These choices are of practical significance. According to the IEA, transport energy can be reduced by more than half in aggressive scenarios of such energy intensity-reducing policies [63].
We see no guidance in literature to make these judgments. As a point of reference, Zhu and Pan estimate the transport energy requirements for basic needs in China to be ~7.2 GJ/cap (including ~1.9 GJ from indirect energy) based on current conditions, where over 80 percent of passenger travel is by public transport, and private travel is ~6700 km/year/cap. In contrast, in Japan, which has among the least energy intensive transport sectors among OECD countries, people average 10,000 passenger-km, and use 17 GJ/cap [64]. These two estimates could serve as reasonable bounds on a decent living energy requirement.
4.3.4. Water and Sanitation
Water has arguably been accorded the status of a human right by international law and institutions [65]. Gleick estimates that people ought to have 50 liters of water per person per day to account for all their needs, for drinking, cooking and ablutions [66]. In 1990, there were 55 countries totaling over a billion people, who on average did not meet this requirement. Even with regards to basic access, 1.1 billion people lacked access to safe (disinfected) water supply in 2004, and 2.6 billion people lacked access to sanitation facilities [67].
We therefore suggest that for decent living every household have access to 50 liters per day per person of safe water supply in-house or from a yard tap, and access to in-house sanitation facilities. This is consistent with the standard set by the MDG. The expenditure required to achieve this standard, however, would have to be determined on a per country basis. The cost of providing water varies widely by region and type of institutional provider. A survey of 47 countries by the World Bank shows that average costs per m3 of water delivered to households varies by a factor of 10 between that provided by utilities over distribution systems and that provided by small-scale vendors with tankers and carts [68]. Even for a particular institutional form, average costs vary by up to a factor of two across regions. Since utility distribution systems are prevalent in urban areas, one approach to developing country-level estimates is to calculate a weighted average of utility-based costs for urban areas, and community system-based costs for rural areas, but to include only those systems that provide safe water. A similar approach can be applied for sanitation, since urban areas may be better suited to sewage distribution systems with centralized treatment facilities, while in rural areas household septic tanks or pit latrines with slabs can provide “improved” sanitation conditions.
4.3.5. Health Care
Providing a minimum level of medical and public health services is an integral part of meeting a universal standard of good health. We suggest that a life expectancy of 70 years is a reasonable metric to use as a basis for determining the energy requirements for providing decent health care. Life expectancy at birth is a widely used metric to represent the health standards of a society. It is a part of the Human Development Index, and other multi-dimensional poverty indices. It is also highly correlated at the national level (93 percent) with infant mortality [69], whose reduction is one of the primary targets of the MDG. There are no developed countries that have life expectancies below 70 years, including countries that arguably have or will soon qualify for that status, such as Malaysia, Mexico and China. This particular age level also seems to reflect an inflexion point with respect to the value of total expenditure on health care.
We find that at a national level life expectancy is strongly correlated with absolute health expenditure up to about 70 years, after which gains in mortality diminish almost completely (Figure 1).
Figure 1.
Health sector expenditure vs. life expectancy by country. Data source: World Development Indicators, World Bank 2011 (Logarithmic trend line shown) [70].
Figure 1.
Health sector expenditure vs. life expectancy by country. Data source: World Development Indicators, World Bank 2011 (Logarithmic trend line shown) [70].
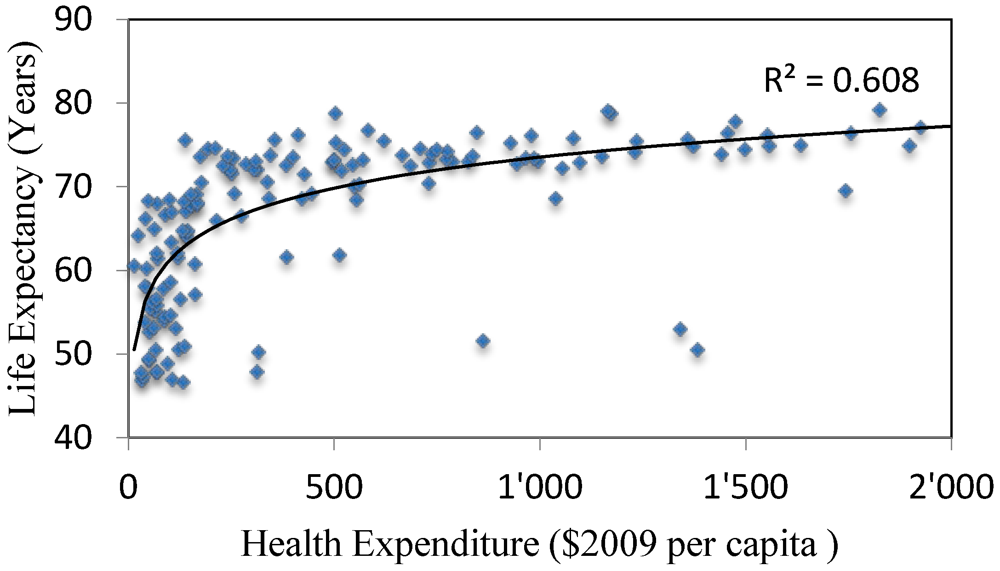
In contrast, expenditure as a share of GDP (including public and private) does not exhibit any discernible trend. This seems intuitive for social institutions such as health and education, since the demands arise from the number of people and less from the level of economic activity, unlike physical infrastructure. The expenditure level associated with this inflexion point is roughly $175 (PPP 2005) per capita. With the exception of Syria, no country with life expectancy higher than 70 years spends less. As a practical check, this threshold works out to just under China’s expenditure on health, and over four times that of India. That the average Chinese is expected to live over 73 years, while the average Indian only 64, seems to be bear out this relationship.
4.4. Development Emissions—Measuring Infrastructure Gaps
The infrastructure build-out can be separated into buildings, utilities (water, electricity, and communications), transport-related (roads and rail) and the manufacture of household appliances [71]. These can be amortized into annual emissions based on their lifetimes. Each requires different estimation approaches, due to their usage characteristics and available data. Appliances are the most straightforward, since their emissions can be derived from household expenditure on durables. There are few empirical or theoretical guides for estimating the growth in infrastructure stock for economies in general, but a few studies that project infrastructure needs for developing economies, including for the goal of achieving universal energy access, can be used to develop initial estimates. However, far less attention has been paid to building stocks. Here, we set aside appliance manufacturing, briefly discuss how to use other estimates of infrastructure investment, and suggest bottom-up approaches for deriving the demand for buildings.
4.4.1. Buildings
Buildings are typically dedicated to specific activities, and therefore can be directly attributed to, or derived from, decent living activities. The relevant building stock minimally includes adequate housing for all, and the commercial buildings required to support decent living activities, such as hospitals, schools, public administration, factories and stores. We illustrate this for residential buildings and for health care. Further research is required to determine the required stock of other types of buildings.
Residential Buildings
At a minimum, people ought to live in homes that are secure enough to insulate them from inclement weather, and that have enough space to lead uncramped lives. The former implies homes built with permanent construction. The latter is a subjective judgment, and therefore best guided by people’s own choices. In India, for example, rural households in the lowest and highest quintiles had average floor spaces of about 4 and 10 m2 per capita respectively in 2002 [56]. The upper end of this range could reasonably represent house sizes with which people are satisfied. On this basis, India would need to build about 4 billion square meters of permanent structures to house the 400 million people who lived in semi- or non-permanent housing in 2005–2006. Based on one estimate of the emissions intensity of very low-cost housing construction [72], this would require 1.9–2.4 tons per capita, or a total of about 800 million to 1 billion tons of CO2 emissions [73]. This is equivalent to 55–70 percent all of India’s CO2 emissions in 2007.
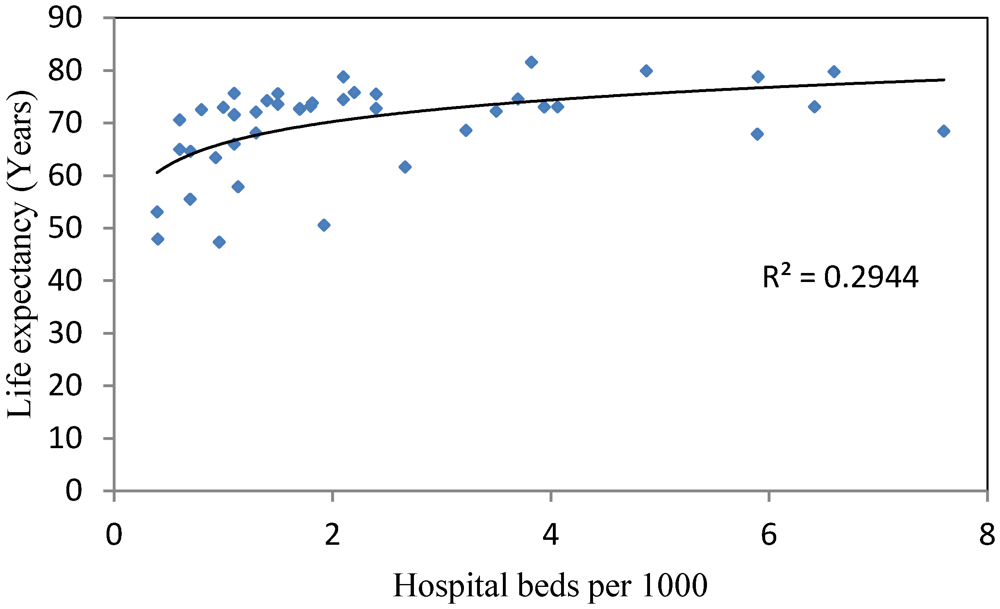
Hospitals
The maintenance energy calculated above for the health care sector is based on health care expenses in developed countries, which already have a mature stock of infrastructure for health care. This expenditure figure may include costs associated with capital turnover or maintenance, but as mentioned, this expenditure is not a sufficient condition for improving life expectancy, in part because of the need for adequate physical infrastructure, such as hospitals, qualified physicians, and medical equipment. Of these, an adequate number of hospitals arguably would be required to enable increases in life expectancy, and would also entail energy-intensive construction. Figure 2 shows the association between life expectancy and the number of hospital beds per person in a number of countries. Though sparse, this does show some correlation that levels off somewhere between 1 and 3 beds per 1000 people. An even higher threshold may be desirable if one considers other metrics of a healthy society, such as infant mortality or premature deaths. The world average is nearly 4 beds per 1000 people (which is less than China’s average of 4.1 beds).
Figure 2.
Hospital beds vs. life expectancy by country. Data source: World Development Indicators, World Bank 2011 (Logarithmic trend line shown) [70].
Figure 2.
Hospital beds vs. life expectancy by country. Data source: World Development Indicators, World Bank 2011 (Logarithmic trend line shown) [70].

Just as with residential housing, based on the construction footprint of hospitals and an average floor space per hospital bed, the energy requirements of bridging the infrastructure gap in the number of hospitals can be estimated for individual countries.
4.4.2. Utility and Transport Infrastructure
The infrastructure requirements for decent living can also be estimated from projections of infrastructure investment needs in developing countries by international agencies such as the World Bank. The physical infrastructure can be separated into the “shared” networks that serve industry and overall economic demand growth, and the “last mile” connections that serve households. Estimates of infrastructure needs in the literature tend to be of two kinds: either “top-down”, economy-wide projections of infrastructure investment needs for business-as-usual demand growth; or “bottom-up” studies that estimate the costs of universal access to specific services. The former do not isolate economic activity related to decent living, but they are also based on business-as-usual rather than ideal demand. There are thus elements of both over- and under-estimation. The latter do estimate the costs of universal access, but typically focus only on the last mile. Below we suggest how these might be combined to yield estimates that provide a reasonable bound on these required investments.
Top-down projections are expressed as the monetary investments (rather than physical stock) required to meet future income growth and demand. For instance, the World Bank in 2004 estimated that low income countries would have to increase their infrastructure investments from 4 percent of GDP to 7.5–9 percent over a five-year period (2005–2010), while middle income countries would need to increase theirs from 2.9 percent to 5–5.7 percent [74]. These estimates derive from extrapolations of econometrically derived relationships between infrastructure investments and GDP growth. About half of this expenditure would be required for maintenance and refurbishment, and the other half for expanding the infrastructure stock. One way to carve out the infrastructure needs for decent living from these estimates is to assume that the latter would require a share of these investments proportional to the share of total consumption comprised by decent living activities. In effect, this assumes that the infrastructure elasticity of income for basic needs is the same as the overall economy. There is to our knowledge no empirical evidence that suggests otherwise.
These adjusted estimates of decent living infrastructure for part of the population can then be added to “last mile” investment estimates for universal access, where available. The latter are more readily available for electricity than for other utilities or transport [58]. Further research is necessary to determine how historical patterns of investment in emerging economies, such as China and other East Asian economies, can shed light on these data gaps.
4.5. Energy Intensities of Decent Living Activities
One normative question about defining energy requirements for decent living concerns whether and how much developing countries need to increase their energy use as they industrialize, and about how much they can be expected to discipline this growth without external support. Here we suggest one relatively transparent method of managing both types of considerations is to start with country-specific baselines for energy intensity, and incrementally impose sector-level standards.
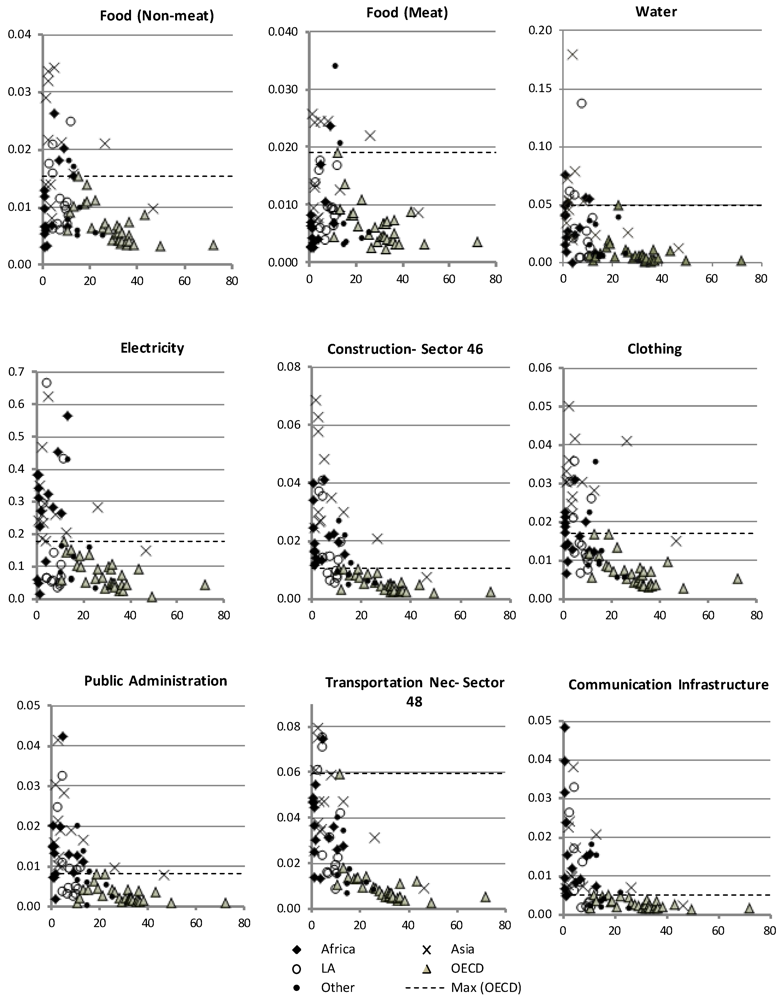
As a general trend, energy intensities of economies decrease with time and with increasing income. This can be seen in the intensities for sectors relevant to decent living activities, which show some convergence with increasing income (Figure 3). But economy-wide energy intensities vary widely across countries, by up to a factor of five, and do not correlate well with income. Data from the World Development Indicators for 2007 shows a −45% correlation between countries’ GDP and energy intensity. Although developed and developing countries tend to dominate the lowest and highest percentile groups respectively, there is significant overlap in between (Figure 4). One does see that energy intensities vary more widely among developing countries than among developed countries, as do changes over time (Figure 4). The direction of these changes, however, is not consistent. While most countries seem to have decreased their energy intensities between 1997 and 2007, many countries from both groups saw an increase. The factors underlying these shifts are many, but in developing countries structural changes in the composition of the economy explain some of this inconsistency [75]. Energy intensities also vary by up to a factor of three for households with similar income levels in different countries [45]. These differences arise from different geographic and climatic conditions, population density, culture and lifestyle, structure of economies, energy prices and labor intensity, and other factors.
Figure 3.
Embodied energy intensity of select sectors by country 2007 (GJ/PPP$-Yaxis) vs. GDP (PPP$000)/capita. Data source: Global trade Analysis Project (GTAP) pre-release v8, obtained from Chen & Chen (2011) [76]. Graphs show 80 out of 112 countries provided. Countries (Central Asian and some African) have been omitted due to data gaps or anomalies. Public Administration includes health and education.

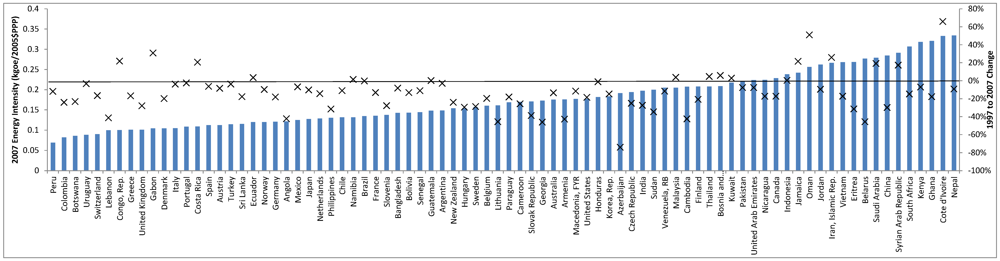
Figure 4.
Selected country energy intensities 2007 (bars). Percent changes from 1997 also shown (crosses). Source: World Development Indicators, World Bank [70]. Note: Countries with energy intensities above 0.5 kgoe/$2005PPP have been omitted to better present the data (Nigeria, Belarus, Russian Federation, Ethiopia, Kazakhstan, Zambia, Moldova, Azerbaijan, Ukraine, Mozambique, Congo, Dem. Rep., Uzbekistan, Turkmenistan).

All these facts provide a strong argument that decent living energy requirements should be country-specific, and little basis for a “universal” energy intensity standard. As mentioned, this raises a concern about how to encourage energy efficiency improvements, particularly those that are economically profitable (“no regrets”). We suggest that energy intensity reductions in developing countries may be better encouraged by identifying benchmarks for convergence in specific sectors instead. Focusing on sectors more directly captures energy efficiency potential. Such a method has been proposed before [77]. However, the rates of convergence to these benchmarks need to factor in countries’ development conditions, as well as technology access and costs. Measuring efficiency in terms of energy intensity per unit expenditure ( as opposed to per unit output) may also complicate comparisons, as economy-wide PPP adjustments may not accurately reflect price variations across countries of inputs in specific sectors. Designing such comparative benchmark and convergence policies therefore requires further research, which is outside the scope of this study.
5. Concluding Remarks
We have argued that there is a compelling case for identifying and quantifying activities of “decent living” that should be exempted from mitigation obligations under a fair climate regime. Further, there are reasonable bases for estimating the aggregate energy requirements for a country to provide citizens with this living standard using energy input-output analysis. We have suggested various normative standards and methods of identifying the levels of private or public expenditure that reflect these standards for each good in a country. We suggest rules of thumb for estimating the investment gap in infrastructure, and for residential buildings and hospitals. However, there is limited guidance in the literature on relating other basic goods more directly to their underlying supporting infrastructure. More empirical research is required in this area.
The most important suggestion from this study is that universal standards for decent living translate to country-specific energy entitlements. This is driven by empirical conditions related to structural, cultural and other country-specific determinants of both living standards and energy intensity. However, since we have not estimated final per capita energy requirements for countries, we are not in a position to judge whether these differences are material. We propose sector-specific energy intensity targets to ensure that states are encouraged to pursue energy efficiency opportunities. Further research is required to determine appropriate convergence criteria for different countries that offer both comparable incentives for improvement and concessions for technological and economic conditions. A further novelty of this study is to propose a methane emissions entitlement for agricultural activities. Further work is required to determine the conditions under which meat consumption is unavoidable, and an appropriate methane emissions threshold.
Defining country-specific emissions entitlements could have far-reaching implications for a climate regime. Other proposals that define individual entitlements define equal income-based or emissions entitlements, but in doing so they may mask the extent to which individuals are comparably accounted for across countries. In constructing people’s energy and emissions requirements “bottom-up” from a universal set of normative criteria, we make this accounting transparent. We conceive of these entitlements as enumerating an exemption from countries’ mitigation obligations. The total exempted decent living emissions can be incorporated into a burden-sharing regime in a number of ways, such as by subtracting them from countries’ emissions that would otherwise be subject to mitigation. The material impact of this adjustment on countries’ mitigation obligations would depend on other allocation criteria and the stringency of a global emissions cap, if any. Countries should also be encouraged to reduce the actual emissions associated with basic goods where doing so does not compromise their benefits.
We have raised many issues that merit further exploration and research. We hope that our effort will encourage others to delve into these questions, and to help move the discussion on “the right to sustainable development” beyond rhetoric.
Acknowledgements
We are grateful to Chen Zhan-Ming for sharing GTAP data and to Shripad Dharmadhikari and Krutuja Bhosale for their help with the figures.
References and Notes
- Principle 4, Article 3 of the UN Framework Convention on Climate Change. Available online: http://unfccc.int/key_documents/the_convention/items/2853.php (accessed on 5 January 2012).
- Agarwal, A.; Narain, S. Global warming in an unequal world: A case of environmental colonialism. Earth Isl. J. 1991, Spring, 39–40. [Google Scholar]
- BASIC experts, Equitable Access to Sustainable Development: Contribution to the Body of Scientific Knowledge; BASIC Expert Group: Beijing, China, 2011.
- We are conducting a follow-up study that will quantify a comprehensive energy and emissions requirement for a few select countries based on the methodology described here.
- Caney, S. Climate change, human rights and moral thresholds. In Human Rights and Climate Change; Humphreys, S., Ed.; Cambridge University Press: Cambridge, UK, 2009. [Google Scholar]
- Alkire, S. Dimensions of human development. World Develop. 2002, 30, 181–205. [Google Scholar]
- Stiglitz, J.; Sen, A.; Fitoussi, J.-P. Report by the Commission on the Measurement of Economic Performance and Social Progress; Commission on the Measurement of Economic Performance and Social Progress: Paris, France. Available online: www.stiglitz-sen-fitoussi.fr (accessed on 30 October 2012).
- Shue, H. Basic Rights: Subsistence,Affluence and U.S. Foreign Policy; Princeton University Press: Princeton, NJ, USA, 1980. [Google Scholar]
- Shue, H. Subsistence Emissions and luxury emissions. Law Policy 1993, 15, 39–59. [Google Scholar]
- Buchanan, A. Justice, Legitimacy, and Self-Determination: Moral Foundations for International Law; Oxford University Press: Oxford, UK, 2004. [Google Scholar]
- Hayward, T. Human Rights versus emissions rights: Climate justice and the equitable distribution of ecological space. Ethics Int. Aff. 2007, 21, 431–450. [Google Scholar] [CrossRef]
- Baer, P.; Athanasiou, T.; Kartha, S.; Kemp-Benedict, E. The Greenhouse Development Rights Framework: The Right to Development in a Climate Constrained World; Heinrich Böll Foundation: Berlin, Germany, 2008. [Google Scholar]
- Rosen, F. Basic needs and justice. Mind 1977, 86, 88–94. [Google Scholar]
- Caney, S. Justice and the distribution of greenhouse gas emissions. J. Glob. Ethics 2009, 5, 125–146. [Google Scholar]
- Sen, A. Capabilities and well-being. In The Quality of Life; Nussbaum, A., Sen, M., Eds.; Oxford University Press: Oxford, UK, 1993. [Google Scholar]
- Nussbaum, M.C. Women and Development: A Capabilities Approach; Cambridge University Press: Cambridge, MA, USA, 2000. [Google Scholar]
- Satz, D. The idea of justice: What method? Which capabilities? Rutgers Univ. Law J. 2012, in press. [Google Scholar]
- Ringius, L.; Torvanger, A.; Underdal, A. Burden sharing and fairness principles in international climate policy. Int. Environ. Agreements Polit. Law Econ. 2002, 2, 1–22. [Google Scholar]
- Andreassen, B.A.; Marks, S.P. Development as a Human Right: Legal, Political and Economic Dimensions; Harvard University Press: Cambridge, MA, USA, 2006. [Google Scholar]
- Streeten, P. Basic needs: Some unsettled questions. World Dev. 1984, 12, 973–978. [Google Scholar]
- Reinert, K.A. No small hope: The basic goods imperative. Rev. Soc. Econ. 2011, 69, 55–76. [Google Scholar]
- Nussbaum’s central capabilities are life, bodily health, bodily integrity, senses, imagination, and thought; emotions; practical reason; affiliation; other species; play; and control over one’s environment [Nussbaum, M.C. Women and Development: A Capabilities Approach; 2000; Cambridge University Press: Cambridge, MA, USA. [Google Scholar]].
- Banerjee, A.V.; Duflo, E. The economic lives of the poor. J. Econ. Perspect. 2007, 21, 141–167. [Google Scholar]
- Pogge, T.; Reddy, S.G. Unknown: The extent, distribution, and trend of global income poverty. Econ. Polit. Weekly 2006, 41, 2241–2247. [Google Scholar]
- Griffin, J. Well-Being: Its Meaning, Measurement, and Moral Importance; Oxford University Press: Carendon, SC, USA, 1986. [Google Scholar]
- Hertwich, E.G.; Peters, G.P. Carbon footprint of nations: A global, trade-linked analysis. Environ. Sci. Tech. 2009, 43, 6414–6420. [Google Scholar]
- Oxford Poverty and Human Development Initiative. Available online: http://ophi.org.uk/ (accessed on 31 January 2012).
- Impact Assessment Group, Welfare Impacts of Rural Electrification: A Reassessment of the Costs and Benefits; The World Bank: Washington, DC, USA, 2008.
- Note that washing machines have comparable penetration rates. However, we do not include them in basic goods because they can be used as shared facilities (e.g., laundromats) or (pace Mrs. Rosling) substituted by manual labor. They also do not have comparable health benefits as refrigerators.
- Energy Sector Management Assistance Programme, Energy Services for the World’s Poor; The World Bank: Washington, DC, USA, 2000.
- National Bureau of Statistics, China Statistical Yearbook; China Statistics Press: Beijing, China, 2009.
- Hammond, A.L.; Kramer, W.J.; Katz, R.S.; Tran, J.T.; Walker, C. The Next 4 Billion: Market Size and Business Strategy at the Base of the Pyramid; World Resources Institute: Washington, DC, USA, 2007. [Google Scholar]
- World Bank, Information and Communications for Development: Global Trends and Policies; World Bank: Washington, DC, USA, 2006.
- Climate Analysis Indicators Toolkit, World Resources Institute.
- Costa, L.; Rybski, D.; Kropp, J.P. A human development framework for CO2 reductions. PLoS One 2011, 6, e29262. [Google Scholar]
- Druckman, A.; Jackson, T. The bare necessities: How much household carbon do we really need? Ecol. Econ. 2010, 69, 1794–1804. [Google Scholar] [CrossRef] [Green Version]
- Chakravarty, S.; Chikkatur, A.; de Coninck, H.; Pacala, S.; Socolow, R.; Tavoni, M. Sharing global CO2 emission reductions among one billion high emitters. Proc. Nat. Acad. Sci. USA 2009, 106, 11884–11888. [Google Scholar]
- Müller, B.; Höhne, N.; Ellermann, C. Differentiating (historic) responsibilities for climate change. Clim. Policy 2009, 9, 593–611. [Google Scholar]
- Goldemberg, B.Y.J.; Johansson, T.B.; Reddy, A.K.N.; Williams, R.H. Basic needs and much more with one kilowatt per hour. Ambio 1985, 14, 190–200. [Google Scholar]
- Goldemberg, B.Y.J.; Johansson, T.B.; Reddy, A.K.N.; Williams, R.H. Energy for a Sustainable World; Wiley Eastern Ltd.: New Delhi, India, 1987; p. 211. [Google Scholar]
- Zhu, X.; Pan, J. Energy Requirements for Satisfying Basic Needs: China as a Case for Illustration; Chinese Academy of Social Sciences: Beijing China. Available online: www.basic-project.net/ (accessed on 20 January 2012).
- Smil, V. Energy at the Crossroads: Global Perspectives and Uncertainties; The MIT Press: Cambridge, MA, USA, 2003. [Google Scholar]
- Pachauri, S.; Müller, A.; Kemmler, A.; Spreng, D. On measuring energy poverty in Indian households. World Dev. 2004, 32, 2083–2104. [Google Scholar]
- Ehrlich, P.R.; Holdren, J.P. Impact of population growth. Science 1971, 171, 1212–1217. [Google Scholar]
- Lenzen, M.; Wier, M.; Cohen, C.; Hayami, H.; Pachauri, S.; Schaeffer, R. A comparative multivariate analysis of household energy requirements in Australia, Brazil, Denmark, India and Japan. Energy 2006, 31, 181–207. [Google Scholar]
- Vringer, K.; Blok, K. The direct and indirect energy requirements of households in the Netherlands. Energ. Policy 1995, 23, 893–910. [Google Scholar]
- Reinders, A.H.M.E.; Vringer, K.; Blok, K. The direct and indirect energy requirement of households in the European Union. Energ. Policy 2003, 31, 139–153. [Google Scholar]
- Pachauri, S. An Energy Analysis of Household Consumption; Springer: Dordrecht, The Netherlands, 2007. [Google Scholar]
- Lu, Z.; Matsuhashi, R.; Yoshida, Y. Direct and indirect impacts of households by region of China on CO2 emissions. Environ. Inform. Arch. 2007, 5, 214–223. [Google Scholar]
- Regmi, A.; Deepak, M.S.; Seale, J.L., Jr.; Bernstein, J. Cross Country Analysis of Food Consumption Patterns. In Changing Structure of Global Food Consumption and Trade; Agriculture and Trade Report, WRS-01-1; U.S.; Department of Agriculture: Washington, DC, USA, 2001. [Google Scholar]
- Cohen, C. Energy requirements of households in Brazil. Energ. Policy 2005, 33, 555–562. [Google Scholar]
- This estimate uses the urban middle income group intensity from Pachauri [Pachauri, S. An Energy Analysis of Household Consumption; Springer: Dordrecht, The Netherlands, 2007. [Google Scholar]] and the average of the second to fourth lowest income groups in urban Brazil from Cohen [Cohen, C. Energy requirements of households in Brazil. Energ. Policy 2005, 33, 555–562. [Google Scholar]].
- India’s agricultural methane emissions in 2007 were 0.33 tons/cap, while Brazil’s were 1.58 tons/cap (World Development Indicators). Total food-related GHG emissions were 0.73 and 1.76 tons in India and Brazil respectively [Hertwich, E.G.; Peters, G.P. Carbon footprint of nations: A global, trade-linked analysis. Environ. Sci. Tech. 2009, 43, 6414–6420. [Google Scholar]].
- Calculated from data on GHG emissions [Hertwich, E.G.; Peters, G.P. Carbon footprint of nations: A global, trade-linked analysis. Environ. Sci. Tech. 2009, 43, 6414–6420. [Google Scholar]] and meat consumption from the Food and Agricultural Organization (FAO).
- Nicol, F. Adaptive thermal comfort standards in the hot-humid tropics. Energy Buildings 2004, 36, 628–637. [Google Scholar]
- Van Ruijven, B.J.; van Vuuren, D.P.; de Vries, B.J.M.; Isaac, M.; van der Sluijs, J.P.; Lucas, P.L.; Balachandra, P. Model projections for household energy use in India. Energ. Policy 2011, 39, 7747–7761. [Google Scholar]
- This includes 100 W of fluorescent lighting based on an illuminance standard of 100 lumens/sq.m. (IESNA Category C) for a 50 m2 home, and 145 kWh for fans, 500 kWh for refrigerators, 150 kWh for television, and 400 kWh for air conditioning per household per year [Van Ruijven, B.J.; van Vuuren, D.P.; de Vries, B.J.M.; Isaac, M.; van der Sluijs, J.P.; Lucas, P.L.; Balachandra, P. Model projections for household energy use in India. Energ. Policy 2011, 39, 7747–7761. [Google Scholar]].
- IEA, Energy for All: Financing Access for the Poor; International Energy Agency: Paris, France, 2011.
- IEA, Energy Poverty: How to Make Modern Energy Access Universal? International Energy Agency: Paris, France, 2010.
- The 45 percent figure is for 2008–2009 (Central Electricity Authority, India), while the 60 percent figure is estimated for the entire 11th Plan (2007–2012) by the Working Group for the 12th Plan, Indian Planning Commission.
- Schipper, L.; Fabian, H.; Leather, J. Transport and carbon dioxide emissions: Forecasts, options analysis, and evaluation. In ADB Sustainable Development Working Paper Series; Asian Development Bank: Manila, Philippines, 2009. [Google Scholar]
- IEA, CO2 Emissions from Fuel Combustion; International Energy Agency: Paris, France, 2010.
- IEA, Transport Energy and CO2: Moving Towards Sustainability; International Energy Agency: Paris, France, 2009.
- IEA, Energy Use in the New Millenium: Trends in Iea Countries; International Energy Agency: Paris, France, 2007.
- Gleick, P.H. The human right to water. Water Policy 1998, 1, 487–503. [Google Scholar]
- Gleick, P.H.; Iwra, M. Basic water requirements for human activities: Meeting basic needs. Water Int. 1996, 21, 83–92. [Google Scholar]
- WHOUNICEFMeeting the MDG Drinking Water and Sanitation Target: The Urban and Rural Challenge of the Decade; Technical Report; World Health Organization: Geneva, Switzerland, 2006.
- Kariuki, M.; Schwartz, J. Small-scale private service providers of water supply and electricity: A review of incidence, structure, pricing, and operating characteristics. In Policy Research Working Paper Series; World Bank: Washington, DC, USA, 2005; pp. 1–38. [Google Scholar]
- Data from the World Development Indicators for 2009.
- World Development Indicators, World Bank. 2011. Available online: http://data.worldbank.org/data-catalog/world-development-indicators (accessed on 10 January 2012).
- Infrastructure typically also includes energy infrastructure. However, for the purposes of study we treat energy infrastructure as an output of this study.
- Sengupta, N. Use of cost-effective construction technologies in India to mitigate climate change. Curr. Sci. 2008, 94, 38–43. [Google Scholar]
- This estimate assumes that each square meter of floor space requires 10 kg of steel, 60 kg of cement and 400 bricks [Sengupta, N. Use of cost-effective construction technologies in India to mitigate climate change. Curr. Sci. 2008, 94, 38–43. [Google Scholar]]. Construction costs in urban areas are up to triple these prices, according to interviews with architects in India, which could imply more energy intensive construction in urban areas with high-rise buildings.
- Briceno-Garmendia, C.; Estache, A.; Shafik, N. Infrastructure Services in Developing Countries: Access, Quality, Costs and Policy Reform; World Bank: Washington, DC, USA, 2004. [Google Scholar]
- Han, X.; Chatterjee, L. Impacts of growth and structural change on CO2 emissions of developing countries. World Dev. 1997, 25, 395–407. [Google Scholar]
- Chen, Z.M.; Chen, G.Q. An overview of energy consumption of the globalized world economy. Energ. Policy 2011, 39, 5920–5928. [Google Scholar]
- Den Elzen, M.; Höhne, N.; Moltmann, S. The triptych approach revisited: A staged sectoral approach for climate mitigation. Energ. Policy 2008, 36, 1107–1124. [Google Scholar]
© 2012 by the authors; licensee MDPI, Basel, Switzerland. This article is an open-access article distributed under the terms and conditions of the Creative Commons Attribution license (http://creativecommons.org/licenses/by/3.0/).
Share and Cite
MDPI and ACS Style
Rao, N.D.; Baer, P. “Decent Living” Emissions: A Conceptual Framework. Sustainability 2012, 4, 656-681. https://doi.org/10.3390/su4040656
AMA Style
Rao ND, Baer P. “Decent Living” Emissions: A Conceptual Framework. Sustainability. 2012; 4(4):656-681. https://doi.org/10.3390/su4040656
Chicago/Turabian StyleRao, Narasimha D., and Paul Baer. 2012. "“Decent Living” Emissions: A Conceptual Framework" Sustainability 4, no. 4: 656-681. https://doi.org/10.3390/su4040656