System Dynamics Modeling of Individual Transferable Quota Fisheries and Suggestions for Rebuilding Stocks

Abstract
: This paper develops a system dynamics model of Individual Transferable Quota (ITQ) systems in order to differentiate ITQ from total allowable catch (TAC) effects and to identify areas where policy changes and management improvement may be most effective. ITQ systems provide incentives for long-term stewardship but when fisheries are managed “at the edge,” the incentives are inadequate for stock rebuilding. The free-market design of ITQ systems means that fishermen may be in conflict with the long-run, public sustainability goals of fishery management. An adaptive control scheme with a contingent public/private transfer payment is proposed to improve long-term results for both the local community and the general public.1. Introduction
Many salt water fish stocks are in decline worldwide. Overfishing has led to the complete collapse of numerous fisheries including those for important and well publicized species, such as northern bluefin tuna and Atlantic cod [1-3]. In addition, over-exploitation of fisheries has led to reductions in biodiversity, and modified ecosystem functioning [4]. Despite management attempts to reduce overfishing, little progress has been made due to a general inability to endure the short-term economic and social costs of reduced fishing [5].
Indeed, historical analysis reveals that resources are consistently and inevitably over-exploited due to two primary reasons: (1) Wealth and its pursuit generates political and social power that is used to exploit the resource, and (2) the vast complexity of the biological, ecological and physical world hampers our ability to use scientific, reductionist methods in the management of the resource [6]. For example, in the case of setting total allowable catch (TAC), management may be reluctant to act on uncertain scientific advice that indicates the fish stock is at an unhealthy level. If management acts immediately and lowers the TAC, they are assured that local fishers will bear the immediate, short-term financial impact of reduced harvests. On the other hand, if management delays TAC reduction, then there is the possibility that the better scientific information may reveal that the stock recovered. Therefore, it becomes a rational policy for fishery managers to delay decisions that may have a negative impact on the community and to wait for better scientific information and reductions in uncertainty [7]. However, a common scenario is that the scientific information provided was in fact reasonable and the stock will likely continue to decline since management has delayed taking action [8]. When this occurs management is forced to take even more extreme measures to help stock recovery. Tough management actions typically fuel political resistance, which causes further delay and leads to a harmful reinforcing loop [8].
Two important recent trends in fishery management offer promise toward rebuilding global fisheries. First, ecosystem based management (EBM) offers a rational, holistic approach to marine fisheries that stresses species interactions, changes in ecosystem structure and function, biodiversity, non-harvest ecosystem services, gear impacts on habitat, and effects on rare species and non-target species [9,10]. Recent global commitments to adopt EBM should aid stock rebuilding by influencing harvesting targets and by incorporating broader conservation objectives into fishery management [10]. Clearly, only focusing on single species assessment may have detrimental effects on long term yields and ecosystem health [4,11].
A second important trend in fishery management is the increasing attention to develop and use incentive-based approaches [2,10,12-15]. Incentive-based approaches recognize the importance of providing economic incentives to fishermen to influence their motivation. Indeed, stock rebuilding necessitates cooperation. All fisheries that require stock rebuilding must undergo reductions in exploitation rates and fishermen must therefore make short-term sacrifices in the form of reduced catches. Fishermen are reluctant to sacrifice in the short-term when it is uncertain that they will be able to enjoy the benefits of increased catches in the future ([7], pp. 28-30). Thus, a key fishery management tool that is receiving increasing attention is the use of rights-based approaches such as individual transferrable quota (ITQ) programs.
3. Research Model
While empirical support has shown that ITQ systems have been successful at controlling fisheries collapse [17] and their adoptions in fisheries is gaining momentum, a recent survey revealed that in 20 stocks managed by ITQ systems, 12 stocks showed improvements in stock biomass but eight of the 20 stocks continued to decline after ITQ implementation [1]. Specifically, Chu [1] notes that some of the declines in fish stocks may be attributable to inappropriate TACs or low levels of enforcement and harvest compliance. The empirical results however, raise serious questions regarding ITQ effectiveness. This suggests that additional or complementary methods may be required to help manage these fish stocks for long-run bio-economic sustainability.
Chu [1] calls for research that separates the influence of the TAC from the influence of the ITQ and management on stock status. Toward that end, we developed a computer simulation to differentiate ITQ from TAC effects and to identify areas where policy changes and management improvements may be most effective.
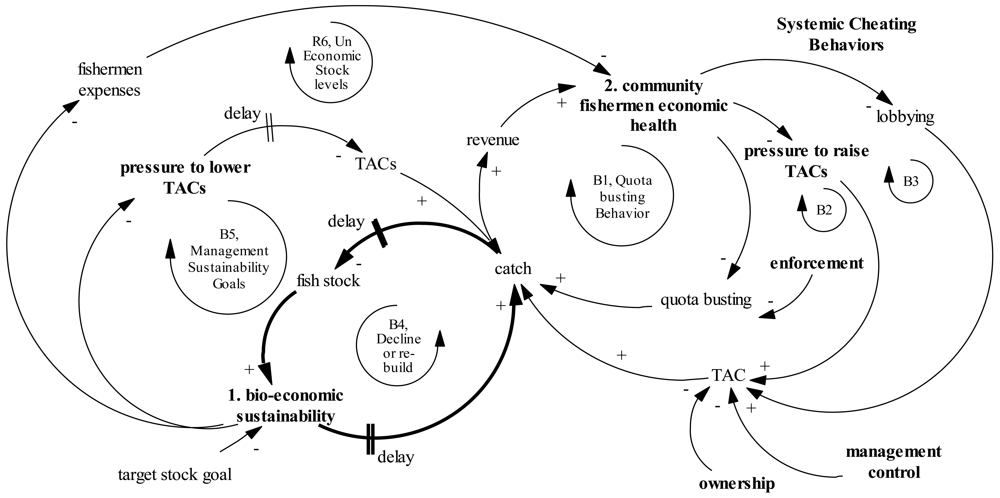
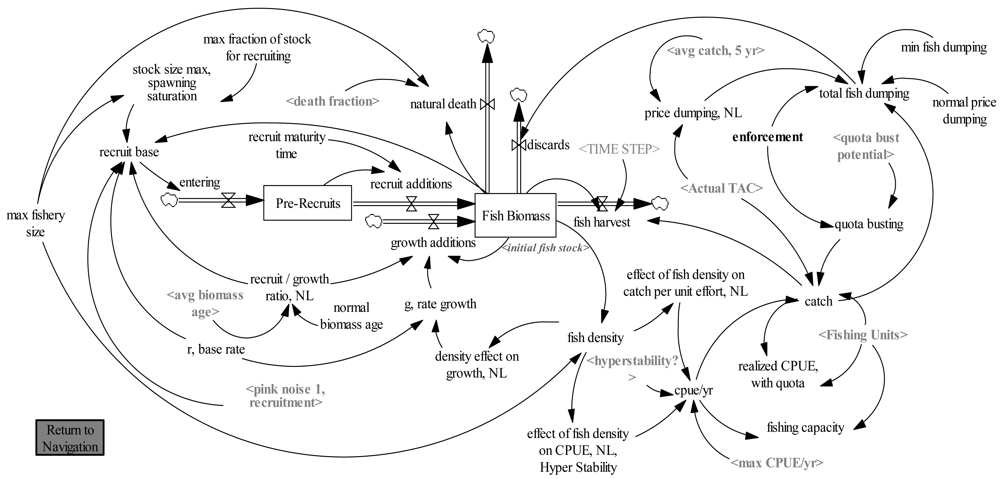
Figure 1 depicts a high level view of our research model as a causal loop diagram (CLD). The CLD shows the causal structure involved in an ITQ fishery. The arrows between variables depict the direction of causal influence. There are two types of connections, either “+,” or “−” polarity that depict how a dependent variable will change (increase or decrease) based on the change in the independent variable (increase or decrease). A positive link means that if the cause variable increases, then the effect variable also increases above what it would otherwise have been. A positive link also indicates that if the cause variable decreases, then the effect variable also decreases below what it would otherwise have been. In essence, a positive causal link will reinforce the initial causal influence.
A negative link means that if the cause variable increases, then the effect variable will decrease below what it would otherwise have been (an opposite change). A negative link also indicates that if the cause variable decreases, then the effect variable increases above what it would otherwise have been. In essence, a negative causal link will balance the initial causal influence.
In Figure 1, if we examine a stock rebuilding situation with a decreasing bio-economic sustainability (labeled variable 1) relative to a target stock goal, then we can trace this to an increase in pressure to lower TACs, then to a decrease in TACs, leading to a decrease in catch, and to an increase in the fish stock, leading finally to an increase in bio-economic sustainability. In essence, tracing through this causal path shows fishery management's response to this problem or gap between the desired and actual state. However, management's actions are not performed in isolation, but rather they are interdependent and linked to impacts in the fishery community. Thus, lower catches also lead to lower revenue and reduced levels of community fishermen's economic health. Reductions in economic health can set off various systemic cheating behaviors such as lobbying the political authority, applying direct pressure on management to raise TAC, and quota busting behavior (illegal catches above quota). All of these actions can be described as policy resistance as the local community responds to their short-term economic interests.
The model portrays the situation of diffused responsibility and ownership. The diffused responsibility research model is a slight variation on the theme of the management of shared resources with hidden interdependencies [29,30]. In essence the shared resource is the fishery stock and the two competing objectives are to manage the resource for long-run sustainability and to use the resource for necessary short-term profitability. While both interests are shared by fishery managers and local community fishermen, fishery managers bear the primary responsibility for long-run sustainability through TAC management while local fishermen must be concerned primarily with short-term economic survival. In Figure 1, a “tug of war” can often ensue with local fishermen attempting to increase catch to reach their short-run profit goals while fishery management attempts to control (reduce) catch to achieve their sustainability goals.
Figure 1 also portrays three primary management control points: Enforcement, ownership, and management control (bold-faced variables) that can be used to lessen the policy resistance from the fishing community. Specifically, enforcement can take many forms, however, on-vessel observers is one primary example to reduce quota busting and similar behaviors. Ownership refers to the stewardship incentive that is designed into ITQ systems to motivate share owners to care for long-term resource use. Management control is the strength of fishery management to control TAC changes independent of outside influences, such as community or political pressure.
Too often, fishery management is performed “at the edge” [9] where stocks are managed at levels such that small increases in catch can send the fishery into collapse. Responsible management is short-circuited when excess capacity is present and thus results in low levels of community fishermen economic health [31]. Poor local economics drive political forces and user resistance that keep the fishery in a sub-optimal state. While it is well known that effective resource management is a necessary condition for viable communities, our model stresses the mutually reinforcing relationship between communities and fisheries. Strong communities are necessary for sustainable fish stocks [32].
3.1. Stock and Flow Model
Figure 1 highlights areas where high leverage policy may be effective, specifically the management control points or areas of potential management influence. However, the development of a stock and flow model and computer simulation is necessary to more precisely understand the long-run behavior of the ITQ fishery over time.
Understanding and managing stocks and flows, which includes resources that accumulate or decay and the flows that govern their change is a fundamental process in social and natural systems. All stock and flow problems share the same underlying structure; the resource level or stock accumulates its inflows less its outflows [33]. Many real world problems can be modeled with stock and flow simulations. Example stock and flows include: Inventory (stock) that increases through production (inflow) and decreases through sales (outflow); and population (stock) that increases through births (inflow) and decreases through deaths (outflow). Underlying equations represent the flows and determine how the stocks change through time. System dynamics modeling with stock and flow is extremely useful since many real world systems involve many interconnections, non-linear dynamics and feedbacks. The complexity of systems means that humans are unable to infer the long-run consequences of our actions without the use of computer simulations [33].
The stock and flow model is summarized in four different views (Figures 2 through 5) and a number of select formulas are shown in Appendix A (The complete model, developed in Vensim Professional, can be downloaded by contacting the author).
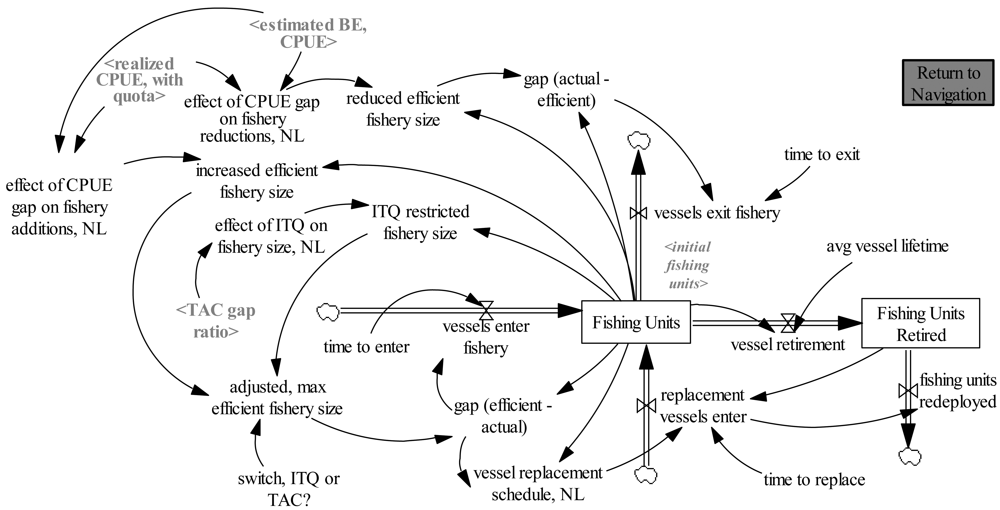
3.2. ITQ Market: Entry and Exit of Fishing Units
In our model of an ITQ fishery, we are primarily interested in the behavior of the fishery as a whole and not on comparing the success of one fishing organization relative to another. Overall, each fishing organization will be compelled to add fishing units or vessels as vessel efficiency increases. Specifically, if the current efficiency, as measured by catch per unit effort (CPUE) is above the break-even CPUE, then it will be economically justifiable to add vessels. In a similar fashion, as the fishery becomes overcapitalized, CPUE values will fall and fishing units (and organizations) will leave the fishery (see Figure 2). This mirrors real-world observations as ITQ programs are designed to promote consolidation and remove excess capacity. Fishing organizations that are inefficient with high costs are driven to drop out. Our model uses the average CPUE and average profit to determine the entry and exit of vessels for the fishery as a whole.
In contrasting ITQ with non-ITQ TAC fisheries, of central concern is the incentive structure or the system induced influence that leads to different fishermen behavior (especially with respect to capacity decisions). In non-ITQ TAC fisheries, investment behavior is likely more aggressive than ITQ programs as there are no individual restrictions on catch. This leads to the “race to fish” and overcapacity. In ITQ systems however, capacity is constrained when individual quotas constrain catch. The model implements this behavior using information feedback on the gap between TAC and fishermen catches.
3.3. TAC Management and Policy Implementation
Figure 3 models the TAC setting process for the entire fishery. In an ITQ system, the TAC would then be divided-up according to the pre-defined ITQ shares for each of the fishing units or fishing organizations. Our model simply assumes equal shares among fishing units.
The model first determines a scientific proposed TAC that is used as input to management's proposed TAC. The scientific proposed TAC is purposely mismatched with the fish biomass model in Figure 4 to reflect the often real-world situation that scientific fishery models do not match the complex realities of actual ecosystems with perfect precision. The model is intended to be more descriptive than prescriptive since the goal is to identify areas for improved management decision making in the context of stakeholder interference in TAC setting and imperfect scientific information.
It is beyond the scope of this paper to develop a sophisticated TAC-setting or harvest control strategy. Rather the purpose is to examine the difficulties found in the human-based components of the system that can steer TAC management away from scientific recommendations.
To model real-world interference in TAC setting, the model then depicts two major avenues for TAC changes: (1) Direct pressure on management's TAC by the community, and (2) lobbying pressure. Lobbying pressure is a function of the proposed TAC's impact on the community, relative to capacity.
ITQ design and management influence can then negate or counter attempts at TAC change through strength of management mandate (strong central management), management's community bias (degree of concern for community employment and short-term economics), and ownership.
The variable ownership is used to address the difference in incentives that are provided by ITQ programs relative to non-ITQ fisheries. The ownership variable can be used as a switch variable; setting it to 0 or 1 allows us to distinguish between non-ITQ TAC fisheries, where there is strong interference in TAC setting, and ITQ programs where share values influence users to consider their long-term stakes in the fishery.
After the management TAC has been recommended and potential lobbying pressure determined, the TAC setting process then takes a conflict resolution, or debate oriented approach, where the political pressure from lobbying is weighed against management's bargaining power. We adapt the approach used by Dudley [34] whereby management's bargaining power is primarily a function of: (1) the strength of the original management mandate, as designed by policy makers; and (2) the degree of political support for management. As the fishery becomes overfished and declines in overall ecosystem health, the political authority provides strengthened authority to management.
The TAC setting process variable is a negotiated value determined by a weighted average of the two competing interests. The ratio of recent average catch relative to the past (historical average) is used to determine the political support for management; the amount of short-term economic pressure is a function of the ratio of catch to fishing capacity.
3.4. Fish Biomass and Harvest
We adopt a simple approach to fish population dynamics, similar to the approach suggested by Dudley ([34], pp. 3-4) who states “There is a need for models that allow us to examine complex fishery issues in a transparent and understandable manner without becoming overly focused on details of population dynamics.”
The model views fish population as an aggregate for ease of communication and avoids a more complicated model with cohorts. The model is based on the biomass dynamic model [35]:
The model is based on the alternate model developed by Dudley [34]. Separate inflows to biomass come from both growth additions and recruitment. The percentage of additions from recruitment relative to growth varies by average biomass age. Recruitment increases biomass based on the intrinsic rate of growth, r, base rate, however, above a certain biomass stock size constant recruitment is used. This mirrors many real-world fish stocks [7]. Growth additions to biomass are computed based on g rate growth, which is a function of fish density. Catch per unit effort (CPUE) is also a function of fish density and in addition, CPUE is affected by technology investments in fishing gear (max CPUE/yr, see Appendix). Since the impact of fish density on CPUE may also be a function of the particular fish species [36], a switch variable—hyperstability is used for sensitivity tests in this context. Both types of density impacts on CPUE are modeled using lookup functions.
There are three major biomass outflows: Natural death, fish harvest and discards. Notably, the total catch or fish harvest is also based on illegal catch or quota busting. Quota busting is computed based on fishermen's incentives to cheat and the countervailing level of enforcement. Incentive to cheat is computed in the TAC Management section of the model. The fish stock is also reduced by discards. While exact equations to compute cheating and fish dumping are generally unknown, empirical evidence suggests a rate of about 8% to 10% worldwide [37,38], (we conservatively use 5% in the base case). Price dumping is computed as a non-linear function using the ratio of average catch (the 5-year smoothed average) relative to the current TAC. As catches are likely to become limited due to quota, fishermen have more and more incentive to maximize catch revenue. In other words, why turn-in lower valued fish to count against quota?
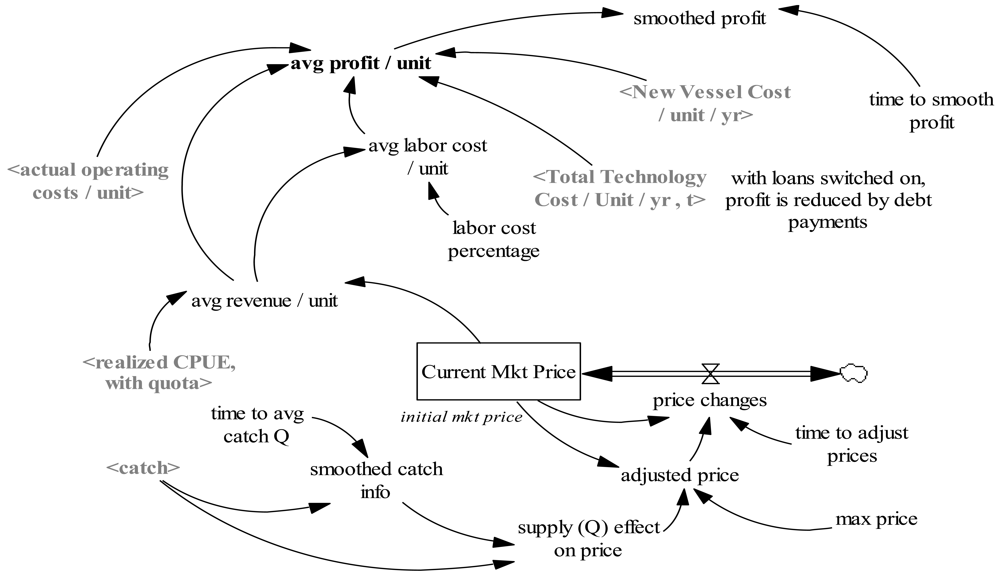
Market price is computed based on recent market prices and a supply/demand curve (See Figure 5). Average profit per unit is computed based on various cost dimensions including new investments in fishing technology or gear that are necessary to keep competitive (See Appendix for key equations and parameters).
4. Simulation Results
4.1. ITQ Model: Base Case, Partial Model Test
As identified in Figure 1, the rational design of ITQ fisheries and TAC setting is not adequate (in itself) to control sustainability and guarantee the entire system will behave in consistent and mutually supportive ways. We could test if TAC setting policy is based on intended rationality, by running a partial model test [39]. We could re-write Figure 1 to reflect only the ‘rational intention’ of TAC setting (and thereby remove policy resistance from the model).
However, by setting a range of management controllable variables (enforcement, management control, and ownership), we can also effectively “turn off” the policy resistance from the fishing community (the right-hand part of Figure 1). There are essentially two ways to apply outside management control to thwart or cancel policy resistance: (1) Set variables or switches reflecting strong, centralized fishery management control (strength of management mandate to cancel lobbying influence; management's community bias to cancel direct TAC interference), or (2) set the ownership variable to reflect the idealized state of ITQ shareholder and community responsibility, stewardship, and ownership. In either case, strong management control or high ownership, there is a resulting high level of enforcement. Both cases reflect successful fishery strategies as seen in real world observations [2].
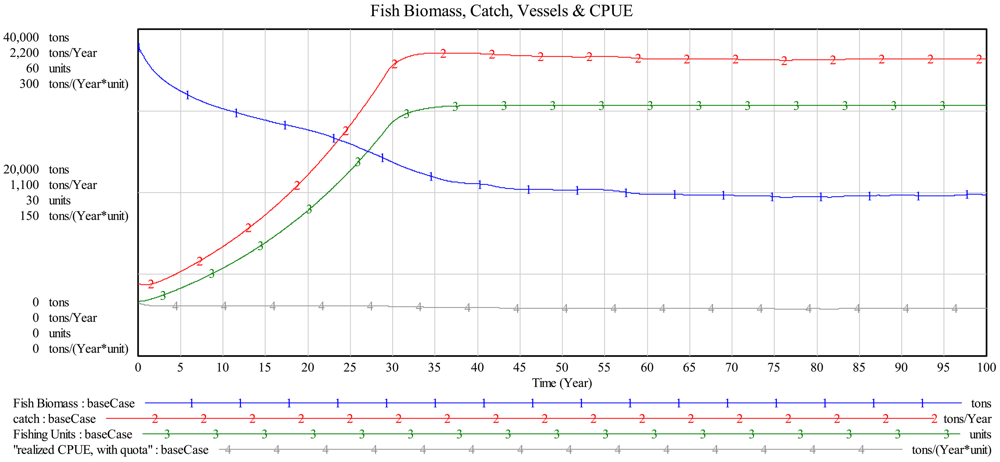
In the base case or ideal state, TAC changing and other systemic cheating is prevented. Figure 6 shows fish biomass (tons), catch (tons/year), fishing units (or vessels, units) and realized catch per unit effort (CPUE, tons/(year × unit). Figure 6 shows that the fish biomass converges to, approximately, an “optimal 20,000 tons” or a level of k/2. At around year 35 the catch peaks and is constrained by TAC.
4.2. ITQ Model Development, Validation and Confidence Building
The ITQ model was developed for the primary purposes of: (1) comparing TAC effects from other ITQ design effects; (2) examining the range of human influence points involved in Individual Transferrable Quota systems; and (3) developing insight into influential management control points. As a starting point, previously published models and an extensive literature review were used to formulate the initial model description. In particular, Dudley's [34] model provided a starting point for both the biological model and the initial political context.
Using the general approach to model validation recommended by Barlas [40], the model was examined using the following general tests: (1) Direct structure tests; (2) structure-oriented behavior tests; and (3) behavior pattern tests. An extensive literature review was performed to provide insight into the workings of ITQ systems including the behavior of fishermen and other stakeholders. Equations were developed and examined with respect to their correspondence with the knowledge reviewed in the literature (theoretical structure test). Parameter confirmation was performed by examining prices, costs, and corresponding values found in prototypical fisheries [41-43].
In order to examine for possible structural flaws in the system, sensitivity analysis of key parameters and extreme condition tests were performed. Model structure was also examined and re-examined to determine if stock and flow behavior would realistically match real system behavior. For example, vessel entry and exit to the fishery were re-modeled to reflect the more realistic flow of vessels using separate flows for: (1) Vessel entry; (2) vessel exit; (3) vessel retirement; and (4) vessel re-entry. In addition, comparison of non-ITQ, TAC fishery investment behavior to ITQ systems required additional modifications to reflect observed and reported real-world behavior.
Behavior pattern tests were performed to examine model outcome patterns to changes in parameters and key management leverage points. For example, by varying the levels of enforcement the model produced expected amounts of quota busting and ultimately resulted in stock crashes.
4.3. ITQ Model: Extreme Condition Tests
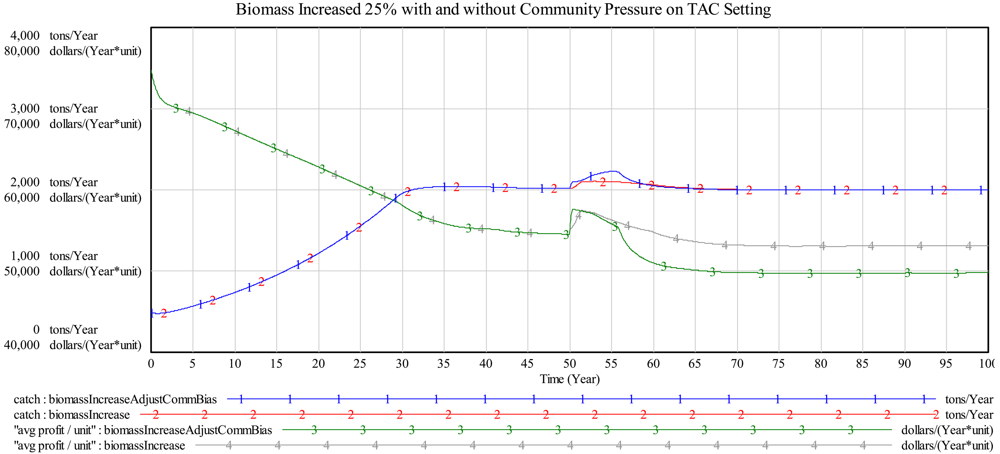
Using the same initial conditions as the base case, Figure 7 displays the simulation results for an extreme condition test where biomass is suddenly increased by 25% in year 50. We show the system response with two possible reactions by the human component of the system: (1) “business as usual” where the TAC management component continues to manage the fish biomass for an optimal, long-run equilibrium, and (2) with fishery management being open to community pressure. That is, the management's community bias variable is set to 1 to allow for changes in TAC when the short-term economic pressure increases (measured using catch/fishing capacity). The sudden increase in biomass results in improved productivity in terms of CPUE which then leads to an increase in fishing capacity and to an increase in short-term economic pressure. In this second case, with management responding to community pressure, TAC and thus catch are increased in year 50 (graph line 1). We allow this openness to community pressure to persist for 5 years and then it is switched off. During this 5-year period “avg profit/unit” increases (graph line 3) and is higher than “avg profit/unit” for the “business as usual” case (graph line 4). However, with higher profits there is also a corresponding increase in vessels added to the fishery. Thus, after year 55 when TAC and catches are again reduced by a return to normal policy, the higher capacity results in a lower long-run equilibrium “avg profit/unit” (graph line 3) compared to “business as usual” (graph line 4).
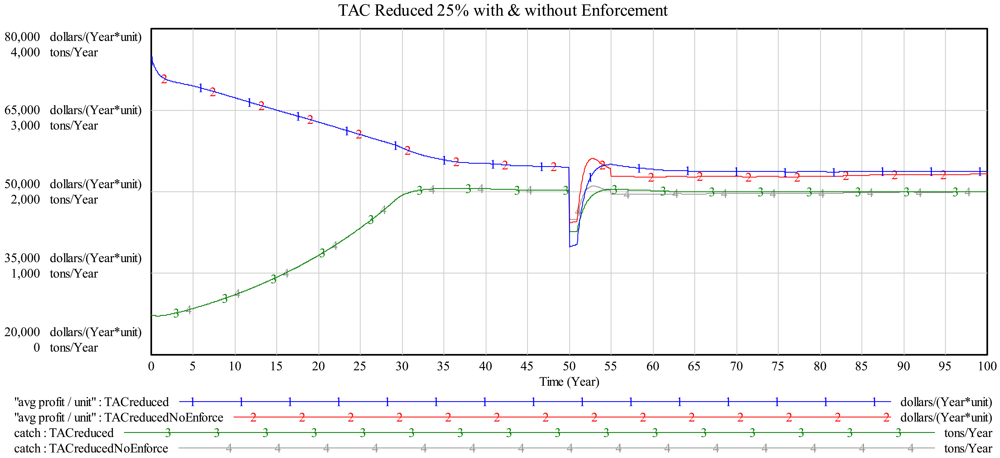
Figure 8 displays the simulation results for an extreme condition test where TAC is suddenly reduced by 25% in year 50. We again show the system response with two possible reactions by the human component of the system: (1) “business as usual” with strict enforcement to prevent quota busting, and (2) enforcement turned off for years 50 to 55. Catch is reduced in both cases; however, with quota busting allowed (no enforcement) catch is comparatively higher (graph line 4 > graph line 3). In addition, lack of enforcement means that fish biomass is stabilized at a lower, long-run level and “avg profit/unit,” while higher in the short-run, is also lower in the long-run compared to strict enforcement (graph line 2 < graph line 1). In this scenario, enforcement was only relaxed for a short 5 year period. Naturally, if quota busting persisted for a longer period there would be correspondingly larger impacts on biomass and average profit/unit.
Overall, the ITQ model responded as expected to extreme condition tests. In both test cases, when the human component of the system influenced TAC policy due to short-term economic pressures the end result was higher short-run but lower long-run average profit/unit. However, it should be noted that all simulations have assumed a small variation in recruitment. It is not uncommon for fisheries to experience large fluctuations in recruitment [34].
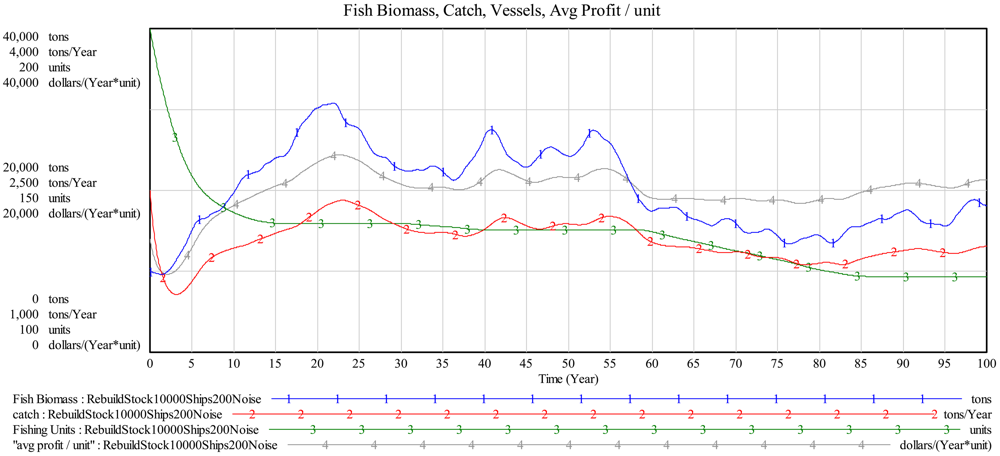
In Figure 9 we show the results of increasing random variation in recruitment with the stock set to 10,000 tons biomass (k = 40,000 tons) and 200 fishing units or vessels (an overcapitalized fishery). Random changes cause large boom and bust cycles and make fishery management and stock rebuilding more difficult. As seen in Figure 9 periods of high biomass lead to increases in catch (via increases in TAC) and since capacity is more than adequate, average profit/unit rises. Reductions in capacity are difficult (via TAC decreases) since biomass levels are high. In years 20 through 60, capacity remains at an equilibrium level of approximately 140 vessels (units). In years 60 through 80, average profit/unit remains steady despite declines in biomass because the fishery finally loses capacity. Overall, large fluctuations in biomass may mean increased short-run financial pressures in some years and may make community and management cooperation more difficult.
4.4. Contrasting TAC Policies: Long-Run versus Short-Run Goals and Stock Rebuilding
As pointed out by Chu [1] in eight of the 20 stocks examined in her study, ITQ programs were not able to rebuild fish stocks. We explore the possibility of rebuilding stocks with the ITQ model. We start the model with the stock set to 10,000 tons biomass (k = 40,000 tons) and 200 fishing units or vessels (an overcapitalized fishery). The stock rebuilds, but only to 17,016 (k/2 = 20,000) in year 100 with CPUE rising from 12.5 tons/unit/year to 16.8 tons/unit/year.
We next readjust the model to implement scientific TAC recommendations using a more precautionary approach (the scientific TAC is decreased by 5%). The stock rebuilds more quickly to 11,435 tons in 10 years and to 20,647 (approximately k/2) in 100 years. While stock rebuilding appears to be better accomplished with a precautionary policy, we must consider whether such policy is easily implemented.
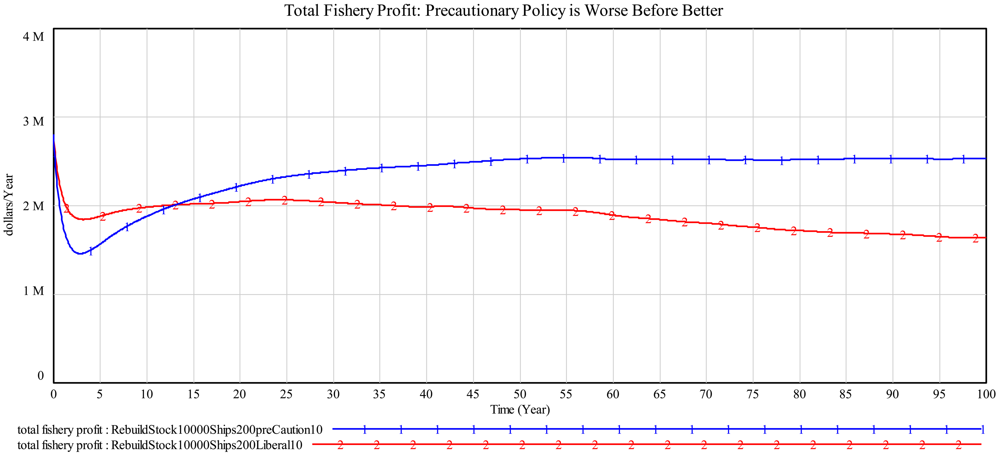
Toward that end, we compare and contrast TAC setting approaches and examine their impact on total fishery profits. Figure 10 contrasts run 1, a precautionary approach where TAC is set 10% lower than normal scientific advice, with run 2, a liberal approach where TAC is set 10% higher than scientific advice. In the short-run, the liberal TAC approach dominates with total fishery profit in year 5 ($1.88 million compared to $1.6 million) and in year 10 total fishery profits are higher ($1.98 million compared to $1.87 million). However, in the long-run the precautionary approach dominates the liberal approach. For example, in year 50 the precautionary approach yields $2.5 million compared to $1.9 million for the liberal approach and by year 100 the profits are $2.5 million to $1.6 million, respectively (or 50% higher than the liberal policy).
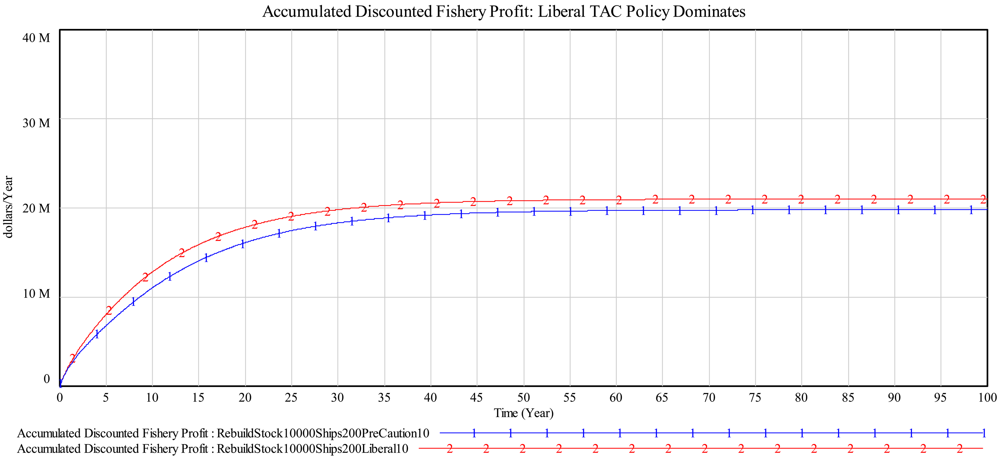
Although the precautionary approach appears to be the superior TAC setting policy for long-run sustainability and fishery profit, in Figure 11 we compare accumulated discounted fishery profit over time for these two approaches. Using this approach for comparison, liberal TAC setting dominates since discounted profits or losses means that short-run profit will count much more than later profits.
5. Discussion
Results from our computer simulations reinforce Chu's [1] speculation that inappropriately set TACs and low levels of harvest compliance are likely causes for ITQ programs failing to rebuild stocks. The initial stock rebuilding simulation in section 4.4 depicts an increase in fish biomass. The simulation is based on a reasonably accurate fish stock assessment and little to no interference in the TAC setting process by political or special interest groups. However, while this is a positive result, it should be noted that the biomass increase is modest and it takes 100 years to reach 17,016 tons or approximately 85% of the economically optimal biomass (k/2 = 20,000 tons).
5.1. Precautionary Approach and Short-Run Necessity
Figures 10 and 11 contrast a precautionary approach with liberal TAC setting. Figure 10 shows the obvious superiority, from the public's perspective, of precautionary TAC setting for long-run profitability and sustainability. Unfortunately, the precautionary approach generates a “worse before better” long-run result. Figure 11 shows discounted cash flows (based on operating profit) that reflect fishermen's necessary concerns for immediate results.
As noted by Forrester [44], many of the actual practical working mechanisms of a system tend to create conflict between short-run and long-run results. The free-market design of ITQ systems means that fishermen may be in conflict with the long-run, public sustainability goals of fishery management.
5.2. Public Benefit = Public Pays
While long-run sustainability is a primary concern of the public, ITQ programs however give incentives for fishermen to compete and remain profitable, and therefore short-run goals will dominate their decision making. Thus, it becomes very difficult for fishermen to agree on conservative TAC levels. In practice, using the precautionary principle (to build-up stocks) is very difficult, even when it is incorporated into law [7,45].
In order to achieve a proper balance between short-run and long-run goals that will lead to better outcomes for both local communities and the public, we propose a public transfer payment. That is, if fisheries are able to make progress toward long-run sustainability targets then they will qualify for short-run off-set payments. Payments would be contingent on achieving target goals and would provide incentive for local communities to adjust their short-run versus long-run tradeoffs. Since everyone in the community benefits if targets are met, there are additional incentives for communities to monitor and enforce quota compliance.
5.3. Integration of Ecosystem-Based Management Goals with ITQ Systems
Ecosystem-based management offers many obvious advantages to traditional fishery management approaches. EBM is necessary to provide valuable information to fishery management since ecosystem structure and function impact ecosystem productivity, ecosystem diversity can help to prevent species collapse [4,17], and finally EBM is necessary to achieve conservation objectives.
While ITQ systems are clearly not appropriate for all fishery management contexts, they can be effective in reducing overcapacity in many fisheries. Reductions in overcapacity may be an important and practical first step toward achieving the goals of EBM [9]. In fact, Mace recommends three fundamental prerequisites to help achieve EBM: (1) Reduce exploitation rates on individual target species; (2) reduce overcapacity; and (3) conduct adequate baseline monitoring of marine species and their environment.
There is no “silver bullet” with respect to effective fisheries management. The use of rights-based incentives (including ITQs) does not automatically account for ecosystem damage because fishermen have little incentive to minimize by-catch or habitat damage since it does not immediately impact profits from their target species [5,46]. On the other hand, while the EBM approach is necessary to account for fishery impacts on ecosystems, it is insufficient to address two major factors impacting unsustainable fisheries: (1) The inappropriate incentives imposed on fishers (that lead to policy resistance); and (2) the ineffective governance often found in commercial, developed fisheries managed by total harvest limits (non-ITQ TAC fisheries) and input controls [13,47]. Indeed, traditional commercial fisheries that impose input controls result in increased costs of fishing and often fail to reduce fishing effort due to the substitution of un-regulated inputs for controlled ones [13]. Similarly the use of competitive TACs in input controlled fisheries leads to the “race to fish” and ultimately harm the sustainability of fisheries [2].
Reducing the impact of fishing on ecosystems requires the ability to control fishing effort [10,47]. Use of ITQ systems, where appropriate, can be beneficial in reducing fishing capacity, effort and exploitation rates of target species. Other incentive-based approaches have been recommended to effectively control ecosystem impacts, including: Closed areas (marine protected areas); incentives to deploy by-catch reduction devices; on-board observers to reduce by-catch; restrictions on fishing gear; and vessel monitoring systems, among others [10,13].
Due to the increased costs required to supply the appropriate scientific information for successful EBM, appropriate intermediate steps might include reducing fishing mortality and eliminating overcapacity [9,10]. These two steps could reduce the frequency with which stock assessments need to be made and free up resources for scientific and ecosystem research [9].
6. Summary and Conclusions
Understanding the decision and structural realities of fisheries is essential in order to design effective incentive systems. Soft or intangible variables are often ignored in policy analysis because they are not easily quantifiable. However, not including them means we are implicitly assuming that they have no effect; of course, those are the most implausible values of all [33,44,48].
Strictly enforced, science-based TACs are believed by some to be the essential and sufficient prerequisite for sustainability in fisheries [25]. However, stock rebuilding requires “buy-in” by fishermen in order to agree to concessions now for potential long-term benefits [7].
Rebuilding stocks requires short-term sacrifices [10]. As shown in Figures 10 and 11, the use of discounted cash flow analysis dominates private, free market decision making. However, an examination of the long-run profit of the fishery reveals that public interest is best served by use of a precautionary strategy, contrary to the best, short-term interest of the local community. The free market is not likely to select a strategy that produces “worse before better” results.
Public transfer payments can help to alter the short-run versus long-run tradeoffs faced by local fishermen. Public payments should be seen not just as another government spending program, but rather as a wise investment that benefits the greater good (i.e., public interests in long-run sustainability, economic output, and an increased and sustainable food supply) while at the same time, improving the ability of local communities to exist and thrive. Finally, it must be emphasized that such transfer payments are temporary and contingent. They are contingent on achieving specified sustainability target levels. Once fully achieved, local communities will then be in a position where their short-run goals are consistent and mutually reinforcing with the long-run goals of fishery management. The end result is that fishery systems will stabilize on a productive path and provide long term positive benefits for both local communities and the wider general public.


Acknowledgments
I am very grateful to the anonymous referees and to the guest editors Richard Dudley and Allyson Beall for their kindness, knowledge and advice.
Appendix
Although human behavior such as cheating is well known to exist in fisheries, the psychological cause and effect are not precisely understood. However, as it exists, we can estimate impacts.
Appendix A. Select Formulas of the ITQ Model
Systemic Cheating
“avg catch, 5 yr” = SMOOTH(catch, “time to avg catch, 5 yr”) Units: tons/Year
capacity impact on quota busting = (“effect of capacity on quota busting, NL”) × normal quota busting Units: Dmnl
Normal quota busting is set at 3%. So, 3% is the reference point. In other words, 3% of quota is quota busted (potentially, that is, before enforcement) when at capacity.
“effect of capacity on quota busting, NL” = WITH LOOKUP (incentiveToCheat/Actual TAC, ([(−0.2,0) − (0.2,4)],(−0.2,0), (−0.0806846,0.166667), (−0.0591687,0.351), (0,1), (0.00537897,1.33333), (0.0268949,2), (0.0533007,2.5), (0.112958,3.20467), (0.2,3.33333))) Units: Dmnl
“price dumping, NL” = WITH LOOKUP (“avg catch, 5 yr”/Actual TAC, ([(0,0) − (2,1.3)], (0,0), (0.25,0.30303), (0.474328,0.531636), (0.713936,0.749697), (1,1), (1.50611,1.26), (2,1.27273))) Units: Dmnl
As average recent catches approach the actual total quota imposed (TAC) then fishermen will make sure that they maximize the revenue of their catch by engaging in price dumping. In other words, there is no sense turning in undervalued fish to count against ITQ (individual transferrable quota). Note: as the fishery catch approaches the TAC, individual ITQ holders will also be approaching their ITQ limit.
quota busting = MAX(quota bust potential × enforcement, 0) Units: tons/Year
Incentive to cheat is calculated as the gap between fishing capacity and the TAC. Enforcement indicates the % of potential violations that are able to quota bust or cheat. Note: If incentive to cheat is negative, there is still potential cheating since some fishermen may be at ITQ quota.
quota bust potential = capacity impact on quota busting × Actual TAC Units: tons/Year
total fish dumping = ((catch × min fish dumping) + (“price dumping, NL” × normal price dumping × catch)) × enforcement Units: tons/Year
In ITQ Fisheries, individuals are likely to engage in high grading and associated fish dumping. Min fish dumping is set to 5% of catch. There are two components here, some fish loss is likely to occur even with enforcement (adjacent fisheries may have by-catch). So, we use two components for total fish dumping. With good enforcement, price dumping is eliminated.
Effect of CPUE on Fishery Size
“adjusted, max efficient fishery size” = IF THEN ELSE(“switch, ITQ or TAC?” = 1, MIN (ITQ restricted fishery size, increased efficient fishery size), increased efficient fishery size) Units: units
If switch ITQ or TAC? = 1 then we have an ITQ fishery. If so, then the “normal” efficient fishery size calculation will Not be used if it exceeds the ITQ quota restricted fishery size. In other words, fishermen will not expand their capacity (vessels) past their upper quota restriction. (It doesn't make economic sense to add to capacity if catch is restricted by quota).
“effect of CPUE gap on fishery additions, NL” = WITH LOOKUP ((“realized CPUE, with quota”)/(“estimated BE, CPUE”), ([(1,0) − (5,0.4)], (1,0), (1.71,0.11), (2.21,0.15), (2.65,0.18), (3.15403,0.218947), (3.48411,0.24), (4.04645,0.272281), (4.4,0.29), (4.64548,0.297544), (4.97,0.302))) Units: Dmnl
“effect of CPUE gap on fishery reductions, NL” = WITH LOOKUP (“realized CPUE, with quota”/(“estimated BE, CPUE”), ([(0,−0.4) − (1.5,0.4)], (0,−0.3), (0.195599,−0.218421), (0.464548,−0.118421), (1,0), (1.5,0))) Units: Dmnl
“effect of ITQ on fishery size, NL” = WITH LOOKUP (TAC gap ratio, ([(0,0) − (0.4,2)], (0,1), (0.01,1.0002), (0.05,1.01), (0.1,1.03), (0.15,1.07),(0.2,1.15),(0.3,1.5),(0.4,2))) Units: Dmnl
As the current catch approaches the TAC, fishers alter their investment decision to reflect the fact that TAC and ITQ restricts catch, revenue and profit. TAC gap ratio is (TAC- catch)/TAC.
“estimated BE, CPUE” = ((estimated costs)/Current Mkt Price)
Units: tons/(unit × Year)
Revenue - Expenses = Profit = 0 at BE.
Therefore, BE Q = expenses/price, or est BE, CPUE.
increased efficient fishery size = Fishing Units × (1 + “effect of CPUE gap on fishery additions, NL”) Units: units
ITQ restricted fishery size = (“effect of ITQ on fishery size, NL”) × Fishing Units Units: units
reduced efficient fishery size = Fishing Units × (1 + “effect of CPUE gap on fishery reductions, NL”) Units: units
Retained Earnings
available profit for RE = “avg profit/unit” × avg percent profit to RE Units: dollars/(Year × unit) Available profit for RE is based on the avg percent profit to RE fractional value. Some profits go toward share holders income but a majority is reinvested.
avg percent profit to RE = 0.8 Units: Dmnl
“avg profit/unit” = (“avg revenue/unit”) − (“avg labor cost/unit”) − (“Operating Costs/unit”) − (“New Vessel Cost/unit/yr”) −“Total Technology Cost/Unit/yr, t” Units: dollars/(Year × unit)
“cash available, new vessels/unit” = (“Retained Earnings/unit”) − tech invest via retained earnings Units: dollars/unit
Cash available for investment in new vessels is our RE balance less any technology investment (maintenance of gear and technology).
“cash for new vessels, units” = MIN((“cash available, new vessels/unit”)/“time to pay, RE, new vessels”, “cash req'd, RE, for vessels”) Units: dollars/(Year × unit)
This is a redundant check, since the variable “new units, internally via RE” already performed a check.
cash for technology = tech invest via retained earnings/“time to payout, tech” Units: dollars/(Year × unit)
“cash needed, borrowing, for new vessels” = (avg unit cost × new vessels via borrowing)/Fishing Units Units: dollars/(unit × Year)
“cash req'd, RE, for vessels” = (avg unit cost × new vessels for RE funding)/Fishing Units Units: dollars/(unit × Year) The cash req'd for vessels is the average required from RE/unit.
cash value of removed vessels = (cash value of scrapped vessels)/Fishing Units Units: dollars/(Year × unit)
cash value of scrapped vessels = avg unit cost × vessel retirement × “vessel scrap value %” Units: dollars/Year On average, the vessel scrap % is applied to the average vessel unit cost for those vessels that have been retired. The cash is placed back into RE.
Fishing Units = INTEG (replacement vessels enter+vessels enter fishery − vessel retirement − vessels exit fishery, initial fishing units) Units: units
initial cash position = 100,000 Units: dollars/unit
Base case value = $100,000. This is an interesting an important constant. If set to = $50,000 we will have a “recovery situation.” In other words, investments in gear and technology are necessary to remain competitive. If the fishery is cash poor, it will take some time to increase RE through profits. Investments in new gear and technology boost productivity and reduce costs, leading to more profits. For individuals or individual firms, the rich get richer … the poor get poorer. If there are few restrictions on entry to a fishery, cash rich outside entrants can of course out compete local fishers … in ITQ fisheries the composition of the fishery can change quickly and communities will suffer. This is a fundamental issue with ITQs and of course it is also a larger issue of social justice and quality of life.
new vessels for RE funding = MIN(total new vessels to fishery, “internal financing capacity/yr”) Units: units/Year
new vessels via borrowing = (“vessels needed, to borrow/yr”) × (“desired, percent financed internally, borrowing, NL”) × (“bankers' limit-smoothed profit, NL”) × (“switch, on/off loans”) Units: units/Year
There are two constraints to borrowing: (1) the level of desire to borrow by fishermen given interest rates or cost of capital and (2) the ability to borrow from banks, based on recent profits. The user is also given the option to turn off financing. However, if market forces indicate that there are profits to be made in the fishery (from View 3, Entry of vessels based on favorable CPUE vs BE CPUE) and if the fishery is unable to add capacity then we will see external financing of vessels.
“re-investment in business” = MAX(0, (available profit for RE)) Units: dollars/(Year × unit)
“Retained Earnings/unit” = INTEG (cash value of removed vessels+“re-investment in business”−“cash for new vessels, units” − cash for technology, initial cash position) Units: dollars/unit
tech invest via retained earnings = MIN(“cash available, tech investment”, (“gap, goal v technology/unit”) × conservative investment ratio) Units: dollars/unit
Investments can be thought of as: (1) replacement of equipment, gear because of depreciation, or (2) investments in new gear as an upgrade or enhancement. A conservative investment ratio is used because a % of the market may wish to keep more RE and use loans. Ratio is set to 100% to fund all investments through RE, if cash is available. If cash is tighter, the industry may look to loans.
“time to pay, RE, new vessels” = 1 Units: Year
“time to payout, tech” = 1 Units: Year
Technology Impacts and Operating Costs
“actual operating costs/unit” = “Operating Costs/unit at Max Effort” × “% of fishing effort, NL” Units: dollars/(Year × unit)
As fish density increases fishing effort is reduced. It will take fewer trips, shorter trips and correspondingly less effort (fuel costs etc) to land ITQ.
adjusted operating costs = normal max operating costs × “technology effect on operating costs, NL” Units: dollars/(Year × unit)
The level of installed technology will alter the “operating costs/unit at Max Effort” relative to the standard or normal max operating costs.
initial operating costs = normal max operating costs Units: dollars/(Year × unit)
“max CPUE/yr” = “normal max CPUE/yr” × “productivity/Tech $, NL” Units: tons/unit/Year
“normal max CPUE/yr” = 35 Units: tons/(Year × unit)
normal max operating costs = 6000 Units: dollars/(Year × unit)
operating cost changes = (“Operating Costs/unit at Max Effort” − adjusted operating costs)/time to change operating costs Units: dollars/(Year× Year × unit)
“Operating Costs/unit at Max Effort” = INTEG (cost increases − operating cost changes, initial operating costs) Units: dollars/(Year × unit)
Operating costs/unit at Max Effort (in addition to labor costs) can be thought of in terms of efficiency or time savings. Total time = travel time + search time + setting time + handling time (see [36], p. 122). Investments in equipment and electronics can reduce the time required in each of these time categories. Fuel costs are a significant factor in operating costs and can be reduced by investments. All equipment will depreciate over time and need replacing or eventually lead to higher operating costs.
“productivity/Tech $, NL” = WITH LOOKUP ((“Total Investment in Technology/unit”)/“std technology investment/unit”, ([(0,0) − (5,3)], (0,1), (0.5,1), (1,1.05), (1.5,1.4), (2,1.6), (3,1.9), (4,2.1), (5,2.1))) Units: Dmnl
Technology investments can boost harvest productivity. However, it is likely that we will have decreasing returns and a non-linear effect. A more detailed analysis and simulation should include categories of technology as there are differing effects of categories of investment on harvest productivity (i.e., electronic search technology, hydraulics, etc.).
“std technology investment/unit” = 20,000 Units: dollars/unit
Standard technology is 10% of vessel (unit) price and is primarily for electronics.
“technology effect on operating costs, NL” = WITH LOOKUP ((“Total Investment in Technology/unit”)/“std technology investment/unit”, ([(0,0) − (3,2)], (0,1), (0.5,1), (1,1), (1.2,0.9), (1.4,0.75), (1.6,0.6), (1.8,0.55), (2,0.5), (3,0.5))) Units: Dmnl
time to change operating costs = 3 Units: Years
“Total Investment in Technology/unit” = INTEG (+ (“tech investment,t”) − (“tech depreciation,t”), “initial technology/unit”) Units: dollars/unit
“% of fishing effort, NL” = WITH LOOKUP (fish density, ([(0,0) − (1,1.2) ], (0,1), (0.35,1), (0.4,0.98), (0.5,0.9), (0.6,0.8), (0.7,0.65), (0.8,0.61), (0.85,0.6), (0.9,0.6), (1,0.6))) Units: Dmnl
We use a lower reference point of 0.35 fish density (output = 1, at max operating costs) and an upper reference point of 0.85 fish density with an output of 0.6 of max operating costs.
TAC Setting
adjusted fish stock = MIN(Scientists' Perception of Fish Stock, max fishery size/2) Units: tons An upper stock reference (USR) is implemented.
scientific proposed TAC = (MAX ((Scientists' Perception of Fish Stock − max fishery size/2), 0)/time to close BioM gap + (“r, rate, science”) × adjusted fish stock × (1 − adjusted fish stock/max fishery size)) × (1 − preCautionary) Units: tons/Year
There are 3 components here: (1) Is the gap between the biomass and k/2, or actually the scientific perception of biomass and the (max fishery size/2), and this gap is reduced gradually over time, max is used to prevent a negative gap, (2) This is the Schaefer model (surplus production or Biomass Dyanmic Model), so surplus production is = r B (1 − B/Bmax), and (3) The last expression × (1 − PreCautionary) modifies the recommendation to 95% of normal TAC if PreCautionary is set to 0.05. This gives the option of implementing a Scientific TAC based on the Schaefer model or modified to reflect a conservative or PreCautionary approach. Adjusted fish stock represents or = B.
Appendix B. Main Parameters of the ITQ Model
Biological parameters:
| r, base rate (fraction/year) | 0.20 |
| max fishery size (tons) | 40,000 |
| min fish dumping (dmnl) | 0.05 |
| max fraction of stock for recruiting (dmnl) | 0.5 |
| Variation in recruitment: | |
| Standard deviation for pink noise calculation (See [33] for pink noise calculation) | 1 (Figure 9) and 0.05 for all other simulations |
| Economic and management parameters: | (See [41] and [42]). |
| price ($/ton) | $4,000/ton |
| labor cost percentage (dmnl) | 0.6 |
| normal operating costs ($/unit/year) | $6,000 |
| average unit cost ($/unit) | $200,000 |
| discount rate, cost of capital (dmnl) | 0.10 |
| “switch, on/off loans” | 0 (loans are turned off) |
| time to close BioM gap (years) = | 25 |
Scenarios:
| Base case | Over-fished, Stock Rebuilding case | |
| initial fish stock | 38,000 tons | 10,000 tons |
| initial fishing units | 10 units | 200 units |
References
- Chu, C. Thirty years later: The global growth of ITQs and their influence on stock status in marine fisheries. Fish Fish. 2008, 10, 1–14. [Google Scholar]
- Hilborn, R.; Orensanz, J.M.; Parma, A.M. Institutions, incentives, and the future of fisheries. Philos. T. Roy. Soc. B 2005, 360, 47–57. [Google Scholar]
- Milich, L. Resource mismanagement versus sustainable livelihoods: the collapse of the Newfoundland Cod fishery. Soc. Natur. Resour. 1999, 12, 625–642. [Google Scholar]
- Worm, B.; Barbier, E.B.; Beaumont, N.; Duffy, J.E.; Folke, C.; Halpern, B.S.; Jackson, J.B.C.; Lotze, H.K.; Micheli, F.; Palumbi, S.R.; Sala, E.; Selkoe, K.A.; Stachowicz, J.J.; Watson, R. Impacts of biodiversity loss on ocean ecosystem services. Science 2006, 314, 787–790. [Google Scholar]
- Beddington, J.R.; Agnew, D.J.; Clark, C.W. Current problems in the management of fisheries. Science 2007, 316, 1713–1716. [Google Scholar]
- Ludwig, D.; Hilborn, R.; Walters, C. Uncertainty, resource exploitation, and conservation: lessons from history. Science 1993, 260, 17. [Google Scholar]
- Walters, C.J.; Martell, S.J.D. Fisheries Ecology and Management; Princeton University Press: Princeton, NJ, USA, 2004; pp. 128–160. [Google Scholar]
- Shertzer, K.W.; Prager, M.H. Delay in fishery management: diminished yield, longer rebuilding, and increased probability of stock collapse. ICES J. Mar. Sci. 2007, 64, 149–159. [Google Scholar]
- Mace, P.M. A new role for MSY in single-species and ecosystem approaches to fisheries stock assessment and management. Fish Fish. 2001, 2, 2–32. [Google Scholar]
- Worm, B.; Hilborn, R.; Baum, J.; Branch, T.A.; Collie, J.S.; Costello, C.; Fogarty, M.J.; Fulton, E.A.; Hutchings, J.A.; Jennings, S.; Jensen, O.P.; Lotze, H.K.; Mace, P.; McClanahan, T.R.; Minto, C.; Palumbi, S.R.; Parma, A.M.; Ricard, D.; Rosenberg, A.A.; Watson, R.; Zeller, D. Rebuilding global fisheries. Science 2009, 325, 578–585. [Google Scholar]
- Pauly, D.; Christensen, V.; Dalsgaard, J.; Froese, R.; Torres, F. Fishing down marine food webs. Science 1998, 279, 860–863. [Google Scholar]
- Hilborn, R. Managing fisheries is managing people: What has been learned? Fish Fish. 2007, 8, 285–296. [Google Scholar]
- Grafton, R.Q.; Arnason, R.; Bjorndal, T.; Campbell, D.; Campbell, H.F.; Clark, C.W.; Connor, R.; Dupont, D.P.; Hannesson, R.; Hilborn, R.; Kirkley, J.E.; Kompas, T.; Lane, D.E.; Munro, G.R.; Pascoe, S.; Squires, D.; Steinshamn, S.I.; Turris, B.R.; Weninger, Q. Incentive-based approaches to sustainable fisheries. Can. J. Fish. Aquat. Sci. 2006, 63, 699–710. [Google Scholar]
- Branch, T.A.; Hilborn, R.; Haynie, A.C.; Fay, G.; Flynn, L.; Griffiths, J.; Marshall, K.N.; Randall, J.K.; Scheuerell, J.M.; Ward, E.J. Fleet dynamics and fishermen behavior: lessons for fisheries managers. Can. J. Fish. Aquat. Sci. 2006, 63, 1647–1668. [Google Scholar]
- Hilborn, R.; Parrish, J.K.; Litle, K. Fishing rights or fishing wrongs? Rev. Fish. Biol. Fisher. 2005, 15, 191–199. [Google Scholar]
- Wingard, J.D. Community transferable quotas: Internalizing externalities and minimizing social impacts of fisheries management. Hum. Organ. 2000, 59, 48–57. [Google Scholar]
- Costello, C.; Gaines, S.D.; Lynham, J. Can catch shares prevent fisheries collapse? Science 2008, 321, 1678–1681. [Google Scholar]
- Festa, D.; Regas, D.; Boomhower, J. Sharing the catch, conserving the fish. Issues Sci. Technol. 2008, Winter. 75–84. [Google Scholar]
- Arnason, R. Property rights in fisheries: Iceland's experience with ITQs. Rev. Fish. Biol. Fisher. 2005, 15, 243–264. [Google Scholar]
- Branch, T.A. How do individual transferable quotas affect marine ecosystems? Fish Fish. 2009, 10, 339–357. [Google Scholar]
- Dewees, C.M. Assessment of the implementation of individual transferable quotas in New Zealand's inshore fishery. N. Am. J. Fish. Manag. 1989, 9, 131–139. [Google Scholar]
- McCay, B.J.; Creed, C.F.; Finlayson, A.C.; Apostle, R.; Mikalsen, K. Individual transferable quotas (ITQs) in Canadian and US fisheries. Ocean Coast. Manag. 1995, 28, 85–115. [Google Scholar]
- Griffin, R. Sharing the catch. Environ. Def. Fund Solut. 2009, 40, 6–9. [Google Scholar]
- Copes, P. A critical review of the individual quota as a device in fisheries management. Land Econ. 1986, 62, 278–291. [Google Scholar]
- Bromley, D.W. Abdicating responsibility: the deceits of fisheries policy. Fisheries 2009, 34, 280–290. [Google Scholar]
- Steelman, T.A.; Wallace, R.L. Property rights and property wrongs: why context matters in fisheries management. Policy Sci. 2001, 34, 357–369. [Google Scholar]
- Waitt, G.; Hartig, K. Ecologically sustainable fishing in theory and practice: individual transferable quotas in Australia's South East fishery. Aust. Geogr. 2000, 31, 87–114. [Google Scholar]
- Gibbs, M.T. Individual transferable quotas and ecosystem-based fisheries management: it's all in the T. Fish Fish. 2009, 10, 470–474. [Google Scholar]
- Morecroft, J. Managing product lines that share a common capacity base. J. Oper. Manag. 1983, 3, 57–66. [Google Scholar]
- Morecroft, J. Strategic Modeling and Business Dynamics: A Feedback Systems Approach; Wiley: Chichester, UK, 2007. [Google Scholar]
- Cochrane, K.L. Reconciling sustainability, economic efficiency and equity in fisheries: The one that got away. Fish Fish. 2000, 1, 3–21. [Google Scholar]
- Jentoft, S. The community: A missing link of fisheries management. Mar. Policy 2000, 24, 53–59. [Google Scholar]
- Sterman, J.D. Business Dynamics: Systems Thinking and Modeling for a Complex World; Irwin/McGraw-Hill: Boston, MA, USA, 2000. [Google Scholar]
- Dudley, R. A basis for understanding fishery management dynamics. Syst. Dyn. Rev. 2008, 24, 1–29. [Google Scholar]
- Shaeffer, M.B. Some aspects of the dynamics of populations important to the management of commercial marine fisheries. Inter. Am. Trop. Tuna Comm. Bull. 1957, 2, 245–285. [Google Scholar]
- Hilborn, R.; Walters, C.J. Quantitative Fisheries Stock Assessment; Kluwer Academic Publishers: Norwell, MA, USA, 2001. [Google Scholar]
- Fujita, R.M.; Foran, T.; Zevos, I. Innovative approaches for fostering conservation in marine fisheries. Ecol. Appl. 1998, 8, S139–S150. [Google Scholar]
- Zhou, S. Fishery by-catch and discards: a positive perspective from ecosystem-based fishery management. Fish Fish. 2008, 9, 308–315. [Google Scholar]
- Morecroft, J. Rationality in the analysis of behavioral decision models. Manag. Sci. 1985, 31, 900–916. [Google Scholar]
- Barlas, Y. Formal aspects of model validity and validation in system dynamics. Syst. Dyn. Rev. 1996, 12, 183–210. [Google Scholar]
- National Fisherman. Market Report 2010. January 2010. Available online: http://www.nationalfisherman.com (accessed on 10 September 2010). [Google Scholar]
- Maritime Sales. Available online: http://www.maritimesales.com/MH10.htm (accessed on 17 October 2010).
- FishWatch (NOAA). Available online: http://www.nmfs.noaa.gov/fishwatch/species/red_snappper.htm (accessed on 6 October 2010).
- Forrester, J.W. Industrial Dynamics; MIT Press: Cambridge, MA, USA, 1961. [Google Scholar]
- Froese, R.; Proelb, A. Rebuilding fish stocks no later than 2015: Will Europe meet the deadline? Fish Fish. 2010, 11, 1–9. [Google Scholar]
- Smith, T.; Gibbs, M.; Smith, D. Fishing for more effective incentives. Science 2009, 323, 337–338. [Google Scholar]
- Reiss, H.; Greenstreet, S.P.R.; Robinson, L.; Ehrich, S.; Jorgensen, L.L.; Piet, G.J.; Wolff, W.J. Unsuitability of TAC management within an ecosystem approach to fisheries: an ecological perspective. J. Sea Res. 2010, 63, 85–92. [Google Scholar]
- Sterman, J.D. Learning from evidence in a complex world. Am. J. Public Health 2006, 96, 505–514. [Google Scholar]
© 2011 by the authors; licensee MDPI, Basel, Switzerland. This article is an open access article distributed under the terms and conditions of the Creative Commons Attribution license (http://creativecommons.org/licenses/by/3.0/).
Share and Cite
Garrity, E.J. System Dynamics Modeling of Individual Transferable Quota Fisheries and Suggestions for Rebuilding Stocks. Sustainability 2011, 3, 184-215. https://doi.org/10.3390/su3010184
Garrity EJ. System Dynamics Modeling of Individual Transferable Quota Fisheries and Suggestions for Rebuilding Stocks. Sustainability. 2011; 3(1):184-215. https://doi.org/10.3390/su3010184
Chicago/Turabian StyleGarrity, Edward J. 2011. "System Dynamics Modeling of Individual Transferable Quota Fisheries and Suggestions for Rebuilding Stocks" Sustainability 3, no. 1: 184-215. https://doi.org/10.3390/su3010184