1. Introduction
According to the World Energy Outlook [
1], power generation is currently responsible for 41% of global energy-related carbon dioxide emissions. This share is projected to rise to 44% in 2030, mainly due to the growing share of electricity in energy consumption and the continuing strong reliance on coal in both developing and developed countries.
To rectify this situation, it is necessary for every country in the world to switch to a low carbon electricity system or regime. An important contributor is the deployment of low carbon intensive renewable energy at utility scale for (base load) generation or distributed generation close to users. The type of renewable may depend upon local renewable resource endowment, but in general, the more generation capacity from renewable is integrated to the grid, the less the electricity needs to be generated by fossil fuels, assuming access to the grid is in place.
The uptake of renewable energy faces technical, economical and institutional barriers. Along the innovation chain for renewable energy deployment, more public R&D fund can be allocated for the development and perfection of renewable energy technology; closer to the market, private equity capitals should be increased to deploy those advanced technologies at commercial scale so that they can start to leverage upon the learning. In the literature, this is known as the ‘learning investment’ driving the technology down the cost learning curve [
2]. Because R&D usually exhibits spillover effects that prevent private investment to appropriate the knowledge generated, government usually leads the role to finance such activity of ‘public good’ nature. Likewise, learning investment can first be jumpstarted by government and gradually be taken over by the private or market initiatives.
Economically, another important category of policy that accelerates the uptake of renewable is to establish a price for carbon [
3,
4] that would internalize the environmental or social costs of fossil fuels, thus leveling the playing field of the renewable technology. This can be in the form of a carbon tax or by setting an emission cap and letting emitters trade the resulting emission allowances. There are relative merits between these two categories of instruments, but in general it is desirable to stabilize the price of the carbon for a predictability of low carbon investment.
2. Price vs. Quantity (Quota) Approach
In this vein, different governments have attempted to use a price
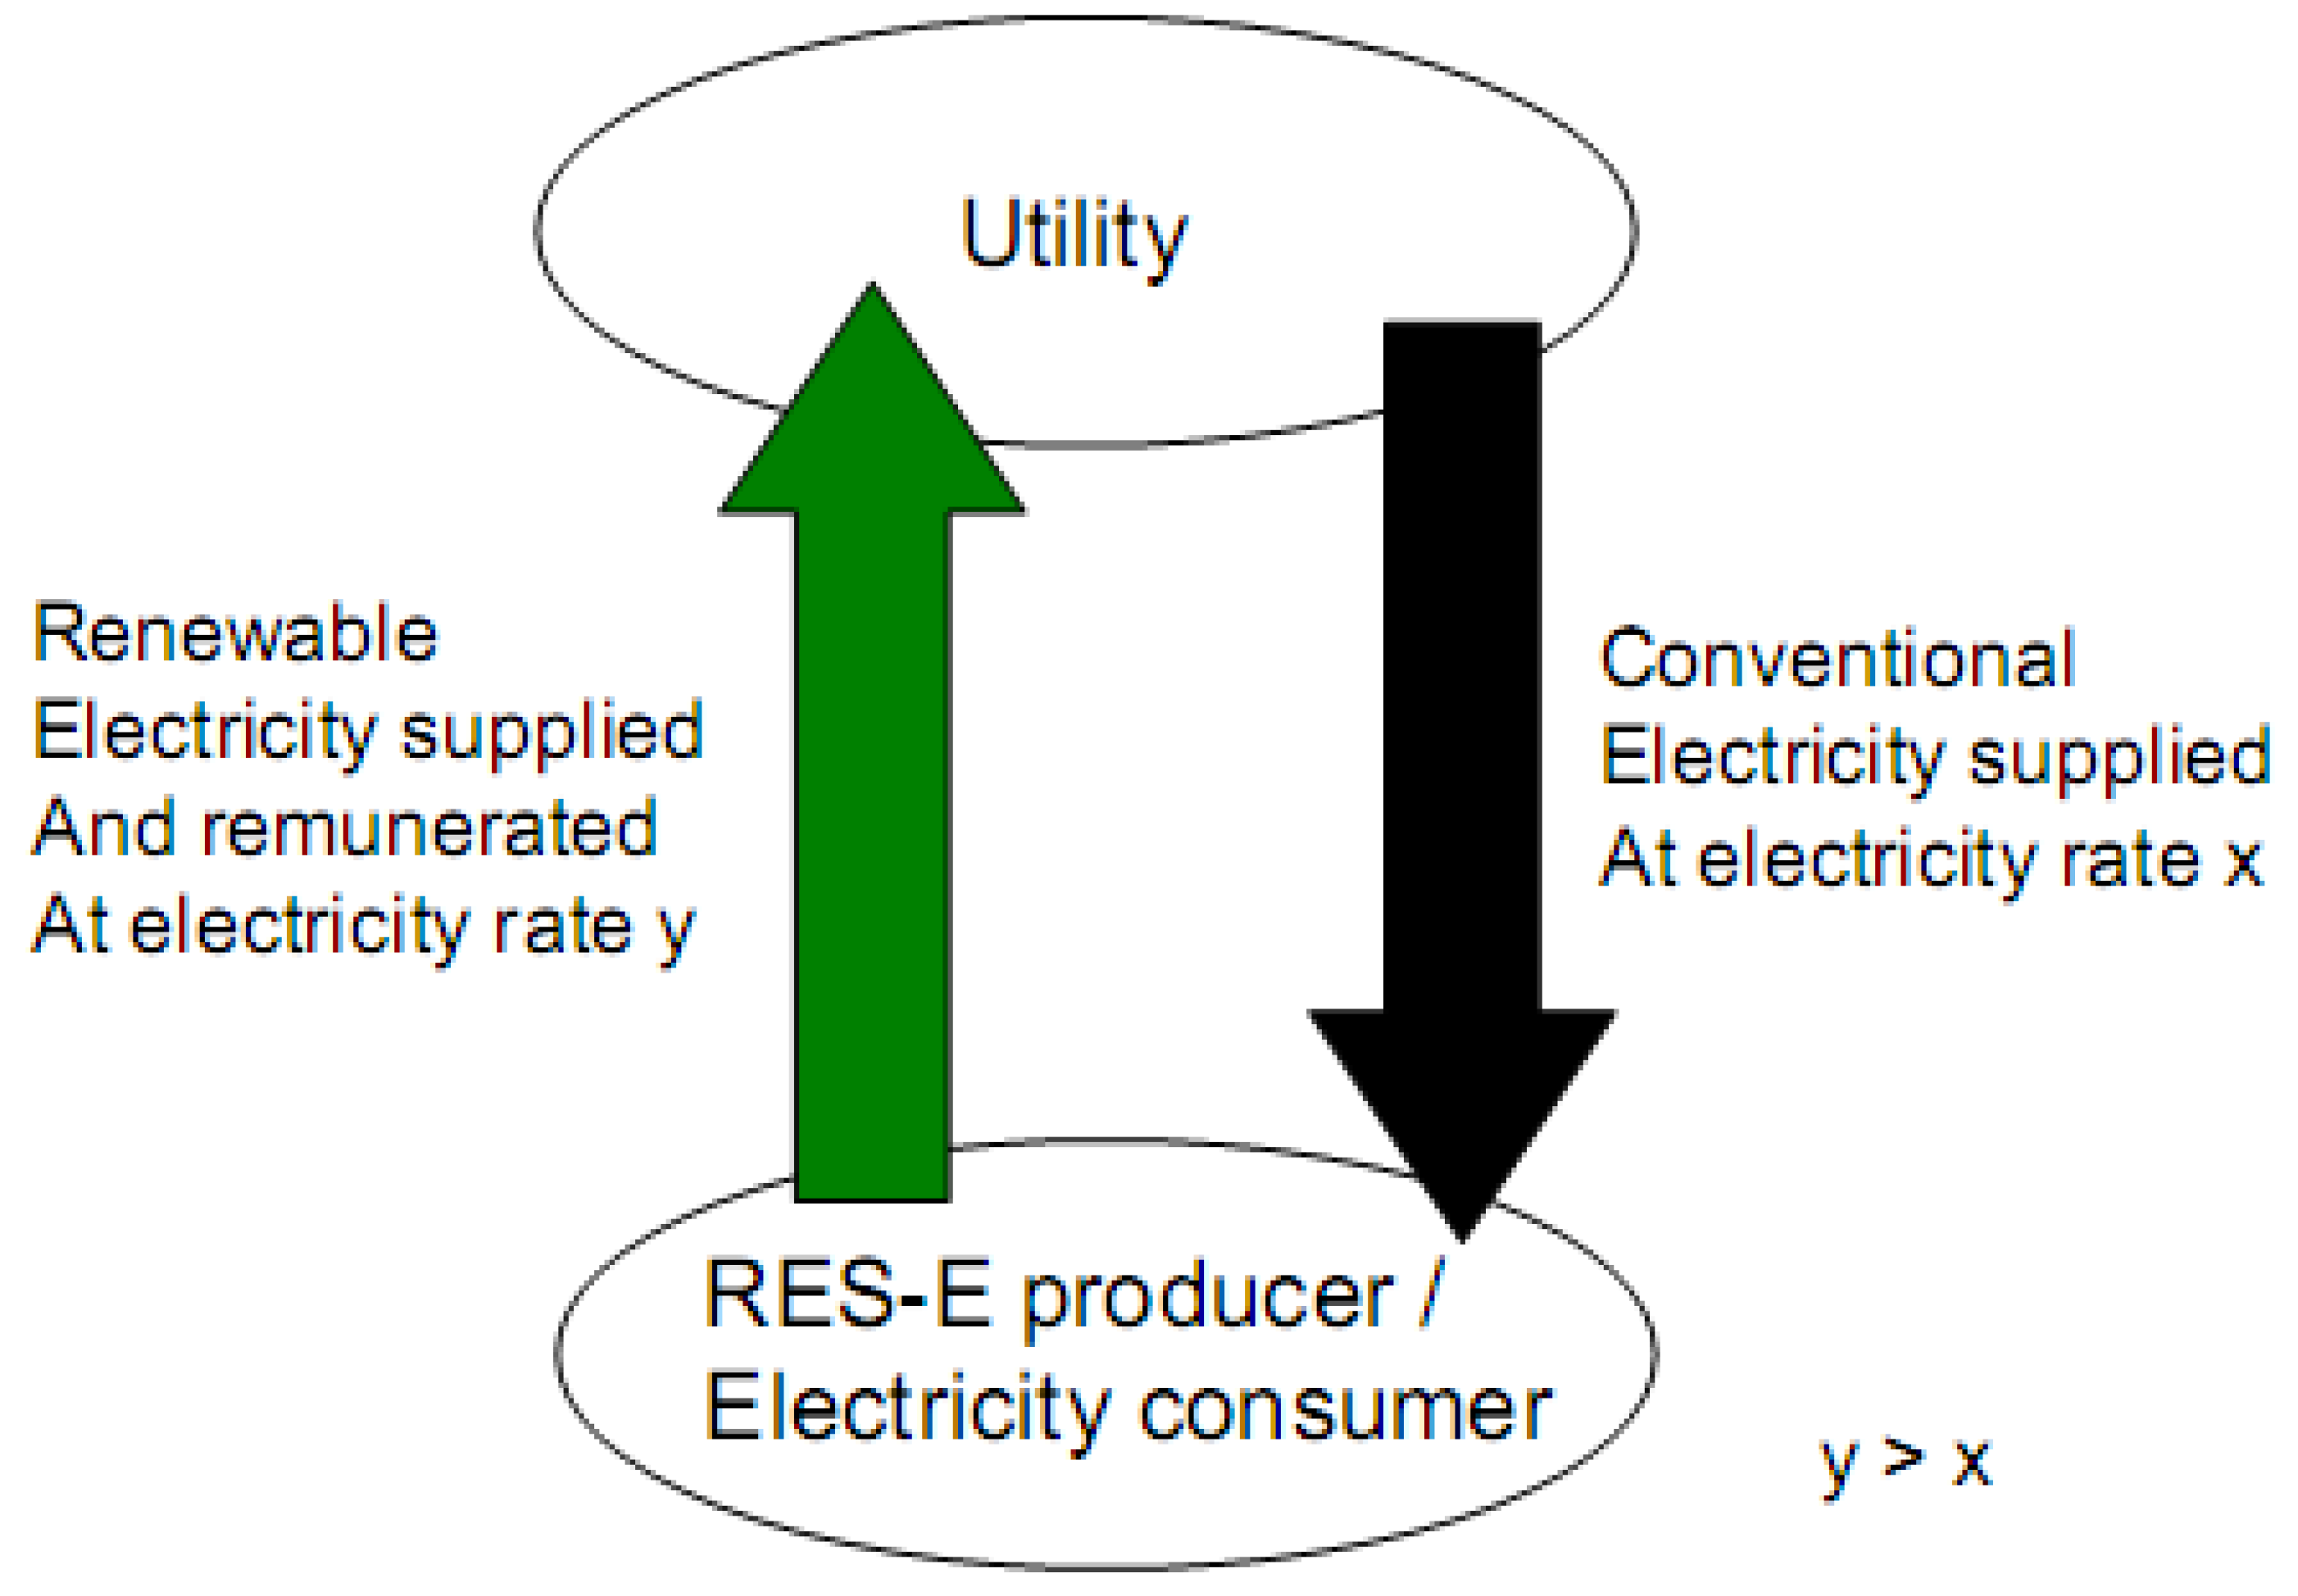
vs. quantity approach for renewable deployment. Briefly, the price approach is such that a utility or electricity supplier is obliged to buy renewable electricity generated from renewable sources (RES-E) at above-market rates set by the government. This is known as the Feed-in Tariff (FiT), illustrated in
Figure 1.
Figure 1.
100% Feed-in Schema (Adapted from [
5]).
Figure 1.
100% Feed-in Schema (Adapted from [
5]).
The quantity approach is a quota based system in which regulatory policies are legislated to place an obligation on electricity supply (centralized fossil fuel based generation) companies to produce a specified fraction of their electricity from renewable energy sources such as wind, solar, biomass, and geothermal. One familiar manifestation of quota-based policy is the Renewable Portfolio Standard (RPS). Extant literature and comparative studies of these two categories of policy suggest that FiT is more effective for distributed generation units of smaller scale that offer equitable opportunity to all willing participants in the market, while RPS would likely lock into the cheapest form of renewable technology and not promote technological diversity [
6], and is more centralized (vertically integrated) or scale-driven in project development.
Quota systems typically do not lead to distributed generation but results in the addition of renewables, mostly wind, to a centralized system of generation. Large wind projects are interconnected at transmission voltages. In this regard, they are no different from any large central station. Thus, most quota systems cannot take advantage of all the attributes that renewable energy offers: most obviously, the ability of renewable energy to be used in distributed applications embedded in the network.
Hvelplund [
7] argued that renewable tariffs create market conditions where the private sector can achieve public policy objectives in a dynamic manner. Moreover, Hvelplund contended that price systems encourage numerous private parties to participate in the market and in doing so reduce the concentration of ownership and the resulting market power found in quota systems. Hvelplund found that price systems are especially good at stimulating competition among product manufacturers, whereas quota systems encourage competition primarily among project developers.
The German market, which is one of the earliest countries to implement the FiT system, is unusual in that ownership of renewables is primarily in the hands of small investors. Germany’s system of renewable tariffs has enabled broad ownership of wind turbines across society. Ads in German trade magazines seek investors for cooperative wind and solar projects—sometimes combined in the same project. It is not uncommon in Germany for farmers to own one or several commercial wind turbines themselves. Much of the staggering growth in solar PV in Germany has been through purchases by individual homeowners and farmers. Likewise, the bulk of biogas and biomass development in Germany has been due to individual farmers or cooperatives of farmers.
Now, if we are to compare these two renewable energy policy genres or governance systems [
8] on the basis of economical advantages, it can be inferred that RPS remains scale-driven that builds a bigger renewable plant using the cheapest form of technology. Enhanced Geothermal Systems (EGS) has such a potential as geothermal reservoirs can be ‘manufactured’ [
4] to very large scale leveraging upon static economy of scale. This renders it more like a cost-driven manufactured technology that fulfills the obligation in the most cost-effective way.
RPS-induced renewable deployment remains a supplier-driven or centralized generation paradigm. For FiT, while utility has to pay a feed-in tariff to renewable generators, if the higher cost of the renewable electricity has to be absorbed by the players in the electricity network; i.e., the cost of purchasing renewable generation and any administrative charges, they are simply passed through on the consumers and households. The non-renewable households then face double disadvantages: they do not have an income from the feed-in tariff paid by the utilities and they have to pay more for electricity from the grid. We argue that this mechanism can potentially be leveraged to mimic the network externality effects for information products. In the case of household in the electricity network, non-renewable households, sharing the same electricity network with other renewable households, do not have an income from renewable generation and has to pay more for renewable electricity generated by the renewable households. The remaining households would therefore have an increased incentive to generate renewable electricity and sell it to the grid. This is an (network) externality effect of the decision of the adopted households. The adoption process would proceed like an equilibrating process and the equilibrium would be met when all the households turn to renewable. The diffusion of renewable energy generation capacity under FiT is cost-driven and also results from the adoption or network externality among small-scale generators in the user side under the decentralized paradigm.
3. Putting Technology into the Energy Policy Framework—Basis of Increasing Return
We attempt in this section to formalize the cost effects and network externality effects with the aid of the notion of technological trajectory. There are a few ways that we can characterize the nature of a technology. The trajectory of a technology is the logic of the problem-solving associated with the development of the technology. In this vein, there are marked, similar and persistent differences amongst industrial sectors in the sources and directions of technical change. These can be summarized in terms of the size of the innovating firms (big
vs. small); type of product made (price sensitive
vs. performance sensitive); innovation objective (product innovation
vs. process innovation); innovation sources (supplier
vs. customer
vs. in-house); own innovation locus (R&D lab
vs. production),
etc. [
9]. We build upon the notion of technological trajectory but we focus on the differences between the broad categories of manufactured technology
vs. information technology and the respective basis of increasing return.
3.1. Manufactured Technology
In the current discussion, we broadly divide two classes of manufactured technology, one based upon built project or Complex Product Systems (CoPS) and the other based upon manufactured product. We review the economics of increasing return associated with each manufacturing paradigm.
CoPS refers to the high-technology, business-to-business capital goods used to produce goods and services for consumers and producers. It has more of an infrastructural outlook rather than the operations involved in the high volume consumption goods. Each individual CoPS is of high cost and made up of many interconnected, often customized parts (including control units, sub-systems, and components), designed in a hierarchical manner and tailor-made for specific customers. Often their sub-systems (e.g., the avionics systems for aircraft) are themselves complex, customized, and costly. As a result of their cost, physical scale and composition, CoPS tend to be produced in projects or small batches, which allow for a high degree of direct user (sometimes owner-operator) involvement in the innovation process, rather than through arms-length market transactions as is normally the case in commodity goods [
10].
The first type of scale effect associated with CoPS is the static economy of scale, which implies that the average total cost will decline with growing production volumes, because the fixed costs of input factors are spread over many products (output). Graphically, this kind of scale effect is reflected by the downward slope of average total cost curve [
11]. The static economy of scale is related to the specific cost structure of the products. Software and drug development are good examples of significant static economy of scale because all such products have a high development (fixed) cost and a negligible variable cost of reproduction and distribution.
The second type of scale effect associated with the manufactured paradigm is based upon learning due to repetition in activities and acts upon the variable cost component of the total cost at the product level. Empirically, there is a positive dynamic relationship between the growth of cumulative output of a manufactured artifact and the growth of productivity or the reduction of per unit variable cost. This is known as learning by doing or learning and experience curve effect [
12].
In the context of renewable energy, Friedman [
13] compared these economies as follow:
…the economic reality that small-scale distributed generation (manufactured) is typically much more costly, on a per-kilowatt-hour basis, than economy of scale (built) central station generation. A five-kilowatt solar photovoltaic array aesthetically placed on the rooftop of a Beverly Hills mansion costs much more, per kilowatt, to install and service than a hundred-megawatt solar thermal trough system installed in Death Valley…
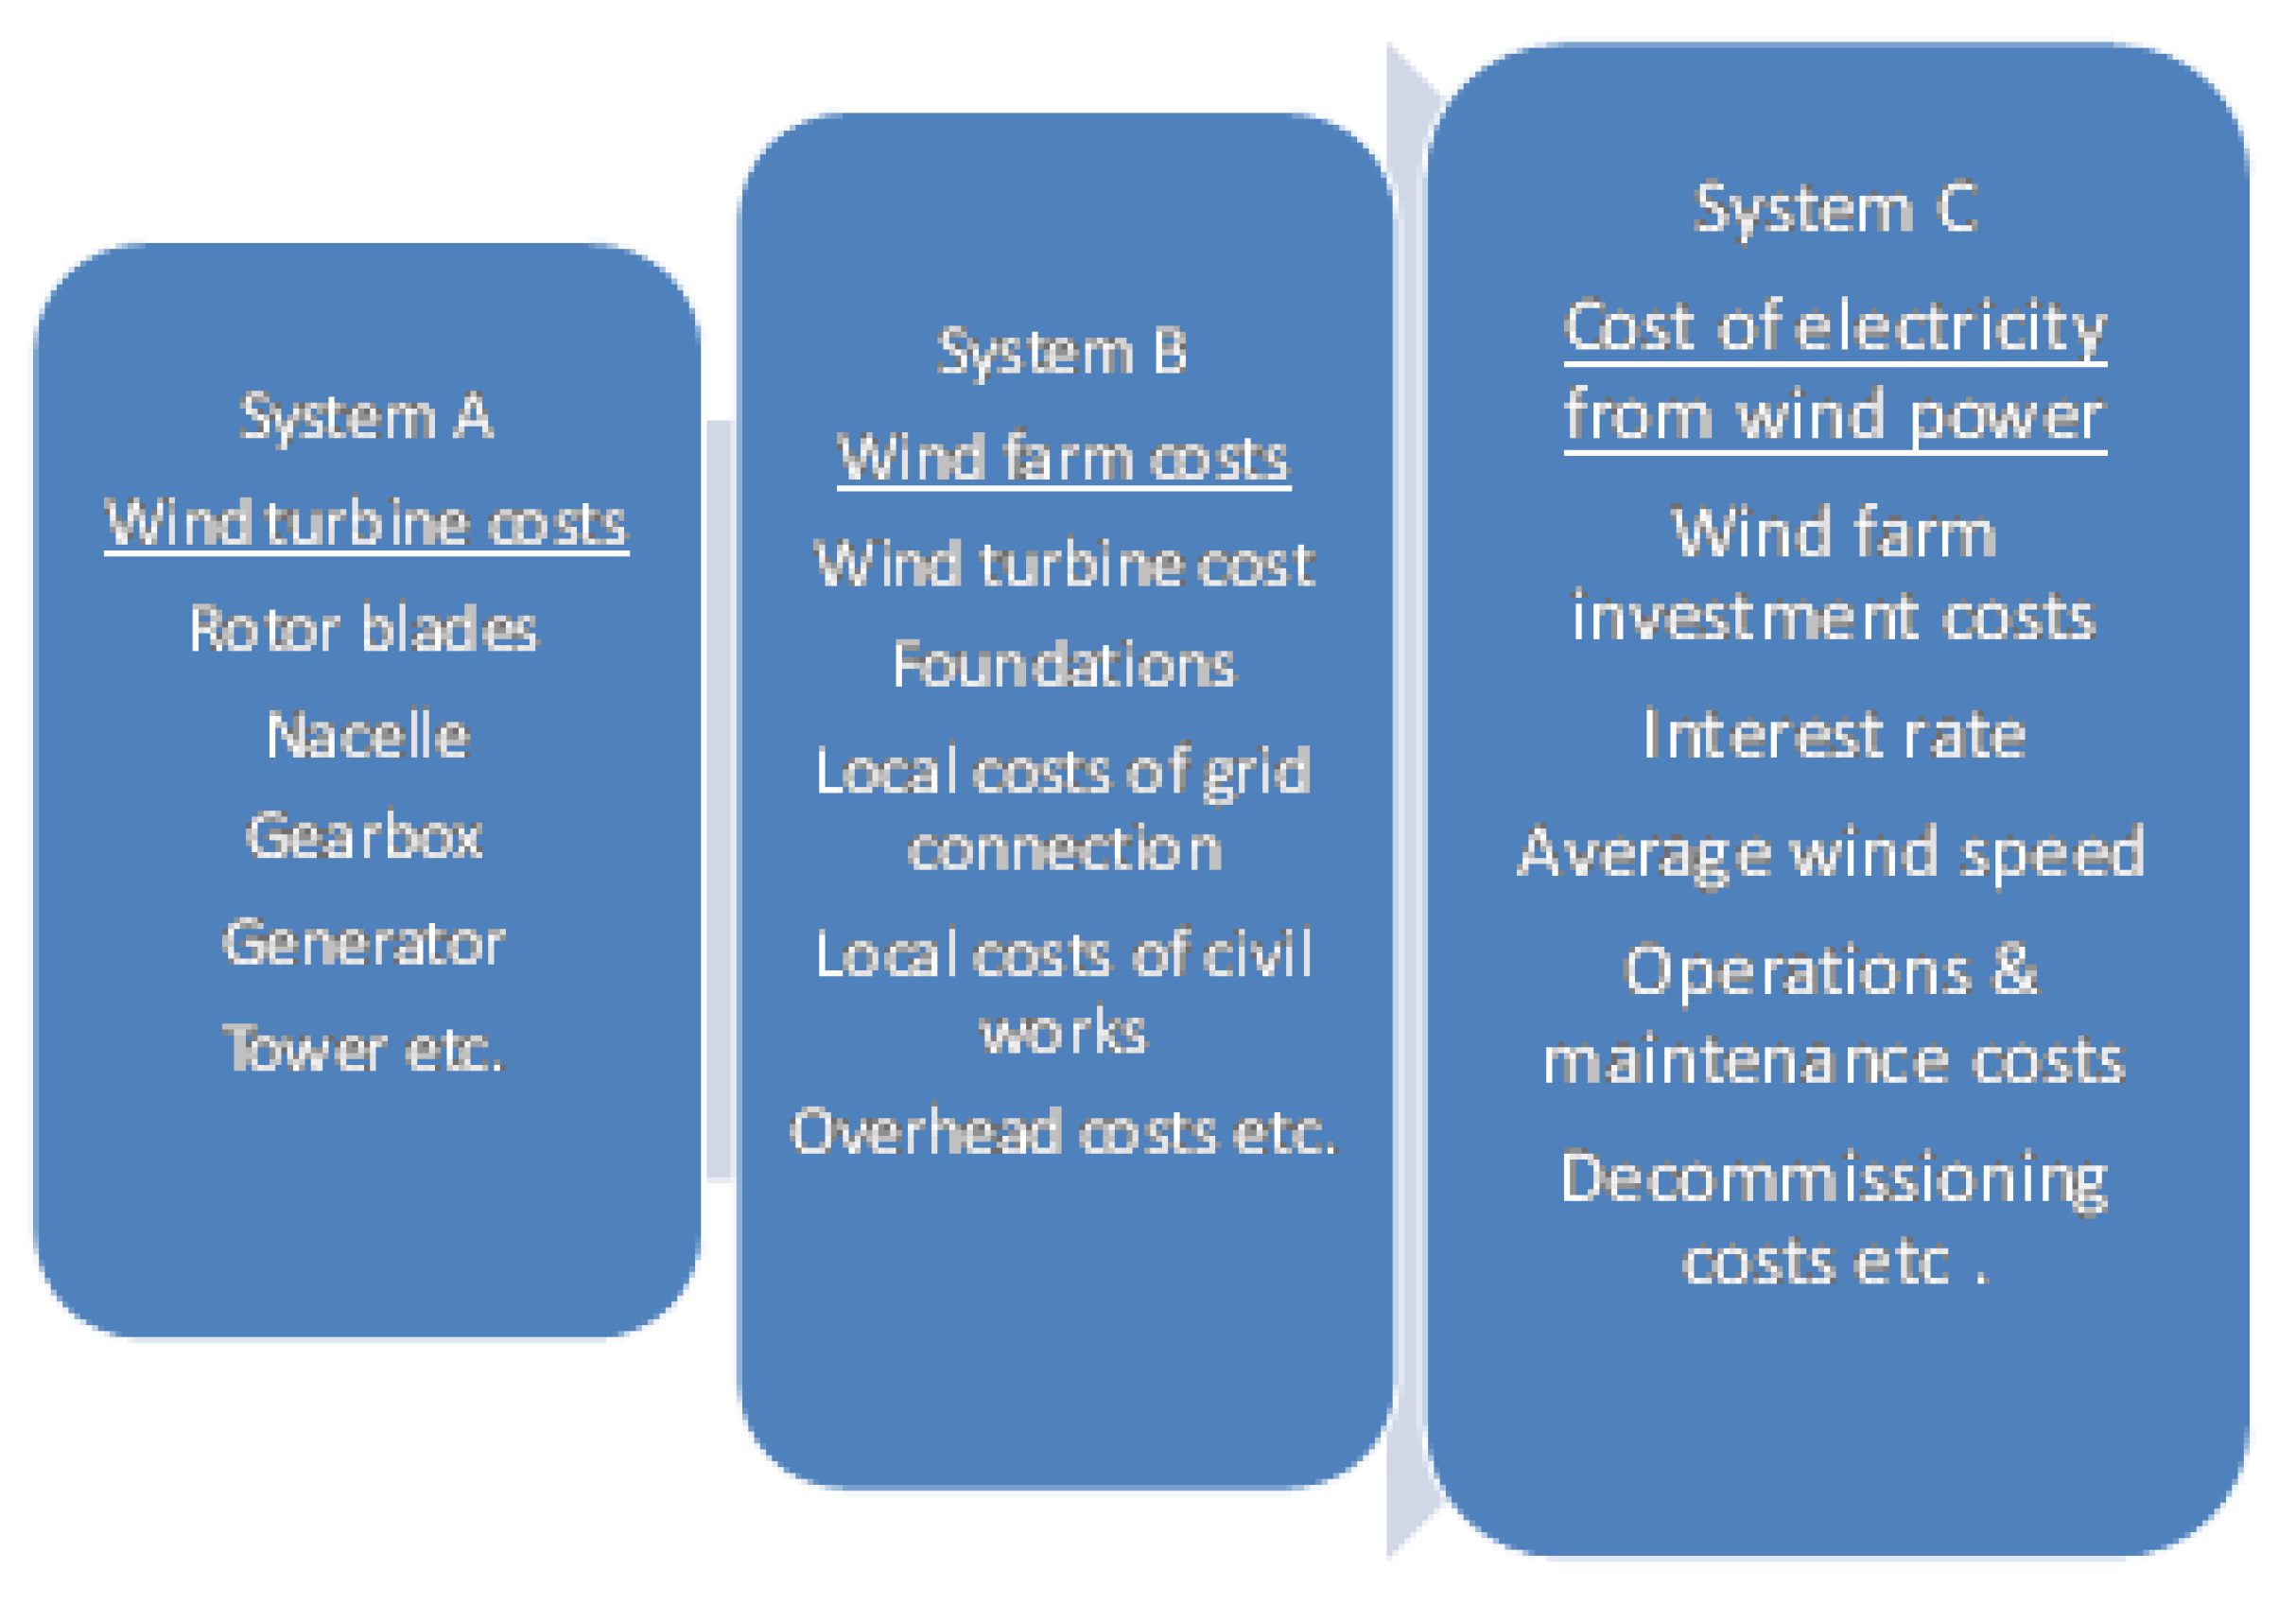
Any large scale centralized renewable energy project such as that of a wind farm would see the coexistence of these two scale effects. The manufacturing costs of the wind turbine in the wind farm is subject to dynamic economy of scale or learning by doing such that the production cost per kW decreases against the cumulative production of wind turbines in terms of capacity at the factory. Beyond the turbines in a wind farm (typically, 65%–85% of total costs of a wind farm are based on turbine costs [
14]), the investment cost of a wind farm is also subject to experience curve effects, but there are many other site specific considerations. A wind farm would necessarily consist of foundations, grid connection, project management,
etc., all of which have some characteristics of fixed costs that are spread among increased generation capacity. This is the static scale effect. Overall, the electricity cost from wind farm would be driven by these two embedded sources of economy. Learning at these three levels of analysis are somewhat nested and can be best conceptualized and depicted by the notion of system boundary (see
Figure 2 [
14]).
Figure 2.
Learning systems boundary or hierarchy associated with cost of electricity from wind power. (Adapted from [
14]).
Figure 2.
Learning systems boundary or hierarchy associated with cost of electricity from wind power. (Adapted from [
14]).
3.3. Network Externality Perspective of FiT Policy Instruments: [18]
For FiT, while utility has to pay a feed-in tariff to renewable generating households, if the higher cost of the renewable electricity has to be absorbed by the households;
i.e., if the cost of purchasing renewable generation and any administrative charges are simply passed through to consumers and households, then the non-renewable households face double disadvantages: they do not have an income from the feed-in tariff paid by the utilities and they have to pay more for electricity from the grid. For example, in Japan, The Ministry of Economy, Trade and Industry (METI) set the feed-in-tariff rate at around ¥50 per kWh (kilowatt hour) for
extra power (in Germany, all the power produced by a PV grid tied system has to be bought by the utility) produced by a household equipped with a photovoltaic power system, up from the average of ¥24 such energy currently goes for on the market. The new system will help households, companies and public facilities to recover the initial outlay of installing solar power systems. But on the other hand, it will lead to an increase in electric bills for customers without such generation capacities, because utilities will pass on the higher cost of purchasing the power [
19,
20]. We can make following suggestions for FiT: Provided that installation of PV is subsidized,
- (1)
As the adopted receive income from FiT, the incentive to adopt augments even further for the non-adopted. (Also important are guaranteed payment for a period of time after installation and priority connection for PV systems granted by the feed-in regime.) This can be regarded as an imitation effect, or a bandwagon effect so as to take advantage of the income possibilities from the FiT system;
- (2)
There is a cost of non-adopting under the FiT system as it incurs a higher energy cost for non-adopting or the laggards [
21] and deprives them of the possible incomes from a FiT system as mentioned in (1); the cost of non-adopting can be seen as all the electricity consumers
in the same network have to contribute to the renewable electricity as is shown in
Figure 1. As adoption grows to generate more renewable electricity, the non-adopted is charged increasingly. It is true that the renewable generator also has to pay but they are compensated, and only the non-adopters get caught. This is somewhat similar to the ‘polluters (non-adopters) pay’ principle, and increases the incentive of adoption. We can therefore qualify this as a network externality effect of adoption. It is very important to note that traditional information technology network externality effects do not have such a ‘punitive’ or ‘avoid the negative’ element. Alternatively, network perspective of FiT instruments, as is suggested in the title, works somewhat differently. This is a point policy makers need to bear upon. In general, it is very important that renewable energy policy leverage potential network externality effect, by design, on the user side. In essence, under FiT, part of the motivation of adoption is to avoid the punitive effect, and relatively speaking, the more pervasive the adoption, the more pronounced the punitive effect.
In the long run, this dynamic process would terminate when all the households have adopted and achieve equilibrium of adoption, provided that all the households are profit maximizing rational agents. All households pay for a higher rate and also get income from renewable generation. This is a dynamic equilibrium.
The biggest contribution of FiT is that it makes the renewable adoption process endogenous within an electricity network. Before achieving the equilibrium, the adoption decision is contingent upon whether others in the network have adopted or not, and is thus justifiably a network externality similar to that of the traditional IT network externality. It is essential for renewable energy policy makers to leverage upon the demand side network externality effect driven by subsidizing the renewable generation revenue such that once a household has installed a solar photovoltaic rooftop system, the other households connected to the same grid would also follow suit to trigger a bandwagon effect [
22].
3.4. Smart Grid
At the network level, there is another enabler of network externality effect which is not financial (policy) oriented but technology oriented. When IT (Information Technology) meets ET (Energy Technology), as Friedman [
13] has suggested, more renewable generators are equipped with intelligent sensors and communication functionalities and can communicate with each other or other energy storage devices for information sharing, buying and selling or trading renewable electricity. All these are made possible with the Smart Grid and various communication protocols implemented on the transmission infrastructure. The more renewable generators are on-line, the more incentive to put other generators on the same grid because there are more trading partners to trade with. This truly accelerates the deployment process leveraging upon network externality—making renewable spread like software or information technology ushering the self-propagation dynamics in the demand or user side. Communication standards and protocols are prerequisites. We suggest that this mechanism is different from a cost learning or (minimization) driven approach to deployment.
There is no doubt that other traditional policies such as installation credits or subsidies need to be in place to defray the initial costs of installation or hardware for households. In addition, cost learning effects in the hardware are also important, but all things equal, policies and institutions subsidizing the actual generation using the hardware facilitate trading among generators and the smart grid can collectively be designed and implemented so that a renewable energy technology, especially those of smaller scale units, can spread like a general purpose technology or information technology. In this vein, smart grid and a set of communication standards and protocols provides a modular platform for different renewable generators at the user sites to be plugged in and start clean electricity buying and selling. Network externality effects are triggered. It would not be far-fetched to suggest that traditional installation credits or capital subsidies address the manufacturing or cost aspect of renewable energy while schemes subsidizing revenue from actual generation has the effect to trigger the network externality aspect of distributed generation. This is a key insight the paper is trying to elucidate.
In closing of this section, we would recapitulate our key idea: when FiT is introduced, renewable adoption decision is no longer autonomous based solely on cost of the hardware. Instead, it is also based upon the income and investment effects of FiT and to avoid the cost of non-adoption network effects. The latter is a punitive and unconventional network effect very different from the traditional IT network effects based on the idea of joining a larger network in order to tap into the utility of the network.
4. Evolutionary Policy Approach
This paper can be positioned to inform a new trend in (energy and environmental) policy making, namely the evolutionary approach. The departure point being the neo-classical approach which is about sustaining a radical innovation using financial instruments to address externality and market failures. However, the neo-classical approach only provides a general rationale for innovation support but is inherently imprecise in prescribing the detailed pathway(s) of changes.
In the neo-classical approach, one of the most important policy instruments is the types of subsidies mentioned earlier such as feed-in tariff and renewable portfolio standards. The economic rationale is that renewable energy technologies cannot contest against the fossil fuel energy technologies, because a lot of the negative externalities associated with the latter are not internalized in their costs. Should those social costs be included, the renewable electricity may come to grid parity with the fossil fuels electricity. All these instruments can be seen as deliberate policies for the correction of market failure in the sense of neo-classical economics. One serious critic of such price-oriented policies is that these policies rely on a long and potentially weak chain of actions and reactions, which is hoped to eventually lead to the discovery, development and commercialization of carbon free-technologies [
23]. These pricing policies rely heavily on what has been called ‘faith-based economics’.
The other end of the policy continuum is the evolutionary economic approach. The evolutionary approach suggests a variation, selection and retention framework or program of radical innovation for sustainable development. The factors modulating the unfolding of this program consists of several fundamental building block concepts: bounded rationality, diversity, innovation, selection (environment), path dependency, lock-in and co-evolution [
24]. Formulated this way, evolutionary processes are fundamentally without a goal or target and normative elements needed to be introduced for the assessment purpose. How the goals are achieved is also not explicit or deterministic. These are among some of the shortcomings of using an evolutionary approach to achieve policy objectives.
In recent years, there are more refined and well-developed formulations of evolutionary processes towards achieving sustainable development. The approach of ‘strategic niche management’ highlights the importance of protected spaces and of user involvement in early technological development to create new paths that can achieve sustainability objectives, e.g., to replace unsustainable technologies. There are some concerns about the niche approach, e.g., it is too much of a bottom-up strategy and cannot be used as a stand-alone tool to achieve changes. Nevertheless, it is useful for generating the learning about needs and technology imperfections and the remedial strategies. It may also help to build actor networks. A specification of external determinants of niches and their growth beyond these is necessary [
25]. In some senses, some niches are more strategic than others and what determines how strategic these initial niches are? Shum and Watanabe [
26] suggested that the standardized residential solar PV photovoltaic system serves as such a niche for the application of direct installation subsidies, as it maximizes the effect of ‘learning before doing’ thus greatly reduces the amount of learning investment for this PV application in Japan.
Transition management refers to a broader scope on system changes and innovation. (A technological system is made up of a number of elements: actors and their competencies, institutions, networks and a set of basic functions such as new knowledge creation, guiding direction of search process, supply of resources, external economies such as information exchange, knowledge and vision and the facilitation of the formation of markets [
27].) Transition management relies on the processes of ‘variation and selection’ rather than a top-down planning approach. It makes use of ‘bottom-up’ developments and long term goal and is not concerned with specific outcomes but rather with mechanism of change. A mechanism of self-correction based on policy learning and social learning is part of transition management. Some salient features are long term thinking as a framework for short term actions and thinking in terms of multiple domains [
24]. Transition management is a multi-level governance for shaping processes of co-evolution using visions, transition experiments and cycles of learning and adaptation. It is most prominently used in the Netherlands by the national government as a model for sustainable development.
Window of opportunity or the time strategic evolutionary policy approach starts from the diagnosis of a possible lock-in problem that hinders the market introduction and diffusion of environmental technologies. There is a very strong emphasis of window of opportunity in terms of the stable and unstable phases of technological competition. (A more general taxonomy is available in [
28] on the interaction between new technology and incumbent technology,
i.e., predator and prey, symbiosis,
etc.) This (evolutionary) approach has a strong underpinning of techno-economic dynamics. Techno-economic windows of opportunity are defined as the unstable phases of technological competition in which an established technology (the locked-in incumbent) becomes unstable due to external factors or internal problems (it is unsustainable).
4.2. Product Functionality vs. Network Effects
For traditional high technology products, functionalities related to the stand-alone product itself, e.g., advanced features, quality and reliability, are the key factors for the success of new products, due to the independence of adopted decisions of potential buyers. For products with network effects, adoption utility would be derived from (1) intrinsic product functionalities described above and (2) installed base or network size which determines the network value. It is important to note that (2) is subjected to nonlinear effects. Minor installed base advantages in the first stage of diffusion or the ‘initial conditions’ [
29] would be enlarged or amplified. Metcalfe’s law even implies that network value is in direct proportion to the square of installed base. These two effects do not need to be considered as separate or exclusive. For products with network effects, the better the functionalities they have, the larger the network effects would be created, compared with similar products with less advanced features. Incorporating the FiT-based network externality effects, these two categories of network effects, one rooted in the product features and the other rooted in or derived from policy instruments, make renewable energy more capable to generate nonlinear network effects to be leveraged in renewable deployment policy.
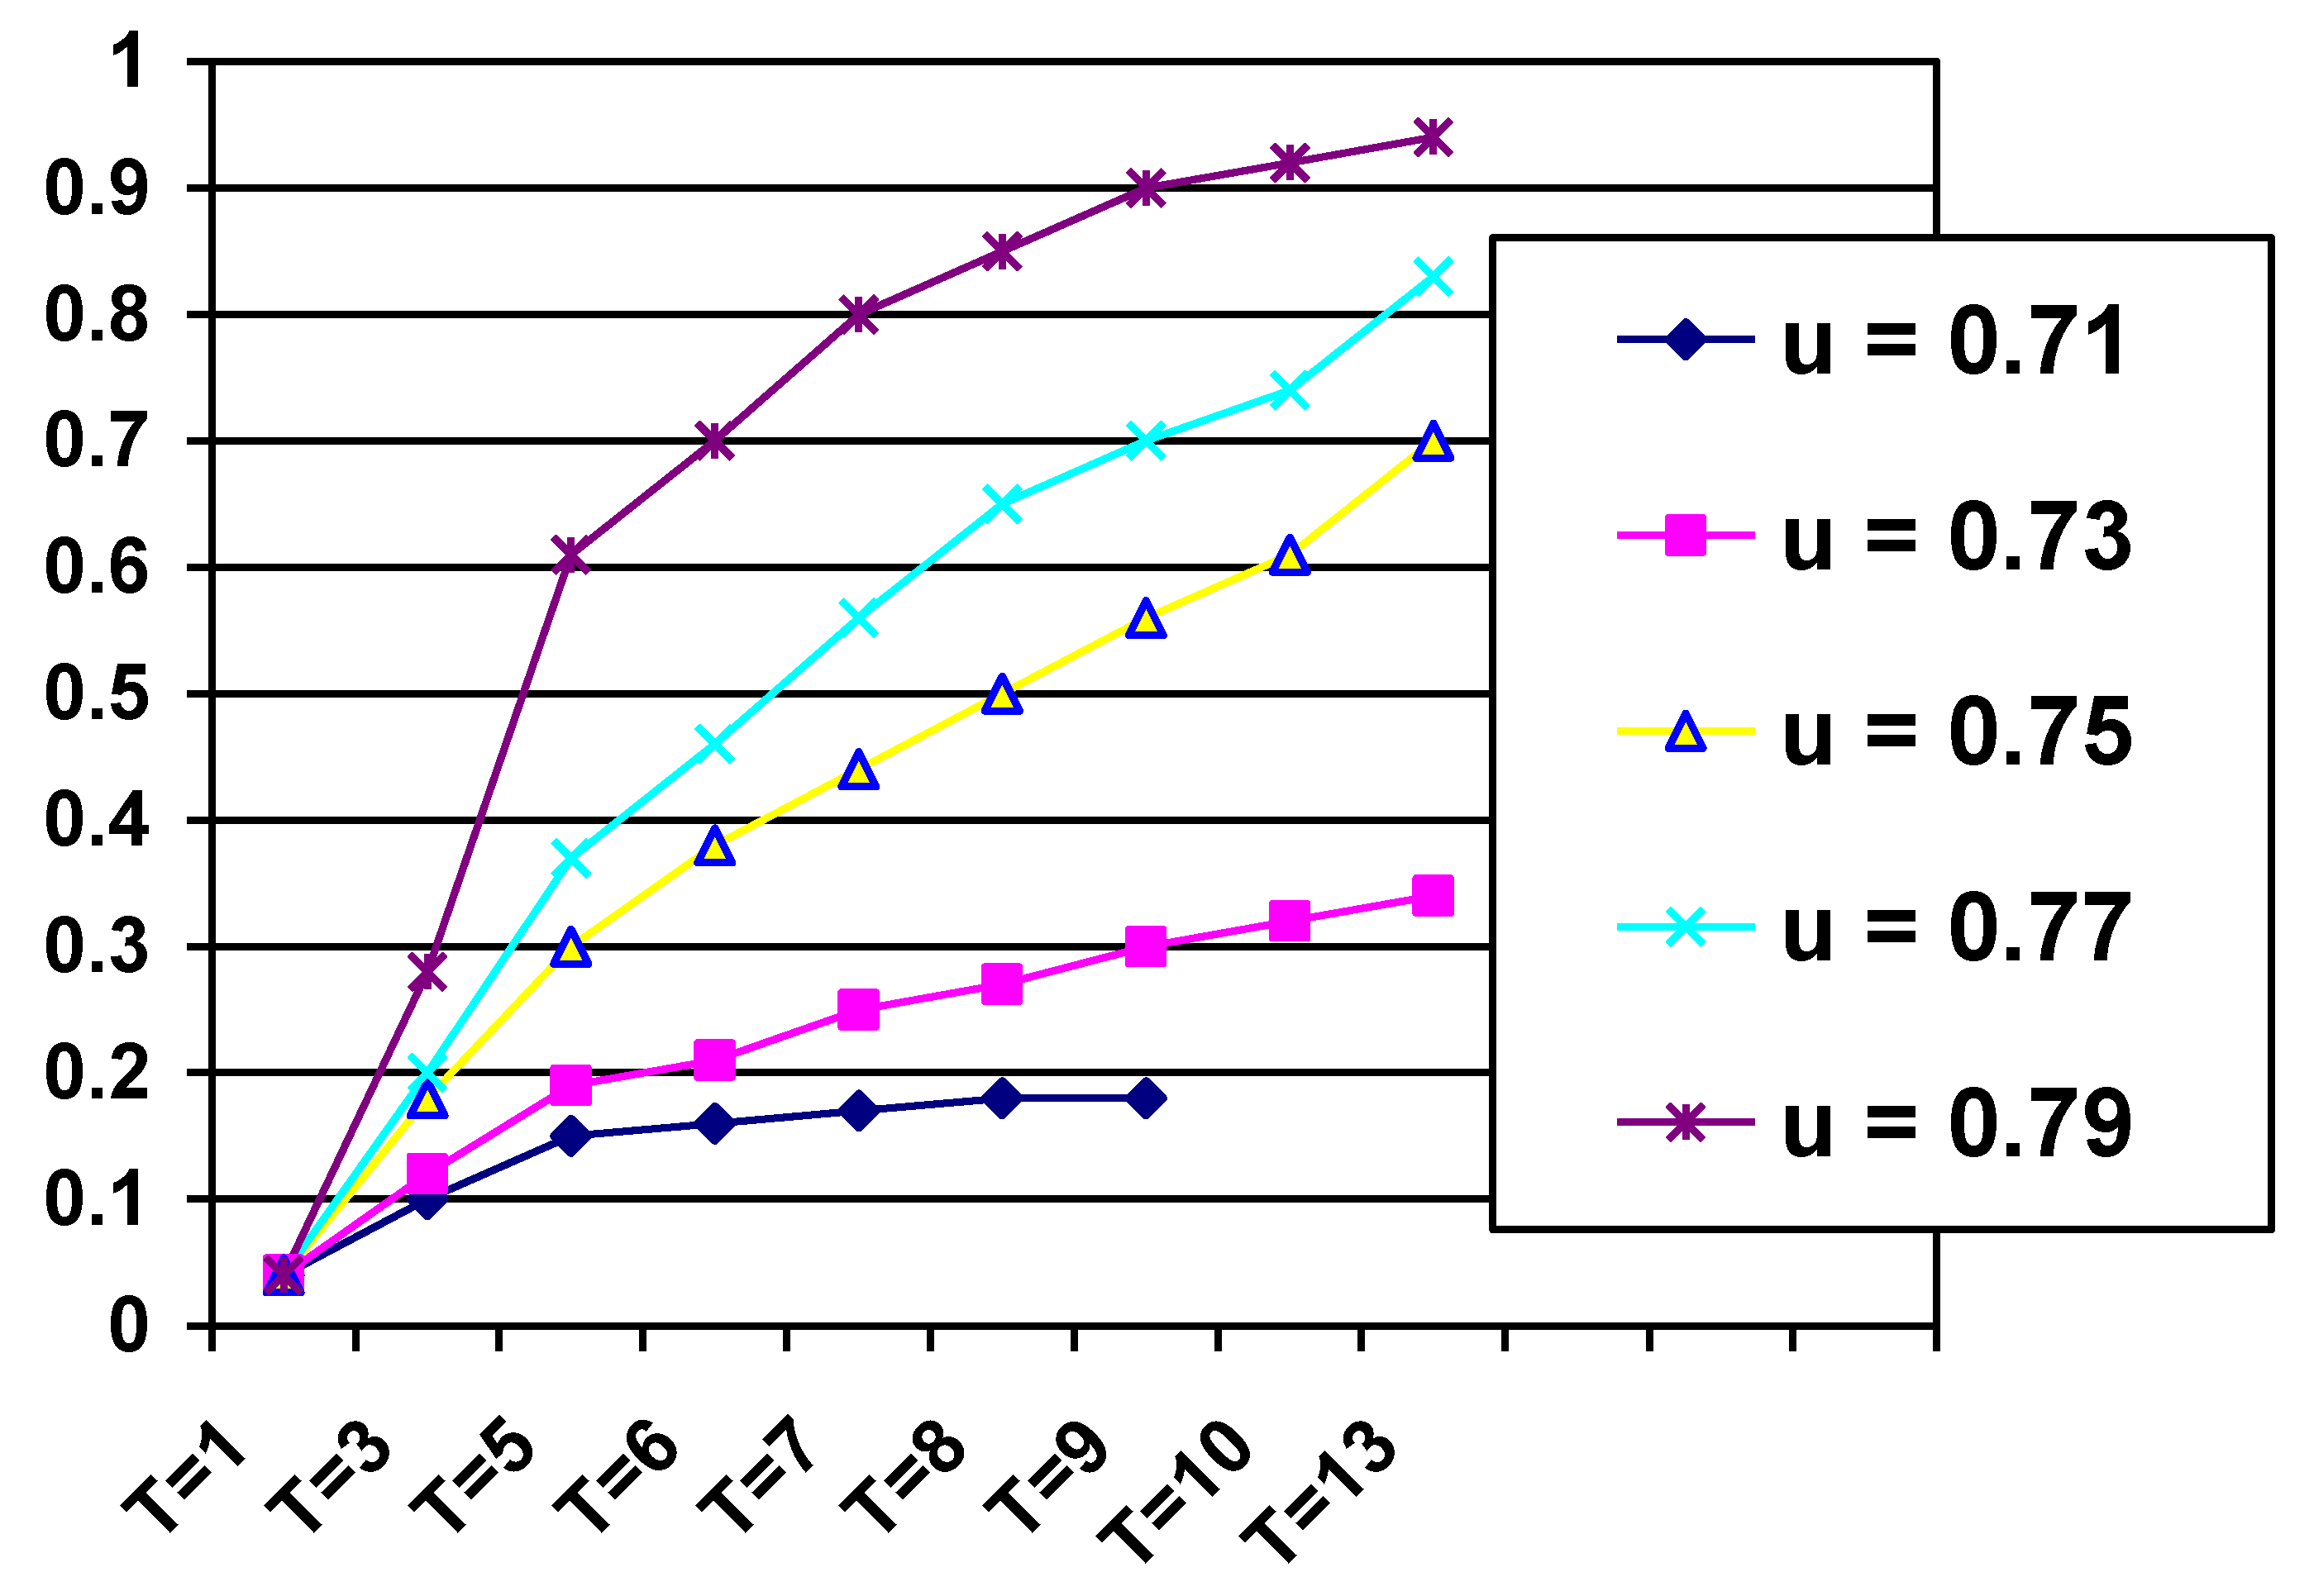
There are some diffusion simulation results which suggest that if the intrinsic functionalities of the standalone product influence the strength of the network effects, then there is a threshold intrinsic value (μ = 0.75 in
Figure 3) the product must carry in order to trigger the network effects and sustain a traditional logistics curve diffusion pattern. (A specification of the agent’s utility of adopting a product with strength of network externality effects depending upon the functionality of the product:
Vi =
μi +
Wi;
Wi =
wμi, where
μi is the utility derived by using the stand-alone product and
Wi is the utility derived from the network effect.)
Figure 3.
Diffusion curve pattern of product exhibiting network externality effects depending upon the intrinsic value (u) of the standalone product all with same initial installed base; the vertical axis is the extent of the diffusion with maximum being unity or at the carrying capacity of the diffusion process. (Adapted from [
30]) Note: the cases for u = 0.71 and u = 0.73 can be assumed that the diffusion process cannot be sustained as it never reaches close to the carrying capacity of the process.
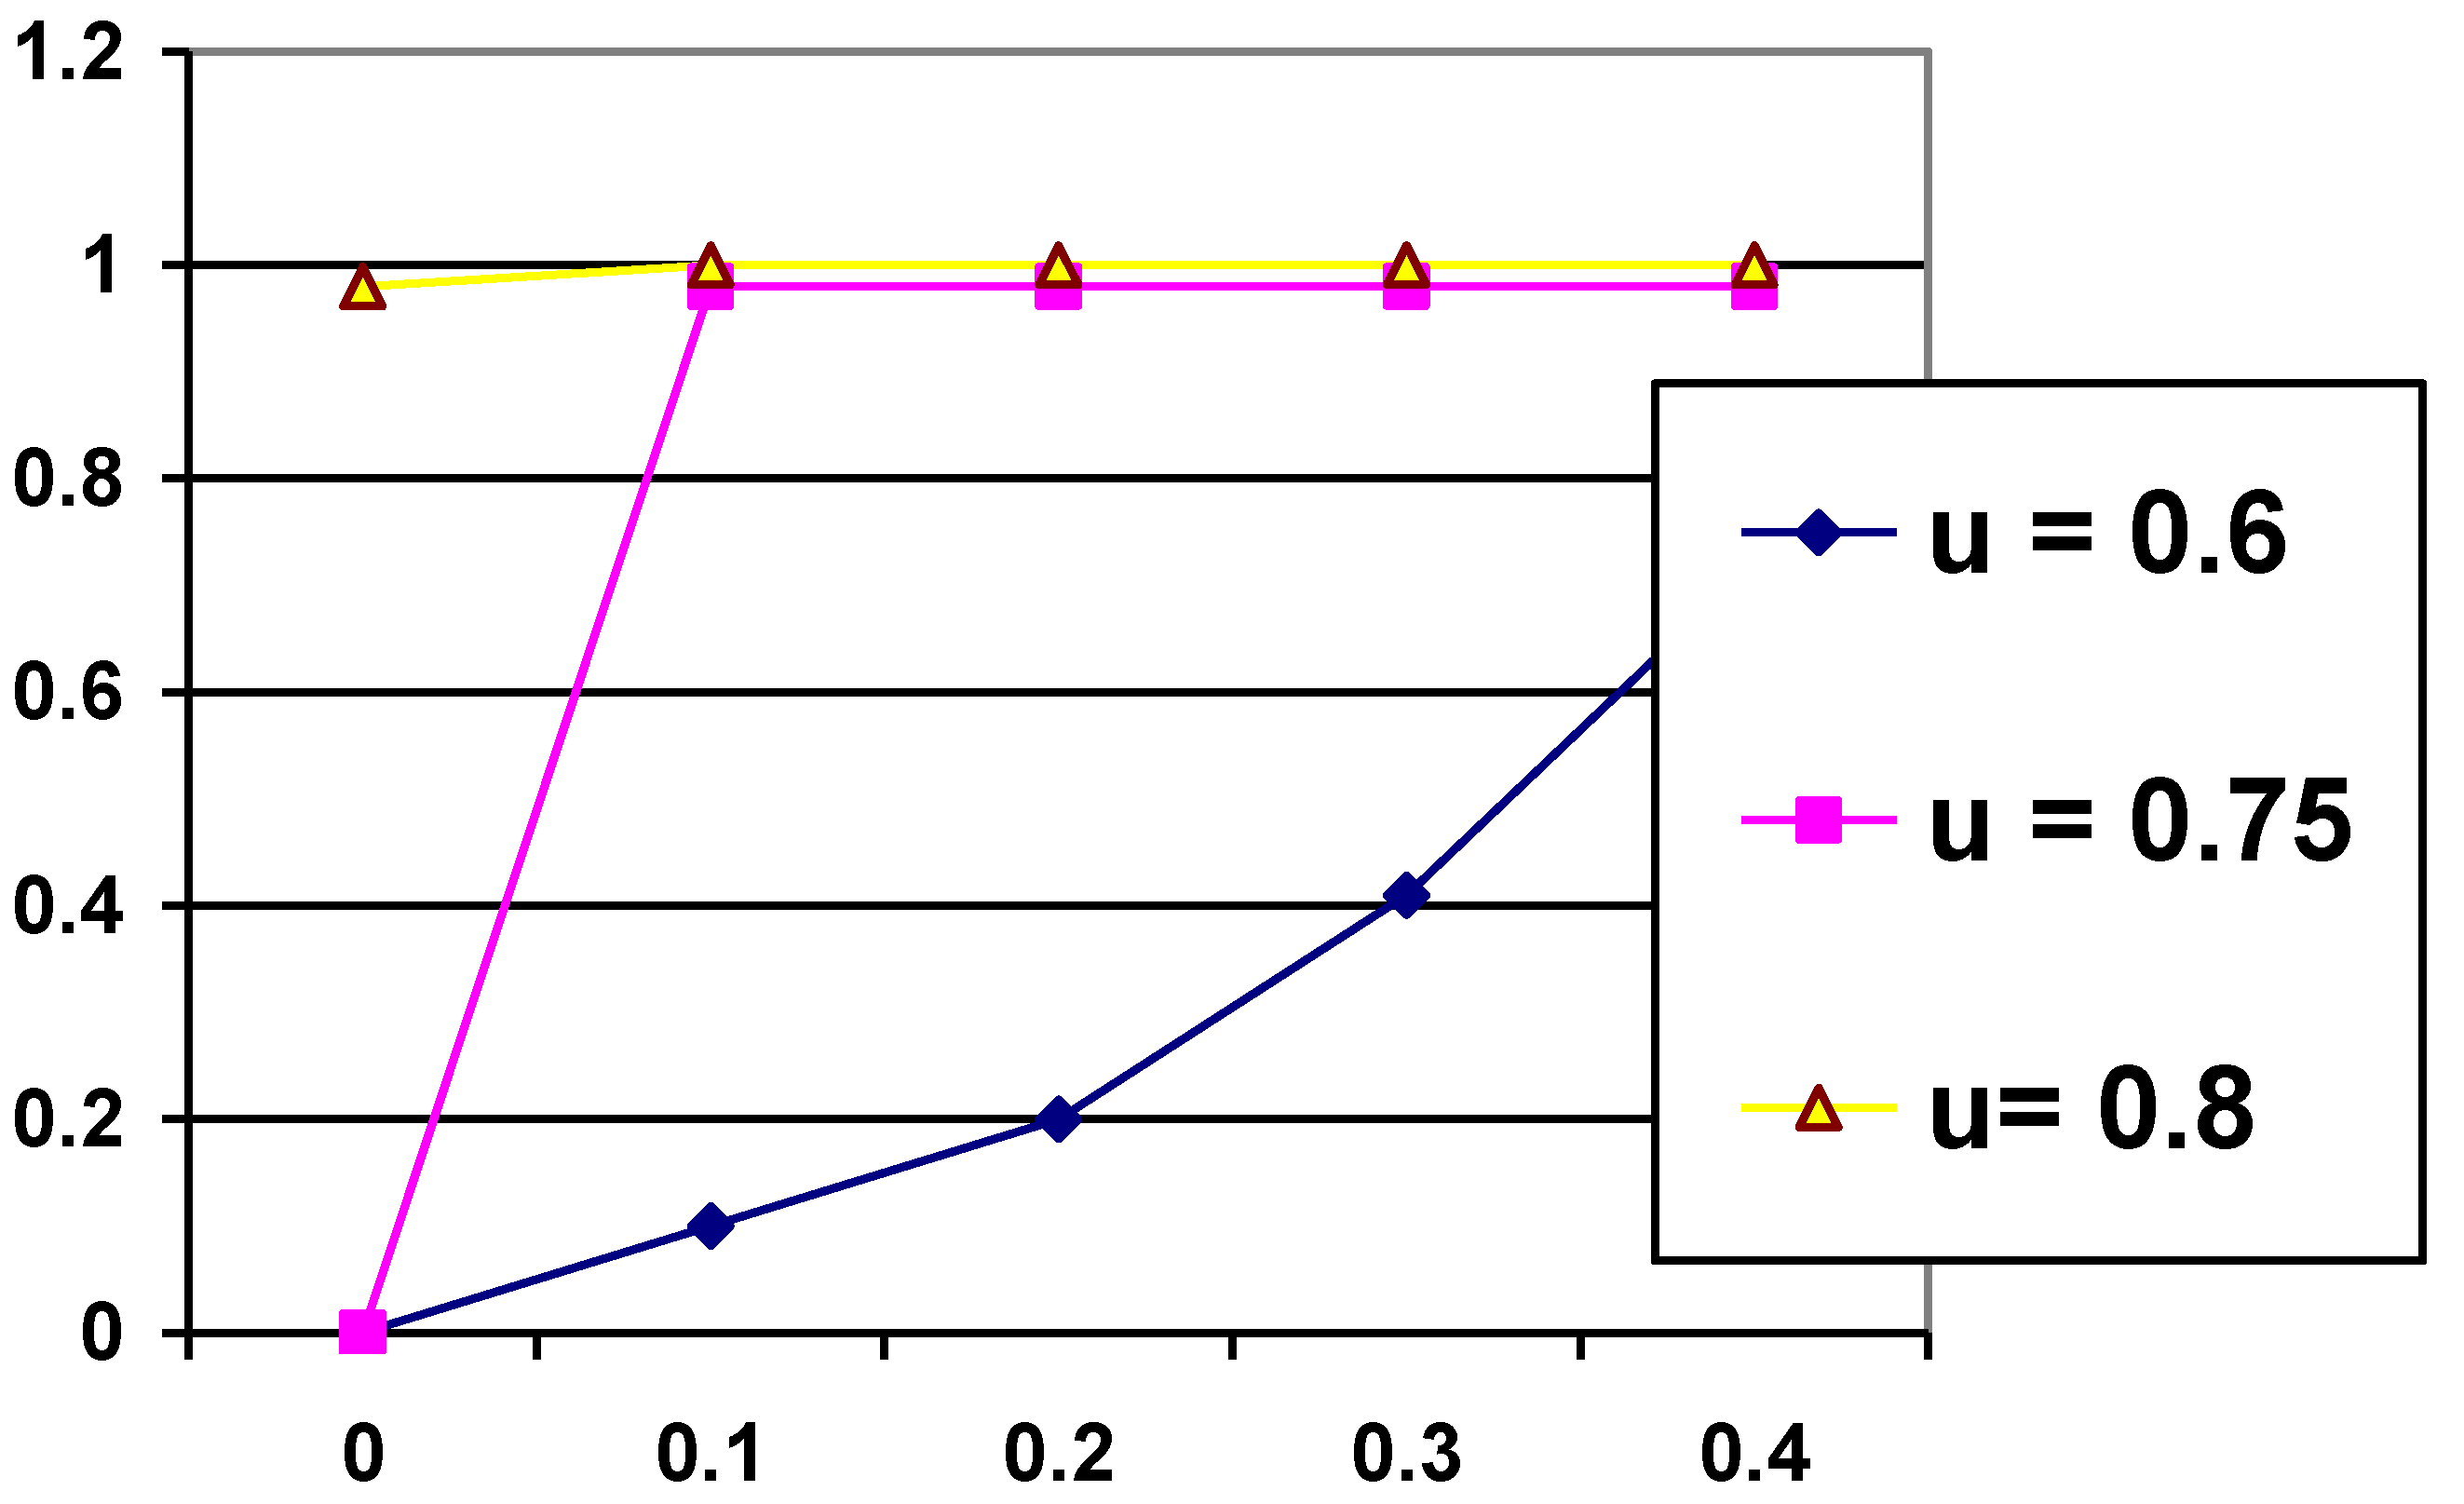
In terms of initial installed base, which is traditionally one of the strategic variables for firms to manage products with network effects,
Figure 4 offers a more insightful picture showing that the effects of the initial installed base on the diffusion process depends on the starting value of that embedded intrinsic value, which is assumed to be directly proportional to the product features of the technology. When μ = 0.8 (>0.75 above), the contribution of the network effect to diffusion is minimal; the product is so good that the adoption process proceeds by itself. However, when μ = 0.6, the diffusion pattern is mainly driven by the network effects and is contingent upon the initial installed base.
Figure 4.
Relationship between initial installed base and diffusion rate; horizontal axis is the initial installed base %, vertical axis is the extent of the diffusion process with maximum being at unity or the carrying capacity of the diffusion. (Adapted from [
30]).
Figure 4.
Relationship between initial installed base and diffusion rate; horizontal axis is the initial installed base %, vertical axis is the extent of the diffusion process with maximum being at unity or the carrying capacity of the diffusion. (Adapted from [
30]).
There is an important policy implication here: a high intrinsic value due to advanced product features speeds up the diffusion process and which is independent upon the starting installed base. When the intrinsic value associated with the renewable product or equipment is relatively low, the remedy is to subsidize the initial base installation in order to increase the installed base. FiT schema and smart grid infrastructure can then be used to trigger (different) network effects. We therefore think installation subsidies and income subsidies (such as FiT) play different and sequential roles (more on this in the last section). A strategic leverage of when to judiciously use these two instruments should be part of good and prudent renewable energy policy making.
Based on the above, renewable energy technology suppliers should focus upon product quality or its manufactured aspects such as product functionalities, instead of relying solely upon a large installed base to jumpstart the diffusion process [
30]. For small scale distributed generation units, fitting them with communication (information communications technology, ICT) functionalities and energy storage technology such as battery is an important pre-requisite, as both would increase the intrinsic value of the unit. Alternatively, the product development at the artifact level should complement to installation subsidies and FiT instruments.
The three play a joint role in the effective deployment of small form factor renewable equipment. We strongly suggest that renewable deployment can be approached or conceptualized as leveraging upon network effects but has implications to product innovation efforts at the product level. Installation-subsidizing instruments reinforce the manufactured aspect of the equipment, while income instruments subsidizing the generation revenues would trigger a network effect similar to the traditional IT network effects. In turn, the interaction of these two effects is mediated by efforts at product level in terms of the price to performance intrinsic value ratio. Our analysis lends the evolutionary approach more details compared with the excessively deductive manner of the neo-classical approach (
Figure 5). Policy makers need to understand the interactions of these product and network level levers in the management of the diffusion process.
Figure 5.
Positioning of our paper relative to different policy approaches to facilitate transition to a low carbon electricity regime—a more inductive and technology oriented approach.
Figure 5.
Positioning of our paper relative to different policy approaches to facilitate transition to a low carbon electricity regime—a more inductive and technology oriented approach.
5. Future Renewable Energy Policy Implications
We have argued elsewhere that how the renewable energy technology is designed or realized would also have an effect on the effective deployment process. Overall, is the technology realized as a rather standard product/appliance or as a somewhat site-specific project configuration [
30]? This is the physical technology aspect. The social technology aspect, on the other hand, broadly refers to the policies and institution aspects that are established in order to incentivize and accelerate the deployment process. A joint consideration of physical and social technology aspects [
31] of the renewable energy technology under consideration may serve as a more comprehensive energy policy framework that ties up the somewhat cluttered energy policy formulations and developments. In fact, empirical analysis of (systems) integration costs and diffusion patterns in the grid tied residential PV system category confirms the differences of these two patterns are statistically significant across different combinations of the two aspects of a renewable technology.
In the context of the current paper, different instruments like RPS or FiT leverage different economies in scaling up the deployment process. This can be generalized as different technological trajectories with associated innovation focus. Physical technology and social technology should be developed to ‘match’ each other to reinforce that focus. A summary can be depicted (
Table 1).
Table 1.
Complementary social and physical technology innovation focus for RPS and FiT instruments.
Table 1.
Complementary social and physical technology innovation focus for RPS and FiT instruments.
| | RPS or Quota Based System | Feed-in Tariff |
|---|
| Renewable energy ‘form factor’ | Centralized plant—takes on CoPS manufactured technology characteristic | Distributed generation plant of smaller form factor |
| Complementary physical technology innovation focus | Static and dynamic economy of scale (for the hardware aspects such as a turbine in a wind farm) | Dynamic economy of scale, product functionality development at product level; storage system, smart grid technology at the network level |
| Complementary Social technology innovation focus | Efficient trading of certificate market, inter-projects cross-learning | Inter-project cross-learning, interoperable communications standards and protocols development, installation subsidies, grid access, etc. |
| Overall renewable energy deployment focus | Supplier side cost minimization; the physical and social technology focus must be complementary to achieve this cost focus for quota based system | Supplier side cost minimization or installation subsidies, product innovation of the equipment; demand/user side adoption network externality; the two would form a virtuous cycle of deployment over time or see an optimal inflection |
An immediate policy corollary of this FiT induced network externality is to develop some implications to the implementation of installation subsidies instruments. Since FiT belongs to the category of income subsidies instruments and is usually used with installation subsidies, it is rather reasonable to address how the two need to complement each other. Here, we suggest that FiT-induced network externality implies a ‘critical mass’ effect beyond which bandwagon dynamics would be triggered (when the cost of non-adoption becomes too large). Taking this into account, installation subsidies should be strategically deployed up to the critical mass adoption level and not beyond to avoid capital abuse. Alternatively, once ‘enough’ installations are subsidized and in place, institution of the FiT instruments should follow to ‘turn on’ the externality effect.
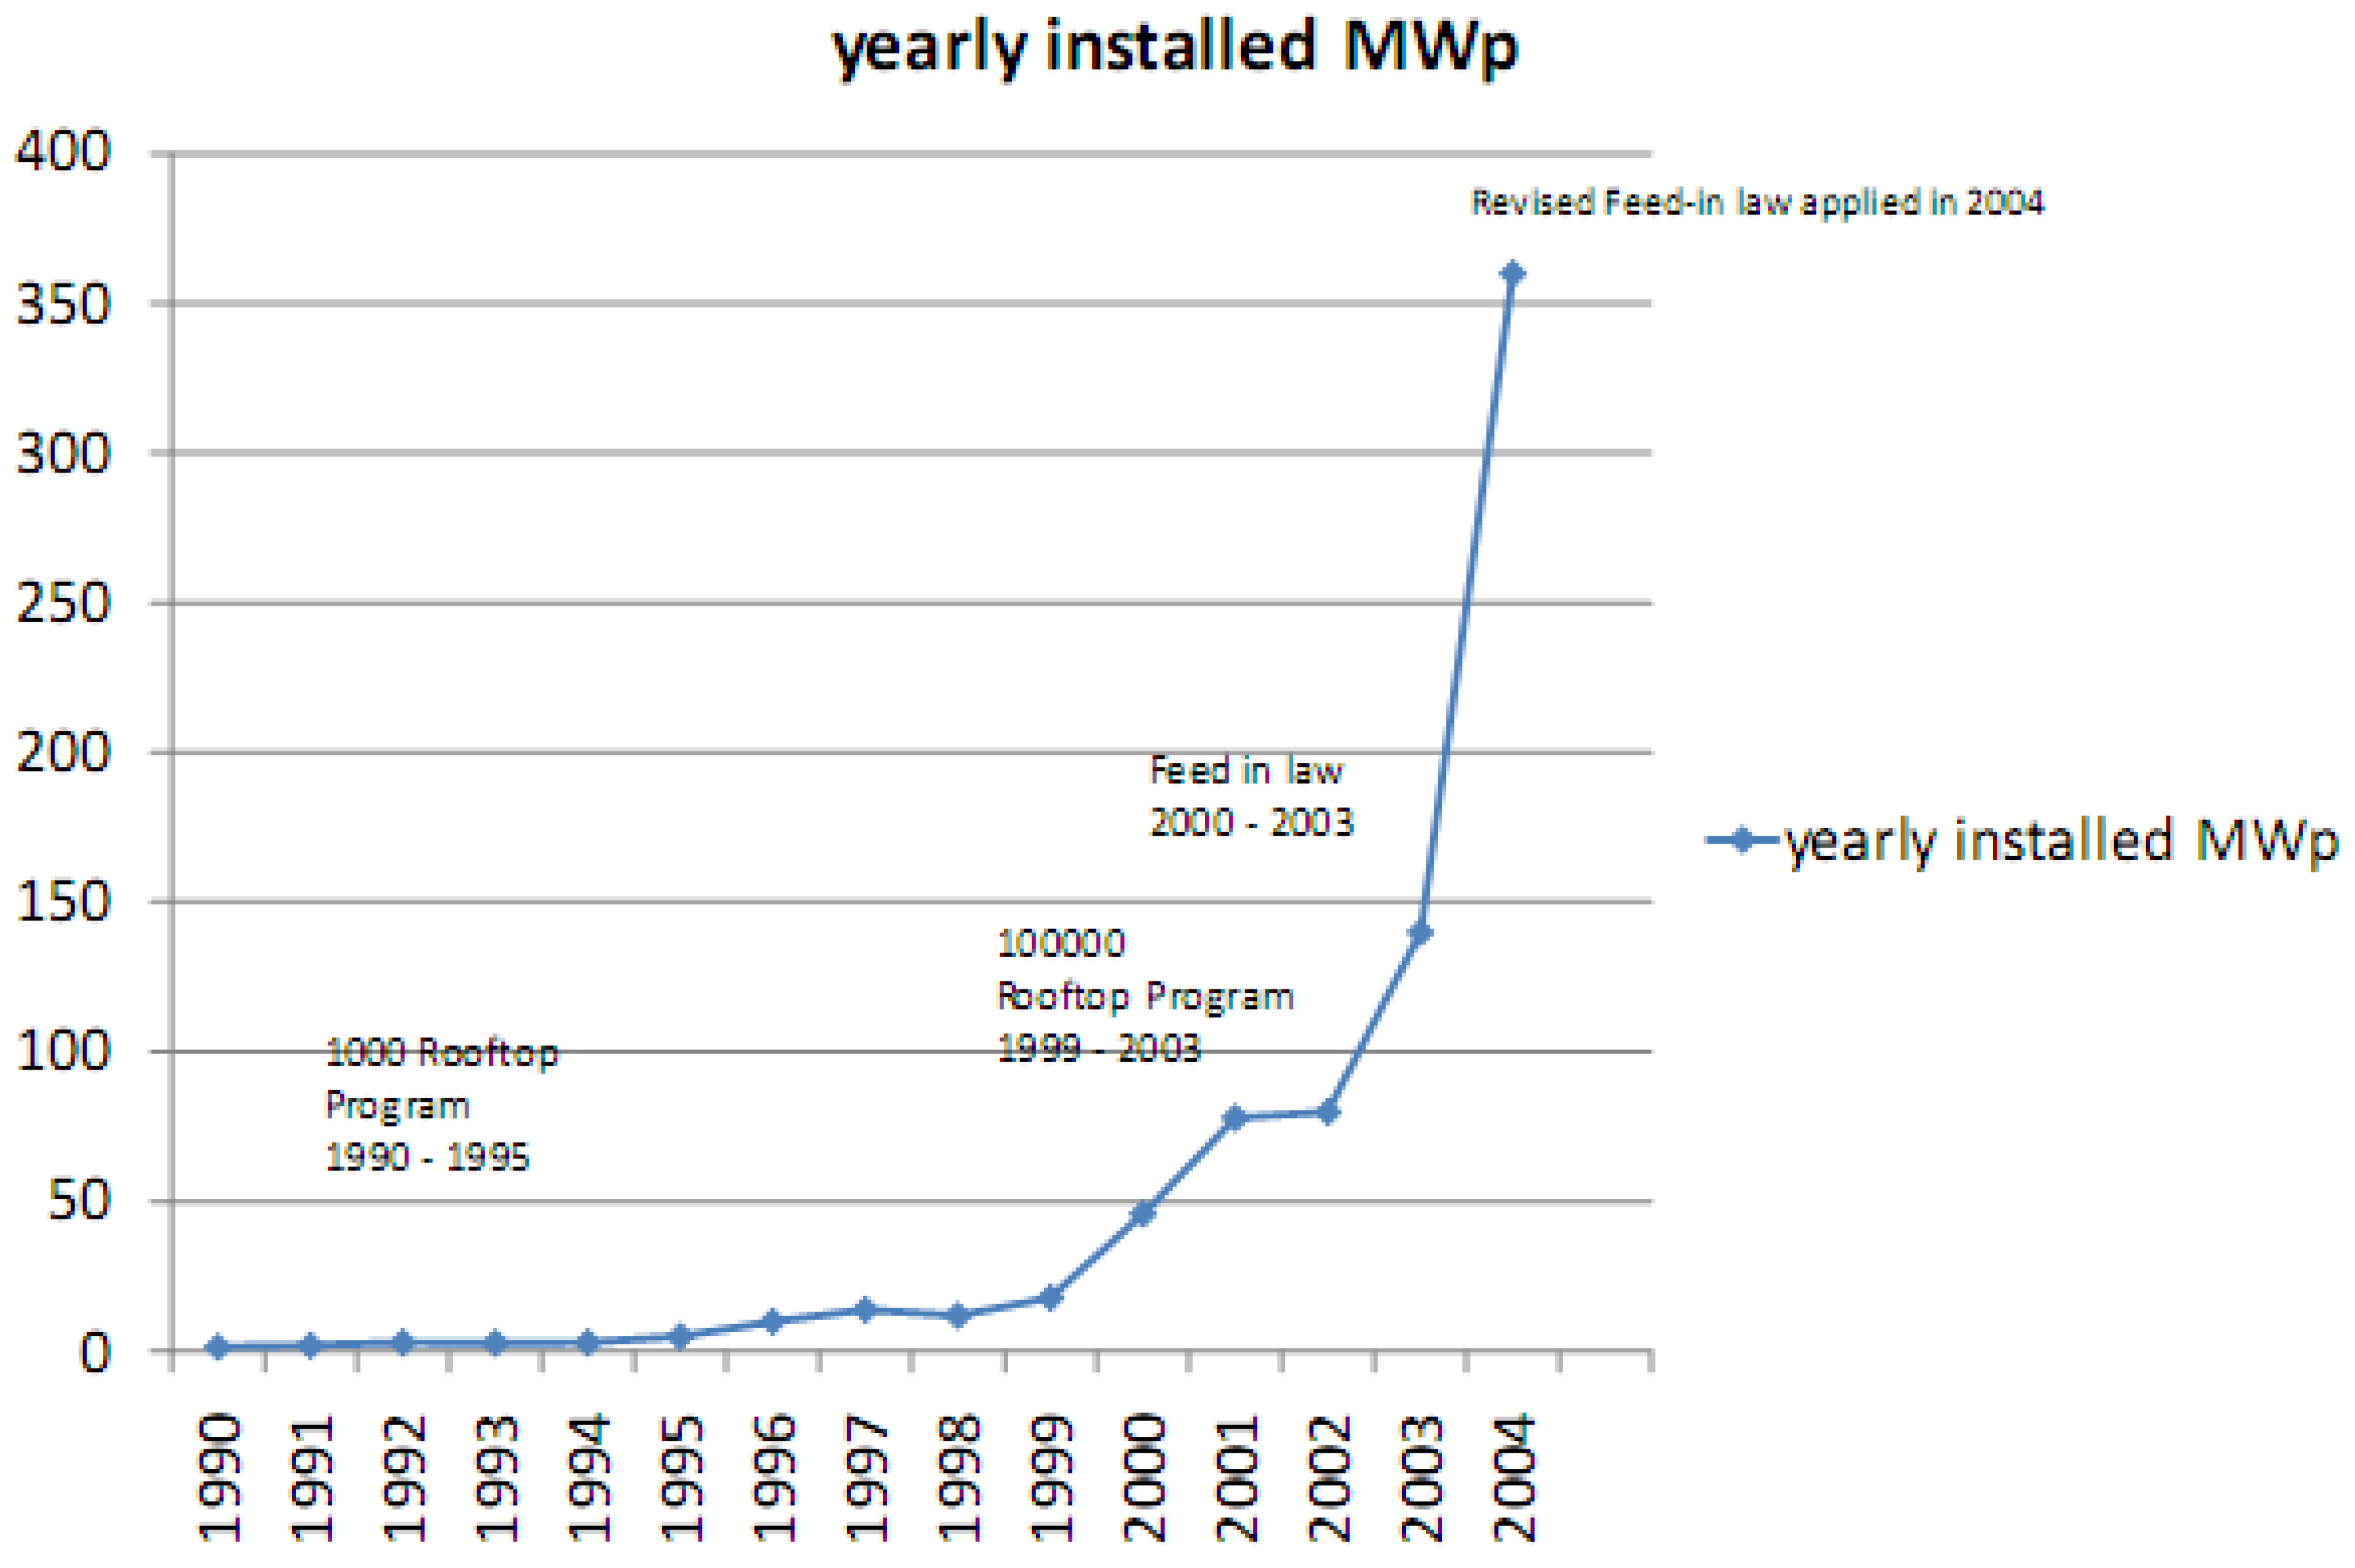
There is a sequential and optimal timing aspect of FiT’s implementation with respect to installation subsidies instruments. In fact, the German PV installation patterns (
Figure 6) conforms qualitatively to this kind of theorizing. The rooftop programs in Germany are fundamentally used to subsidize the installation of the hardware. But with the FiT instruments (subsidizing income) in place, the installation takes off quite rapidly. This is most conspicuous in 2004 when the rooftop programs in Germany expired only the income subsidizing FiT programs left.
We have tried to look at some dis-aggregated PV installation statistics, in terms of system or plant size, in Germany but these refined data are to no avail. In 2004, the increased installation amounted to almost 200 MW. If we assume a household PV capacity in the range of 5 kW, this would mean 40,000 households become adopted, which is about 40% of the 100,000 rooftop programs. In reality, the installation spur may come in all plant sizes from 5 to 100 kW. Of material importance is that this increase may be a combination of smaller and other bigger form factor, with the latter motivated by entrepreneurial objectives and players [
32]. Household adoption under the FiT instrument does not contradict the investment oriented theme, however, the key again is that the cost of non-adoption, stemming from financing other renewable generators in the same network, would drive the non-adopted to adopt in an equilibrating process for the smaller household plant. Future research can be directed to the empirical analysis of our hypothesis of network externality effects among smaller-scale adoption process. ‘Controlling’ the effects due to installation subsidies and other smart grid-based network effects (if any), the magnitude of FiT-based network effects can be assessed.
Figure 6.
Market Pull by the 100,000 rooftop program and FiT in Germany (Adapted from the European PV Associations 2005 [
33]).
Figure 6.
Market Pull by the 100,000 rooftop program and FiT in Germany (Adapted from the European PV Associations 2005 [
33]).
6. Conclusions
The transition to a low carbon electricity system is seen as one of the critical components in the mitigation of climate change. There have been many ways to formulate the transition and inform policies to facilitate this transition process. The neo-classical approach has predominantly regarded the transition as addressing the market failure in internalizing the negative externality or social and pollution cost of fossil fuels
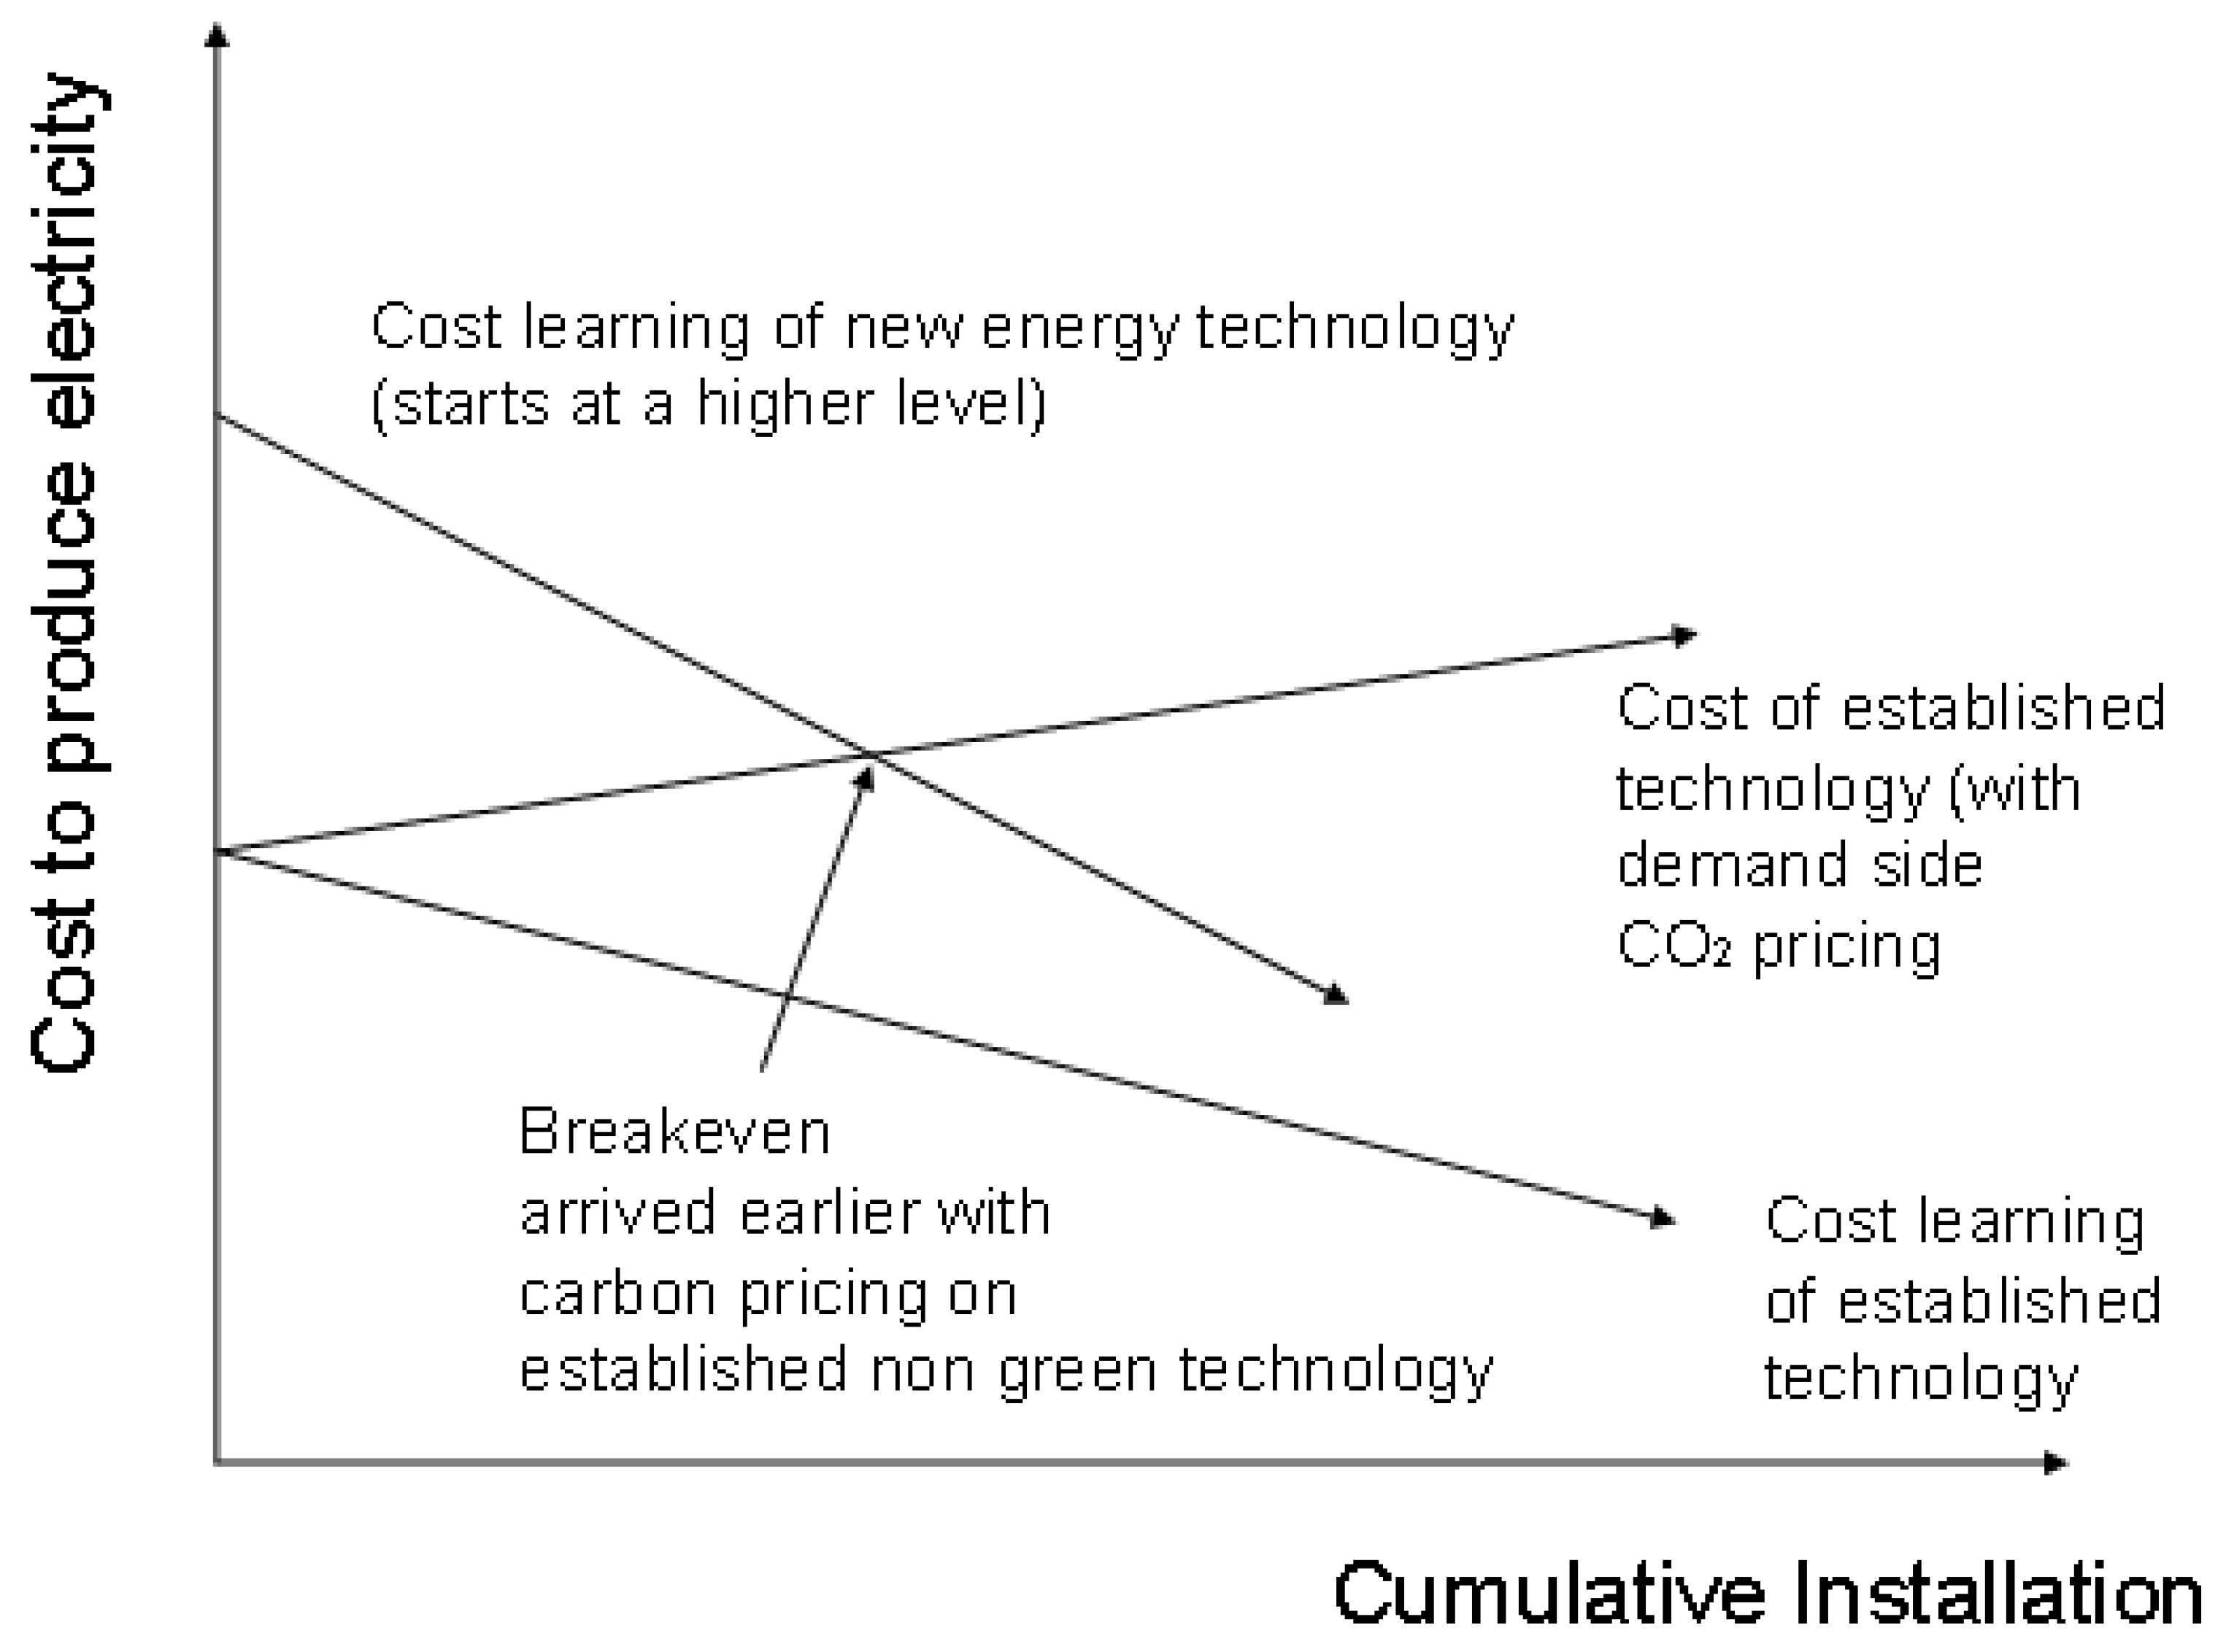
via incentivizing the production and consumption of renewable energy. Coupled with carbon pricing and learning curve (investment) of new technology subsidized by government, break even or grid parity is achieved and market forces take over for the deployment of the new technology (
Figure 7). This is the classical prescription.
In contrast, there is now emerging viewpoints which see the transition as an evolutionary process with a lot of emphasis on the management of a strategically chosen niche, a systemic approach and the leveraging upon the dynamic interaction of the incumbent technology and the clean energy technology [
25] in managing the transition process.
Figure 7.
Large scale deployment of renewable for electricity generation and the associated cost learning dynamics (Adapted from [
34]).
Figure 7.
Large scale deployment of renewable for electricity generation and the associated cost learning dynamics (Adapted from [
34]).
This paper attempts to integrate these two strands of policy literature by reviewing policy instruments in the former category, namely quota system and feed-in tariff system, and suggest evolutionary interpretations of them. Quota system in general favors centralized project development that limits technology diversity. The key economies this policy leverages are those of static economy of scale at the CoPS project level and dynamic economy of scale at the equipment level. Equally important is an efficient tradable certificate market [
35].
FiT system subsidizing renewable electricity generation in general favors distributed and equitable small-scale project development. FiT also leverage upon dynamic economy of scale (experience curve) at the equipment level from the supplier side. What is usually overlooked is that the subsidizing of the revenue of generation, at the demand side, creates an adoption externality effect at the network level. There is a cost of non-adoption, which does not stem from the higher charges of renewable electricity that both the adopted and the non-adopted has to pay, but from the need of the non-adopted to finance the adopted in the same network. This punitive network effect works opposite to the traditional IT network effect, but both create a bandwagon effect when a certain critical threshold of adoption is achieved. As smart grid functionality is developed at network level, it encourages the adoption of distributed generation, which would increase the magnitude of the negative or punitive externality effects on the non-adopted.
At the distributed generation equipment level, we also see an interesting interaction of the manufactured technology aspect and the information technology aspects. Because the traditional IT network externality effect should be leveraged and an initial installed base threshold needs to be sustained, the standalone product functionality of the energy system, especially the communication functionality, can and should be developed to reduce the magnitude of this threshold. The effectiveness of renewable energy policy can therefore be seen as a combined consideration of renewable energy product functionality development, cost minimization (installation or capitals) subsidies in terms of a small initial installation base and maximization of network externality effects by subsidizing revenues. Policy makers need to think across product and network (grid) levels.
Lastly, it is important to observe that Germany now overtakes Japan as the country having the largest installed base of PV power. (Japan once led the world in the development of solar PV, but it is now lagging behind other nations. In solar power generation, Japan lost its No. 1 place to Germany in 2005. At the end of 2008, Japan slipped from No. 2 to No. 3. Spain with capacity for 2.3 million kW moved up to No. 2, following Germany’s 5.4 million kW. Japan’s capacity was 1.97 million kW, less than 40% of that of Germany. In terms of the capacity of solar panels newly set up in 2008, Japan ranked No. 4 at only 240,000 kW [
19]).
According to IEA [
36,
37], Japan’s cumulative PV installation in the grid connected distributed category is 1,823 MW by December 31, 2007; on the other hand, Germany’s installation in the same category is around 5,300 MW by 2008. One noted difference in the energy policy landscape in the two countries is that Germany has adopted PV feed-in tariff of the EEG since 2000 with direct subsidy, while Japan has a conspicuous absence of any enhanced feed-in tariff despite the available direct (capital installation) subsidy at local government level. However, Jager-Waldau [
38] admitted that, in general, the end of the Residential PV System Dissemination Program in Japan in FY 2005 is usually cited as a reason for the decrease in the new installation, but not so much because of the financial incentive of ¥20,000 per kWh. Instead, a number of other factors are accountable: detached house market in Japan, the major market for residential system is experiencing a downward trend; strong demand for solar modules outside of Japan and strong Euro make it more attractive for Japanese suppliers to export their solar modules overseas,
etc. Overall, macroeconomic conditions may explain the PV installation performance in the country, but if we restrict our analysis to the policies supporting renewable deployment, the lack of feed-in tariff in Japan is the most conspicuous.
This anecdotal evidence suggests that network externality effects at the user side triggered by the feed in tariff policy in Germany may be more effective than the pure capital or installation subsidy policy in Japan, which can be seen as a supplier side driven instrument equivalent to cost reduction.
Japan has seen PV as a pure manufactured technology [39], so far ignoring the perspective of the technology having the potential to exhibit network externality triggered by feed in tariff. (Japanese METI policy has now adopted a similar feed in tariff policy for excess electricity generation by PV system [
18].)
A more forward-looking idea is to look at a technology as a hybrid of both the manufactured and information technology aspects; different policy instruments would appeal to different aspects of the renewable technology under consideration, and makes the technology behave or diffuse differently with different underpinning basis of increasing returns. Effective policy is to determine when to think in what perspective and an inflection point or synergies between the two aspects. From a theoretical viewpoint, we have introduced to the evolutionary policy literature that a technology under different policy regimes can be conceptualized as traversing along different technological trajectories with different innovation logics, which substantially sharpens or refines complementary policy options to steer to the deployment end goals and greatly reduces the excessive deduction guess works in making energy policy.


