Prospects of Electric Vehicles in the Developing Countries: A Literature Review


Department of Economics, Faculty of Economics and Business Administration, Ghent University, 9000 Ghent, Belgium
*
Author to whom correspondence should be addressed.
Sustainability 2020, 12(5), 1906; https://doi.org/10.3390/su12051906
Submission received: 29 January 2020
/
Revised: 26 February 2020
/
Accepted: 28 February 2020
/
Published: 3 March 2020
Abstract
:Electric mobility offers a low cost of travel along with energy and harmful emissions savings. Nevertheless, a comprehensive literature review is missing for the prospects of electric vehicles in developing countries. Such an overview would be instrumental for policymakers to understand the barriers and opportunities related to different types of electric vehicles (EVs). Considering the Preferred Reporting Items for Systematic Reviews and Meta-analysis (PRISMA) guidelines, a systematic review was performed of the electronic databases Google Scholar and Web of Science for the years 2010–2020. The electric four-wheelers, hybrid electric vehicles and electric two-wheeler constituted the electric vehicles searched in the databases. Initially, 35 studies identified in the Web of Science that matched the criteria were studied. Later, 105 other relevant reports and articles related to barriers and opportunities were found by using Google Scholar and studied. Results reveal that electric four-wheelers are not a feasible option in developing countries due to their high purchase price. On the contrary, electric two-wheelers may be beneficial as they come with a lower purchase price.
1. Introduction
Electrification of mobility offers numerous benefits such as reduction on oil dependency and improvement of the environment [1]. The electric mobility is represented by electric vehicles (EVs), which consume less energy and emit zero tailpipe greenhouse gases (GHG) [2]. Battery electric vehicles (BEVs) have largely been praised for their better energy-efficient system than internal combustion engine vehicles (ICEVs). Unfortunately, no prior research is performed which directs the type of EVs that could be more successful in the developing countries. Hence, we will explore the barriers and opportunities related to electric four-wheelers (E4Ws), electric two-wheelers (E2Ws) and hybrid electric vehicles (HEVs).
There are numerous forces that push and pull the equilibrium state of the established market for different mobility vehicles. Similarly, there are several driving forces associated with EVs’ adoption, such as the reduction in greenhouse gas emissions (GHG), efficient energy use, gasoline savings and low operational cost. The resisting forces influencing the acceptance of EVs include high purchase price, inadequate range, slow charging and new production adoption anxiety [3,4,5]. In this study, a comparative analysis was performed to understand the resisting and driving force for adopting the different types of EVs in the developing countries. We used the Preferred Reporting Items for Systematic Reviews and Meta-analysis (PRISMA) guidelines to compose the methodology for the literature review. We narrowed our search by developing a search protocol and screening process. In the results, it was highlighted that E2Ws and HEVs hold more potential in developing countries than E4Ws.
2. Background
We follow the country classification of developed and developing countries as prepared by the United Nations Organization (UNO) [6]. These countries are classified according to the measure of the gross national income and gross domestic product. The developing countries mainly fall in the regions of Africa, East Asia, South Asia, Western Asia, Latin America and the Caribbean. In the sections below, we highlight the type of EVs used in the study and electric mobility in the developed and developing countries.
2.1. Type of Electric Vehicles Used in This Study
In this study, prospects of E4Ws, E2Ws and HEVs in the developing countries are elaborated. The E4Ws refer to electric four-wheelers or electric cars. The E4Ws have only the battery as a source of energy providing long-range capability around 200–300 km [7]. The average price of E4Ws varies from USD 30,000 to USD 47,000 [8]. The important parts of E4Ws could be divided into the motor controller, battery and electric motor [9]. The batteries are charged from the electricity grids by the different type of plugs. The type 1, type 2 and combination plugs are usually used in E4Ws having power up to 7.4 kW, 22 kW and 43 kW, respectively. Using the electric motor, the electrical energy is converted to mechanical energy to support the drivetrain [9,10]. The second type of vehicle in the study is a hybrid electric vehicle or HEV, which combines both internal combustion engine and a battery pack to generate power for vehicle propulsion. The HEVs do not require external charging, and the necessary power is generated by the regenerative braking system and the internal combustion engine [11]. We consider the series-parallel type of HEV used in this study. The price of an average HEV varies USD 24,000–29,000 [4]. We do not consider plug-in hybrid electric vehicles (PHEV) in this study as the purchase price is more expensive [12]. Considering the electric two-wheeler or E2W, we emphasize a mid-sized electric two-wheeler or electric scooter (Vespa-styled) in our study. These E2Ws are not pedal-assisted or kick started. These E2Ws possess a maximum speed of 45 kilometres per hour. These E2Ws carry an electric motor of maximum continuous power rated between 0.25 and 4 kW [13]. In this study, we use EVs to denote HEVs, E4Ws and E2Ws. We use BEVs to denote E4Ws and E2Ws only. For further clarification, different types of EVs are mentioned in the Table 1. In this table, some of the features do not apply to HEVs and the blank spot is represented by a dash.
2.2. Current State of Electric Mobility in the Globe
According to a study, China and the United States makeup 65% of global E4Ws users. The second position is held by Europe, which makes up 23% of the global share [17]. In 2016, there were six countries that attained an E4Ws market portion above 1% of their total passenger light-duty vehicles (PLDV) sales. Considering these countries, Norway was the indisputable global frontrunner, with 29% E4Ws market in its PLDV share [18]. Norway achieved this result due to pragmatic environmental policies in recent years involving a wide variety of incentives, tax reductions and exemption of tolls on the road for E4Ws [19,20]. After Norway, The Netherlands and Sweden hold the largest E4Ws markets, having 6.4% and 3.4% PLDV share, respectively. The majority of electric cars registered in the U.K, Netherlands and Sweden are plug-in hybrid electric vehicles (PHEVs). France and China mainly have BEV-oriented markets; in 2016, 75% of electric cars sold were as E4Ws and 25% were (PHEVs). However, in Norway, Japan and the rest of the globe, electric car sales on the average were equally divided between E4Ws and PHEVs [18].
2.3. Current State of Electric Mobility in Developing Countries
Except for China, electric cars remain unpopular in developing regions. India has a less than 1% E4Ws’ share considering car ownership [17]. When EVs are discussed, people generally think of electric cars, however, in the situation of the emerging countries such as China and Vietnam, an overwhelming number of E2Ws are sold [21]. This is mainly related to ease of travel and the low purchase price of E2Ws [13]. In 2018, E2Ws had a sale of 30 million units and a total stock of 250 million units in China [22]. Market share for E2Ws is slowly growing for other Asian countries as well, such as India, Vietnam and Taiwan.
In developing countries, it is important to develop EVs that would resonate with the electrical power structure in those countries. A study by Wu and Zhang [23], observed the electricity mix in the developing countries. In that study, adoption of HEVs was suggested as they yield higher energy and emissions savings for countries having a predominantly thermal-based electricity mix. The next question is affordability or cost of ownership for citizens. Considering the case of E4Ws, they are out of the reach for the common middle-class person due to higher purchase prices. In this regard, the way forward will be to promote E2Ws in developing countries. China is a prime example where E2Ws have been propelled to an exponential number [24,25].
3. Materials and Methods
3.1. Search Protocol
A search protocol was created primarily directing at the online search engines like Google Scholar and Web of Science. Initially, synonyms were created for key terms as “electric vehicles”, “electric cars”, “hybrid electric vehicles”, “electric two-wheelers”, “electric scooters” and “developing countries”. Similarly, we developed search protocols for the driving and resisting forces such as “energy savings” or “high purchase price” etc. We created separate Booleans for Google Scholar and Web of Science, which are attached in the Appendix. We allocated a 10 year time period (2010–2020) in our search engine to search above mentioned keywords. These EVs and combination of the resisting and driving forces constituted the main search protocol elements in the databases. For the Web of Science search, we allowed Article, Book, Book chapter, Review and English language selection to retrieve the required records.
3.2. Screening
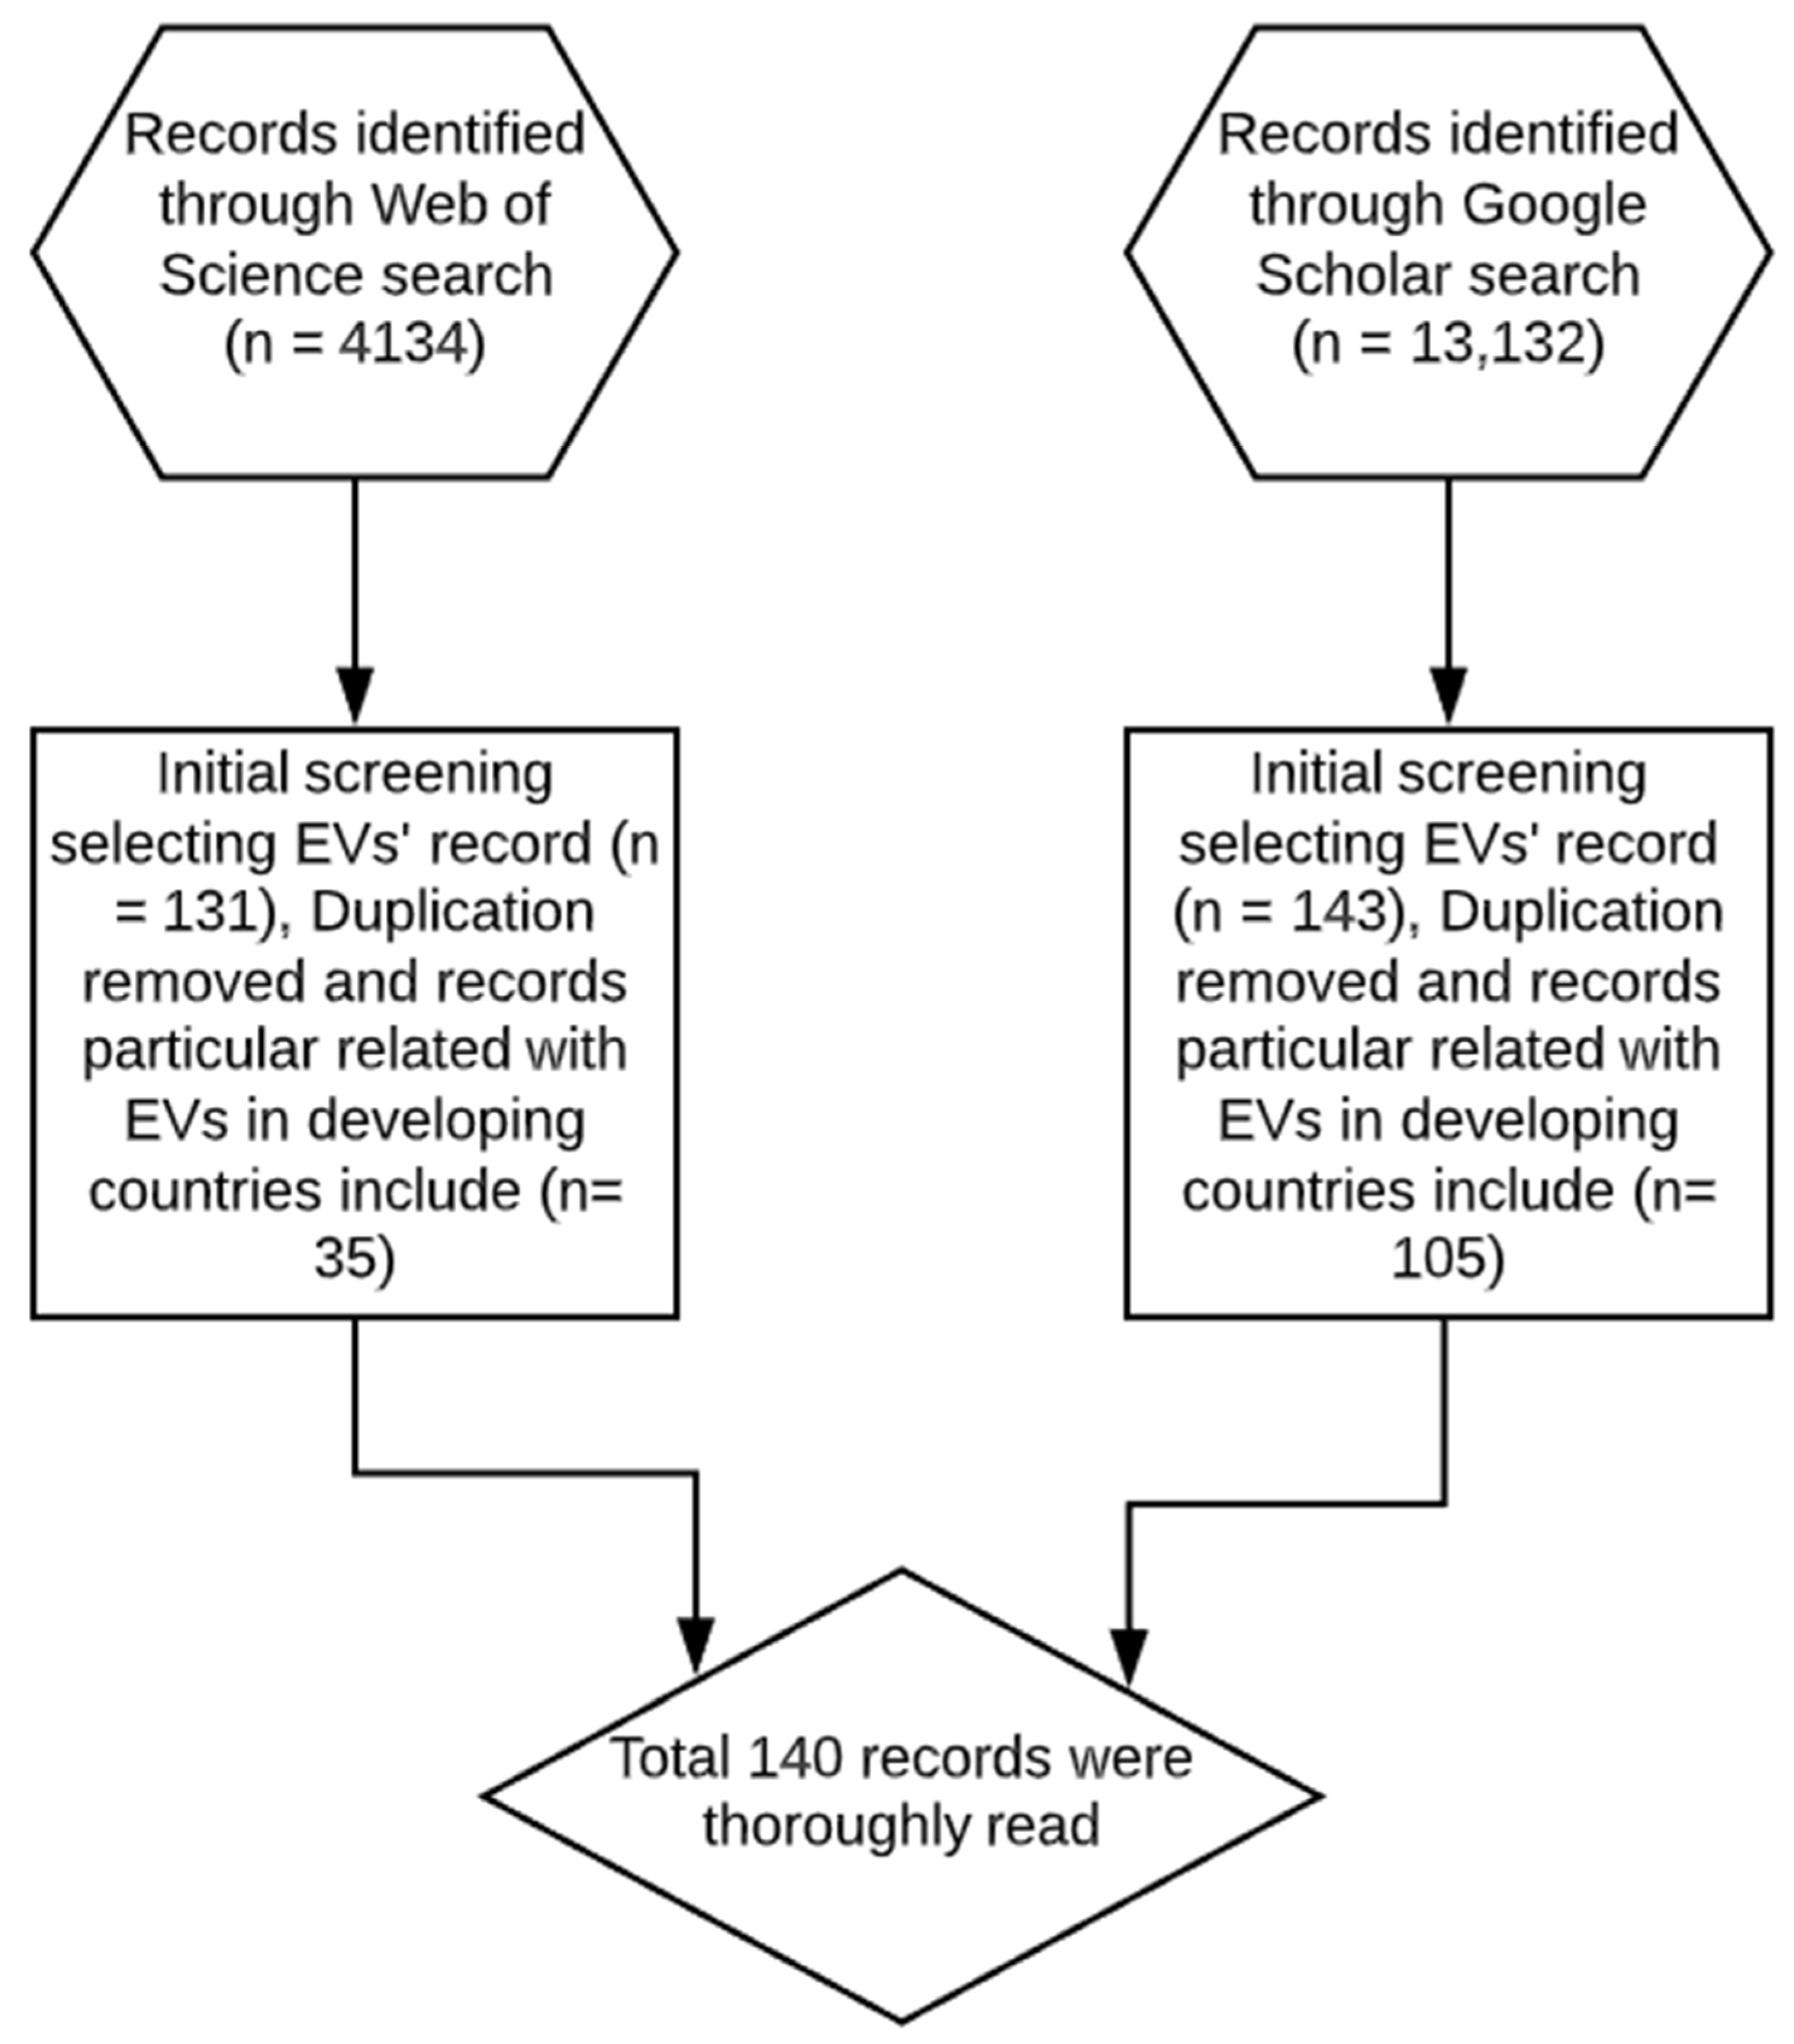
We screened out unimportant articles not related to the EVs. The screening out of insignificant articles related to other scientific fields as medicine or physics was performed through the help of “analyse” feature incorporated in the Web of Science engine. We followed the PRISMA guidelines to select relevant studies in the field. The detailed methodology following PRISMA guidelines is given in Figure 1 below.
In the second phase, duplicated records found in Google Scholar and Web of Science were removed. By reading the abstract and conclusion, we further narrowed down our research to 140 relevant and high impact articles. For the Web of Science engine, we found 35 important articles, whereas, 105 important articles were found using the Google Scholar engine. Some of the articles had reference to reports such as Global EV outlook which were found on Google Scholar and added to the reference section as well.
4. Results and Discussion
In the forthcoming section, we enlist important driving and resisting forces for the implementation of EVs in the context of the developing countries. Previous research involved barriers and opportunities pertaining to the developed world, such as subsidies, incentives, data sharing or availability of public charging etc., but are not included in this study [26]. In our study, we employ the driving and resisting forces by studying different literature focused on developing countries [27,28,29,30,31,32,33]. In the sections below we further elaborate the importance of these forces.
4.1. Overview of the Driving Forces for the EVs
4.1.1. Reduction in GHG Emissions
Whether the energy mix is dependent on fossil fuels or not, the EVs offer minimum GHG (greenhouse gas) emission in well-to-wheel energy use [12,23,34,35]. GHG consists of carbon dioxide (CO2), carbon monoxide (CO), ozone (O3), sulphur dioxide (SO2), nitrous oxide (NO2), chlorofluorocarbons (CFC) and methane (CH4). Generally, the policymakers emphasize reducing CO2 emissions in the transport sector [23]. In a study conducted in Germany, different scenarios for electricity production were analyzed, and it was found that E4Ws incur only 30%–50% external environmental cost when compared to an ICEV engine vehicle [36]. A study performed by Orsi and coworkers [12] considered the well-to-wheel CO2 emissions in carbon-intensive electricity mix for different countries. The results from this study showed HEVs have lower CO2 emissions than conventional gasoline cars or cars using compressed natural gas (CNG). In a study performed in China and India, small ranged E2Ws and E4Ws were studied using the tank-to-wheel method, it was examined that they emit less CO2 gram per kilometre than their counterpart gasoline vehicles [21]. In a study conducted for the E2Ws in the UK, using the tank-to-wheel process, it was found that the E2Ws emit 3.8 and 1.8 times less GHG emissions than gasoline cars and motorcycles, respectively [37]. These studies highlight the fact that EVs save more GHG emissions than their counterpart gasoline vehicles.
The EVs are more beneficial to the environment when the national electricity grid is clean [38]. When comparing the prospects of EVs in the developed and developing countries, electrical power structure and power transmission efficiencies play a vital role. For example, in India, the electricity grid relies largely on thermal power and has a high line loss rate (LLR). On the contrary, France has a clean electricity mix and low LLR, therefore, EVs would be more environment-friendly in such regions. It points out that EVs could be more beneficial in a clean and efficient electricity mix [23]. In Table 2 we show how clean the national grid is for the prospect of EVs in different developing countries.
4.1.2. Energy Savings
EVs offer superior energy-saving performance than their counterpart gasoline vehicles. The energy savings may refer to petrol or gasoline savings due to switching on electric power for mobility. Currently, India saves 44,000 L of gasoline and 109,884 kg of CO2 per day due to electrification of mobility [18,42]. A study was performed by Zhou and coworkers [35] considered the life cycle assessment of E4Ws in China. The life cycle assessment involved two major aspects, total energy use from vehicle production to end-of-life and well-to-wheel energy use. This study revealed that E4Ws saves 35% more energy than conventional cars. Whereas, HEVs saved almost 20% more energy than ICEV cars. In another study performed by Orsi and coworkers [12], using the well-to-wheel process, they compared HEVs and E4Ws. The results from this study revealed that HEVs consume twice the energy compared to E4Ws.
The E2Ws are considered to be more energy efficient than their petrol-based two-wheelers counterparts [43]. An E2W consumes 3–5 times less energy than a gasoline-based two-wheeler. Gasoline two-wheelers mostly use their energy (75%) in the tank-to-wheel process, whereas E2Ws mostly use energy in the production stage [13,44,45]. In a study conducted in the UK, using the tank-to-wheel process, it was found that E2Ws consume 6.1 and 2.9 times less energy than gasoline cars and motorcycles, respectively [37]. Considering China, the large majority of the E2Ws are fitted with lead-acid batteries that carry an energy density of 30 Wh kg−1. On the contrary in Europe, E2Ws are fitted with lithium-ion batteries that are more costly but provide 140 Wh kg−1 of energy density [13]. A comparative analysis is performed in Table 3, considering energy consumption per kilometre among different electric and nonelectric mobility modes.
Considering EVs, it can be inferred that E2Ws consume significantly less energy than E4Ws or HEVs. Hence, in the developing countries, the most energy-efficient mobility mode would be E2Ws rather than HEVs, E4Ws or any other conventional petrol-based vehicle.
4.1.3. No Cost of Infrastructure Required for the Governments Considering E2Ws and HEVs
The availability of infrastructure is instrumental to reduce range anxiety [46]. The infrastructure refers to charging stations needed for the E4Ws to charge the vehicles [47]. The E4Ws require sophisticated infrastructure, whereas E2Ws do not require heavy infrastructure investment. An advantage of E2Ws is that their portable battery, which can be recharged via a standard wall outlet from home or office, renders the dedicated infrastructure unnecessary [13]. According to Weiss and coworkers [13], if E2Ws substitute for car trips in China, it could eliminate large infrastructure investment. Similarly, HEVs disregard the need for external charging, as it generates required electrical power from its battery and engine [48,49]. It indicates that HEVs and E2Ws are more suitable for developing countries that lack the resources to develop the necessary infrastructure for the E4Ws.
4.1.4. Low Operational Cost
One of the major reasons to use EVs is fuel cost savings compared to gasoline vehicles [50]. For E4Ws, the price of one joule of energy from electricity, regardless of its energy mix, is lower than the price of the gasoline. The consumption for E4Ws is around 0.2 kWh/km [51,52,53,54,55]. The price of 100 kilometres would only be 20 kWh for E4Ws. Like E4Ws, E2Ws also have superior operational savings due to their reliance on electricity rather than gasoline. The E2Ws on average consume 0.015–0.045 kWh per kilometre considering tank-to-wheel energy use [13,56]. In a study in the United Kingdom (UK), the E2Ws’ tank-to-wheel operational cost was compared with that of the best-selling gasoline car and motorcycle. The findings from this study revealed that operational cost (electricity expense and battery replacement) was 24% better in comparison to the best-selling motorcycle [37]. The operational cost for E2Ws in Vietnam was eight times less than large gas motorcycles [50]. These studies indicate that the operational cost of E2Ws is significantly less than counterpart gasoline motorcycles. It also indicates that the total cost of ownership largely consists of fixed or sticker price, rather than the variable or operational cost [56,57].
4.1.5. Affordable Purchase Price of E2Ws
The price of electric cars and hybrids is very expensive for middle-income people in developing countries [8]. For the lower-income people, the option of medium-sized electric scooters or E2Ws can be attractive as sticker price is more affordable than a gasoline-based car. The price of E2Ws ranges from 100 euros( E2Ws equipped with lead-acid batteries) to 5600 euros (E2Ws equipped with lithium-ion batteries [13]. The United Kingdom’s (UK) committee on climate change claims that EVs may become cost effective by 2020 [5]. Hence, waiting for the economies of scale to decrease the price of E4Ws to become affordable for the middle-income people is a feasible option. The high-cost sticker price or purchase price of E4Ws and HEVs as a resisting force is discussed in a later section.
4.1.6. Mode Shift from Public Transportation to E2Ws
In a study by Kroesen [58], it was concluded that wide use of E2Ws may induce public transportation and private car users to shift their current mode of transportation. It is highly unlikely that current public transport users in the developing countries would shift towards the use of E4Ws and HEVs, as the purchase price of E4Ws and HEVs is high. Despite this, public transportation has a fixed timetable of travel and more reliability to reach the destination in time, the monetary benefits and independence of mobility could induce public transport users to shift their mode of transportation towards E2Ws [59].
4.1.7. Congestion Cost
Road congestion primarily occurs due to imbalance in road capacity, kilometres travelled and the vehicle fleet size [60]. Megalopolis cities in Asia witness low infrastructure for cars, causing enormous road congestion [61,62,63]. Since road users do not consider the impact of their route choices on other road users, every extra vehicle on the road imposes congestion cost for others. The main congestion cost involves time losses and speed-dependent fuel losses. From a study by Jochem and coworkers [64], it is was analyzed that the increase in E4Ws will not resolve the issue, but it will almost be the same as the prevalence of gasoline cars. In the literature [65,66], it was found that the majority of the E4Ws owners already possess a gasoline car, so gasoline cars are not substituted. Increasing income also induces urban road users to opt for private vehicles rather than the public transport option [67,68]. From the literature, it may be understood that E4Ws in contemporary era may increase road congestion. An alternative option could be the use of E2Ws. Due to its smaller size, E2Ws can be handy to address congestion issues in large cities. Some research indicates that E2Ws are replacing private journeys that could have been made by cars [69,70,71,72,73]. Thereby, if the governments and private institutions devise policies that induce car users to shift towards E2Ws, congestion could be reduced in developing countries.
4.2. Overview of the Resisting Forces for the EVs
4.2.1. High Cost of Infrastructure Required for the Implementation of E4Ws
The charging infrastructure is an important component that reduces range anxiety for the EVs. From the study of Krupa and coworkers [74], it was found that intention to purchase an EV is affected by the availability of recharging stations. In the contemporary era, the infrastructure investment seems to be a prerogative of the developed countries. In the United Kingdom, the government has vowed to allocate £ 250 million for the development of EV infrastructure [75]. If equipped with state of the art material such as communication software, the investment and maintenance for one public charging station could vary between € 4000 and € 10,000 [76].
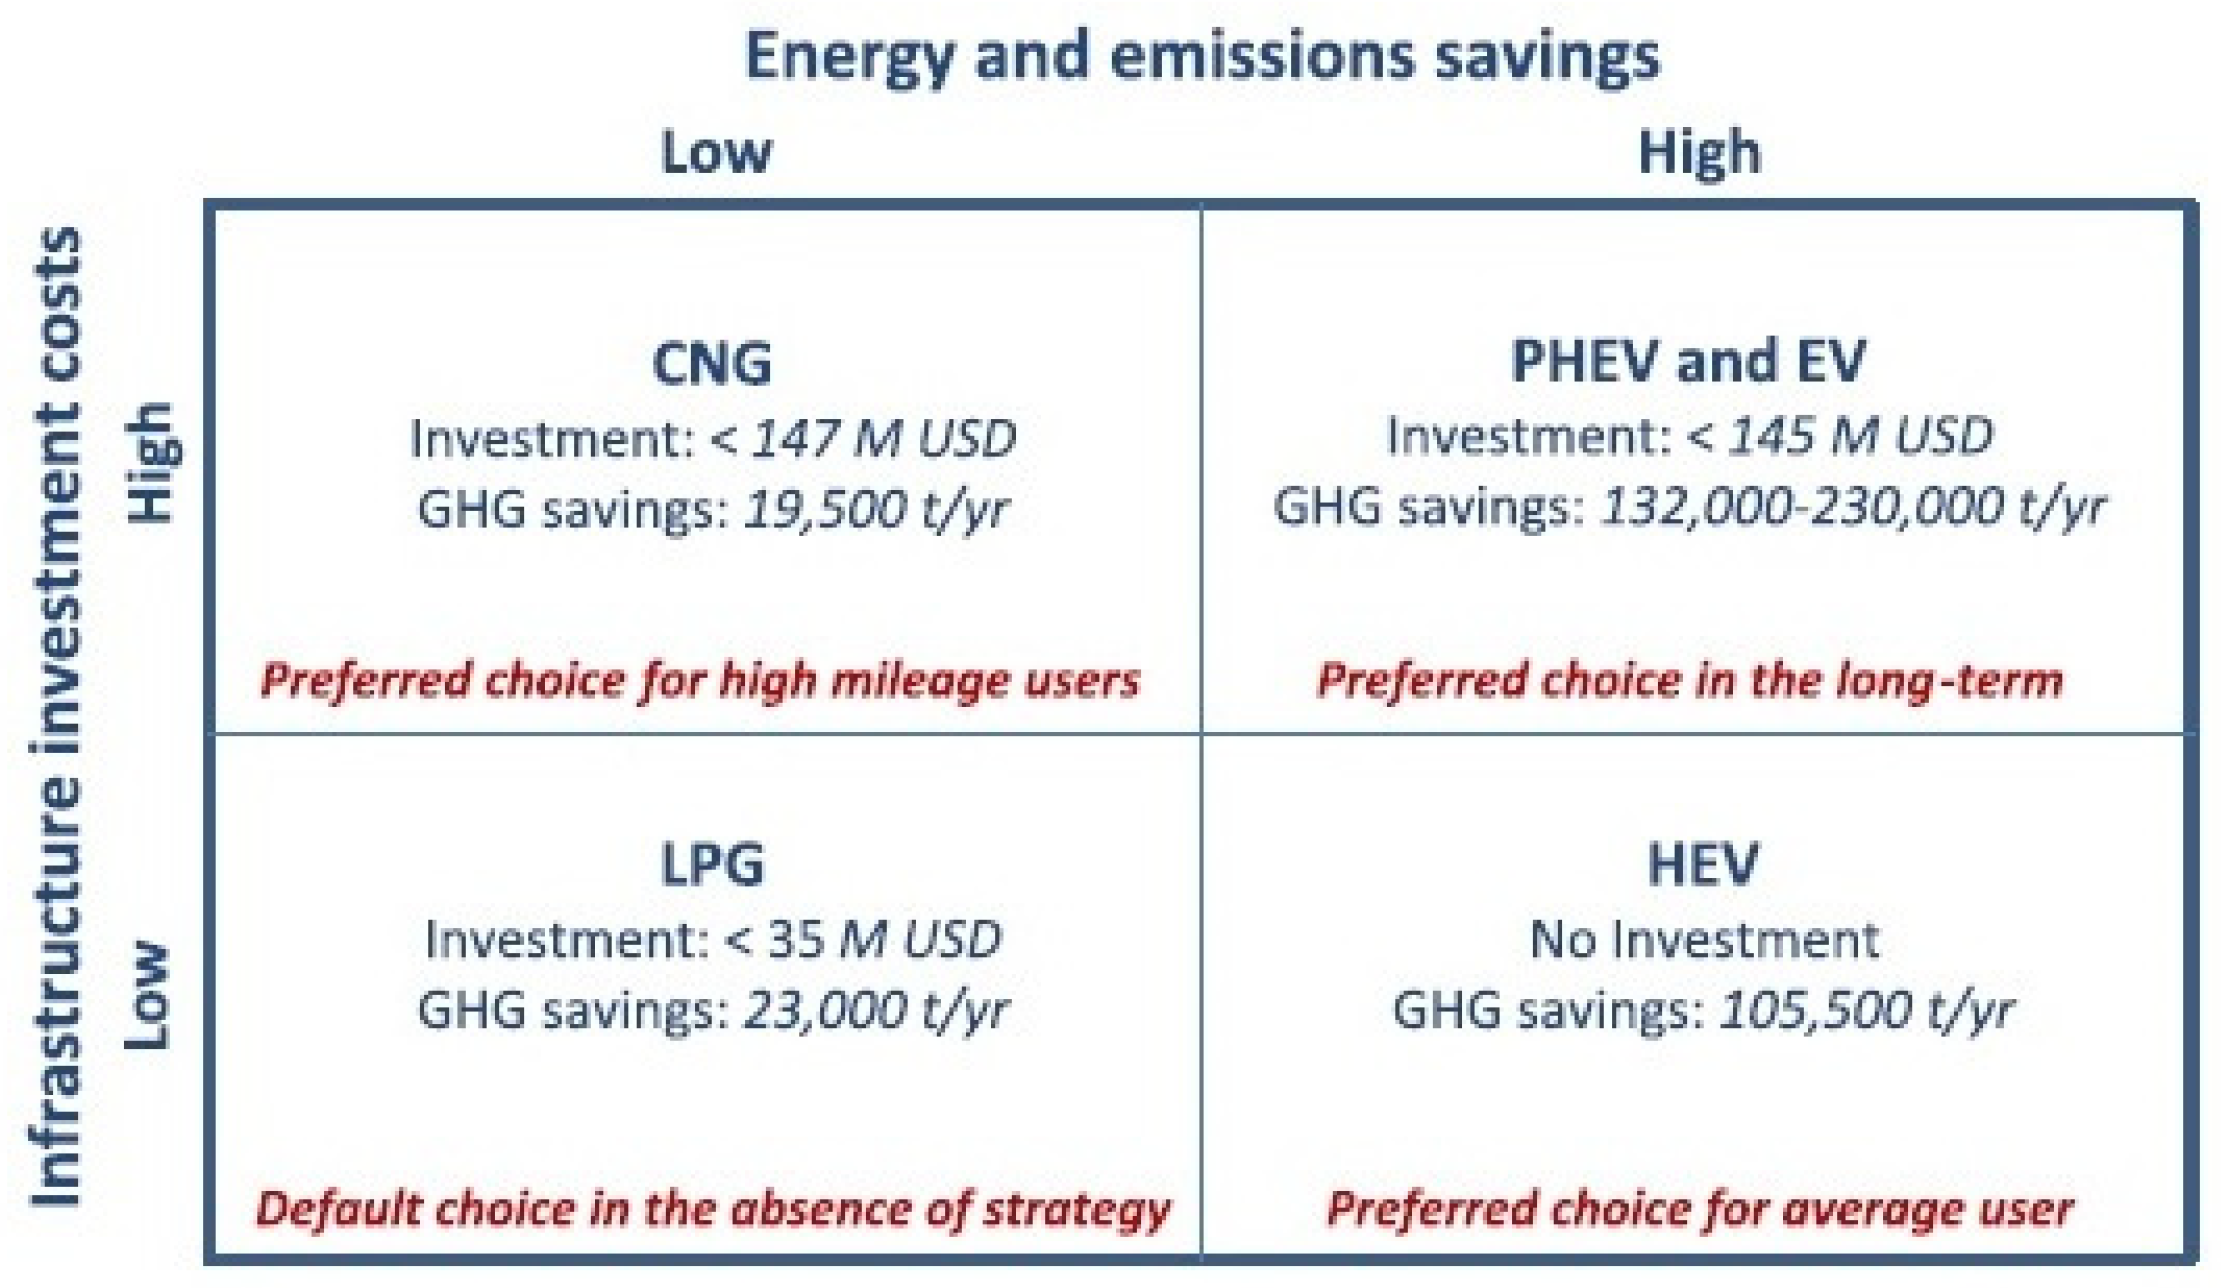
It is the object of debate whether large-scale infrastructure investment may be allocated for EVs. Mansour and Haddad [77] conducted a study for EVs in the developing country of Lebanon (Figure 2). The five types of mobility modes defined by energy consumption described in the figure are CNG, Liquefied Petroleum Gas (LPG), HEVS, PHEVs and EVs. In Figure 2, energy and emission savings are compared with infrastructure investment cost. HEVs tend to exhibit no infrastructure investment cost, whereas EVs in the form E4Ws tend to incur the highest infrastructure investment cost. In the previous section of driving forces, it was discussed that HEVs and E2Ws should be promoted in the developing countries, as they do not require substantial investment for infrastructure.
Considering developing countries, the government will be hesitant to invest in infrastructure for E4Ws, as it would benefit the rich only. Currently, the government will be motivated to provide feasible mobility options to low-income people. As discussed earlier, E2Ws and HEVs could be a better option as they work without a dedicated external charging system.
4.2.2. High Purchase Price of E4Ws and HEVs
According to a study in the USA, the sticker price is one of the major barriers to purchasing an EV [3]. The sticker price of E4Ws is around USD 18,000–70,000 more than a gasoline-based car [23,78,79]. The adoption of E4Ws is high in developed countries such as Norway due to high purchasing power when compared to people than in developing countries such as India, who perceive the E4Ws expensive [17,20,30]. The current payback time for E4Ws is 20 years in comparison to a cheaper ICEV. In another study, it was found that the total cost of ownership of E4Ws takes 10 years to match the initial cost and ownership cost of an ICEV [80]. Nevertheless, it is expected that it will drop down to less than four years before 2030 [81]. People with high income are less sensitive to prices and are likely to buy an E4W [82].
The low purchasing power of people inhibits the purchase of the high price tagged HEVs and E4Ws. Unless the economies of scale do not reduce E4Ws and HEVs to an affordable price, the popularity of these type vehicles will not increase in developing countries. Besides, providing incentives and taxes for the purchase of expensive E4Ws and HEVs would be imprudent for the government as it will favour the rich only.
4.2.3. Lack of Government Policies
It is a known fact that the government can create markets for different products and correct market failures, if needed [32,83]. The market for EVs can be created, if there is special support from the government. The governments of India and China are the forerunners to promote policies supporting EVs. By the supervision of heavy industry in India, the faster adoption and manufacturing of electric vehicles (FAME) was initiated by the government in 2015 [42]. The FAME is directed towards motivating people to consider EVs in future. In some Indian states, there is an exemption of registration tax for EVs. In China, the government has introduced policies such as banning the purchase of gasoline-based two-wheelers in cities, which face an enormous level of air pollution. Seven major urban centres of China have witnessed license plate restrictions waived for EVs. There are different tax waiver schemes for ownership of EVs in China [84,85]. Other studies [1,86], indicate that tax reduction and financial incentives as subsidies by the government also increase the awareness to consider EVs. Moreover, the adoption of EVs depends on technological improvement and economic incentives, such as sales tax [50]. After 2010, China witnessed a huge adoption of E2Ws due to the low purchase price of E2Ws and the ban to purchase gasoline two-wheelers [69,84,87]. Previously, the government of Pakistan had shown interest to save gasoline energy by adopting compressed natural gas (CNG) technology by creating awareness, investment opportunities and ample regulatory framework. Resultantly, there was a massive adoption of CNG-based vehicles and now there are almost 3.1 million registered CNG vehicles out of 6.1 million vehicles [88,89]. It shows that people positively react to the government’s awareness scheme with cheap transportation alternatives. Currently, there are no robust plans to implement EVs in Pakistan. The governments of developing countries need robust and investor-friendly policies to incorporate EVs in their traffic mix.
4.2.4. Lack of Awareness
Lack of information or partial information on the available option also leads to the disproval of emerging technology [1]. In a study conducted by Zhang and coworkers [86] in China, it was analyzed that people have limited knowledge of EV’s performance features, charging interval, operational and maintenance cost. Thereby, it can be assumed that complete knowledge and awareness would actually circumvent the different anxieties associated with EVs, such as range anxiety, charging anxiety or resale anxiety. In developing countries where EVs are not introduced, significant awareness initiatives would be necessary to make these vehicles successful. Awareness about sustainability also increases the chance to buy EVs [4]. It is evident that people with environmental concern and awareness tend to purchase EVs. Besides, the marketing campaign is more effective for people with environmental concern than others [74]. Government’s intention to raise awareness through advertising and financial incentives also lures the public to purchase EVs. Nongovernment agencies such as prospective investors would also have to create advertising strategies for their upcoming product.
4.2.5. Presence of a Strong Market for Gasoline-Based Vehicles
There is a high prevalence of gasoline-based vehicles in low-income countries such as Pakistan, India and Bangladesh [77,90]. In these countries, motorized two-wheelers’ vehicle registration is higher than four-wheeled vehicles. In 2006 in China, motorized two-wheelers outnumbered passenger vehicle sales by nearly 7 to 1. In 2009 in India, two-wheeler vehicles accounted for 75% of all new vehicle sales [21]. In Pakistan in 2016, motorized-two wheeler registration was 70% of total vehicles, indicating that more than half of the traffic mix consisted of two-wheelers [91]. If E2Ws are introduced in India or Pakistan, the gasoline-based market of motorcycles would provide grave competition due to its low purchase price and high mileage [13,50,87,92]. These gasoline motorcycles do not deal with anxieties associated with E2Ws. From the discussion, it can be understood that in order to mitigate the market for gasoline motorcycles, the E2Ws would have to offer an added value. This added value can be in terms of the low purchase price, low taxes or provision of services as ease of battery replacement etc.
4.2.6. Range Anxiety
Limited range is regarded as one of the major impediments to buying BEVs [93]. Range anxiety is defined as the driver’s stress regarding the unavailability of battery life that may leave the driver stranded [94,95]. Range anxiety includes both the actual and perceived range contributing to range anxiety. The range anxiety primarily affects the sale of E4Ws [93,96]. Increase in speed, use of air conditioners and outside temperature directly affect the energy consumption of a battery that may leave the driver to underestimate the performance of the BEVs. For example, a driver may travel 90 kilometres even if the BEVs has the capacity to travel 100 km [95]. Range anxiety is one of the main obstacles for the mass adoption of E2Ws as well. The range of a gasoline-based two-wheeler on average is 80–200 km [50]. Whereas, the E2Ws are usually equipped with a lead-acid battery and offer a driving range between 30 and 70 km [43,56].
Range anxiety for BEVs can be addressed by progressing battery technology [24,69]. The new models of Tesla and other companies are trying their best to increase the range of E4Ws through better energy density and technology [97,98]. In order to reduce the range anxiety, there should be an increase in public charging and battery swap stations for BEVs [69,80,93]. According to a study by Carley and coworkers [3], range anxiety is reduced when there is a charging infrastructure that communicates within the network. Accurate information on vehicle performance, trip timing, distance and charging infrastructure availability can also mitigate range anxiety as well. However, in the real world, such information is rarely available [95]. In order to regulate friction among drivers for charging BEVs in public charging stations, the following strategy could be adopted. Enforcing a time limit, dealing with ticketing, unplugging a fully charged vehicle and charging station’s capacity to allow allowing multiple BEV’s charging [93]. Range anxiety is also reduced with sufficient experience using the BEVs in which the driver learns vehicle capabilities, appropriate driving techniques and journey planning [69].
4.2.7. Long Charging Time
From the study by Carley and coworkers [3], the three most important impediments towards EVs adoption were identified as sticker price, range anxiety and large charging time. Long charging time is one of the crucial aspects which influences people to consider EVs as an inferior product [99]. Considering E4Ws, 100% charging requires 3–8 hours of charging with 1.4 kW maximum power [100]. From the study of Weis and coworkers [13], E2Ws have a battery capacity of 0.5–15 kWh, which require eight hours recharging from the standard wall outlet. The general pattern for charging an EV is during the evening and night when tariffs are low and EVs are idle [101]. It is clear that there is no cost-friendly option to charge EVs rapidly. Long charging time for EVs will remain stressful unless a sustainable technology option is developed. The problem of long charging time will be exacerbated when there are electricity blackouts in a country due to an energy crisis. In the developing countries, there are frequent electricity blackouts due to power crises [102]. The major reason for the blackouts in a developing country like Pakistan is the lack of effective policy making to foresee the rising power demand and the lack of maintenance for the current assets [103,104]. Resultantly, the blackouts could increase charging anxiety associated with BEVs. The people in developing countries could be trained to charge their BEVs like they charge their cell phones, even in long blackouts. HEVs could be a favourable option for the affluent class in developing countries, as HEVs do not require external charging.
4.2.8. Harmful Emissions
A study of well-to-wheel emissions by EVs from Wu and Zhang [23] determined that E4Ws and HEVs reduce CO2 emissions, but they could release more PM10, SO2 and NOX in the air compared to an ICEV engine if the electricity mix is predominantly thermal. In that study, it was indicated that HEVs perform better in countries such as India and China, which have an unclean electricity mix. Besides, zero-emission benefits could not be reached, unless these particulate matters are controlled. [105]. Furthermore, efforts should be made to make the electricity mix as green as possible so the negative externalities related to EVs can be controlled [23,106].
Most of the E2Ws in China are fitted with lead-acid batteries [107]. The solid lead waste for E2Ws is considerably higher than a gasoline motorcycle. These lead emissions are 5–10 grams/100 km, due to production, distribution and recycling of batteries [13,108]. This can lead to groundwater and crop contamination. Almost two square meters of land is contaminated if four kilograms of lead-acid battery waste is abandoned [109]. In China, 95% of the total lead emissions are released at the end-of-life stage, due to an improper recycling process. There are alternatives to the lead-acid battery, such as lithium-ion (Li-ion) and nickel-metal hydride (Ni-MH) batteries, which weigh half as much and have higher battery life. However, these are four times more expensive than the same energy provided by lead-acid batteries [13]. The technology to control these harmful emissions is mature and has an advantage due to the economies of scale [110]. According to one study, 60% of the lead-acid content is recyclable. If there is a 100% collection rate of lead-acid batteries for recyclability, 98% of the total toxicity impact of the lead-acid batteries could be avoided [56].
4.2.9. Increase in Demand for Power Generation
The effect on the grid is an object of debate among researchers. According to some scientists, it is expected that there will be a substantial upsurge in the power demand after the increase in the usage of the BEVs [111]. It would induce power generators to increase their supply to the national grid [21]. The introduction of BEVs affects the performance, capacity and efficiency of the electric grid when vehicle charging is unconstrained [81]. On the contrary, some researchers advocate that the total extent of energy extracted from the grid by electricity is comparatively small for EVs. In Milan, it is expected that only 3% of total electricity consumption will increase if BEVs share 30% of all PLDVs [112]. A study in India was conducted with a high EV penetration scenario; it showed that even with high dissemination of BEVs, the burden on electricity will not exceed more than 6% of overall demand for electricity [30].
The smart charging algorithm is a useful technique to address the limitation on the transformer’s capabilities when BEVs are connected to the grid. Some scientists believe that smart charging options can equal the overall load by the improved use of the baseload units that compels no further installation capacity [113,114]. The smart charging algorithm would also be useful to address the transformer’s high load that can increase its temperature. Besides, smart meters and grids can also take back power from the BEVs to address peak demand period. Congestion problems in load can arise if BEVs are not managed without a conceptual framework for the management of the grid [111]. Considering countries with blackouts, if the electric grid does not provide the electricity for BEVs, the local consumer may rely on an alternative way to use diesel generators which is an option that is cost-effective but hazardous to the environment [115]. In the context of developing countries marred by frequent blackouts due to electricity shortage, policymakers could be stressed with a slight increase in total consumption due to the adoption of BEVs. Unfortunately, no research has been performed to consider the impact of different types of BEVs on the peak electricity demand or total electricity consumption in the developing countries facing electricity blackouts.
4.2.10. Low Speed for E2Ws
The E2Ws have an average speed of around 30 km/hour, and weight ranges between 30 and 80 kg [24]. In India, where the traffic is heavily mixed, the average speed varies between 16 and 18 km/hour [43] indicating the E2Ws would cope in such traffic conditions. The E2Ws are usually quicker than bicycles but slower than gasoline motorcycles [13]. In comparison with bicycles, the increase in speed and effort are one of the main motivators to buy E2Ws [116]. In a study done in Vietnam, consumers were willing to pay more if speed and range are increased [50]. In different studies, it can be observed that speed played a major obstacle in the adoption of E2Ws and people are willing to pay more for E2Ws if the speed is increased [13,50,92,117].
4.2.11. Resale Issue
Consumers tend to resist new and unproven technology in their surroundings [4]. A study by Oliver and Rosen [118] indicated that perceived risk partially impedes the decision to purchase new products. This risk perception is formulated by experience, emotions, nontechnical sources and the media [4,119]. Social networks and media could impact values that affect consumer choices [120]. Sometimes, the private business holders are hesitant to adopt new technology such as EVs, due to uncertainty and fear that public benefit will outweigh the private benefit of the company [1]. Unless there is the widespread use of EVs, people will always be hesitant about a new product’s resale in the market. The resale anxiety of EVs will diminish once users observe the durability of the EVs, which will develop through market maturation [121]. Resale values of EVs have been one of the major impediments to purchase EVs, along with high cost and low range [122]. Various attributes reflect the resale price of vehicles, such as mechanical reliability, longevity, reputation and social trends. In order to tackle the resale anxiety of EVs in the developing countries, the government and private sector have to collaborate to create awareness schemes. These schemes should highlight the success stories of durability and reliabilities of EVs in Norway and China. Moreover, resale anxiety can be gradually reduced when there is sufficient visibility of EVs in a society backed by the word of mouth.
4.2.12. Consideration of E2Ws on the Lack of Road Safety
There is varied opinion among scientists regarding the safety of EVs. A study by Jochem and coworkers [64] analyzed that the accident cost of EVs is equal to that of ICEV. By contrary, some scientists advocate that silent motors increase the chance of an accident by a small number [119,123]. Considering E2Ws in China, the additionally weighted lead-acid batteries could increase the severity of the accident due to added inertia [124]. Nevertheless, “safety in numbers” (indicates the visibility of vehicles such as bicycle or motorcycle increases the awareness), and "low speed" can reduce two-wheeler’s accidents [13]. In developing countries, the safety of E2Ws would be a major issue since there are no separate lanes for two-wheelers on the road. The wide-scale acceptance of E2Ws in the developing countries would require additional traffic safety regulations and adaptations of urban infrastructure [13].
4.2.13. Lack Of E2Ws’ Capability to Carry More People and Weight
From the study of Dill and Rose [69], half of the consumers complained that additional weight by the E2Ws is a problem. This study also revealed concerns from consumers that the weight can increase their anxiety for a flat tire. The users regard the weight of the battery as a burdensome option. Around 30%–40% of the weight of the E2W consists of the battery. The lead-acid battery used in E2W is considerably heavier than lithium-ion batteries [31]. Additional weight can also be problematic in applying brakes or manoeuvring the E2Ws [125]. As lithium-ion technology is expensive, people of the developing countries would rely on the lead-acid battery for their E2W. In a developing country like Pakistan, people usually use petrol-based two-wheelers to carry heavy items, such as the delivery of dairy-related products [126]. Thereby, people may still resort to gasoline-based two-wheelers when carrying extra weight or people due to the low power of the E2Ws.
5. Conclusion and Policy Recommendations
This literature review focused on understanding the driving and resisting forces particularly directed towards the three types of EVs (E4Ws, HEVs and E2Ws) in developing countries. From the literature review, it can be understood that E2Ws are more feasible for developing countries due to their low purchase price and low operational cost. The E2Ws hold the potential to reduce congestion and GHG emissions without infrastructure investment. The E2Ws could be a successful option in developing countries that have predominantly gasoline-based two-wheelers in their traffic mix, such as India and Pakistan. On the contrary, E2Ws face divergent resisting forces, such as lack of awareness, electricity blackouts, strong gasoline-based two-wheelers’ market and inferior characteristics (low speed and high charging time). It is suggested that implementation of E4Ws be delayed in developing countries until the economies of scale can reduce the different costs associated with E4Ws. HEVs could also be propagated in the developing countries as well, as the purchase price is more affordable than E4Ws. Besides, HEVs offer reasonable GHG savings even with a dirty electricity mix [4,23,77]. In a summary, with proper policies HEVs and E2Ws can be successfully propagated in the developing countries. In order to bear the maximum environmental benefits of EVs in the developing countries, effort should be directed towards making the electricity mix green.
Future studies could be related to considering the willingness to accept and pay for E2Ws in the developing countries, where such vehicles have not been introduced. Moreover, it will be particularly interesting to understand whether electric bicycles, electric scooters or electric motorcycles will the preferred choice of future mobility by the respondents. Further studies could also be carried out to understand the total cost of ownership, influence on the peak electricity demand, total electricity consumption and environmental impacts of EVs in a particular region or country.
Author Contributions
Conceptualization, S.Z.R. and J.A.; Methodology, S.Z.R.; Software, S.Z.R.; Validation, S.Z.R. and J.A.; Formal Analysis, S.Z.R.; Investigation, S.Z.R.; Resources, S.Z.R.; Data Curation, S.Z.R.; Writing Original Draft Preparation, S.Z.R.; Writing Review & Editing, S.Z.R. and J.A.; Visualization, J.A.; Supervision, J.A.; Project Administration, J.A. All authors have read and agreed to the published version of the manuscript.
Funding
This research received no receive any external funding.
Conflicts of Interest
The authors declare no conflict of interest.
Appendix
A. Boolean for Web of Science
#1 TS = ("electric vehicle "OR "electric vehicle*" OR "electric mobility" OR "electric mobility*" OR "EVs*" "BEVs*"OR "new electric vehicle" OR "new electric vehicle*" OR "battery electric vehicle" OR "battery electric vehicle*" ))
#2 TS = ("electric car" OR "electric four wheeler*" OR "E4W*", OR "electric car*" OR "electric car*" OR "electric four wheelers"))
#3 TS= (“hybrid electric vehicle” OR “HEV*”OR "hybrid electric vehicle*"))
#4 TS = ("electric two wheeler" OR "electric two wheeler*" OR "E2W*"))
#5 TS= ("electric scooters" OR "electric scooter*" OR "mid size electric two wheeler" OR "mid size electric two wheeler*"))
#6 TS = ( “Underdeveloped country*” OR “Underdeveloped country” OR “Developing country*” OR “Developing country” OR “low income country*” OR “Low income country” OR “Low GDP country” OR “Low GDP country* ” OR “Under developed countries*” OR “Under developed countries” OR “Developing countries*” OR “Developing countries” OR “low income countries*” OR “Low income countries” OR “Low GDP countries” OR “Low GDP countries* ” ))
#7 #5 OR #4 OR #3 OR #2 OR #1
Final search #7 AND #6
B. Boolean for Google Scholar
#1 electric scooters OR mid size electric two wheeler OR electric car OR electric four wheeler OR hybrid electric vehicle OR HEV AND developing countries AND GHG
#2 electric scooters OR mid size electric two wheeler OR electric car OR electric four OR hybrid electric vehicle OR HEV AND developing countries AND energy
#3 electric scooters OR mid size electric two wheeler OR electric car OR electric four wheeler OR hybrid electric vehicle OR HEV AND developing countries AND infrastructure
#4 electric scooters OR mid size electric two wheeler OR electric car OR electric four wheeler OR hybrid electric vehicle OR HEV AND developing countries AND operational cost
#5 electric scooters OR mid size electric two wheeler AND developing countries AND purchase price
#6 electric scooters OR mid size electric two wheeler OR electric car OR electric four wheeler OR hybrid electric vehicle OR HEV AND developing countries AND public transportation
#7 electric scooters OR mid size electric two wheeler OR electric car OR electric four wheeler OR hybrid electric vehicle OR HEV AND developing countries AND congestion
#8 electric car OR electric four wheeler OR hybrid electric vehicle OR HEV AND developing countries AND purchase price
#9 electric scooters OR mid size electric two wheeler OR electric car OR electric four wheeler OR hybrid electric vehicle OR HEV AND developing countries AND government policy
#10 electric scooters OR mid size electric two wheeler OR electric car OR electric four wheeler OR hybrid electric vehicle OR HEV AND developing countries AND awareness
#11 electric scooters OR mid size electric two wheeler OR electric car OR electric four wheeler OR hybrid electric vehicle OR HEV AND developing countries AND gasoline two-wheeler
#12 electric scooters OR mid size electric two wheeler OR electric car OR electric four wheeler OR hybrid electric vehicle OR HEV AND developing countries AND range anxiety
#13 electric scooters OR mid size electric two wheeler OR electric car OR electric four wheeler OR hybrid electric vehicle OR HEV AND developing countries AND long charging time
#14 electric scooters OR mid size electric two wheeler OR electric car OR electric four wheeler OR hybrid electric vehicle OR HEV AND developing countries AND emissions
#15 electric scooters OR mid size electric two wheeler OR electric car OR electric four wheeler OR hybrid electric vehicle OR HEV AND developing countries AND power generation
#15 electric scooters OR mid size electric two wheeler OR electric car OR electric four wheeler OR hybrid electric vehicle OR HEV AND developing countries AND low speed
#16 electric scooters OR mid size electric two wheeler OR electric car OR electric four wheeler OR hybrid electric vehicle OR HEV AND developing countries AND resale
#17 electric scooters OR mid size electric two wheeler OR electric car OR electric four wheeler OR hybrid electric vehicle OR HEV AND developing countries AND road safety
# 18 electric scooters OR mid size electric two wheeler OR electric car OR electric four wheeler OR hybrid electric vehicle OR HEV AND developing countries AND weight
References
- Sierzchula, W.; Bakker, S.; Maat, K.; van Wee, B. The Influence of Financial Incentives and Other Socio-Economic Factors on Electric Vehicle Adoption. Energy Policy 2014, 68, 183–194. [Google Scholar] [CrossRef]
- Faria, M.V.; Baptista, P.C.; Farias, T.L. Electric Vehicle Parking in European and American Context: Economic, Energy and Environmental Analysis. Transp. Res. Part A Policy Pract. 2014, 64, 110–121. [Google Scholar] [CrossRef]
- Carley, S.; Krause, R.M.; Lane, B.W.; Graham, J.D. Intent to Purchase a Plug-in Electric Vehicle: A Survey of Early Impressions in Large US Cites. Transp. Res. Part D Transp. Environ. 2013, 18, 39–45. [Google Scholar] [CrossRef]
- Egbue, O.; Long, S. Barriers to Widespread Adoption of Electric Vehicles: An Analysis of Consumer Attitudes and Perceptions. Energy Policy 2012, 48, 717–729. [Google Scholar] [CrossRef]
- Newbery, D.; Strbac, G. Economics of Transportation What Is Needed for Battery Electric Vehicles to Become Socially Cost Competitive? Econ. Transp. 2016, 5, 1–11. [Google Scholar] [CrossRef] [Green Version]
- UN. World Economic Situation and Prospects; United Nations Publications: New York, NY, USA, 2014. [Google Scholar]
- Van Vliet, O.; Brouwer, A.S.; Kuramochi, T.; Van Den Broek, M.; Faaij, A. Energy Use, Cost and CO2 Emissions of Electric Cars. J. Power Sources 2011, 196, 2298–2310. [Google Scholar] [CrossRef] [Green Version]
- Forbes. These Electric Cars Deliver The Most Bang For The Buck. Available online: https://www.forbes.com/sites/jimgorzelany/2019/09/17/these-electric-cars-give-the-most-bang-for-the-buck/#c51059732097 (accessed on 7 February 2020).
- Helmers, E.; Marx, P. Electric Cars: Technical Characteristics and Environmental Impacts. In Transportation and the environment assesments and sustainability; Lonescu, G., Ed.; Taylor & Francis: Oakville, ON, Canada, 2016; pp. 207–242. [Google Scholar]
- Hug, V. Business Case for EV Charging on the Motorway Network in Denmark; Springer: Cham, Switzerland, 2015; pp. 67–87. [Google Scholar] [CrossRef]
- Panday, A.; Bansal, H.O. A Review of Optimal Energy Management Strategies for Hybrid Electric Vehicle. Int. J. Veh. Technol. 2014, 2014. [Google Scholar] [CrossRef] [Green Version]
- Orsi, F.; Muratori, M.; Rocco, M.; Colombo, E.; Rizzoni, G. A Multi-Dimensional Well-to-Wheels Analysis of Passenger Vehicles in Different Regions: Primary Energy Consumption, CO 2 Emissions, and Economic Cost Q. Appl. Energy 2016, 169, 197–209. [Google Scholar] [CrossRef]
- Weiss, M.; Dekker, P.; Moro, A.; Scholz, H.; Patel, M.K. On the Electrification of Road Transportation–A Review of the Environmental, Economic, and Social Performance of Electric. Transp. Res. Part D 2015, 41, 348–366. [Google Scholar] [CrossRef]
- Daziano, R.A. Conditional-Logit Bayes Estimators for Consumer Valuation of Electric Vehicle Driving Range. Resour. Energy Econ. 2013, 35, 429–450. [Google Scholar] [CrossRef]
- Hayes, J.G.; Davis, K. Simplified Electric Vehicle Powertrain Model for Range and Energy Consumption Based on EPA Coast-down Parameters and Test Validation by Argonne National Lab Data on the Nissan Leaf. In 2014 IEEE Transportation Electrification Conference and Expo: Components, Systems, and Power Electronics-From Technology to Business and Public Policy, ITEC 2014; Institute of Electrical and Electronics Engineers Inc.: Dearborn, MI, USA, 2014. [Google Scholar] [CrossRef]
- Orecchini, F.; Santiangeli, A.; Dell-Era, A. EVs and HEVs Using Lithium-Ion Batteries. In Lithium-Ion Batteries: Advances and Applications; Elsevier B.V.: Amsterdam, The Netherlands, 2014; pp. 205–248. [Google Scholar] [CrossRef]
- IEA. Global EV Outlook 2019–Analysis-IEA. Available online: https://www.iea.org/reports/global-ev-outlook-2019 (accessed on 25 January 2020).
- International Energy Agency. Global EV Outlook 2017: Two Million and Counting; International Energy Agency Publications: Paris, France, 2017. [Google Scholar] [CrossRef]
- Bjerkan, K.Y.; Nørbech, T.E.; Nordtømme, M.E. Incentives for Promoting Battery Electric Vehicle (BEV) Adoption in Norway. Transp. Res. Part D Transp. Environ. 2016, 43, 169–180. [Google Scholar] [CrossRef] [Green Version]
- Simsekoglu, Ö. Socio-Demographic Characteristics, Psychological Factors and Knowledge Related to Electric Car Use: A Comparison between Electric and Conventional Car Drivers. Transp. Policy 2018, 72, 180–186. [Google Scholar] [CrossRef]
- Doucette, R.T.; McCulloch, M.D. Modeling the CO2 Emissions from Battery Electric Vehicles given the Power Generation Mixes of Different Countries. Energy Policy 2011, 39, 803–811. [Google Scholar] [CrossRef]
- Bakker, S. Electric Two-Wheelers, Sustainable Mobility and the City. In Sustainable Cities-Authenticity, Ambition and Dream; IntechOpen: London, UK, 2019. [Google Scholar] [CrossRef] [Green Version]
- Wu, Y.; Zhang, L. Can the Development of Electric Vehicles Reduce the Emission of Air Pollutants and Greenhouse Gases in Developing Countries? Transp. Environ. 2017, 51, 129–145. [Google Scholar] [CrossRef]
- Cherry, C.R.; Yang, H.; Jones, L.R.; He, M. Dynamics of Electric Bike Ownership and Use in Kunming, China. Transp. Policy 2016, 45, 127–135. [Google Scholar] [CrossRef] [Green Version]
- Lin, X.; Wells, P.; Sovacool, B.K. Benign Mobility? Electric Bicycles, Sustainable Transport Consumption Behaviour and Socio-Technical Transitions in Nanjing, China. Transp. Res. Part A Policy Pract. 2017, 103, 223–234. [Google Scholar] [CrossRef] [Green Version]
- Haddadian, G.; Khodayar, M.; Shahidehpour, M. Accelerating the Global Adoption of Electric Vehicles: Barriers and Drivers. Electr. J. 2015, 28, 53–68. [Google Scholar] [CrossRef]
- Vidhi, R.; Shrivastava, P. A Review of Electric Vehicle Lifecycle Emissions and Policy Recommendations to Increase EV Penetration in India. Energies 2018, 11. [Google Scholar] [CrossRef]
- Prakash, S.; Dwivedy, M.; Poudel, S.S.; Shrestha, D.R. Modelling the Barriers for Mass Adoption of Electric Vehicles in Indian Automotive Sector: An Interpretive Structural Modeling (ISM) Approach. In 2018 5th International Conference on Industrial Engineering and Applications (ICIEA); IEEE: Singapore, 2018; pp. 458–462. [Google Scholar] [CrossRef]
- Shukla, P.; Dhar, S.; Pathak, M.; Bhaskar, K. Electric Vehicles Scenarios and a Roadmap for India; Magnum Custom Publishing: New Delhi, India, 2014. [Google Scholar]
- Dhar, S.; Pathak, M.; Shukla, P.R. Electric Vehicles and India’ s Low Carbon Passenger Transport: A Long-Term Co-Bene Fi Ts Assessment. J. Clean. Prod. 2017, 146, 139–148. [Google Scholar] [CrossRef] [Green Version]
- Ahmed, M.R.; Karmaker, A.K. Challenges for Electric Vehicle Adoption in Bangladesh. In 2nd International Conference on Electrical, Computer and Communication Engineering, ECCE 2019; Institute of Electrical and Electronics Engineers Inc.: Cox’s Bazar, Bangladesh, 2019. [Google Scholar] [CrossRef]
- Nepal, R.; Jamasb, T. Caught between Theory and Practice: Government, Market, and Regulatory Failure in Electricity Sector Reforms. Econ. Anal. Policy 2015, 46, 16–24. [Google Scholar] [CrossRef] [Green Version]
- Wahab, L.; Jiang, H. FACTORS INFLUENCING THE ADOPTION OF ELECTRIC VEHICLE: THE CASE OF ELECTRIC MOTORCYCLE IN NORTHERN GHANA. Available online: http://ijtte.com/uploads/2019-02-28/b2dcd5f3-4630-4746ijtte.2019.9(1).03.pdf (accessed on 8 October 2019).
- Shen, W.; Han, W.; Chock, D.; Chai, Q.; Policy, A.Z.-E.; 2012, U. Well-to-Wheels Life-Cycle Analysis of Alternative Fuels and Vehicle Technologies in China. Energy Policy 2012, 49, 296–307. [Google Scholar] [CrossRef]
- Zhou, G.; Ou, X.; Zhang, X. Development of Electric Vehicles Use in China: A Study from the Perspective of Life-Cycle Energy Consumption and Greenhouse Gas Emissions. Energy Policy 2013, 59, 875–884. [Google Scholar] [CrossRef]
- Bickert, S.; Kampker, A.; Greger, D. Developments of CO2-Emissions and Costs for Small Electric and Combustion Engine Vehicles in Germany. Transp. Environ. 2015, 36. [Google Scholar] [CrossRef]
- Bishop, J.D.K.; Doucette, R.T.; Robinson, D.; Mills, B.; McCulloch, M.D. Investigating the Technical, Economic and Environmental Performance of Electric Vehicles in the Real-World: A Case Study Using Electric Scooters. J. Power Sources 2011, 196, 10094–10104. [Google Scholar] [CrossRef]
- Onn, C.C.; Chai, C.; Abd Rashid, A.F.; Karim, M.R.; Yusoff, S. Vehicle Electrification in a Developing Country: Status and Issue, from a Well-to-Wheel Perspective. Transp. Res. Part D Transp. Environ. 2017, 50, 192–201. [Google Scholar] [CrossRef]
- Jiang, X.; Chen, Q.; Guan, D.; Zhu, K.; Yang, C. Revisiting the Global Net Carbon Dioxide Emission Transfers by International Trade: The Impact of Trade Heterogeneity of China. J. Ind. Ecol. 2016, 20, 506–514. [Google Scholar] [CrossRef]
- Ul-Haq, Z.; Tariq, S.; Ali, M. Spatiotemporal Assessment of CO2 Emissions and Its Satellite Remote Sensing over Pakistan and Neighboring Regions. J. Atmos. Solar-Terrestrial Phys. 2017, 152–153, 11–19. [Google Scholar] [CrossRef]
- Karmaker, A.K.; Rahman, M.M.; Hossain, M.A.; Ahmed, M.R. Exploration and Corrective Measures of Greenhouse Gas Emission from Fossil Fuel Power Stations for Bangladesh. J. Clean. Prod. 2020, 244, 118645. [Google Scholar] [CrossRef]
- Fame India. FAME INDIA. Available online: http://www.fame-india.gov.in/ (accessed on 20 March 2018).
- Majumdar, D.; Majumder, A.; Jash, T. Performance of Low Speed Electric Two-Wheelers in the Urban Traffic Conditions: A Case Study in Kolkata. Energy Procedia 2016, 90, 238–244. [Google Scholar] [CrossRef]
- Daemme, L.C.; Penteado, R.; Schneider, P.S.; Da Rocha, B.P.; Piccoli, B.D.S.; Errera, M.R.; Corrêa, S.M. Study of the Energy Efficiency and Greenhouse Emissions from Motorcycles Powered by Electric and Internal Combustion Engines. In SAE Technical Papers; SAE International: Warrendale, PA, USA, 2017. [Google Scholar] [CrossRef]
- De Assis Brasil Weber, N.; da Rocha, B.P.; Smith Schneider, P.; Daemme, L.C.; de Arruda Penteado Neto, R. Energy and Emission Impacts of Liquid Fueled Engines Compared to Electric Motors for Small Size Motorcycles Based on the Brazilian Scenario. Energy 2019, 168, 70–79. [Google Scholar] [CrossRef]
- Mendoza, J.-M.F.; Josa, A.; Rieradevall, J.; Gabarrell, X. Environmental Impact of Public Charging Facilities for Electric Two-Wheelers. J. Ind. Ecol. 2016, 20, 54–66. [Google Scholar] [CrossRef]
- Davidov, S.; Pantoš, M. Planning of Electric Vehicle Infrastructure Based on Charging Reliability and Quality of Service. Energy 2017, 118, 1156–1167. [Google Scholar] [CrossRef]
- Hannan, M.A.; Azidin, F.A.; Mohamed, A. Hybrid Electric Vehicles and Their Challenges: A Review. Renew. Sustain. Energy Rev. 2014, 135–150. [Google Scholar] [CrossRef]
- Çaǧatay Bayindir, K.; Gözüküçük, M.A.; Teke, A. A Comprehensive Overview of Hybrid Electric Vehicle: Powertrain Configurations, Powertrain Control Techniques and Electronic Control Units. Energy Convers. Manag. 2011, 52, 1305–1313. [Google Scholar] [CrossRef]
- Jones, L.R.; Cherry, C.R.; Vu, T.A.; Nguyen, Q.N. The Effect of Incentives and Technology on the Adoption of Electric Motorcycles: A Stated Choice Experiment in Vietnam. Transp. Res. Part A Policy Pract. 2013, 57, 1–11. [Google Scholar] [CrossRef]
- Brenna, M.; Dolara, A.; Foiadelli, F.; Leva, S.; Longo, M. Urban Scale Photovoltaic Charging Stations for Electric Vehicles. IEEE Trans. Sustain. Energy 2014, 5, 1234–1241. [Google Scholar] [CrossRef]
- Hawkins, T.R.; Gausen, O.M.; Strømman, A.H. Environmental Impacts of Hybrid and Electric Vehicles—a Review. Int. J. Life Cycle Assess. 2012, 17, 997–1014. [Google Scholar] [CrossRef]
- Metz, M.; Doetsch, M. Electric Vehicles as Flexible Loads–A Simulation Approach Using Empirical Mobility Data. Energy 2012, 48, 369–374. [Google Scholar] [CrossRef]
- Shen, W.; Han, W.; Wallington, T.J. Current and Future Greenhouse Gas Emissions Associated with Electricity Generation in China: Implications for Electric Vehicles. Environ. Sci. Technol. 2014. [Google Scholar] [CrossRef]
- Wu, Y.; Yang, Z.; Lin, B.; Liu, H.; Wang, R.; Zhou, B.; Hao, J. Energy Consumption and CO2 Emission Impacts of Vehicle Electrification in Three Developed Regions of China. Energy Policy 2012, 48, 537–550. [Google Scholar] [CrossRef]
- Kerdlap, P.; Gheewala, S.H. Electric Motorcycles in Thailand: A Life Cycle Perspective. J. Ind. Ecol. 2016, 20, 1399–1411. [Google Scholar] [CrossRef]
- Tuayharn, K.; Kaewtatip, P.; Ruangjirakit, K.; Limthongkul, P. ICE Motorcycle and Electric Motorcycle: Environmental and Economic Analysis. In SAE Technical Papers; SAE International: New York, NY, USA, 2015. [Google Scholar]
- Kroesen, M. To What Extent Do E-Bikes Substitute Travel by Other Modes? Evidence from the Netherlands. Transp. Res. Part D 2017, 53, 377–387. [Google Scholar] [CrossRef]
- Fairley, P. Speed Bumps Ahead for Electric-Vehicle Charging. IEEE Spectr. 2010, 47, 13–14. [Google Scholar] [CrossRef]
- Rao, M.; Mohan Rao, A.; Ramachandra Rao, K. Higher Order Continuum Modelling Methodology for Non-Lane Based Heterogeneous Traffic Environment View Project Modelling Emergency Evacuation of Pedestrians, Calibration and Validation of Pedestrian Simulation Parameters View Project MEASURING URBAN TRAFFIC CONGESTION-A REVIEW. Int. J. Traac Transp. Eng. 2012, 2. [Google Scholar] [CrossRef] [Green Version]
- Shabbar Ali, M.; Adnan, M.; Muhammad Noman, S.; Baqueri, S.; Fazal Abbas Baqueri, S. Estimation of Traffic Congestion Cost-A Case Study of a Major Arterial in Karachi External Trips View Project ISCAPE: Improving the Smart Control of Air Pollution in Europe View Project Estimation of Traffic Congestion Cost-A Case Study of a Major Arterial in Karachi. Procedia Eng. 2014, 77, 37–44. [Google Scholar] [CrossRef] [Green Version]
- Rizwan, P.; Suresh, K.; Rajasekhara Babu, M. Real-Time Smart Traffic Management System for Smart Cities by Using Internet of Things and Big Data. In Proceedings of the IEEE International Conference on Emerging Technological Trends in Computing, Communications and Electrical Engineering, ICETT 2016, Kollam, India , 21–22 October 2016 . [Google Scholar] [CrossRef]
- Chik Cheong, C.; Loh, N. Transport Policies and Patterns: A Comparison of Five Asian Cities. Available online: https://pdfs.semanticscholar.org/4e08/1be85e61c385ba776f6825e1bc356d9621eb.pdf (accessed on 6 December 2019).
- Jochem, P.; Doll, C.; Fichtner, W. External Costs of Electric Vehicles. Transp. Res. Part D Transp. Environ. 2016, 42, 60–76. [Google Scholar] [CrossRef] [Green Version]
- Qian, L.; Soopramanien, D. Heterogeneous Consumer Preferences for Alternative Fuel Cars in China. Transp. Res. Part D Transp. Environ. 2011, 16, 607–613. [Google Scholar] [CrossRef]
- Klöckner, C.A.; Nayum, A.; Mehmetoglu, M. Positive and Negative Spillover Effects from Electric Car Purchase to Car Use. Transp. Res. Part D Transp. Environ. 2013, 21, 32–38. [Google Scholar] [CrossRef] [Green Version]
- Jochem, P.; Babrowski, S.; Fichtner, W. Assessing CO2 Emissions of Electric Vehicles in Germany in 2030. Transp. Res. Part A Policy Pract. 2015, 78, 68–83. [Google Scholar] [CrossRef] [Green Version]
- Van Acker, V.; Witlox, F. Car Ownership as a Mediating Variable in Car Travel Behaviour Research Using a Structural Equation Modelling Approach to Identify Its Dual Relationship. J. Transp. Geogr. 2010, 18, 65–74. [Google Scholar] [CrossRef] [Green Version]
- Dill, J.; Rose, G. Electric Bikes and Transportation Policy. Transp. Res. Rec. J. Transp. Res. Board 2012, 2314, 1–6. [Google Scholar] [CrossRef]
- Fyhri, A.; Fearnley, N. Effects of E-Bikes on Bicycle Use and Mode Share. Transp. Res. Part D Transp. Environ. 2015, 36, 45–52. [Google Scholar] [CrossRef] [Green Version]
- Johnson, M.; Rose, G. Extending Life on the Bike: Electric Bike Use by Older Australians. J. Transp. Heal. 2015, 2, 276–283. [Google Scholar] [CrossRef]
- Popovich, N.; Gordon, E.; Shao, Z.; Xing, Y.; Wang, Y.; Handy, S. Experiences of Electric Bicycle Users in the Sacramento, California Area. Travel Behav. Soc. 2014, 1, 37–44. [Google Scholar] [CrossRef]
- Tan, Q.; Wang, M.; Deng, Y.; Yang, H.; Rao, R.; Zhang, X. The Cultivation of Electric Vehicles Market in China: Dilemma and Solution. Sustainability 2014, 5493–5511. [Google Scholar] [CrossRef] [Green Version]
- Krupa, J.S.; Rizzo, D.M.; Eppstein, M.J.; Brad Lanute, D.; Gaalema, D.E.; Lakkaraju, K.; Warrender, C.E. Analysis of a Consumer Survey on Plug-in Hybrid Electric Vehicles. Transp. Res. Part A Policy Pract. 2014, 64, 14–31. [Google Scholar] [CrossRef]
- Graham-Rowe, E.; Gardner, B.; Abraham, C.; Skippon, S.; Dittmar, H.; Hutchins, R.; Stannard, J. Mainstream Consumers Driving Plug-in Battery-Electric and Plug-in Hybrid Electric Cars: A Qualitative Analysis of Responses and Evaluations. Transp. Res. Part A Policy Pract. 2012, 46, 140–153. [Google Scholar] [CrossRef]
- San Román, T.G.; Momber, I.; Abbad, M.R.; Sánchez Miralles, Á. Regulatory Framework and Business Models for Charging Plug-in Electric Vehicles: Infrastructure, Agents, and Commercial Relationships. Energy Policy 2011, 39, 6360–6375. [Google Scholar] [CrossRef]
- Mansour, C.J.; Haddad, M.G. Well-to-Wheel Assessment for Informing Transition Strategies to Low-Carbon Fuel-Vehicles in Developing Countries Dependent on Fuel Imports: A Case-Study of Road Transport in Lebanon. Energy Policy 2017, 107, 167–181. [Google Scholar] [CrossRef]
- Budde, T.; Wells, P.; Cipcigan, L. Can Innovative Business Models Overcome Resistance to Electric Vehicles? Better Place and Battery Electric Cars in Denmark. Energy Policy 2012, 48, 498–505. [Google Scholar] [CrossRef]
- International Energy Agency. Hybrid and Electric Vehicles. Available online: http://www.ieahev.org/assets/1/7/Report2015_WEB.pdf (accessed on 12 April 2018).
- Faria, R.; Moura, P.; Delgado, J.; de Almeida, A.T. A Sustainability Assessment of Electric Vehicles as a Personal Mobility System. Energy Convers. Manag. 2012, 61, 19–30. [Google Scholar] [CrossRef]
- Richardson, D.B. Electric Vehicles and the Electric Grid: A Review of Modeling Approaches, Impacts, and Renewable Energy Integration. Renew. Sustain. Energy Rev. 2013, 247–254. [Google Scholar] [CrossRef]
- Liao, F.; Molin, E.; van Wee, B. Consumer Preferences for Electric Vehicles: A Literature Review. Transp. Rev. 2017, 1647, 252–275. [Google Scholar] [CrossRef] [Green Version]
- Briggs, M.; Webb, J.; Wilson, C. Automotive Modal Lock-in: The Role of Path Dependence and Large Socio-Economic Regimes in Market Failure. Econ. Anal. Policy 2015, 45, 58–68. [Google Scholar] [CrossRef]
- Yang, C.J. Launching Strategy for Electric Vehicles: Lessons from China and Taiwan. In Technological Forecasting and Social Change; Elsevier Inc.: Amsterdam, The Netherlands, 2010; pp. 831–834. [Google Scholar] [CrossRef]
- International Energy Agency. Global EV Outlook 2017 Together Secure Sustainable Global EV Outlook 2017; International Energy Agency Publications: Paris, France, 2017. [Google Scholar]
- Zhang, Y.; Yu, Y.; Zou, B. Analyzing Public Awareness and Acceptance of Alternative Fuel Vehicles in China: The Case of EV. Energy Policy 2011, 39, 7015–7024. [Google Scholar] [CrossRef]
- Eccarius, T.; Lu, C.C. Powered Two-Wheelers for Sustainable Mobility: A Review of Consumer Adoption of Electric Motorcycles. Int. J. Sustain. Transp. 2020, 215–231. [Google Scholar] [CrossRef]
- Khan, M.I.; Yasmin, T. Development of Natural Gas as a Vehicular Fuel in Pakistan: Issues and Prospects. J. Nat. Gas Sci. Eng. 2014, 17, 99–109. [Google Scholar] [CrossRef]
- Khan, M.I.; Yasmin, T.; Shakoor, A. Technical Overview of Compressed Natural Gas (CNG) as a Transportation Fuel. Renew. Sustain. Energy Rev. 2015, 51, 785–797. [Google Scholar] [CrossRef]
- CEIC. Bangladesh|Motor Vehicle Registered: Bangladesh: Total|Economic Indicators. Available online: https://www.ceicdata.com/en/bangladesh/motor-vehicle-registered/motor-vehicle-registered-bangladesh-total (accessed on 3 April 2018).
- Pakistan, E.S. Economic Survey Of Pakistan 2016-2017. Available online: http://www.finance.gov.pk/survey_1617.html (accessed on 3 April 2018).
- Guerra, E. Electric Vehicles, Air Pollution, and the Motorcycle City: A Stated Preference Survey of Consumers’ Willingness to Adopt Electric Motorcycles in Solo, Indonesia. Transp. Res. Part D Transp. Environ. 2019, 68, 52–64. [Google Scholar] [CrossRef]
- Bonges, H.A.; Lusk, A.C. Addressing Electric Vehicle (EV) Sales and Range Anxiety through Parking Layout, Policy and Regulation. Transp. Res. Part A Policy Pract. 2016, 83, 63–73. [Google Scholar] [CrossRef] [Green Version]
- Salah, K.; Kama, N. Inter-Service Provider Charging Protocol: A Solution to Address Range Anxiety of Electric Vehicle Owners. Energy Procedia 2017, 136, 157–162. [Google Scholar] [CrossRef]
- Neubauer, J.; Wood, E. The Impact of Range Anxiety and Home, Workplace, and Public Charging Infrastructure on Simulated Battery Electric Vehicle Lifetime Utility. J. Power Sources 2014, 257, 12–20. [Google Scholar] [CrossRef]
- Jochem, P.; Doll, C.; Fichtner, W.; de Gouw, J.A.; Parrish, D.D.; Frost, G.J.; Trainer, M.; Hawkins, T.R.; Gausen, O.M.; Strømman, A.H.; et al. Motives, Perceptions and Experiences of Electric Bicycle Owners and Implications for Health, Wellbeing and Mobility. Accid. Anal. Prev. 2017, 42, 1–11. [Google Scholar]
- Cao, J.; Emadi, A. A New Battery/Ultracapacitor Hybrid Energy Storage System for Electric, Hybrid, and Plug-in Hybrid Electric Vehicles. IEEE Trans. Power Electron. 2011, 27, 122–132. [Google Scholar] [CrossRef]
- Thackeray, M.; Wolverton, C.; Isaacs, E.D. Electrical Energy Storage for Transportation—Approaching the Limits of, and Going beyond, Lithium-Ion Batteries. Energy Environ. Sci. 2012. [Google Scholar] [CrossRef]
- Steinhilber, S.; Wells, P.; Thankappan, S. Socio-Technical Inertia: Understanding the Barriers to Electric Vehicles. Energy Policy 2013, 60, 531–539. [Google Scholar] [CrossRef]
- Hidrue, M.K.; Parsons, G.R.; Kempton, W.; Gardner, M.P. Willingness to Pay for Electric Vehicles and Their Attributes §. Resour. Energy Econ. 2011, 33, 686–705. [Google Scholar] [CrossRef] [Green Version]
- Shao, S.; Guan, W.; Ran, B.; He, Z.; Bi, J. Electric Vehicle Routing Problem with Charging Time and Variable Travel Time. Math. Probl. Eng. 2017, 2017, 1–13. [Google Scholar] [CrossRef] [Green Version]
- Liao, R.-N.; Yang, N.-C. Load-Shedding Strategy Using a Zero-Sequence Power Supply Scheme for Distribution Networks in a Modern Home or Building. Energy Build. 2018, 159, 179–190. [Google Scholar] [CrossRef]
- Kessides, I.N. Chaos in Power: Pakistan’s Electricity Crisis. Energy Policy 2013, 55, 271–285. [Google Scholar] [CrossRef]
- Mirjat, N.H.; Uqaili, M.A.; Harijan, K.; Walasai, G.D.; Mondal, M.A.H.; Sahin, H. Long-Term Electricity Demand Forecast and Supply Side Scenarios for Pakistan (2015–2050): A LEAP Model Application for Policy Analysis. Energy 2018, 165, 512–526. [Google Scholar] [CrossRef]
- Liu, G.; Yu, Y.; Hou, J.; Xue, W.; Liu, X.; Liu, Y.; Wang, W.; Alsaedi, A.; Hayat, T.; Liu, Z. An Ecological Risk Assessment of Heavy Metal Pollution of the Agricultural Ecosystem near a Lead-Acid Battery Factory. Ecol. Indic. 2014, 47, 210–218. [Google Scholar] [CrossRef]
- Choi, H.; Shin, J.; Woo, J.R. Effect of Electricity Generation Mix on Battery Electric Vehicle Adoption and Its Environmental Impact. Energy Policy 2018, 121, 13–24. [Google Scholar] [CrossRef]
- Garche, J.; Moseley, P.T. Lead-Acid Batteries for E-Bicycles and E-Scooters. In Lead-Acid Batteries for Future Automobiles; Elsevier Inc.: Amsterdam, The Netherlands, 2017; pp. 527–547. [Google Scholar] [CrossRef]
- Liu, W.; Tian, J.; Chen, L.; Guo, Y. Temporal and Spatial Characteristics of Lead Emissions from the Lead-Acid Battery Manufacturing Industry in China. Environ. Pollut. 2017, 220, 696–703. [Google Scholar] [CrossRef] [PubMed]
- Tian, X.; Gong, Y.; Wu, Y.; Agyeiwaa, A.; Zuo, T. Management of Used Lead Acid Battery in China: Secondary Lead Industry Progress, Policies and Problems. Resour. Conserv. Recycl. 2014, 93, 75–84. [Google Scholar] [CrossRef]
- Santos, G. Road Transport and CO2 Emissions: What Are the Challenges? Transp. Policy 2017, 59, 71–74. [Google Scholar] [CrossRef]
- Lopes, J.A.P.; Soares, F.J.; Almeida, P.M.R. Integration of Electric Vehicles in the Electric Power System. Proc. IEEE 2011, 99, 168–183. [Google Scholar] [CrossRef] [Green Version]
- Perujo, A.; Ciuffo, B. The Introduction of Electric Vehicles in the Private Fleet: Potential Impact on the Electric Supply System and on the Environment. A Case Study for the Province of Milan, Italy. Energy Policy 2010, 38, 4549–4561. [Google Scholar] [CrossRef]
- Zheng, Y.; Jian, L. Smart Charging Algorithm of Electric Vehicles Considering Dynamic Charging Priority. In Proceedings of the 2016 IEEE International Conference on Information and Automation, IEEE ICIA 2016, Ningbo, China, 1–3 August 2016; Institute of Electrical and Electronics Engineers Inc.: Ningbo, China, 2017; pp. 555–560. [Google Scholar] [CrossRef]
- Van der Kam, M.; van Sark, W. Smart Charging of Electric Vehicles with Photovoltaic Power and Vehicle-to-Grid Technology in a Microgrid; a Case Study. Appl. Energy 2015, 152, 20–30. [Google Scholar] [CrossRef] [Green Version]
- Saxena, S.; Gopal, A.; Phadke, A. Electrical Consumption of Two-, Three-and Four-Wheel Light-Duty Electric Vehicles in India. Appl. Energy 2014, 115, 582–590. [Google Scholar] [CrossRef]
- Jones, T.; Harms, L.; Heinen, E. Motives, Perceptions and Experiences of Electric Bicycle Owners and Implications for Health, Wellbeing and Mobility. J. Transp. Geogr. 2016, 53, 41–49. [Google Scholar] [CrossRef] [Green Version]
- Zhu, L.; Song, Q.; Sheng, N.; Zhou, X. Exploring the Determinants of Consumers’ WTB and WTP for Electric Motorcycles Using CVM Method in Macau. Energy Policy 2019, 127, 64–72. [Google Scholar] [CrossRef]
- Oliver, J.D.; Rosen, D.E. Applying the Environmental Propensity Framework: A Segmented Approach to Hybrid Electric Vehicle Marketing Strategies. J. Mark. Theory Pract. 2010, 18, 377–393. [Google Scholar] [CrossRef]
- Cocron, P.; Krems, J.F. Driver Perceptions of the Safety Implications of Quiet Electric Vehicles. Accid. Anal. Prev. 2013, 58, 122–131. [Google Scholar] [CrossRef]
- Bronner, F.; De Hoog, R. Social Media and Consumer Choice. Int. J. Mark. Res. 2014, 56, 51–71. [Google Scholar] [CrossRef]
- Lim, M.K.; Mak, H.-Y.; Rong, Y. Toward Mass Adoption of Electric Vehicles: Impact of the Range and Resale Anxieties. Manuf. Serv. Oper. Manag. 2015, 17, 101–119. [Google Scholar] [CrossRef]
- Kihm, A.; Trommer, S. The New Car Market for Electric Vehicles and the Potential for Fuel Substitution. Energy Policy 2014, 73, 147–157. [Google Scholar] [CrossRef]
- Stelling-Kończak, A.; Hagenzieker, M.; Wee, B. Van. Traffic Sounds and Cycling Safety: The Use of Electronic Devices by Cyclists and the Quietness of Hybrid and Electric Cars. Transp. Rev. 2015, 35, 422–444. [Google Scholar] [CrossRef] [Green Version]
- Rose, G. E-Bikes and Urban Transportation: Emerging Issues and Unresolved Questions. Transportation 2012, 39, 81–96. [Google Scholar] [CrossRef]
- Huertas-Leyva, P.; Dozza, M.; Baldanzini, N. Investigating Cycling Kinematics and Braking Maneuvers in the Real World: E-Bikes Make Cyclists Move Faster, Brake Harder, and Experience New Conflicts. Transp. Res. Part F Traffic Psychol. Behav. 2018, 54, 211–222. [Google Scholar] [CrossRef]
- REUTERS. Pakistan Pioneers Lead Epic Struggle for more Milk-Reuters. Available online: https://www.reuters.com/article/us-pakistan-milk/pakistan-pioneers-lead-epic-struggle-for-more-milk-idUSBRE87P0D220120826 (accessed on 27 January 2020).
Figure 1.
Overview of the screening process.

Figure 2.
Energy and emissions savings considering infrastructure investment costs for different mobility modes [77].
Figure 2.
Energy and emissions savings considering infrastructure investment costs for different mobility modes [77].


Table 1.
Characteristics of different type of electric vehicles (EVs) [12,13,14,15,16] (electric four-wheelers (E4Ws), electric two-wheelers (E2Ws) and hybrid electric vehicles (HEVs)).
| Characteristics | E4Ws | HEVs | E2Ws |
|---|---|---|---|
| Speed | ≥ 150 | ≥ 180 km h−1 | ≤ 45 km h−1 |
| Range in km per full charge | 200–300 | 862 | 20–70 |
| Charging time | 3–8 hours | - | 8 hours |
| Electricity consumed per kilometre | 0.15 | - | 0.45 |
| Battery storage | 24 kWh | 0.8–1.3 kWh | 0.5–15 kWh |
| Battery type | Predominantly lithium-ion battery used | Predominantly lithium-ion battery used | Lead-acid (Asian markets), lithium-ion batteries (European markets) |
Table 2.
CO2 emissions in grams per kWh in different developing countries.
| Country | CO2 Emissions in Grams per kWh | Reference | Year |
|---|---|---|---|
| China | 758 | [39] | 2016 |
| India | 928 | [39] | 2016 |
| Indonesia | 632 | [39] | 2016 |
| Turkey | 478 | [39] | 2016 |
| Mexico | 547 | [39] | 2016 |
| Pakistan | 566 | [40] | 2017 |
| Bangladesh | 640 | [41] | 2020 |
Table 3.
Comparative analysis among different electric mobility modes considering tank-to-wheel energy use [12,13].
| Mode | Tank-to-Wheel Energy Use Represented in kWh per km |
|---|---|
| E-Bicycle | 0.015 ± 0.005 |
| Midsize E2Ws or electric scooters | 0.045 ± 0.02 |
| Midsize gasoline-powered two-wheelers | 0.25 ± 0.09 |
| Large E2W or electric motorcycles | 0.07 ± 0.0.3 |
| Large gasoline-powered two-wheelers | 0.41 ± 0.13 |
| E4Ws | 0.15 ± 0.04 |
| HEVs | 0.4. ± 0.1 |
© 2020 by the authors. Licensee MDPI, Basel, Switzerland. This article is an open access article distributed under the terms and conditions of the Creative Commons Attribution (CC BY) license (http://creativecommons.org/licenses/by/4.0/).
Share and Cite
MDPI and ACS Style
Rajper, S.Z.; Albrecht, J. Prospects of Electric Vehicles in the Developing Countries: A Literature Review. Sustainability 2020, 12, 1906. https://doi.org/10.3390/su12051906
AMA Style
Rajper SZ, Albrecht J. Prospects of Electric Vehicles in the Developing Countries: A Literature Review. Sustainability. 2020; 12(5):1906. https://doi.org/10.3390/su12051906
Chicago/Turabian StyleRajper, Sarmad Zaman, and Johan Albrecht. 2020. "Prospects of Electric Vehicles in the Developing Countries: A Literature Review" Sustainability 12, no. 5: 1906. https://doi.org/10.3390/su12051906
Note that from the first issue of 2016, this journal uses article numbers instead of page numbers. See further details here.