An Analysis of Disparities and Driving Factors of Carbon Emissions in the Yangtze River Economic Belt


1
Institute of Climate Change and Public Policy, Nanjing University of Information Science & Technology, Nanjing 210044, China
2
School of Management Science and Engineering, Nanjing University of Information Science & Technology, Nanjing 210044, China
3
China Institute of Manufacturing Development, Nanjing University of Information Science & Technology, Nanjing 210044, China
4
School of Marine Sciences, Nanjing University of Information Science & Technology, Nanjing 210044, China
*
Author to whom correspondence should be addressed.
Sustainability 2019, 11(8), 2362; https://doi.org/10.3390/su11082362
Submission received: 11 March 2019
/
Revised: 3 April 2019
/
Accepted: 16 April 2019
/
Published: 19 April 2019
(This article belongs to the Special Issue Advanced Computational Intelligence for Data Analytics, Modeling, Control and Optimisation of Sustainable Energy Systems)
Abstract
:As one of the “three major strategies” for China’s regional development, the Yangtze River Economic Belt (YREB) is under severe pressure to reduce carbon dioxide emissions, this paper analyzes the spatiotemporal disparities, and driving factors of carbon emissions based on energy consumption and related economic development data in the YREB over the 2005–2016 11-year period. Using the Stochastic Impacts Regression on Population, Affluence and Technology (STIRPAT) model, we empirically test the factors affecting YREB carbon emissions and key drivers in various provinces and municipalities. The main findings are as follows. First, per capita GDP, both industrial structure and energy intensity have positive effects on increasing carbon emissions. Second, per capita GDP and energy intensity have the largest impact on the increase of carbon emissions, and the urbanization rate has the largest inhibitory effect on carbon emissions.
1. Introduction
Although globally, climate change has brought severe challenges to human survival and development, China, as the country with the highest carbon dioxide (CO2) emissions, is especially pressured. In 2009, the Chinese government proposed that by 2020, CO2 emissions should be slashed by 40–50% compared to 2005 levels, requiring this measure to be a binding indicator in medium- and long-term national economic and social development planning. Moreover, China is accelerating its goal of reducing its carbon emission intensity and reaching a peak in its national determined contributions (NDC). It is apparent that domestically increasing regional pollution control also requires a clearer emission reduction mechanism. The Yangtze River Economic Belt (YREB) contains 11 provinces and municipalities (Shanghai, Jiangsu, Zhejiang, Anhui, Jiangxi, Hubei, Hunan, Chongqing, Sichuan, Guizhou, Yunnan), and there are great disparities in economic development levels, industrial structures, resource endowment and their environmental carrying capacities. In 2016, the “13th Five-Year Plan” was strategically positioned to “prioritize the environment for green development”, which calls for the promotion of low-carbon development in key areas such as industry, energy and transportation, and effective control of total carbon emissions. To establish an effective emission reduction mechanism, the following questions must be clarified: Historically, what levels of carbon emissions have been experienced in the YREB, which factors drive those carbon emissions and how are they related within the provinces and municipalities? To clarify, the main regions needed to achieve carbon emission reductions in the YREB and the key points of carbon emission reduction in different regions, this paper mainly analyzes these issues. In this paper, taking the 11 provinces and municipalities in YREB as the study area, we studied the spatiotemporal change of carbon emissions. We then employed the Stochastic Impacts Regression on Population, Affluence and Technology (STIRPAT) model to analyze the impacts of the population size, wealth level, the urbanization rate, the industrial structure and energy intensity on regional carbon emissions, aiming to establish an effective emission reduction mechanism and aid local sustainable development decision-making.
2. Research Status
With the aim of investigating the influence of various factors on carbon emissions, an effective method is needed, of which Logarithmic Mean Divisia Index (LMDI) decomposition and the STIRPAT model are particularly effective at investigating the influencing factors of greenhouse gas emissions. In the application of LMDI decomposition, Freitas and Kaneko employed this method to uncover that energy structure and carbon intensity were key factors in Brazil’s carbon emissions [1]. Zhang and Da similarly used applied LMDI to decompose the changes in China’s carbon emissions and carbon emission intensity from 1996 to 2010 [2]. Xu and Lin used this model and time series data to analyze the driving factors of changes in carbon emissions in China’s chemical industry [3]. Wang and Feng decomposed changes in energy-related CO2 emissions into five effects at both the national and provincial levels based on the LMDI method [4]. Many scholars extended the functionality of the LMDI model. For example, Zhang and Shao et al. introduced novel factors into LMDI decomposition, including energy density, energy consumption intensity, investment intensity, and R&D efficiency [5,6]. Wang and Yang constructed an expanded decomposition model for decoupling the elasticity and effort index of industrial carbon emissions based on the two-level LMDI decomposition and Tapio index [7].
In the 1970s, Ehrlich and Holdren put forward the Impact, Population, Affluence and Technology (IPAT) models, which decomposed the impact of human social activities on the environment into three factors: Population, affluence and technology level [8]. On the basis of the IPAT model, the researchers established the STIRPAT model and introduced an index to analyze the disproportionate impact of population factors on the environment. Presently, the STIRPAT model has emerged as a primary method for conceptualizing the nature of relationships between people and their environment. Shuai used the STIRPAT model to analyze the carbon impact factors of 125 countries, which were divided into four income levels. The results showed that within this group of countries, the variable with the highest impact on carbon emission was economies where, for high-income countries, the key influencing factor was technology [9]. Singh adopted the STIRPAT model to study per capita greenhouse gas (GHG) emissions in the US, and employed new explanatory factors such as cattle population density, political willingness to address environmental problems, and educational attainment. Results indicated that cattle density and affluence are major drivers of GHG emissions [10]. Liddle employed the STIRPAT model to analyze the impact factors of the environment, and further disaggregated population into three particular key age groups. The result indicated that population impacts the environment in considerably different ways across age groups [11]. Yuan analyzed the forces driving energy-related CO2 emissions based on a threshold STIRPAT dynamic model in China, and investigated the impact of affluence on CO2 emissions [12]. Li et al. used the STIRPAT model to analyze the impact of multi-dimensional industrial structures and technological progress on carbon emissions, finding that the transformation of the industrial structure made the greatest contribution to carbon emissions [13]. Shuai and Chen et al. used the STIRPAT model for correlation analysis, partial correlation analysis and stepwise regression to explore the key influencing factors of China’s carbon emissions, providing a reliable indicator system to provide a reference for policy formulation [14]. Zhang and Liao et al. used a spatial econometric model to capture the motion trajectory of the gravity center of China’s carbon emissions in space and used the STIRPAT model to study the impact of urbanization on carbon emissions [15]. Many scholars have expanded the STIRPAT model from new perspectives, including urbanization, land use, employment in the secondary and tertiary industries, fixed asset investment, and climate difference [16,17,18,19]. Li and Zuo applied the STIRPAT model to predict the future carbon emission peak [20].
In summary, LMDI decomposition and the STIRPAT model are both mainstream methods, but there are differences in their applicability. LMDI can achieve no residual decomposition, but it is impossible to examine the elasticity of each factor. The STIRPAT model has a strong scalability, allowing researchers to extend the model according to their own research purposes, ensuring that the model analysis results are more detailed [21]. Consequently, this paper uses the extended STIRPAT model to conduct an in-depth analysis of five factors (population size, urbanization rate, wealth level, industrial structure and energy intensity) which affect YREB carbon emissions. We also conduct a panel data regression analysis of the extended STIRPAT model to obtain the impact of each driver on carbon emissions. Finally, we integrate present and past regression results to propose carbon emission reduction recommendations for each driving factor and provide an important parameter reference and a scientific basis for the formulation and implementation of carbon emission reduction policies in the YREB.
3. Methodology and Data
3.1. Estimation of Carbon Emissions
Presently, carbon emission monitoring is only carried out in a few developed countries, and there is no direct monitoring data of carbon emission in China. We adopt the reference measurement model given by Intergovernmental Panelon Climate Change (IPCC) and combined it with the energy consumption characteristics of provinces and municipalities in the YREB. The calculation formula is as follows:
where C represents the total carbon emission; Ei is the energy consumption of the ith-type fossil energy; Fi is the standard coal coefficient of the i-type fossil energy; Ki is the carbon emission coefficient of the i-class fossil energy. The carbon emission coefficient comes from the default value of the IPCC carbon emission calculation guide, and the standard discount coal coefficient comes from the 2017 China Energy Statistical Yearbook. Referring to most studies [20,21], we assume that electricity does not directly emit carbon. Excluding petroleum, liquid natural gas, we consider all types of fossil fuels as mentioned in the statistical reports (eight in total) to ensure more comprehensive and accurate results. The eight types of fossil fuels considered here include raw coal, coke, crude oil, fuel oil, gasoline, kerosene, diesel and natural gas.
3.2. The STIRPAT Model
The STIRPAT model is modified and expanded by York on the basis of the IPAT model [22]. Multiple variables can be introduced to analyze the impact of different independent variables on environmental pressure. In its standard form, it is given by:
where I, P, A and T represent the environmental pressure, population, affluence and technological progress, respectively, a is the coefficient of the model, b, c and d are the driving indices of P, A and T respectively and is the random error terms. In order to facilitate the regression analysis to determine the parameters of the model, we take the logarithm of the model and get:
Previous literature provides guidelines for choosing variables to measure the above factors, see Table 1 below. Combined with the socio-economic factors and energy consumption of the YREB, this paper uses the total population size and the urbanization rate to express the population, per capita GDP, to measure wealth, energy intensity and the industrial structure to express technological progress and expands the model expansion (3) to arrive at model (4).
3.3. Data
In this work, data is derived from the following sources: The China Statistical, City Statistical and Provincial Statistical Yearbooks from 2006–2017. Missing data were calculated by interpolation of the adjacent year.
4. Spatiotemporal Differences of Carbon Emissions in the YREB
4.1. The Temporal Evolution of Carbon Emissions
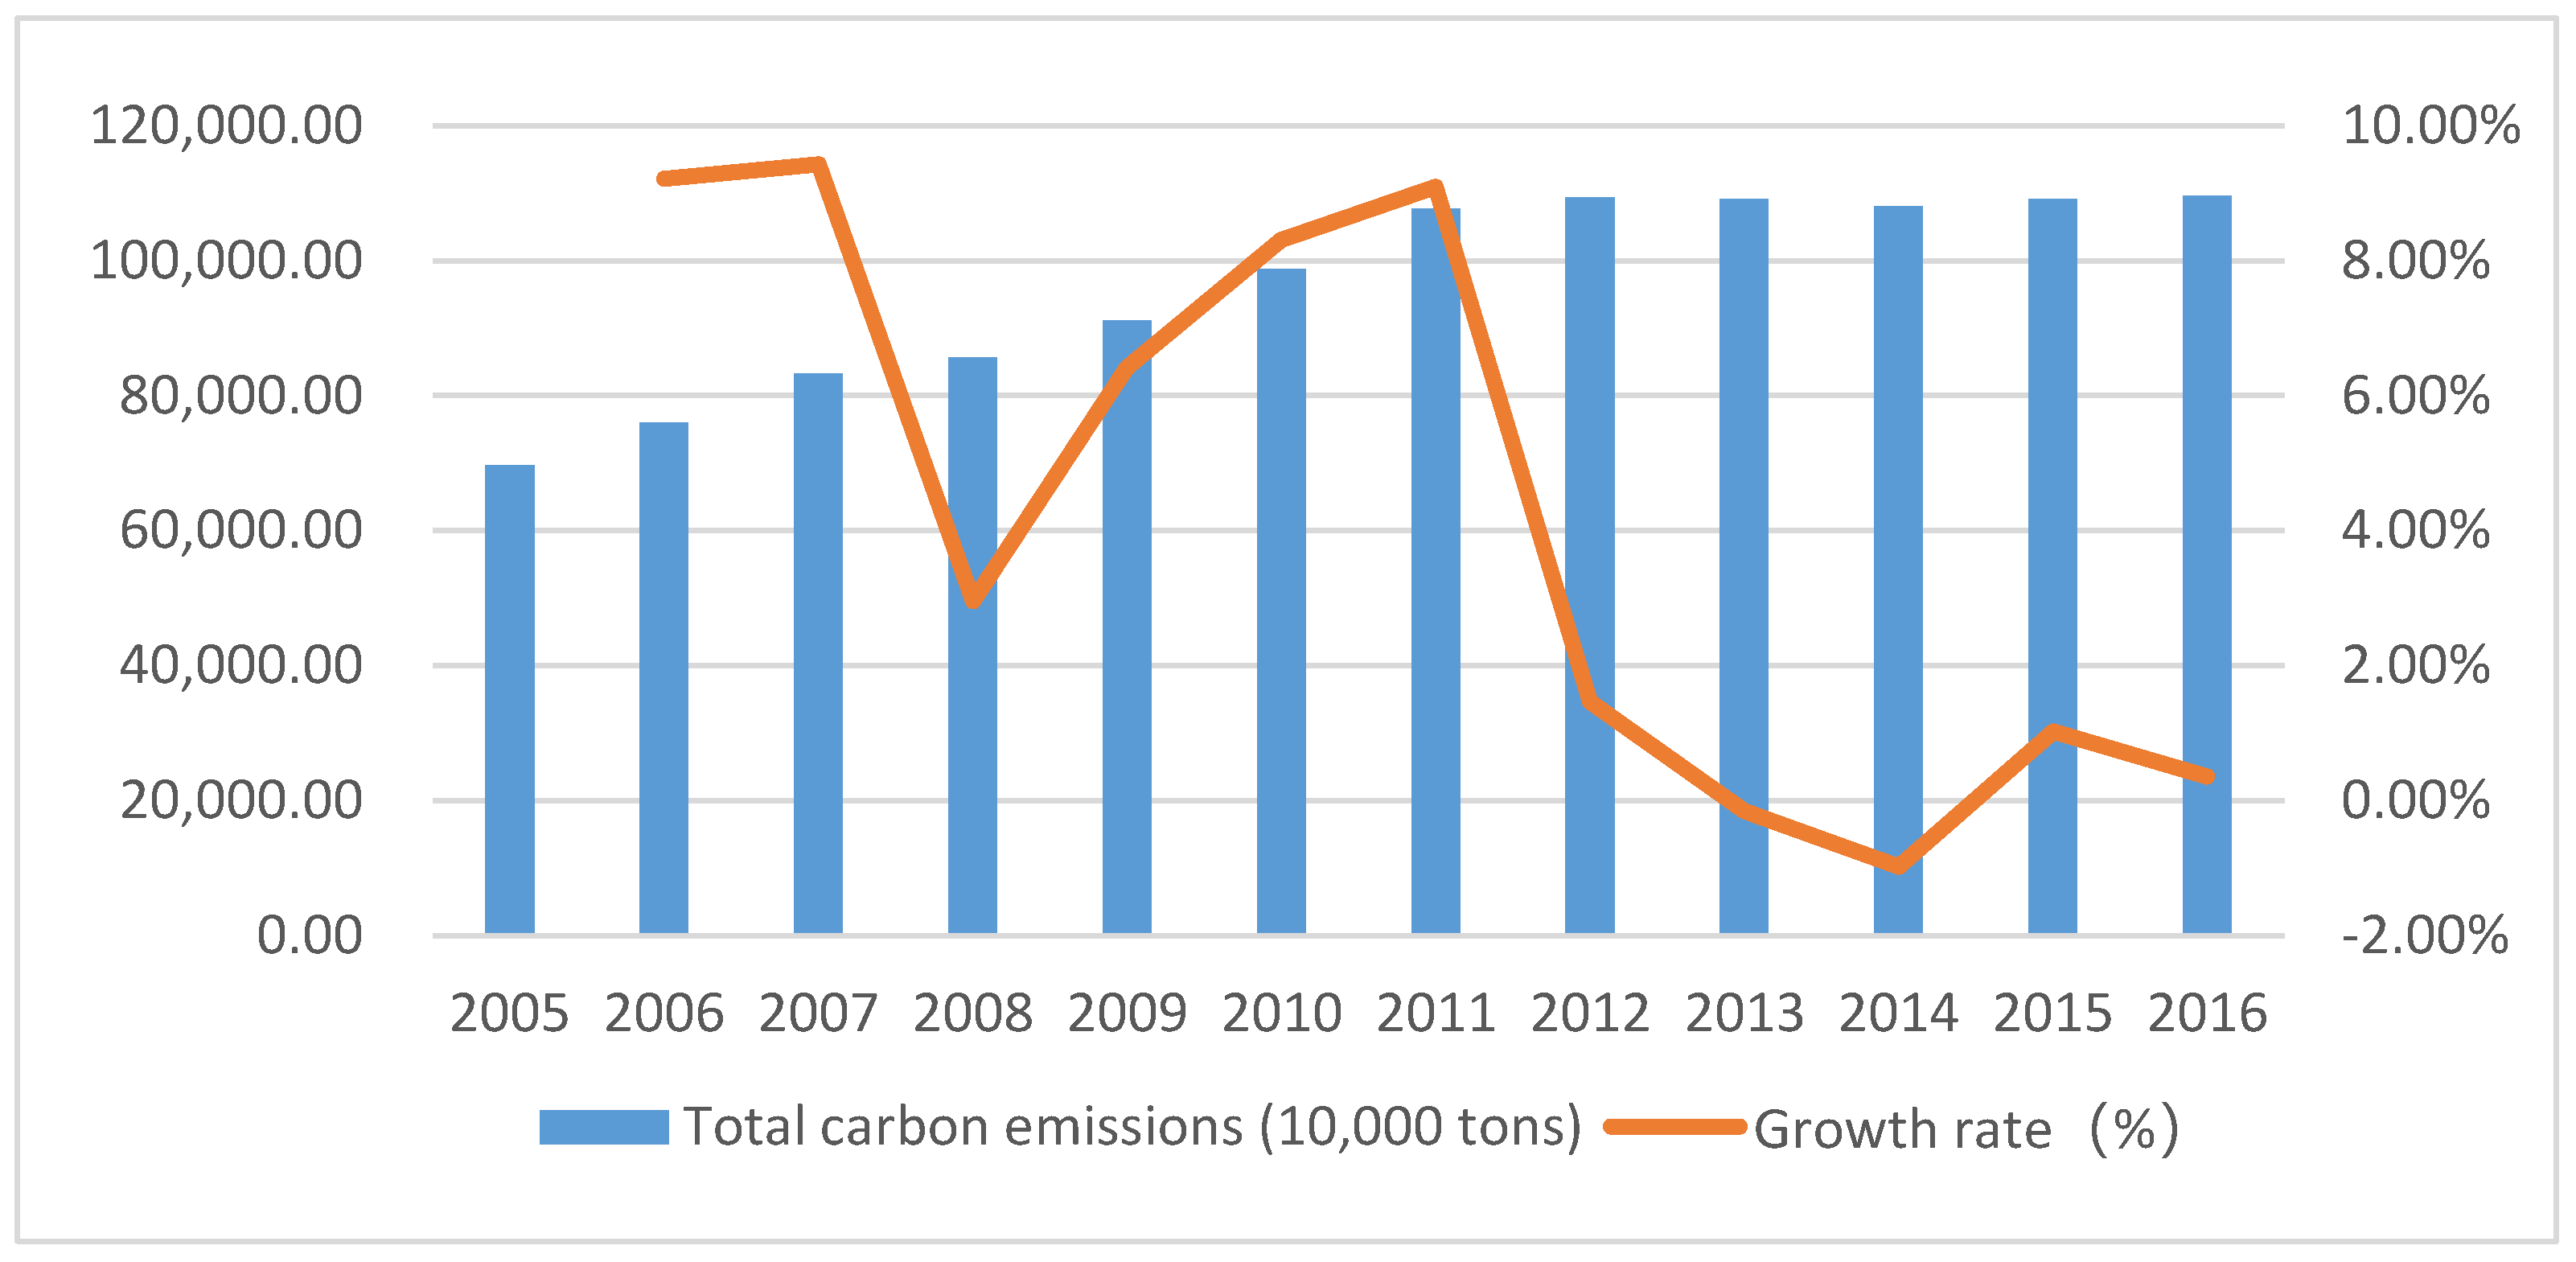
As can be seen from Figure 1, the carbon emission of the YREB generally showed a continuous increasing trend from 2005 to 2016, with the carbon emission increasing from approximately 700,000 tons to just over a million tons. However, it decreased slightly compared with the same period in 2013 and 2014. The growth rate of carbon emissions in the YREB is basically positive. In 2007, carbon emission growth rates peaked. In 2013 and 2014, the growth rate was negative and fell to the lowest value.
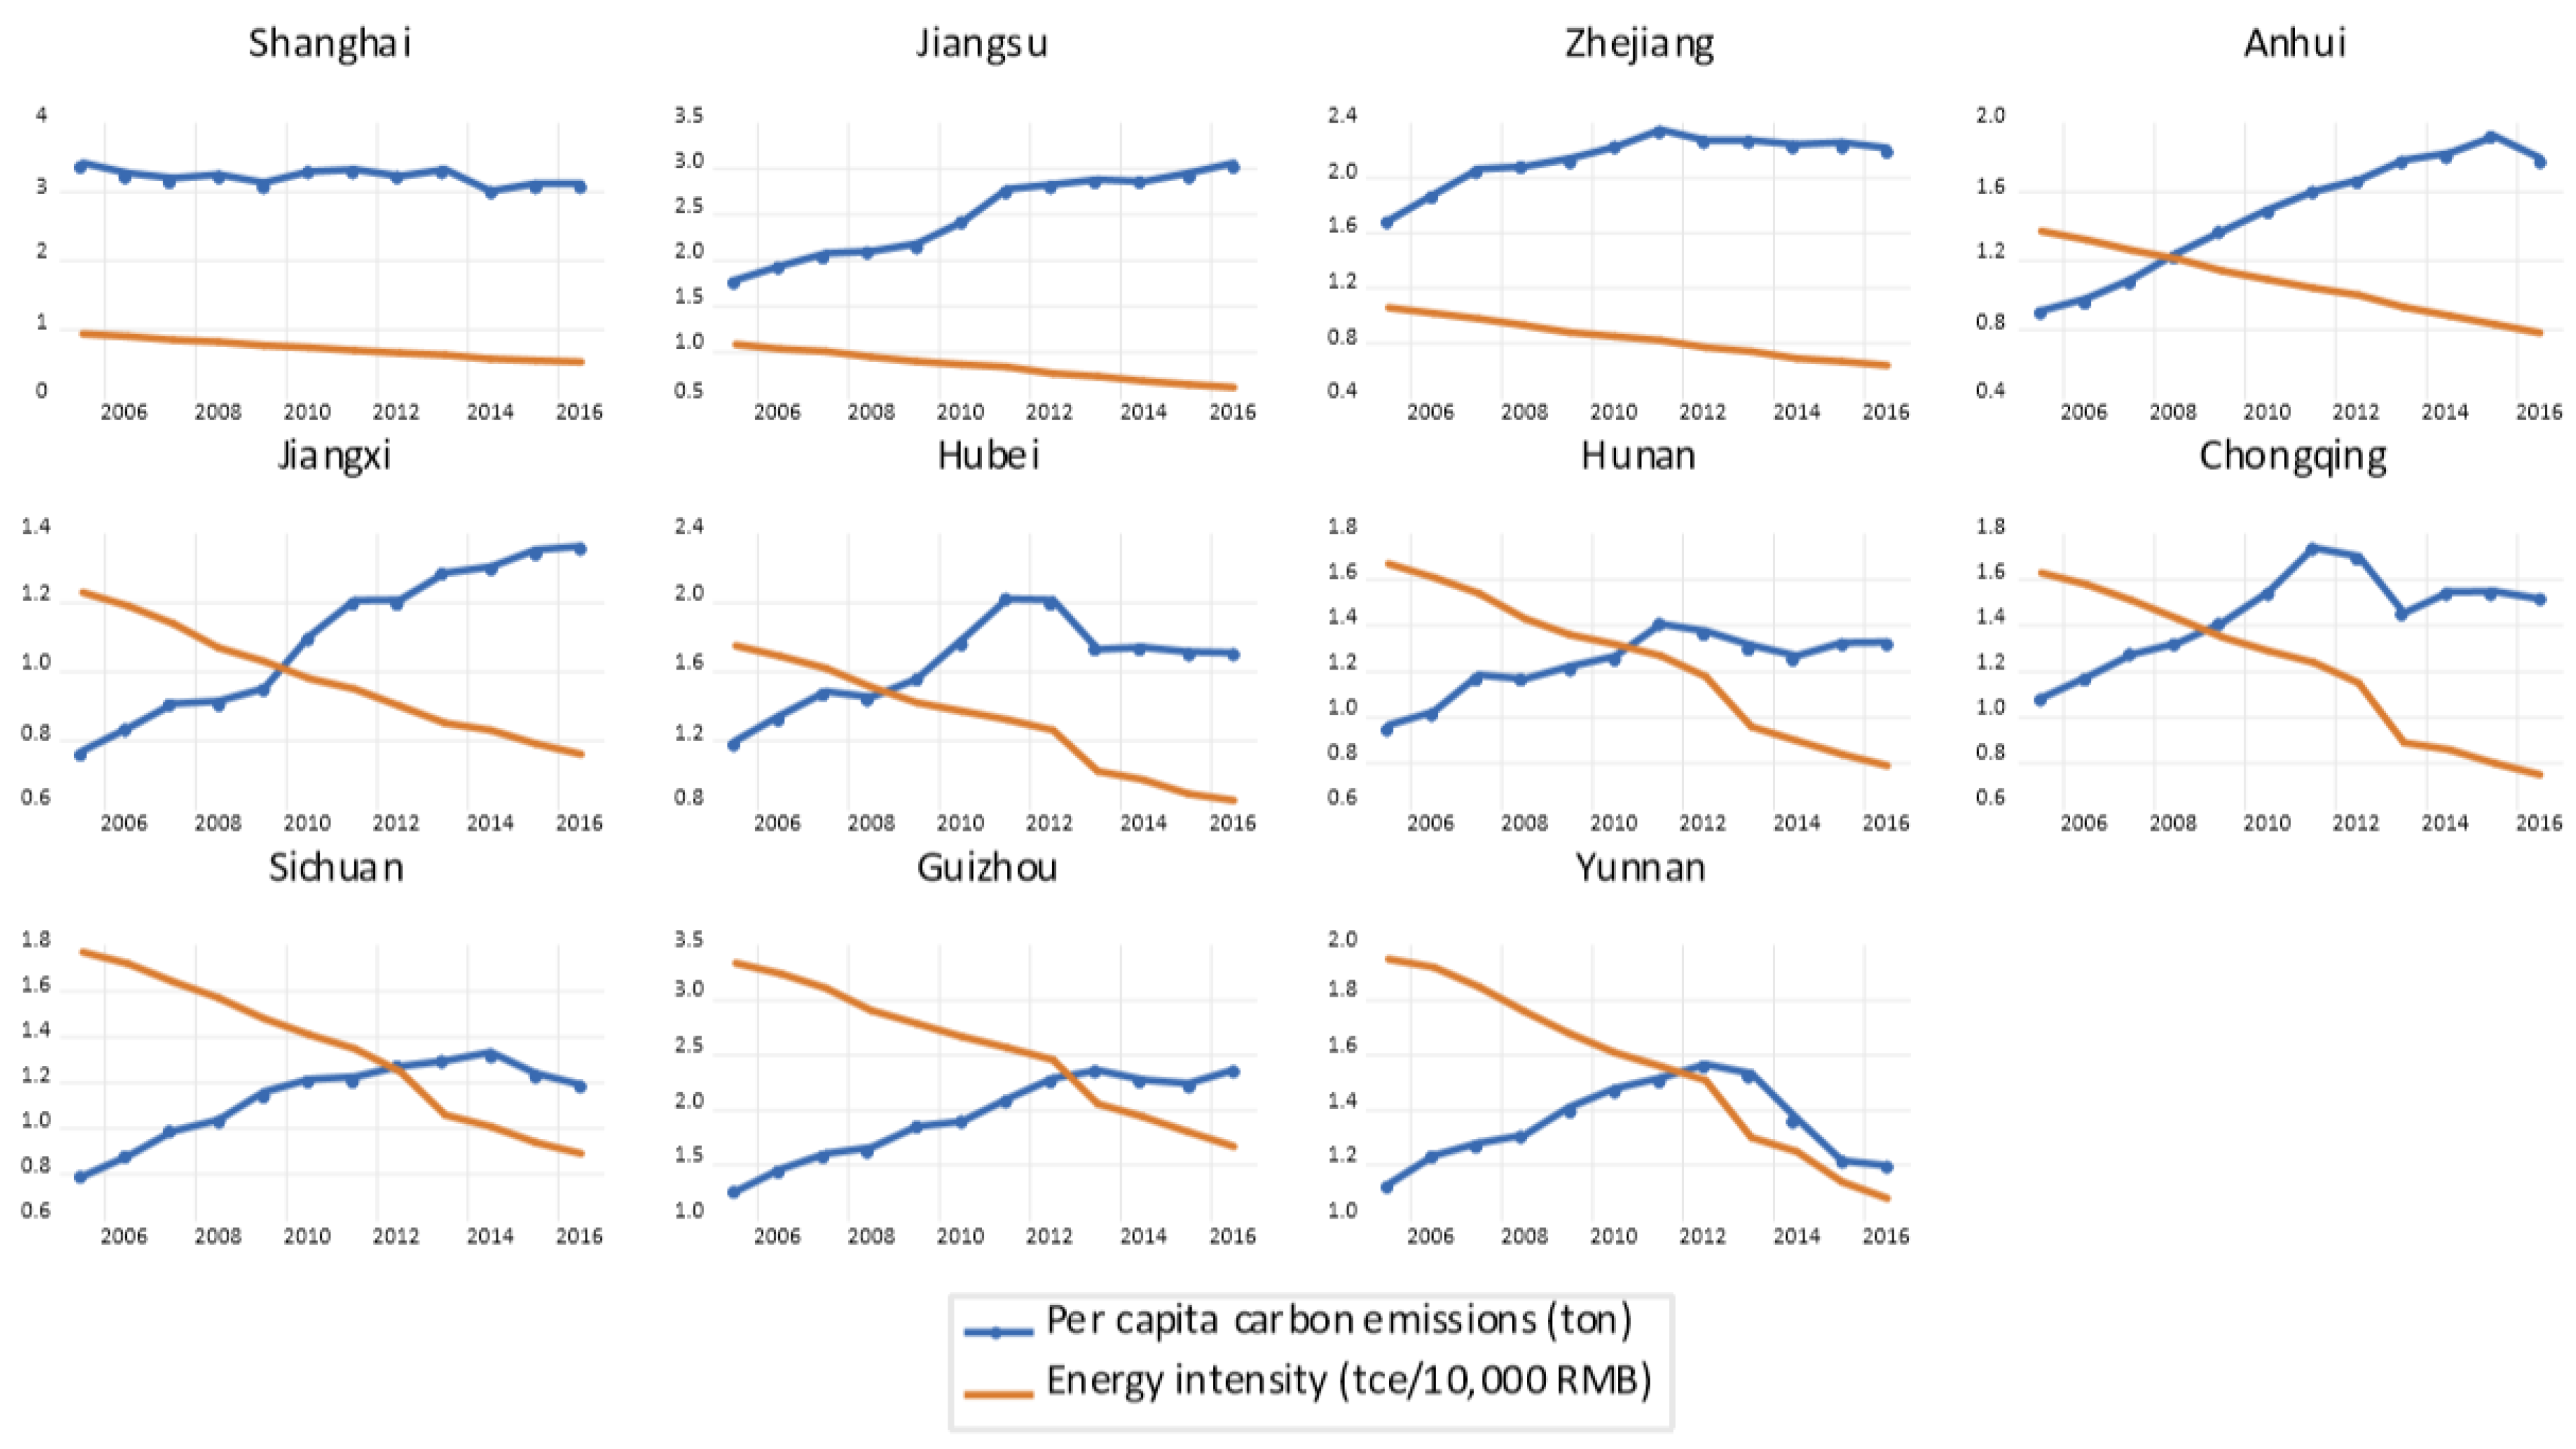
As can be seen in Figure 2, in terms of per capita carbon emissions, the YREB in 2005–2016 showed a downward trend. Among them, Shanghai’s per capita carbon emissions are generally stable and much higher than those of other provinces and municipalities. The per capita carbon emissions of Jiangsu, Zhejiang, Anhui, Jiangxi and Guizhou are generally on the rise. The per capita carbon emission growth rate of Anhui province is the highest, which increased by 97.2% from 2005 to 2016. Per capita carbon emissions in Hubei, Hunan, Chongqing, Sichuan, and Yunnan all showed a trend of increasing first and then decreasing, with the turning point between these two trends happening in 2011. From the perspective of energy intensity, the YREB in 2005–2016 shows a decreasing trend, the energy intensity has a significant downward trend, and the rate of decline in the energy intensity is greater than the growth rate of carbon emissions.
4.2. The Spatial Evolution of Carbon Emissions
From our analysis, we can see that economic development in the upper, middle and lower regions of the YREB is inhomogeneous, showing significant regional differences. Generally, over the 2005–2016 period the carbon emissions in the downstream areas are larger than in those which lie upstream, while over the same period, upstream carbon emissions are higher than midstream emissions. As can be seen in Table 2 and Figure 3, the proportion of carbon emissions in the downstream regions has remained above 40%. The reason for this is that the region has good techno-economic foundations, a high-quality labor force, dense population, an elevated level of urbanization, well developed secondary and tertiary industries, all of which result in an elevated level of primary energy consumption. We can also see that the proportion of carbon emission in downstream provinces and municipalities decreased during the 2005–2009 period, where, by contrast, carbon emission has shown a relatively slow upwards trend in the 2009–2016 period. This is closely related to the inward and outward transfer of industries in this region, as well as the formation of regional interactive development patterns in Shanghai, Jiangsu, Anhui and Zhejiang. In strong contrast to the downstream regions, the up- and midstream areas have significantly weaker economic, technology and industrial bases. Furthermore, the level of primary energy consumption is also much lower. Although the proportion of carbon emissions showed a slight upward trend during the period of 2005–2010 in up- and midstream provinces and municipalities, carbon emission proportions nevertheless displayed a downward trend in the 2010–2016 period. This trend is hypothesized to be related to those regions shifting from initial stages to more advanced ones, and gradually placing greater importance on green industrial development and reasonable usage of ecological factors to develop tourism and a local pharmaceutical industry.
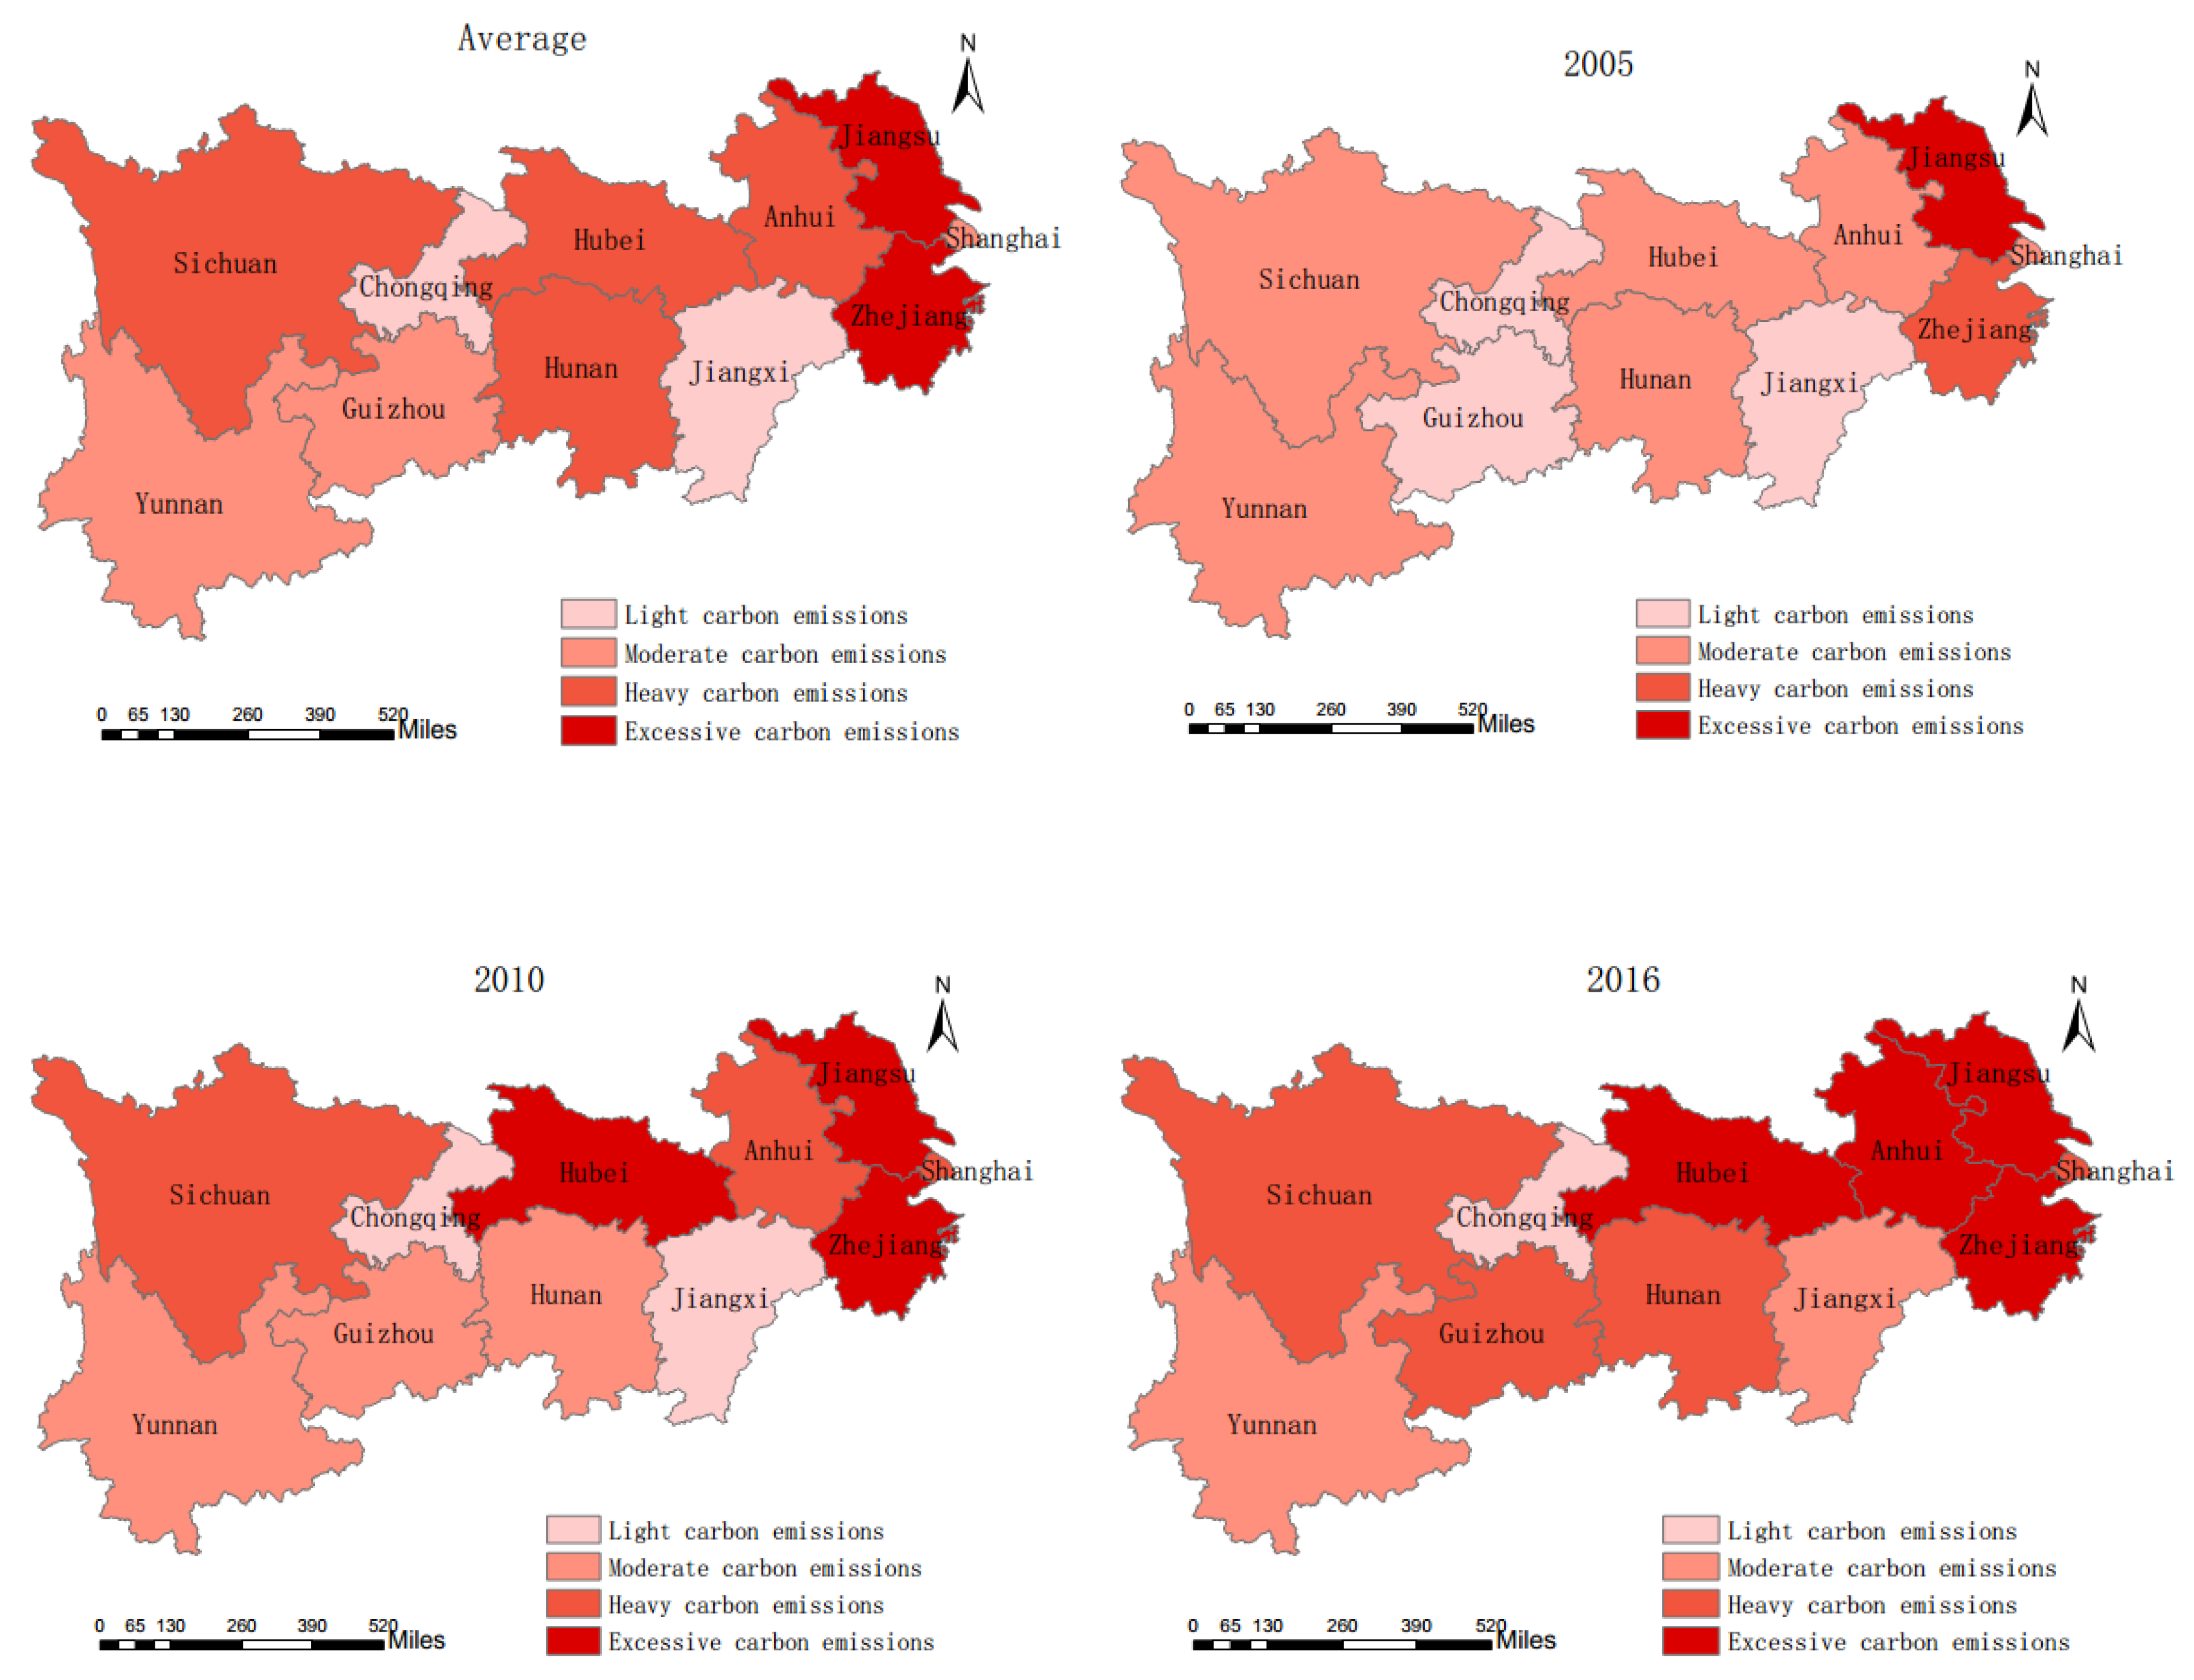
Based on carbon emission characteristics of the 11 provinces and municipalities of the YREB, we subdivided these areas following a classification standard, see Table 3, and provided four carbon emission scales (light, moderate, heavy, and excessive carbon emissions). Shown in Figure 4, Jiangsu and Zhejiang were characterized as excess and heavy carbon emission areas, respectively, during 2005. Shanghai, Anhui, Jiangxi, Hunan, Sichuan, and Yunnan were moderate carbon emission areas while Hubei, Chongqing, and Guizhou were light carbon emission areas for the same period. In 2010, Jiangsu, Zhejiang and Hubei provinces were classified as excess carbon emission areas; Shanghai, Anhui and Sichuan were heavy carbon emission areas; Hunan, Guizhou and Yunnan were moderate carbon emission areas; Hubei and Chongqing were light carbon emission areas. In 2016, the excess carbon emission areas were Jiangsu, Zhejiang, Anhui and Hubei; heavy carbon emission areas included Shanghai, Hunan, Guizhou and Sichuan; Jiangxi and Yunnan were moderate carbon emission areas; only Chongqing was a light carbon emission area. Compared with 2005, the number of excessive and heavy carbon emission areas in 2016 each increased by three, general carbon emission areas were reduced by four, and light carbon emission areas were reduced by two. Through the above analysis, it is not difficult to find that in the overall economic development of the YREB and the increase in primary energy consumption, the carbon emissions of 11 provinces and municipalities are increasing, especially for the provinces and municipalities with excessive and heavy carbon emissions, the number of which has risen from two provinces and municipalities in 2005 to eight in 2016. It is evident that the carbon emission pattern of the YREB changed significantly during 2005–2016.
5. Results and Discussion
5.1. Analysis of the Driving Factors Based on STIRPAT Model
In this paper, we first establish an individual fixed-effect model based on the results of an F-test and Hausman-test, we also test the heteroscedasticity and cross-section correlation of the model. The results are displayed in Table 4. We see that the P value of the Lagrange muitiplier test rejects the null hypothesis of “no cross-section correlation” at the 1% significance level and the P value of the Likelihood ratio test rejects the null hypothesis of “individual homoscedasticity” at the 1% significance level. Furthermore, the null hypothesis of “time-point homoscedasticity” cannot be rejected at the 5% significance level, which indicates that there is individual heteroscedasticity in the random perturbation term of the regression model. There is also a cross-section related to the same period. Therefore, the weights are set in the form of individual heteroscedasticity so that we can perform a generalized least squares estimation, and the white component weighting method is used to calculate the coefficient standard deviation.
Eviews 10.0 software was used to calculate the total carbon emissions and six impact factors of 11 provinces and municipalities in the YREB from 2005 to 2016 based on Equation (4). Regression analysis results are shown in Table 5. The population size, per capita GDP, the industrial structure (proportion of secondary industry and tertiary industry) and energy intensity have a significant positive correlation with carbon emissions in the YREB, with elasticity coefficients of 0.3555, 1.1183, 0.324, 0.1766 and 1.0512, then for every 1% increase in these factors, carbon emissions will increase by 0.3555%, 1.1183%, 0.324%, 0.1766% and 1.0512%. Among them, per capita GDP contributes the most in increasing the carbon emissions and energy intensity. The population size and the industrial structure generally display positive effects on carbon emissions, but the effects are weaker than that of per capita GDP. There is a significant negative correlation between the urbanization rate and carbon emission in the YREB. The elasticity coefficient of the urbanization rate is −0.5841, which demonstrates that for every 1% increase in the urbanization rate, carbon emissions will be reduced by 0.5841%; therefore, the urbanization rate plays an inhibiting role in carbon emissions. Moreover, the elasticity coefficient of per capita GDP and energy intensity exceeds 1, indicating that carbon emissions are highly sensitive to per capita GDP and energy intensity.
5.2. Discussion
We discusses the test results of the subject research and the data obtained in other similar studies. The results are shown in Table 6.
(1) The Population Size and Carbon Emissions
The population size is a crucial factor in determining the energy demand, which is consistent with a general theoretical expectation. Some scholars have found in their studies on China’s energy carbon emissions that population size is always the main contributor to the carbon emission increment [18,29]. Fan studied the carbon emissions of Beijing’s transportation industry and found that population size is a positive driver of carbon emissions [30]. In Nejat’s study, population is the main driving factor of residential energy consumption growth in developing countries [31]. In Shuai’s study, the impact of population size on CO2 emissions varies in countries with different income levels, and population size has the greatest impact on carbon emissions in low-income countries [14]. As the region with the highest carbon emissions in the YREB, the Yangtze River Delta (YRD) has a relatively high population growth and migration rate. Living consumption, transportation and industrial production are accompanied by high energy consumption, leading to the increase of carbon emissions.
(2) The Urbanization Rate and Carbon Emissions
Some scholars find that urbanization promotes CO2 emissions in countries with different income levels [12]. In Liddle’s study, the urbanization rate helps to reduce per capita road energy use [32]. Many scholars have also found that the urbanization rate has an inhibitory effect on carbon emissions in China [14,33], where urban road density, traffic coupling coefficient and other traffic factors also have a significant negative impact on the carbon emission levels [34]. Moreover, a compact urban development model helps reduce carbon emissions, and urbanization brings the scale effect of public infrastructure [26], which can effectively reduce energy waste, reduce per capita energy consumption and reduce carbon emissions. Simultaneously, urbanization brings cleaner and more modern technologies, thereby increasing energy efficiency and reducing carbon emissions. The YRD has an elevated level of economic development compared to that of the rest of China and the scale effect of public infrastructure in the processes of urbanization is fully utilized and more attention is paid to environmental protection, which, in turn, reduces carbon emissions to a certain extent.
(3) Per Capita GDP and Carbon Emissions
Most studies believe that economic development will increase carbon emissions, and it has the greatest impact on carbon emissions in low-income countries [12,14]. Between 2005 and 2016, the economic growth rate of China ranged from 6.7 to 14.24, with a sharp increase in per capita income leading to an increase in demand for energy products and an increase in carbon emissions. Many scholars’ studies on China show that economic output or per capita GDP contributes the most to carbon emissions [2,4,36]. Wiedenhofer’s research on the carbon footprint of Chinese households found that the consumption growth of urban middle class and wealthy people are the main sources of carbon emissions growth [37]. Per capita GDP is an important indicator to measure regional economies and represents the consumption capacity of residents. The spatial distribution of per capita GDP and carbon emissions in the YREB are generally consistent, with a decreasing trend from the eastern coastal regions to the central and western inland. The carbon emissions of the YRD urban agglomeration, the middle regions of the Yangtze River, and the Chengdu-Chongqing urban agglomeration are significantly higher. It is closely related to its elevated level of economic development and carbon-intensive consumption patterns and lifestyles.
(4) The Industrial Structure and Carbon Emissions
Generally, the secondary industry is more energy intensive than the first and tertiary industries. In Shuai and Ma’s study, the secondary industry and tertiary industries are both positive factors for increasing carbon emissions [9,35]. Presently, most of China’s regions are still in the process of industrialization, which might be an unfavorable factor for improving their energy and CO2 emissions’ performances. Carbon emissions come mainly from industries of electricity production, oil processing, coking, metal smelting and chemical manufacturing industries [29]. Driving by their respective economic situations and national policies, interregional industry upgrades and transfers, the middle and lower regions of the YREB have differences in economic output, energy intensity and the industrial structure. Due to the impact of the industrial structure and energy consumption policies, the overall situation is still dominated by the secondary industry, with the highest level of carbon emissions. The proportion of the secondary industry in the YREB is significantly higher than that of other provinces and municipalities.
(5) Energy Intensity and Carbon Emissions
Most studies identify that energy intensity will increase carbon emissions, and energy intensity has a lower impact on carbon emissions in low-income countries than in middle-and high-income countries [14]. Domestic scholars have found that the reduction of carbon emission intensity and the optimization of the final energy consumption structure have a significant inhibitory effect on carbon emissions [2]. In the research on carbon emissions of the transportation industry and chemical industry, energy intensity has been shown as the main positive driver [3,30]. However, there are also findings that are in contrast to this; some studies indicated that energy intensity and R&D intensity are the leading contributors to the reduction in industrial CO2 emission intensity, and energy intensity is the dominant negative driving factor of CO2 emissions [4,38]. As one of the regions with the strongest comprehensive strength in China, the YREB continues to transform and upgrade the industry with technological innovation. However, many high-energy industrial enterprises and labor-intensive enterprises lack clean technology, and the energy consumption per unit of output value is still large.
6. Conclusions
This paper analyzed the spatiotemporal differences of carbon and probed the driving factors of carbon emissions in the YREB. Moreover, based on the STIRPAT model, we empirically test the factors affecting the carbon emissions of the YREB. The main findings are as follows. First, per capita GDP, the industrial structure and energy intensity have a positive driving effect on the increase of carbon emissions, while the urbanization rate has a negative driving effect on carbon emissions. Second, per capita GDP and energy intensity have the largest impact on the increase of carbon emissions, and the urbanization rate has the largest inhibitory effect on carbon emissions. On the premise of ensuring sustained and steady economic growth in the YREB, it is important to promote the urbanization process and reduce energy intensity. Based on the above research results, this paper proposes to achieve the carbon emission reduction target of the YREB through the following policy approaches:
(1) Optimize Industrial Layout and Upgrade the Industrial Structure
As we have seen in this work, there are disparities in the economic development level, natural resources and geographical conditions of the upper, middle and lower regions of YREB. It is thus necessary to clarify the division of labor and cooperation between regions to optimize the industrial layout and use technological changes to promote the upgrade of the industrial structure. Specifically, it is essential to take advantage of the characteristics of the vast maneuvering room of the YREB, guide downstream industries to move to the upstream and middle regions, which would allow these industries to harness the full economic and scientific advantage of the YRD cities, and drive the middle- and lower-reach municipalities to accelerate the transformation of economic development mode and realize regional balanced and coordinated development of industries. Simultaneously, we should encourage the development of service, high-tech and low-carbon, environmentally protective industries, in addition to encourage innovative, modern technologies to transform traditional industries, aiding in the transfer and expansion of technology patents. Problems concerning the duplication of low-level industries should be rectified and the problem of low-level industrial duplication and regional industrial structure convergence should be actively solved. We must also vigorously limit the rapid growth of energy-intensive and pollutant-intensive manufacturing industries, phase out inefficient manufacturing, and accelerate the transformation and upgrading of industrial and production structures.
(2) Regulate Enterprise Emissions and Optimize Energy Structure
In the short-term, the currently coal-based energy consumption structure of the YREB will be difficult to change. It is suggested that, based on local needs, it is necessary to formulate energy consumption requirements and emission reduction targets, while focusing on the optimization and upgrading of energy consumption structure. Regulation of corporate emissions can be strengthened, with the addition of fiscal policies such as taxation and subsidies to encourage industrial enterprises to develop low-carbon technologies and allow for the introduction of advanced foreign clean energy technologies. We should build a diversified, safe, clean and efficient energy supply and consumption system and minimize the share of coal in the primary energy use structure. We can also deepen the processing of fossil fuels, improve energy use efficiency and clean energy market competitiveness, support the further development of innovative energy technologies, improve the utilization of clean energy such as hydropower and natural gas in the middle and upper regions of the lower regions, gradually increase the proportion of renewable energy in the entire basin, thereby gradually reducing fossil fuel dependence.
(3) Develop Ecological Cities and Advocate Low-Carbon Life
As population size and per capita income are the crucial factors that affect YREB carbon emissions, changing household lifestyles and consumer behavior may have an impact on reducing these emissions. One solution is to formulate a population development plan where populations are matched to available resources and the environmental carrying capacity, actively cultivate a healthy low-carbon consumption culture, improve the social recognition of green and healthy lifestyles and consumption patterns through advertisement and education. Another solution, perhaps working in tandem with the first solution, is to follow the development model of low-carbon eco-city, establish low-carbon demonstration zones, communities and school/university campuses, optimize urban energy consumption structure, control the excessive growth of private cars. We can also encourage real estate developers to engage in green construction, actively develop green product manufacturing and waste recycling technologies, and strive to reduce carbon emissions in residential, transportation, communications and waste disposal sectors. Small towns are the driving force for China’s urbanization development. Therefore, we must pay attention to the development of these small towns, provide financial subsidies for new forms of energy, and encourage them to move toward recycling and low-carbon development.
Author Contributions
D.T., Y.Z. and B.J.B. contributed equally to this work. D.T., Y.Z. and B.J.B. read and approved the final manuscript.
Funding
This research was funded by The Open Fund of the Institute of Climate Change and Public Policy, Nanjing University of Information Science and Technology, P.R. China grant number 18QHA015 and The Open Fund of the China Institute of Manufacturing Development, Nanjing University of Information Science and Technology, P.R. China grant number SK20180090-14.
Acknowledgments
We thank the editor and reviewers for careful review and insightful comments. We would like to thank Brandon J. Bethel for his contributions in polishing the language and content of the paper.
Conflicts of Interest
The authors declare no conflict of interest.
References
- De Freitas, L.C.; Kaneko, S. Decomposing the decoupling of CO2 emissions and economic growth in Brazil. Ecol. Econ. 2011, 70, 1459–1469. [Google Scholar] [CrossRef]
- Zhang, Y.J.; Da, Y.B. The decomposition of energy-related carbon emission and its decoupling with economic growth in China. Renew. Sustain. Energy Rev. 2015, 41, 1255–1266. [Google Scholar] [CrossRef]
- Xu, B.; Lin, B.Q. Assessing CO2 emissions in China’s iron and steel industry: A dynamic vector autoregression model. Appl. Energy 2016, 161, 375–386. [Google Scholar] [CrossRef]
- Wang, M.; Feng, C. Decomposition of energy-related CO2 emissions in China. An empirical analysis based on provincial panel data of three sectors. Appl. Energy 2017, 190, 772–787. [Google Scholar] [CrossRef]
- Zhang, W.; Li, K.; Zhou, D.Q.; Zhang, W.; Gao, H. Decomposition of intensity of energy-related CO2 emission in Chinese provinces using the LMDI method. Energy Policy 2016, 92, 369–381. [Google Scholar] [CrossRef]
- Shao, S.; Yang, L.L.; Gan, C.H.; Cao, J.H.; Geng, Y.; Guan, D.B. Using an extended LMDI model to explore techno-economic drivers of energy-related industrial CO2 emission changes. A case study for Shanghai (China). Renew. Sustain. Energy Rev. 2016, 55, 516–536. [Google Scholar] [CrossRef]
- Wang, Z.H.; Yang, L. Delinking indicators on regional industry development and carbon emissions. Beijing-Tianjin-Hebei economic band case. Ecol. Indic. 2015, 48, 41–48. [Google Scholar] [CrossRef]
- Ehrlich, P.R.; Holdren, J.P. Impact of population growth. Science 1971, 171, 1212–1217. [Google Scholar] [CrossRef] [PubMed]
- Shuai, C.Y.; Song, X.N.; Li, S.P. Critical impact factors affecting carbon emission: Evidence from stirpat model with panel data analysis. In Proceedings of the 21st International Symposium on Advancement of Construction Management and Real Estate; Chau, K., Chan, I., Lu, W., Webster, C., Eds.; Springer: Singapore, 2018; pp. 577–583. [Google Scholar]
- Singh, M.K.; Mukherjee, D. Drivers of greenhouse gas emissions in the United States: Revisiting STIRPAT model. Environ. Dev. Sustain. 2018, 1–17. [Google Scholar] [CrossRef]
- Liddle, B.; Lung, S. Age-structure, urbanization and climate change in developed countries, revisiting STIRPAT for disaggregated population and consumption-related environmental impacts. Popul. Environ. 2010, 31, 317–343. [Google Scholar] [CrossRef]
- Yuan, R.; Zhao, T.; Xu, X.; Kang, J. Regional characteristics of impact factors for energy-related CO2 emissions in China, 1997–2010: Evidence from tests for threshold effects based on the STIRPAT mode. Environ. Model Assess. 2015, 20, 129–144. [Google Scholar] [CrossRef]
- Li, W.W.; Wang, W.P.; Wang, Y.; Qin, Y.B. Industrial structure, technological progress and CO2 emissions in China. Analysis based on the STIRPAT framework. Nat. Hazards 2017, 88, 1545–1564. [Google Scholar] [CrossRef]
- Shuai, C.Y.; Chen, X.; Wu, Y. Identifying the key impact factors of carbon emission in China. Results from a largely expanded pool of potential impact factors. J. Clean. Prod. 2018, 175, 612–623. [Google Scholar] [CrossRef]
- Zhang, G.L.; Zhang, N.; Liao, W.M. How do population and land urbanization affect CO2 emissions under gravity center change? A spatial econometric analysis. J. Clean. Prod. 2018, 202, 510–523. [Google Scholar] [CrossRef]
- He, Z.X.; Xu, S.C.; Shen, W.X.; Long, R.Y.; Chen, H. Impact of urbanization on energy related CO2 emission at different development levels. Regional difference in China based on panel estimation. J. Clean. Prod. 2017, 140, 1719–1730. [Google Scholar] [CrossRef]
- Pan, Y.; Zhu, J.Y.; Ye, Y. Analysis of the driving factors of carbon emissions in Jiangsu Province based on STIRPAT Model. J. Environ. Pollut. Prev. 2014, 36, 104–109. [Google Scholar]
- Wang, C.J.; Wang, F.; Zhang, X.L.; Yang, Y.; Su, Y.X.; Ye, Y.Y.; Zhang, H.G. Examining the driving factors of energy related carbon emissions using the extended STIRPAT model based on IPAT identity in Xinjiang. Renew. Sustain. Energy Rev. 2017, 67, 51–61. [Google Scholar] [CrossRef]
- Chen, Z.M.; Wu, S.M.; Ma, W.B.; Liu, X.M.; Cai, B.F. Analysis of factors affecting CO2 emissions in cities above prefecture level in China based on the extended STIRPAT model. China Popul. Resour. Environ. 2018, 28, 45–54. [Google Scholar]
- Li, Q.; Zuo, J.X. Peak prediction of carbon emission in the YREB based on STIRPAT model. J. Northeast Agric. Univ. (Soc. Sci. Ed.) 2017, 5, 53–58. [Google Scholar]
- Wang, P.; Wu, W.; Zhu, B.; Wei, M. Examining the impact factors of energy-related CO2 emissions using the STIRPAT model in Guangdong Province. Appl. Energy 2013, 106, 65–71. [Google Scholar] [CrossRef]
- York, R.; Rosa, E.A.; Dietz, T. STIRPAT, IPAT and IMPACT: Analytic tools for unpacking the driving forces of environmental impacts. Ecol. Econ. 2003, 46, 351–365. [Google Scholar] [CrossRef]
- Marland, G.; Boden, T.A.; Andres, R.J. Global, regional, and national CO2 emissions. In Trends: A Compendium of Data on Global Change; Marland, G., Boden, T.A., Andres, R.J., Eds.; Carbon Dioxide Information Analysis Center, Oak Ridge National Laboratory, U.S. Department of Energy: Oak Ridge, TN, USA, 2007. [Google Scholar]
- Dietz, T.; Rosa, E.A. Effects of population and affluence on CO2 emission. Proc. Natl. Acad. Sci. USA 1997, 94, 175–179. [Google Scholar] [CrossRef]
- Castellano, R.; Laureti, T.; Regoli, A. Estimating the effects of road transportation on environmental quality, environmental engineering & management. EEMJ 2010, 9, 1151–1160. [Google Scholar]
- Lee, S.; Lee, B. The influence of urban form on GHG emissions in the US household sector. Energy Policy 2014, 68, 534–549. [Google Scholar] [CrossRef]
- Heston, A.; Summers, R.; Aten, B. Penn World Table Version 6.2; Center for International Comparisons, University of Pennsylvania: Philadelphia, PA, USA, 2006. [Google Scholar]
- Shahbaz, M.; Solarin, S.A.; Sbia, R.; Bibi, S. Does energy intensity contribute to CO2 emissions? A trivariate analysis in selected African countries. Ecol. Indic. 2015, 50, 215–224. [Google Scholar] [CrossRef]
- Xu, S.C.; He, Z.X.; Long, R.Y. Factors that influence carbon emissions due to energy consumption in China. Decomposition analysis using LMDI. Appl. Energy 2014, 127, 182–193. [Google Scholar] [CrossRef]
- Fan, F.Y.; Lei, Y.L. Decomposition analysis of energy-related carbon emissions from the transportation sector in Beijing. Transp. Res. Part D Transp. Environ. 2016, 42, 135–145. [Google Scholar] [CrossRef] [Green Version]
- Payam, N.; Fatemeh, J.; Mohammad, M.T.; Mohammad, G.; Muhd, Z.A.M. A global review of energy consumption, CO2 emissions and policy in the residential sector (with an overview of the top ten CO2 emitting countries). Renew. Sustain. Energy Rev. 2015, 43, 843–862. [Google Scholar]
- Brant, L. Demographic dynamics and per capita environmental impact: Using panel regressions and household decompositions to examine population and transport. Popul. Environ. 2004, 26, 23–39. [Google Scholar]
- Lin, B.Q.; Du, K.R. Energy and CO2 emissions performance in China’s regional economies: Do market-oriented reforms matter? Energy Policy 2015, 78, 113–124. [Google Scholar] [CrossRef]
- Wang, S.J.; Liu, X.P.; Zhou, C.S.; Hu, J.C.; Ou, J.P. Examining the impacts of socioeconomic factors, urban form, and transportation networks on CO2 emissions in China’s megacities. Appl. Energy 2017, 185, 189–200. [Google Scholar] [CrossRef]
- Ma, M.D.; Yan, R.; Cai, W.G. An extended STIRPAT model-based methodology for evaluating the driving forces affecting carbon emissions in existing public building sector: Evidence from China in 2000–2015. Nat. Hazards 2017, 89, 741–756. [Google Scholar] [CrossRef]
- Li, A.J.; Zhang, A.Z.; Zhou, Y.X.; Yao, X. Decomposition analysis of factors affecting carbon dioxide emissions across provinces in China. J. Clean. Prod. 2017, 141, 1428–1444. [Google Scholar] [CrossRef]
- Wiedenhofer, D.; Guan, D.B.; Liu, Z.; Meng, J.; Zhang, N.; Wei, Y.-M. Unequal household carbon footprints in China. Nat. Clim. Chang. 2017, 7, 75–80. [Google Scholar] [CrossRef]
- Zhang, X.; Zhao, X.R.; Jiang, Z.J. How to achieve the 2030 CO2 emission-reduction targets for China’s industrial sector: Retrospective decomposition and prospective trajectories. Glob. Environ. Chang. Hum. Policy Dimens. 2017, 44, 83–97. [Google Scholar] [CrossRef]
Figure 1.
Growth trend of total carbon emission in the Yangtze River Economic Belt (YREB).

Figure 2.
Comparison of per capita carbon emission and energy intensity of 11 provinces and municipalities in the YREB.
Figure 2.
Comparison of per capita carbon emission and energy intensity of 11 provinces and municipalities in the YREB.

Figure 3.
Changes of carbon emission pattern in the middle and lower regions of YREB.

Figure 4.
Spatial distribution of carbon emissions in the YREB from 2005 to 2016.


Table 1.
Explanation variable meaning, its supporting reference and measurement method.
| Explanatory Variables | Supporting Reference | Measuring Method (Unit) |
|---|---|---|
| Carbon emissions (I) | Marland et al. (2007) [23] Freitas et al. (2011) [1] | Carbon emissions stemming from fossil fuel combustion (104 tons) |
| Population size (P) | Liddle (2010) [11] Dietz et al. (1997) [24] | Population of emission region (104 units) |
| Urbanization rate (U) | Castellano et al. (2010) [25] Lee et al. (2014) [26] | Urban population divided by total population (%) |
| Affluence (A) | Heston et al. (2006) [27] Singh et al. (2018) [10] | Gross domestic product divided by population (RMB, 2000 = 100) |
| Industrial structure (SI/TI) | York et al. (2003) [22] Li et al. (2017) [13] | Proportion of secondary industry and tertiary industry in total output (%) |
| Energy intensity (EI) | Shahbaz et al. (2015) [28] Xu et al. (2016) [3] | Energy consumption per unit GDP (tce/10,000 RMB) |
Table 2.
Upstream, midstream, downstream regions.
| Classification | Regions |
|---|---|
| Upstream | Shanghai, Jiangsu, Zhejiang, Anhui |
| Midstream | Jiangxi, Hubei, Hunan |
| Downstream | Jiangxi, Hubei, Hunan |
Table 3.
Classification standards of carbon emission types in the YREB.
| Type | Carbon Emission (10,000 Tons) |
|---|---|
| Light carbon emissions | <5000 |
| Moderate carbon emissions | 5000 and <7500 |
| Heavy carbon emissions | 7500 and <10,000 |
| Excessive carbon emission | 10,000 |
Table 4.
Results of model setting test, heteroscedasticity and cross-sectional correlation tests.
| Type | Methods | Statistic/Test Value | p-Value |
|---|---|---|---|
| Model setting | F-test | 106.56 | 0.0000 |
| Hausman-test | 4.21 | 0.0000 | |
| Section related | Breusch-Pagan Lagrange muitiplier | 160.452 | 0.0000 |
| Pesarah-Scaled Lagrange muitiplier | 10.0545 | 0.0000 | |
| Individual heteroscedasticity | Likelihood ratio | 156.9034 | 0.0000 |
| Heteroscedasticity at time points | Likelihood ratio | 8.0543 | 0.7084 |
Table 5.
Fixed effect regression results.
| Influencing Factors | Modulus of Elasticity | Standard Deviation | t-Value | p-Value |
|---|---|---|---|---|
| lnP *** | 0.3555 | 0.058 | 6.1303 | 0.0000 |
| lnU *** | −0.5841 | 0.0725 | −8.0576 | 0.0000 |
| lnA *** | 1.1183 | 0.0294 | 38.0196 | 0.0000 |
| lnSI *** | 0.3240 | 0.0858 | 3.7765 | 0.0003 |
| lnTI ** | 0.1766 | 0.0689 | 2.5637 | 0.0116 |
| lnEI *** | 1.0512 | 0.0315 | 33.3670 | 0.0000 |
| a *** | −4.9136 | 0.7002 | −7.0176 | 0.0000 |
| F test | F(10,114) = 20741.78, Prob > F = 0.0000 | |||
| R2 | 0.9997 | |||
| Adjusted R2 | 0.9996 132 | |||
| Observed quantity | ||||
Note: ***, ** represent the significant levels of 1% and 5%, respectively.
Table 6.
Elasticities values of carbon emissions with respect to changes in the population size, the urbanization rate, affluence, the industrial structure and energy intensity.
Table 6.
Elasticities values of carbon emissions with respect to changes in the population size, the urbanization rate, affluence, the industrial structure and energy intensity.
| Study/Data | Dependent Variable | Population Size | Urbanization Rate | Affluence | Industrial Structure | Energy Intensity |
|---|---|---|---|---|---|---|
| Shuai et al. [9], China, 19 Y | CE | 0.856 | −0.836 | 0.793 | 0.159(SI) | 0.521 |
| 0.351(TI) | ||||||
| Yuan et al. [12], China, 13 Y | CE | 0.362(AR) | 0.756(AR) | |||
| 0.218(HIR) | 0.344(HIR) | |||||
| 0.459(LIR) | 0.896(LIR) | |||||
| Chen et al. [14], 125 countries with 4 groups | COE | 0.768(HIR) | 0.664(HIR) | 0.904(HIR) | ||
| 0.562(UMIR) | 1.030(UMIR) | 0.910(UMIR) | ||||
| 0.605(LMIR) | 1.349(LMIR) | 0.918(LMIR) | ||||
| 0.787(LIR) | 1.133(LIR) | 0.295(LIR) | ||||
| Fan et al. [30], Beijing, 17 Y | CE from transportation | 1.654 | 3.345 | 0.967 | ||
| Liddle [32], 3 countries, 20 Y | Per capita road energy use | −0.00093 | −0.47 | 0.25 | ||
| Lin et al. [33], China, 12 Y | COE | −4.32 × 10⁻³ | −7.41× 10⁻³ | |||
| Ma et al. [35], China, 15 Y | CE from public buildings | 0.209 | 0.208 | 0.194(TI) |
Note: Y: Years, CE: Carbon emissions, COE: CO2 emissions, AR: All regions, HIR: High-income regions; LIR: Low-income regions; UMIR: Upper-middle-income regions, LMIR: Low-middle-income regions, SI: Tertiary industry, TI: Tertiary industry.
© 2019 by the authors. Licensee MDPI, Basel, Switzerland. This article is an open access article distributed under the terms and conditions of the Creative Commons Attribution (CC BY) license (http://creativecommons.org/licenses/by/4.0/).
Share and Cite
MDPI and ACS Style
Tang, D.; Zhang, Y.; Bethel, B.J. An Analysis of Disparities and Driving Factors of Carbon Emissions in the Yangtze River Economic Belt. Sustainability 2019, 11, 2362. https://doi.org/10.3390/su11082362
AMA Style
Tang D, Zhang Y, Bethel BJ. An Analysis of Disparities and Driving Factors of Carbon Emissions in the Yangtze River Economic Belt. Sustainability. 2019; 11(8):2362. https://doi.org/10.3390/su11082362
Chicago/Turabian StyleTang, Decai, Yan Zhang, and Brandon J. Bethel. 2019. "An Analysis of Disparities and Driving Factors of Carbon Emissions in the Yangtze River Economic Belt" Sustainability 11, no. 8: 2362. https://doi.org/10.3390/su11082362
Note that from the first issue of 2016, this journal uses article numbers instead of page numbers. See further details here.