A New Approach for Multifunctional Zoning of Territorial Space: The Panxi Area of the Upper Yangtze River in China Case Study


1
Institute of Mountain Hazards and Environment, Chinese Academy of Sciences, Chengdu 610041, China
2
Institute of Science and Technology Information, Guizhou Academy of Agricultural Sciences, Guiyang 550006, China
3
Sichuan Institute of Urban Planning and Design, Chengdu 610081, China
*
Authors to whom correspondence should be addressed.
Sustainability 2019, 11(8), 2325; https://doi.org/10.3390/su11082325
Submission received: 4 March 2019
/
Revised: 11 April 2019
/
Accepted: 16 April 2019
/
Published: 18 April 2019
Abstract
:Multifunctional zoning is the primary basis for developing differentiated spatial planning systems and management policies of territorial spaces. The purpose of the paper is to generate an integrated multifunctional zoning scheme of the territorial space in Panxi by employing the functional significance assessment funded on the niche theory and its measurement models, in order to benefit the high efficiency land utilization and other socioeconomic development initiatives, such as the industrial poverty alleviation and mountainous urbanization in the regional scale. In this paper, the six main functions of territorial space were selected and the corresponding index systems were established for the Panxi Area. First, the significances of six territorial functions were evaluated using two niche models. Second, the K-means clustering method was employed to cluster the functional significance grades, acquiring the integrated multifunctional zoning scheme after qualitative adjustment. The results showed that the spatial distribution characteristics of the functional significance for territorial spaces were different. Prominent regions with higher functional significance of agricultural production were concentrated in the vicinity of the Anning River Basin. The distributions of higher significance for industrial development and mineral resources supply functions were correlated with the overall economic development in the Panxi Area. The regions with higher functional significance for tourism & leisure showed advantages on tourist attractions’ quality. The regions with higher significance for habitat service and ecosystem services functions presented advantages on good livability and ecological conditions. The integrated multifunctional zoning scheme for territorial space was highly in consistence with the Major Function Oriented Zoning of Sichuan Province and the “Thirteen Five” Development Plan for Panxi Economic Zone. Generally, the results indicated the rationality and feasibility of the research method, which provides a theoretical basis for coordinating and shaping the structure and pattern of territorial spaces, especially in the mountainous environment with distinct geographical as well as functional differences.
1. Introduction
Territorial spaces, i.e., geographical spaces with the national sovereign rights, are important places for human survival and development and provide the fundamental guarantee of economic and social development [1]. Spatial planning is the focus of many countries worldwide and has important practical significance for coordinating and balancing sustainable development of territorial spaces [2,3,4,5,6,7,8]. Zoning is considered to be some kind of operational mechanism by which current and projected land use is spatially defined in the form of a zonation map for guiding geographic spaces where varied forms of land utilization are authorized [9,10]. It is broadly acknowledged that zoning planning has an effect on spatial patterns as well as diversification of land use [11]. As a managemental foundation of spatial planning and optimal allocation of territorial space, zoning is a fundamental cornerstone for coordinating resources, standardizing land development, protecting ecosystems, and formulating reasonable planning policies for territorial space [12,13,14,15]. Geographers believe in the idea of local condition-based adjusting and regulation during land exploitation and sustainable development, which can be embodied and implemented with the help of the classic approach, i.e., zoning [16,17,18]. Sustainable land use means a reflection on the proportionate portfolio of cross dimensions including social, economic, and environmental services generated from the land uses in some certain territorial space [19]. Therefore, the traditional single-objective and sectoral sub-districts have been unable to fulfill the needs of systematic regulation management of territorial spaces, while the requirement of integrated territorial space zoning from the comprehensive perspective of coupling biophysical and socioeconomic factors has been rising [20]. Territorial spaces may host numbers of distinct and often overlapping functions. Both synergistic as well as antagonistic relationships might exist between functions, hence it is very necessary to concern about the entire functions in a specific landscape, namely its multifunctionality, and to carry out an integrated estimation of the potentials provided by the landscape [21]. In another word, they originated from the attempt to operationalize the sustainable land utilization [19]. Over the last decades, the concept of multifunctionality has been widely studied in different realms and a number of new research objects have been formed besides the land use multifunctionality [19,22,23,24,25,26], such as multifunctional landscape [27,28,29], multifunctional agriculture or rural area [30,31,32,33,34], multifunctional ecosystem services [35], and multifunctional urbanized area [36].
However, the reports on multifunctional zoning of the territorial space from the integrated scope is very rare, especially on which results in the knowledge gap on the theory and methodology of multifunctional zonation. Niche theory is one of the most important theories in ecology [37], with niche referring to the relative position and role a biological unit has within a specific ecosystem that interacts with the environment [38]. The conceptual meaning and measurement models of niche have been successfully transformed across natural sciences [39], social sciences [40], and humanities [41]. Specifically, the niche models are extensively applied in cleaner production [41,42], urban complexity [43], land use change and land consolidation [44,45], residential suitability evaluation [46,47], tourism development [48], and land use functional zoning [49]. There are a few case studies using niche theory to assess territorial multifunctionality at the macro-geographic scales, which implied the probability of transferring the niche theory into multifunctionality [50,51].
Consequently, in this study, the niche theory and its measurement models were introduced to quantitatively investigate the status and the development trends of territorial space functions in a sub-region with a much-diversified landscape located in the southwestern China, i.e., Panxi Area. The Panxi Area is highly valued due to its enriched mineral, water, and biological resources, with a remarkable multifunctional territorial characteristic. Funded on the niche theory and its measurement models, the quantitative evaluation on the functional significance of territorial spaces (FSoTS) in the Panxi Area was conducted to identify and clarify its multifunctional features. Furthermore, the purpose of the paper is to generate an integrated multifunctional zoning scheme (IMFZS) of the territorial space in Panxi utilizing the obtained significance assessment results. Concurrently, this study will be an important reference for not only achieving a high efficiency land utilization, but also benefiting the industrial poverty alleviation, as well as the mountainous urban development in the regional scale [52].
2. Materials and Methods
2.1. Study Area
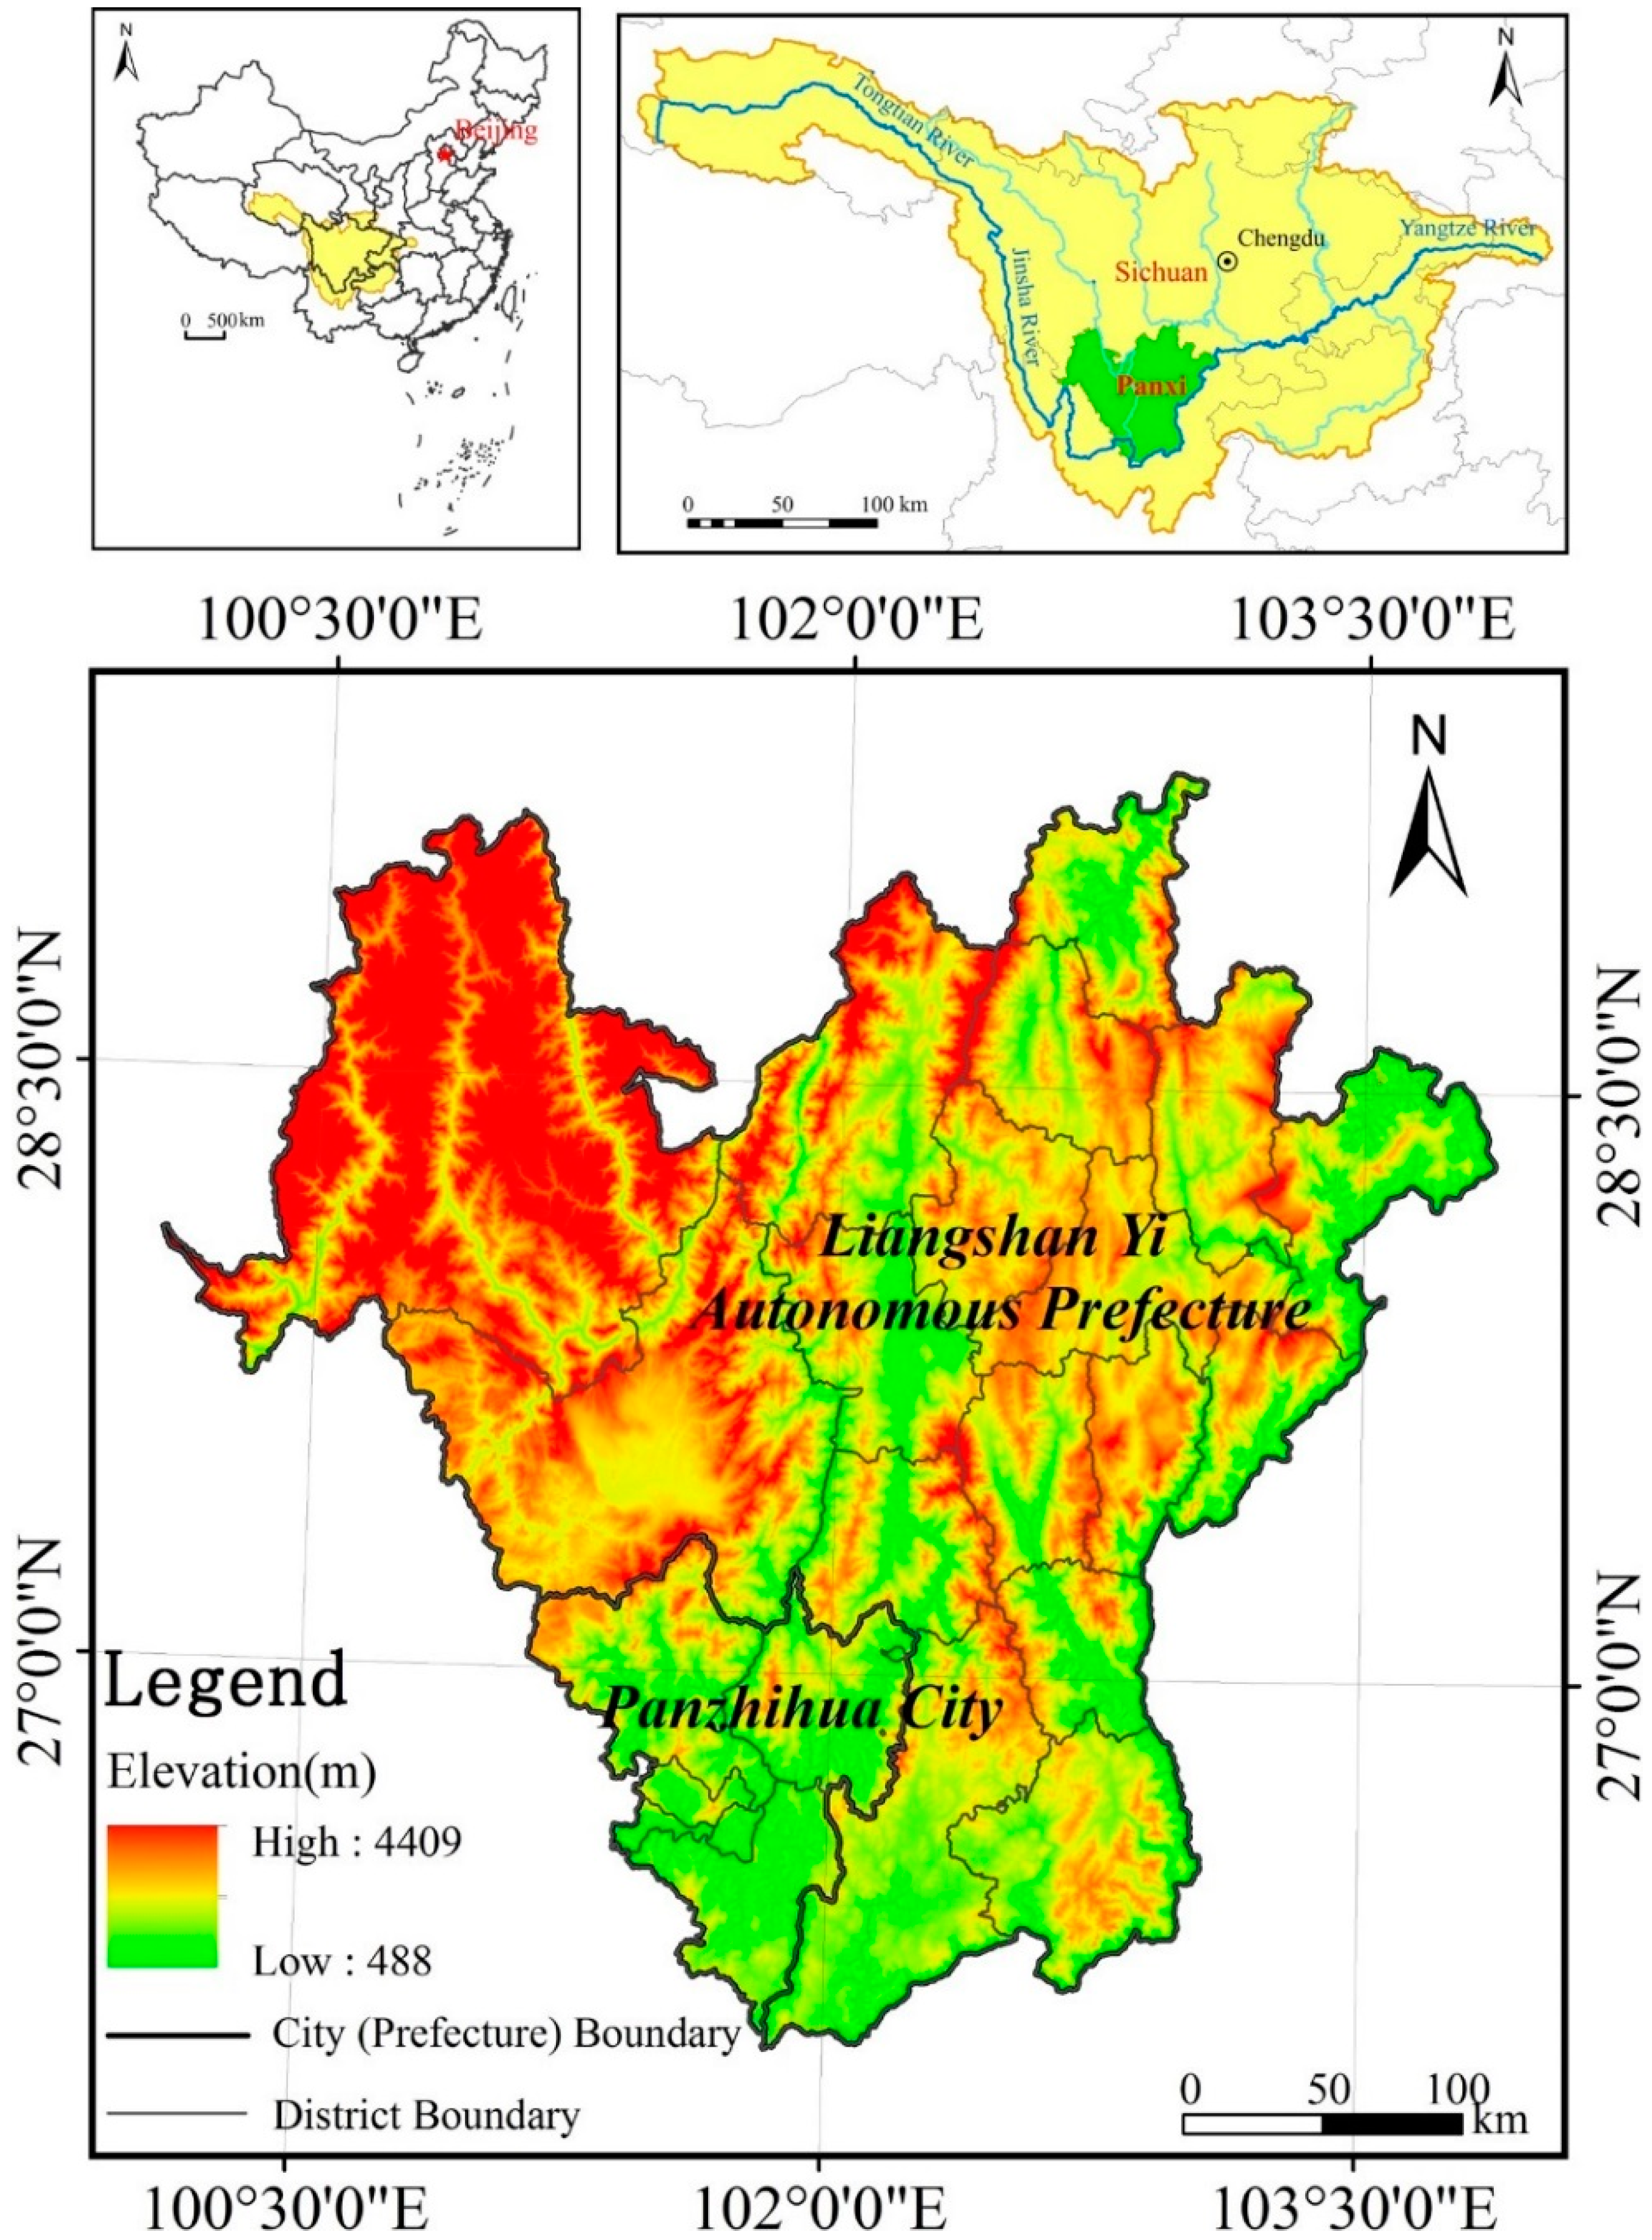
The Panxi Area, west of the Hengduan Mountains, is located in the transition zone between the Tibet Plateau and Yunnan-Kweichow Plateau to the Sichuan Basin. With a unique location, it is an important ecological barrier area in the upper Yangtze River, and a notable area for ethnic minority group (Yi People) and the concentrated poverty alleviation. It is also an important region formed by the combination of Sichuan, Yunnan, and Guizhou provinces. Located in the western Hengduan Mountains, southwest Sichuan province (Figure 1), is a synthetic name from the cities of Panzhihua and Xichang (the capital of Liangshan Yi Autonomous Prefecture). It includes Panzhihua city and Liangshan Yi Autonomous Prefecture, which contains 22 administrative countries (districts/city), covering an area of 67,500 km2 and accounting for 13.9% of the total area of Sichuan province. The Panxi Area lies at the confluence of the Jinsha, Yalong, and Anning Rivers, with abundant water (energy) resources from the extensive distribution of tributaries. Due to its special location conditions, the area has a rugged terrain and complex and diverse geomorphology, with valley, plain, mountains, and other types of landforms throughout.
The Panxi Area is in the metalloorganic belt of the Panxi Great Rift Valley at the junction of Sichuan, Yunnan, and Tibet. Rich in mineral resources, it is China’s second largest iron ore base and is known as a “vanadium and titanium kingdom”. It is also located at the heart of the tourism economy belt of the tourism union, which is composed of Yunnan, Sichuan, and Tibet, and therefore has a great potential for tourism development. On 1 March 2013, as the only state-level pilot area for comprehensive utilization of mineral resources, the National Strategic Resources Innovation Pilot Zone was established in Panxi.
In 2016, the registered population of the Panxi Area was 6.292 million. Within the region, Liangshan has the largest population of ethnic Yi people within China. The Yi people account for 51.86% of the total population of Liangshan. The area GDP was 241.86 billion yuan, with per capita GDP 38,827 yuan. Regional development has been uneven, with clear gaps between urban and rural communities. The urbanization rate of Panzhihua was 65.34%, whereas the rate in Liangshan was only 36.7%. The Panxi Area is also a relatively rare “cornucopia” enriched and well-equipped in water, mineral, biology, and tourism resources. Therefore, there are practical implications to evaluating the functional significance and territorial space zoning in Panxi.
2.2. Data Collection
Considering the availability and precision of the data, the 22 administrative counties (districts/city) in the Panxi Area were taken as the basic evaluation units. The research data included the land use (2010), the digital elevation models (DEM), and the socio-economic statistics information. The land use data were obtained from the remote sensing survey data of the ecological environment ten-year change for Sichuan Province in 2010. The DEM data were downloaded from the geospatial data cloud (http://www.gscloud.cn), with a resolution of 30 m. The socio-economic statistics data included national economic development, tourism, and mineral resources information. The first two data were retrieved from the “Statistical Yearbook of Sichuan Province in 2015” and National Economic and Social Development Bulletin of the County (District) in 2014. Additional tourism data were retrieved from the tourism websites of Sichuan province, Panzhihua City, and Liangshan Yi Autonomous Prefecture. The mineral resources data were retrieved from the “General Planning of Mineral Resources in Panzhihua, Liangshan Yi Autonomous Prefecture of Sichuan Province (2008–2015)”, and the literature on mineral resource of Panxi [53,54].
2.3. Theory and Methodology
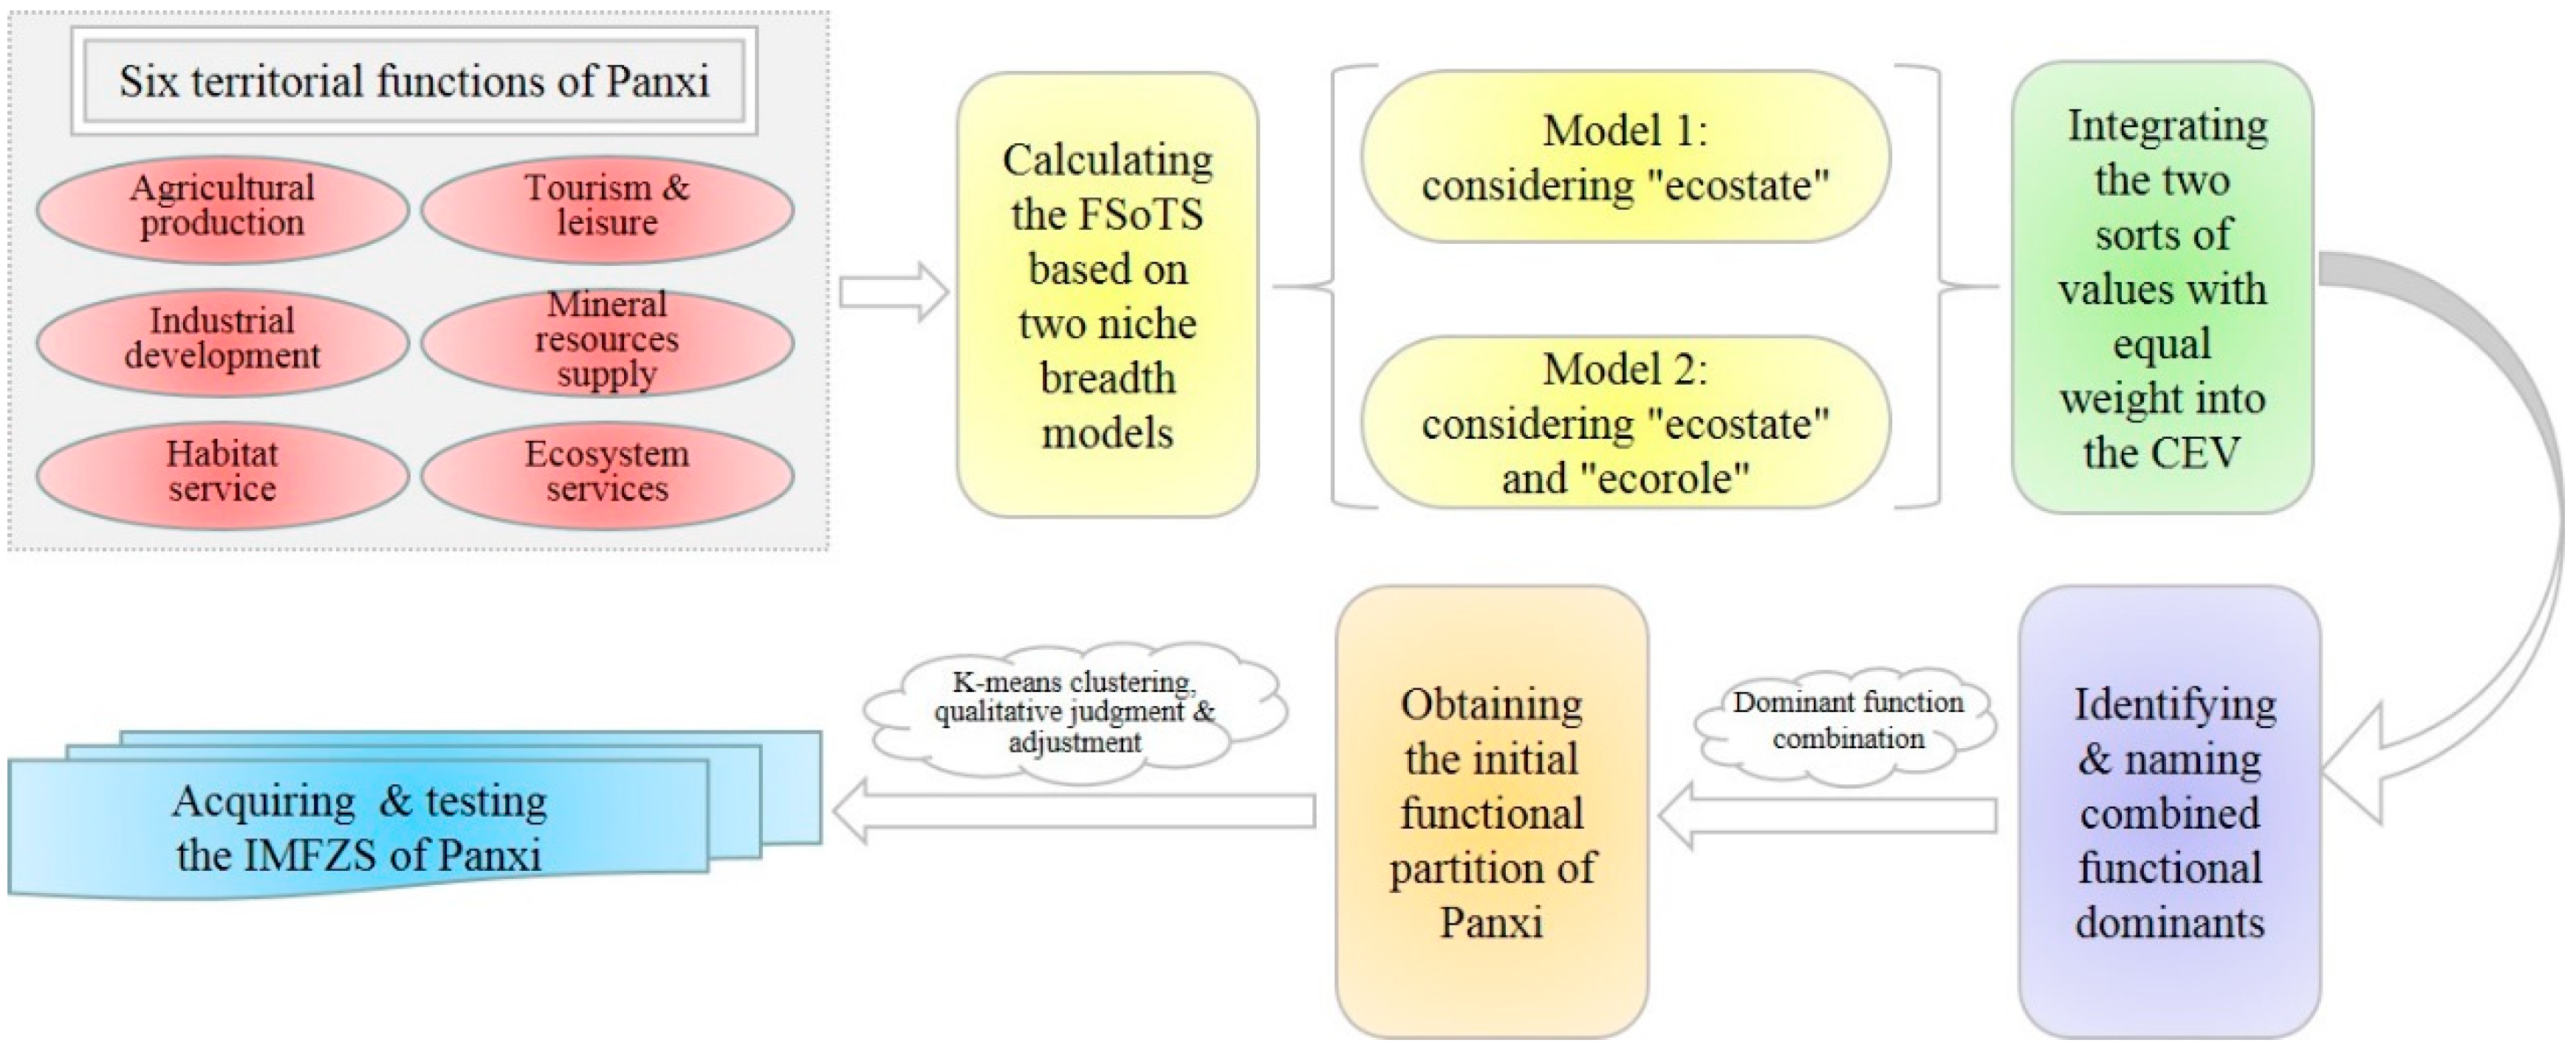
On the grounds of ecological niche theory, specifically employing the niche breadth models to investigate the FSoTS of six multifunctional components for each evaluation unit in Panxi, the multifunctional component identification, the FSoTS evaluation system construction, and the FSoTS calculation, as well as its comprehensive value assessment, were conducted successively in the empirical section of the article to finalize the IMFZS of Panxi accordingly (Figure 2). Moreover, the testing comparison between the IMFZS and other spatial planning systems of Panxi was also investigated.
2.3.1. Territorial Functional Niche
Territorial space is a complex geographical space comprised of multidimensional functional elements of nature, economy, resource, environment, and ecology [55]. Based on the niche theory of ecology, the territorial functional niche is defined as the position, function, and its relative relationship with other functions in a certain area [56]. The functional niche breadth model for territorial space is used to compare the size and strength or weakness of different functional niches. This comparison is used to evaluate the status and competitiveness of certain territorial functional types in the area. The significance of a certain function was quantitatively expressed using the size of the functional niche, which was the basis for multifunctional zoning.
2.3.2. Identifying the Multifunctional Components in Panxi
For a region like Panxi, with the huge population size and the raising development appeal, the agricultural production and industrial development (specifically referring to the secondary and tertiary industries) are no doubt the two fundamental domains. Additionally, in order to shift from land-oriented urbanization to people-centered urbanization, adhering to the National New Urbanization Plan (2014–2020) unveiled by the Chinese Central Government [57] to get resource-based regional transformation back on their feet [58,59], i.e., making full use of their own resource advantages, as well as to facilitate the ecological reconstruction in the upper Yangtze River [60], we categorized habitat service, mineral resources supply, tourism & leisure, and ecosystem services as other major territorial space functions to be assessed in this research. Specifically, the indicator values of ecosystem services were calculated and derived by the land use information of Panxi according to the related literature [61,62,63,64].
2.3.3. Constructing the Functional Significance Evaluation System
The multifunctionality of territorial space determines the complexity as well as the multidimensionality of the evaluation index for significance. In line with the principle of Analytic Hierarchy Process, the weight of each function index was obtained using the expert scoring method. In light of the existing related index system [51,65], the development stage of Panxi, the data availability, and the scale effect of indicators [66], six functions, i.e., agricultural production (abbreviated as A), industrial development (abbreviated as I), habitat service (abbreviated as H), tourism & leisure (abbreviated as T), mineral resources supply (abbreviated as M), and ecosystem services (abbreviated as E), were selected and subdivided to form the index system for significance evaluation (Table 1).
2.3.4. Calculating the Functional Significance of Territorial Spaces (FSoTS) based on Two Niche Breadth Models
In this study, two types of niche breadth models were used to quantitatively evaluate the FSoTS. According to the “ecostate” concept in the niche theory, the first model estimate and measure the static state of functional niche and their distribution on the basis of the functional factors in the functional matrix (Equations (1) and (2)) [50,67,68]. Meanwhile, the second model emphasizes both of the development trend of the functional niche relying on the “ecorole” concepts and the static “ecostate” by calculating the functional factors in the functional matrix (Equations (3) and (4)) [51]. The first model reflects the current status of resources and energy possessed by a function in a certain area. The second model, considering the current development state, takes into account the flexibility and future development trends, as well as the supply and restrictions of different natural and socioeconomic factors of the function.
In the first model, the matrix of the functional niche breadth was composed of rows of every function for every district, and columns of function index, with a range from 0 to 1, as shown in Equation (1) [50].
where Uqij is the j-th functional factor niche of the q-th territorial space function performed in the the i-th evaluation unit. Wqj is the weight of the q-th function in the j-th functional factor. The “ecostate” evaluation model of functional niche breadth is constructed as shown in Equation (2) [50]:
where j is the index number, j=1, 2, 3, ..., m, where m is the functional factor dimension; i is the number of each evaluation unit, i = 1, 2, 3, ..., n, where n is the functional category; Sqj is the width of the q-th functional niche of territorial space for the i-th evaluation unit; and Wqj and Uqij have same meanings as in Equation (1). Uqij is the normalized value. Based on the positive sign of the selected indexes, the index value was normalized using positive differential normalization, with a range from 0 to 1 after normalizing.
With calculating the “ecorole” by Equation (3), the second model is shown in Equation (4) [69]:
where Uqij has the same meaning as in Equation (1); Uqj opt is the ideal value of j-th functional factor niche for the q-th function; Pqij is the “ecorole” of the j-th functional factor niche for the q-th function of the i-th evaluation unit; k = 1,2, ..., n and n is the number of evaluation units; Nqij is the j-th functional factor niche for the q-th function of the i-th evaluation unit including “ecostate” and “ecorole”; Sqij is the “ecostate” of the j-th functional factor niche for the q-th function of the i-th evaluation unit; Sqkj is the “ecostate” of the j-th functional factor niche for q-th function in the k-th evaluation unit; Pqik is the “ecorole” of the j-th functional factor niche for the q-th function in the k-th evaluation unit; and Aqij and Aqkj are conversion coefficients.
According to Shefford’s restrictive rule, the significance of different factors [70] was considered for developing the evaluation model of the territorial functional niche. The index and method were combined with Sheffield’s restrictive rule using Equation (5).
where Fqi is the “ecostate” and “ecorole” evaluation of functional niche breadth for the q-th function of the i-th evaluation unit and Wqj is the same as in Equation (2).
2.3.5. K-means Clustering Method
The K-means clustering method is a classic clustering method widely used in data mining, pattern recognition, and image analysis. The principle is that N observations are assigned to K clusters, and the observation object closest to the mean is clustered into one category [71].
The essential task of K-means clustering is to find the division Pk of a data set X, where X = [x1,x2,x3,…,xn], Pk = [C1,C2,C3,…,Cn], and ensure that Pk minimizes the objective function . Among them, mi = 1/ni, represents the center position of the i-th cluster, where i = 1,…,k; ni is the number of data items in cluster Ci; and d (xi,mi) represents the distance from xi to mi. Generally speaking, the spatial clustering algorithm is utilized on the basis of a variety of distance metrics, such as Euclidean distance, Manhattan distance, and Mingkawi distance. Among them, Euclidean distance is mostly used [72].
Due to its simplicity and popularity, K-means clustering method was adopted to partition the study area into numbers of multifunctional zones in this paper. However, K-means clustering has two main defects when used here: (1) Presetting the reasonable K is not easy to do before analyzing; (2) Selecting different initial cluster centers will result in varied clustering patterns. In this paper, two aspects of work were conducted to overcome them: (1) Set the value range of K, i.e., from 4 to 11, compare the clustering results, and identify the best one. Considering the policy implication of the zoning scheme as well as the number of evaluation units in the study area, the authors understood that the number of zoning divisions less than 3 or greater than 11 did not make sense for the case in this study. Therefore, “the value of K was entered from 4 to 11 and was grouped many times”, and the different results were compared to finalizing the “best” K according to the F test results. (2) Use the “dominant function combination” method to obtain the preliminarily functional partition, based on which the K-means cluster analysis was applied to further partition functional zones, avoiding the shortcoming that selecting different initial cluster centers may cause different clustering results.
2.3.6. Assessing the Comprehensive Evaluation Value (CEV) of FSoTS and the Approach for IMFZS
We understand that the CEV should not only reflect both of the inherent characteristics of the function and its potential for development trends, but also need to preferentially clarify the orientation for getting regional development back on their feet, i.e., taking full advantage of their own developmental competitiveness. Therefore, integrating the evaluation of the above two models, embodying the greater impact of the “ecostate” index in the results, to quantify the functional significance of territorial space is taken as the primary approach of multifunction zoning in this paper. Firstly, the significance degree of two sorts of FSoTS of each function was expressed using its grade rank from high (4) to low (1) at natural break points. Secondly, the two sorts of grades for FSoTS were equally weighted and combined as the CEV, which was graded from high to low by the same method as above. Thirdly, the functions ranked 1 and 2 were supposed to be the dominant functions, and were combined as the integrated dominant function for each county (district). The naming rule of the integrated dominant function was as follows: listing the abbreviation of each single dominant function name with level rank subscripted by the order of A, I, H, T, M, E. A preliminary functional zoning of Panxi was obtained. Fourthly, the K-means clustering method in SPSS was used to cluster the functional grades and get the initial functional partition. Lastly, the IMFZS was acquired after the qualitative judgment and adjustment with the consideration of local planning guidance, such as to assign a proper zoning name for the isolated evaluation units without prominent functions.
3. Results
3.1. The Multifunctional Significance Features and Their Spatial Distribution
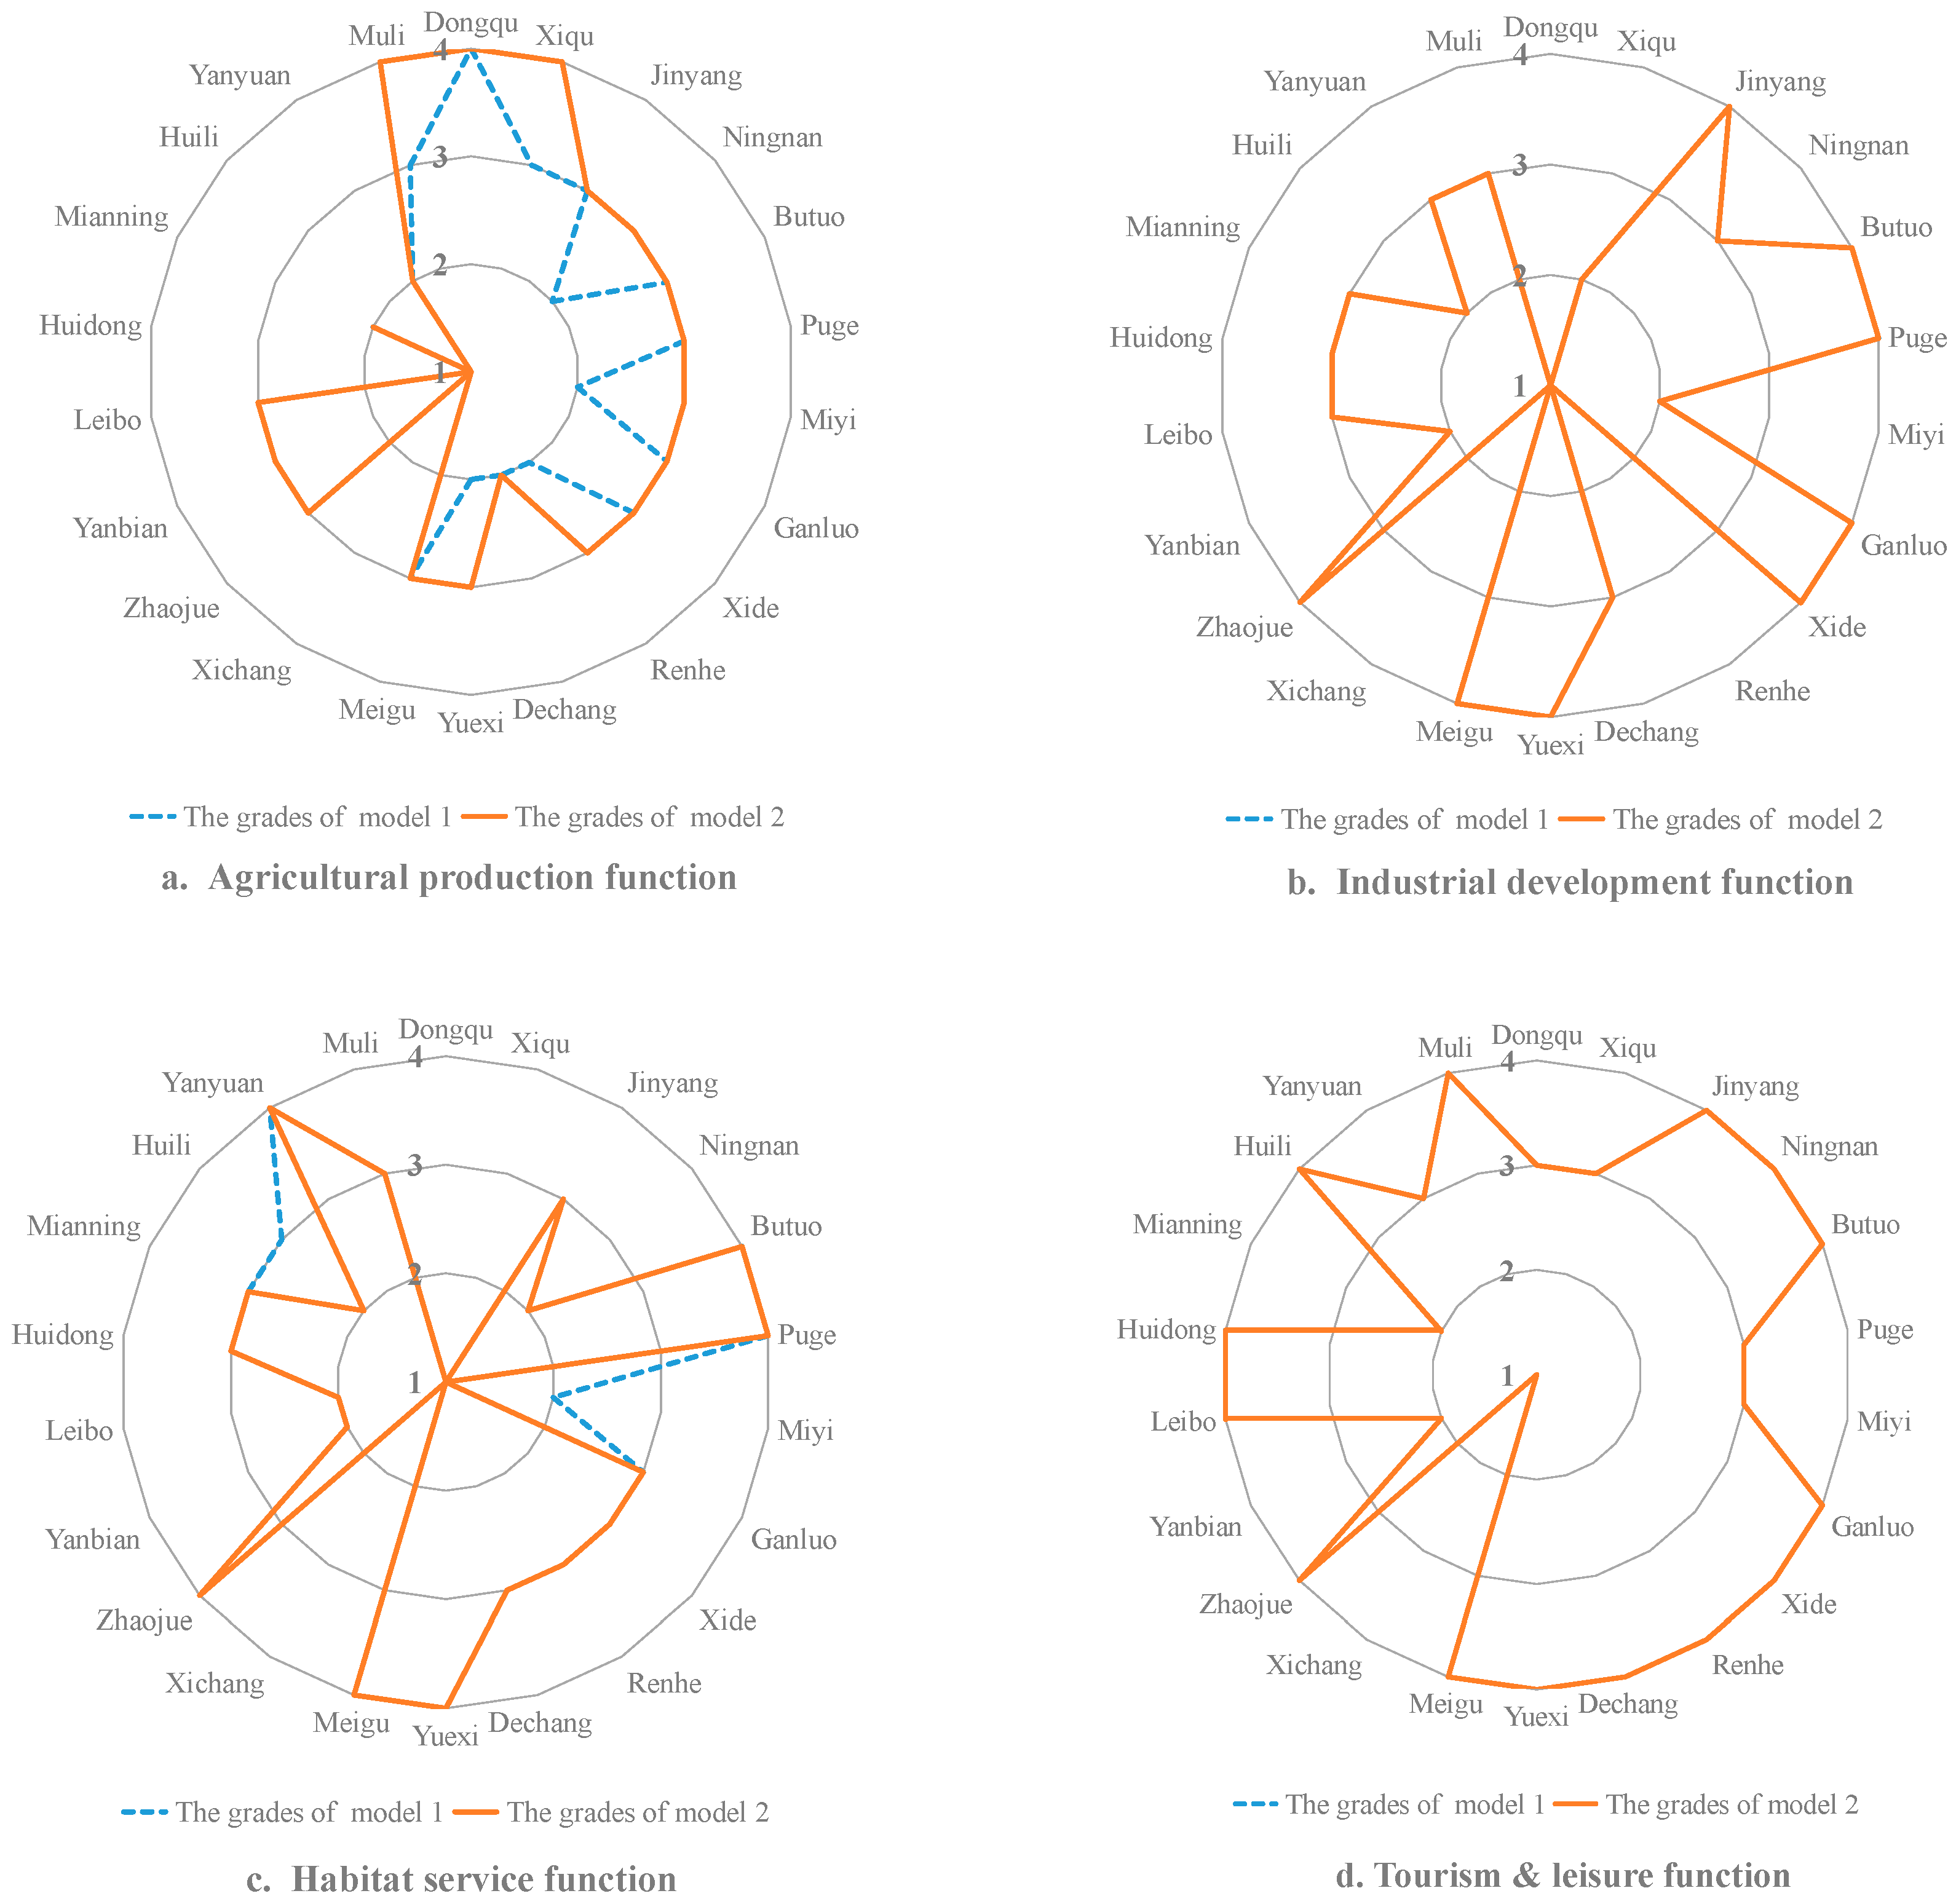
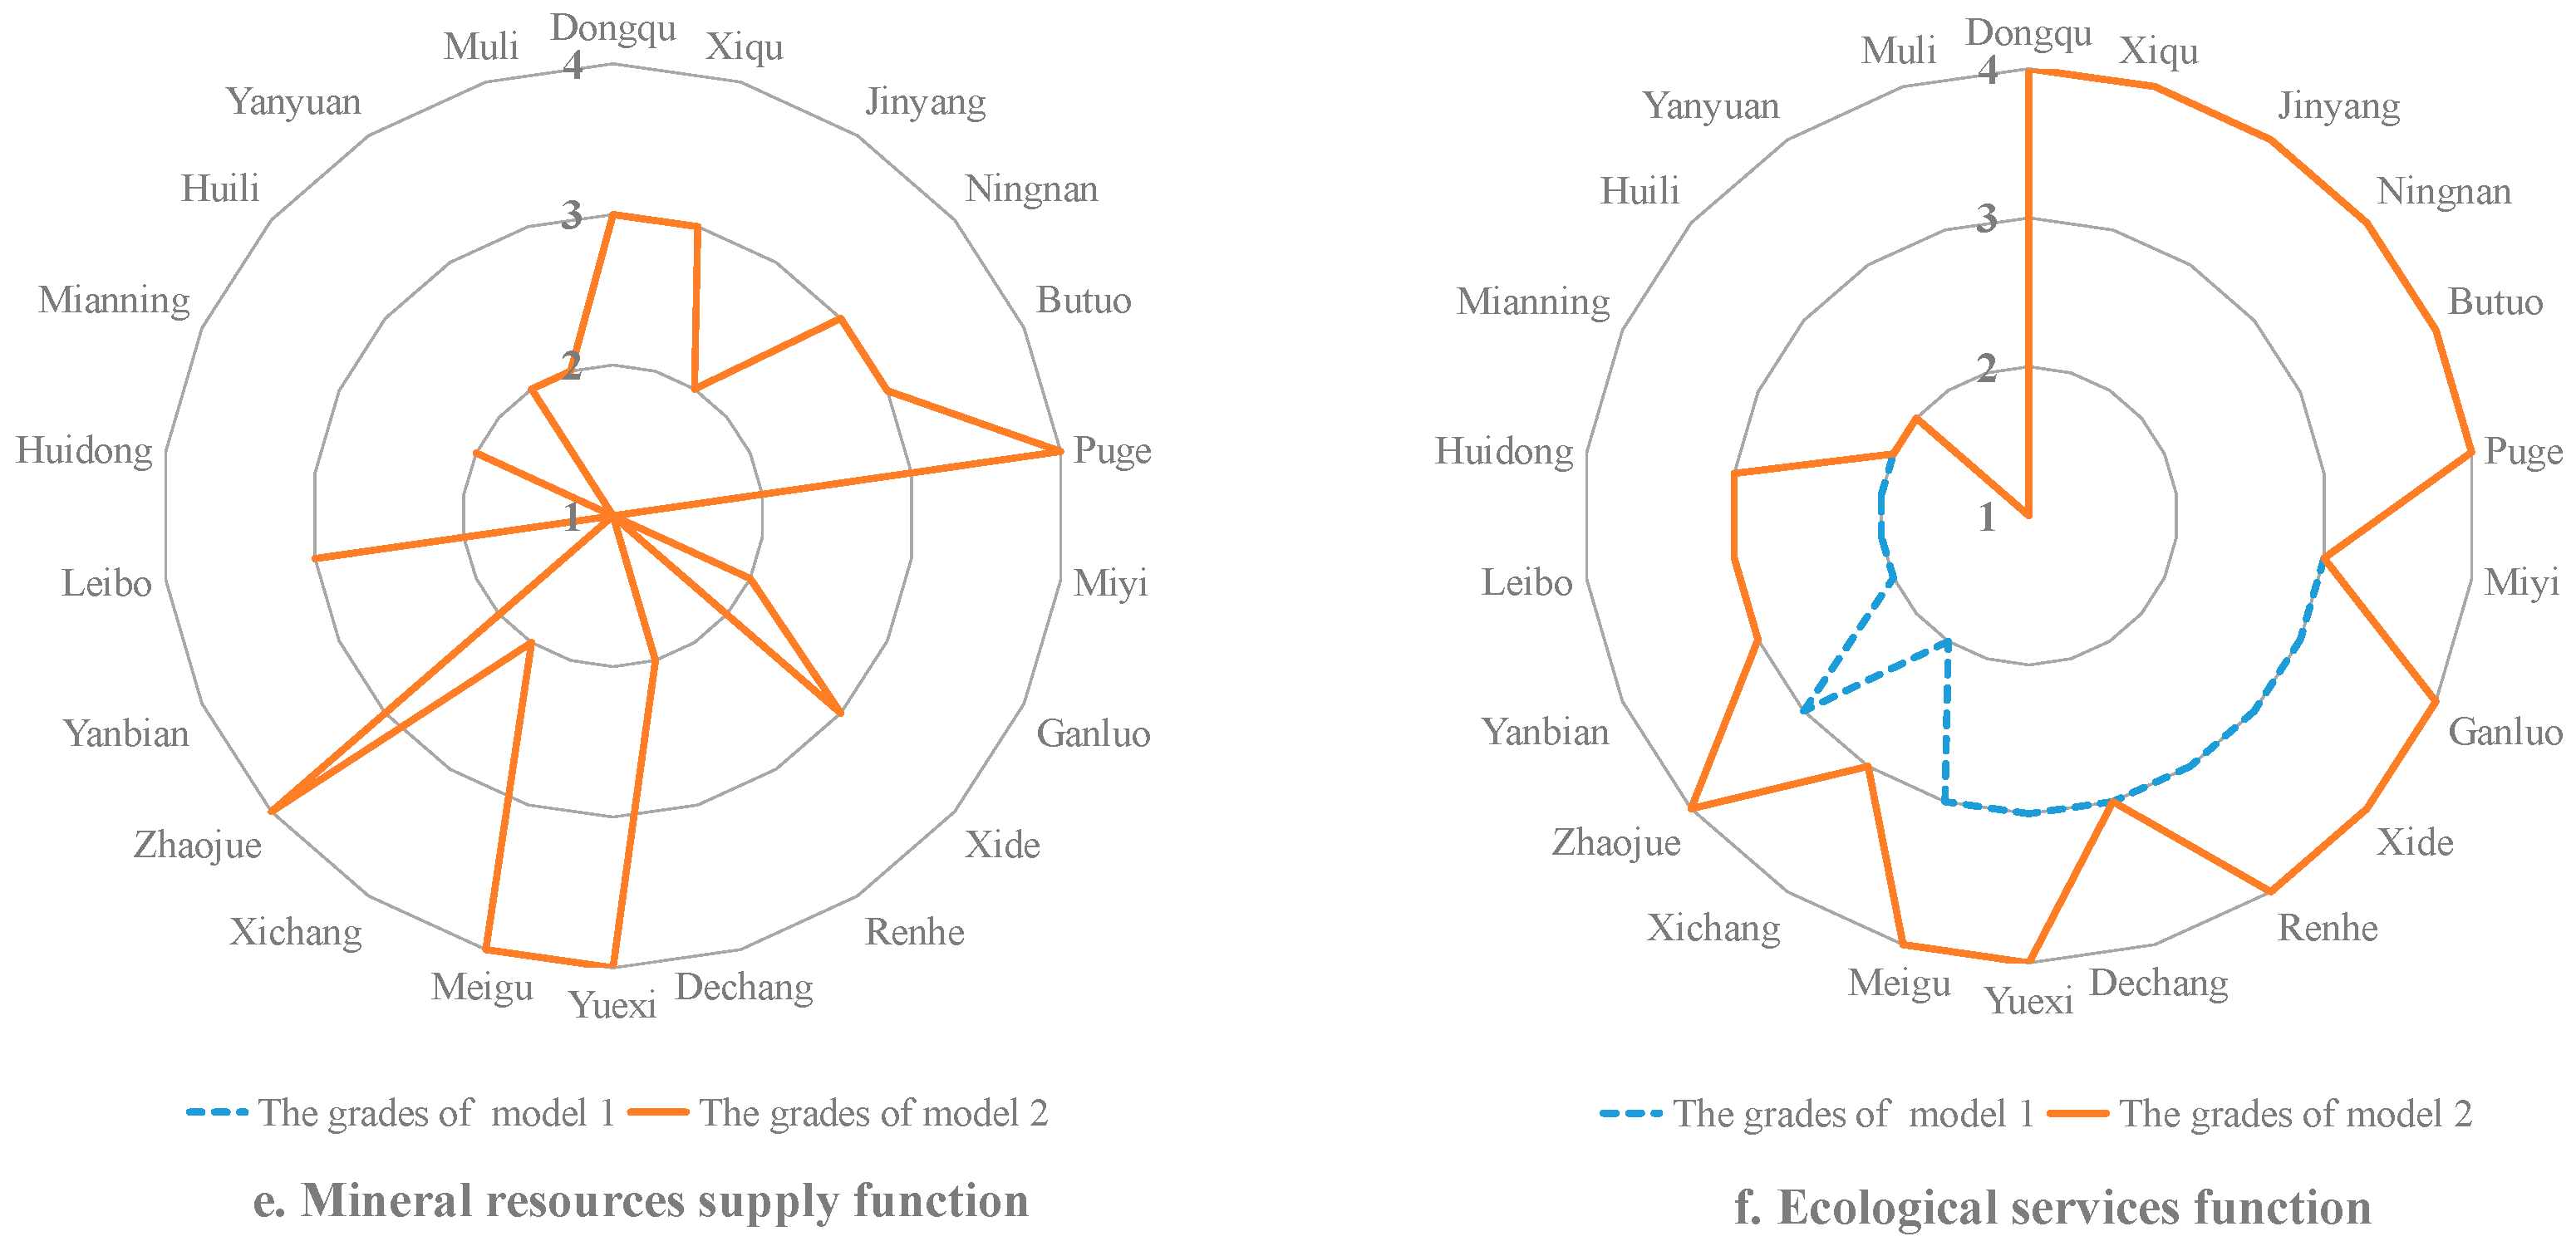
Comparing the two sorts of grades for FSoTS, calculated on the model 1 and model 2 respectively, shown in Figure 3, the performances of three FSoTS were different. Specifically, the industrial development function (Figure 3b), tourism & leisure function (Figure 3d), and mineral resources supply function (Figure 3e) presented the same spatial distribution, while that of the agricultural production (Figure 3a), habitat service (Figure 3c), and ecosystem services functions (Figure 3f) were characterized differently. Particularly, the grades for FSoTS of agricultural production in four evaluation units decreased by 1 level and that of habitat service in two evaluation units increased by 1 level. Moreover, the grades for FSoTS of ecosystem services in nine evaluation units and one districts decreased by 1 level.
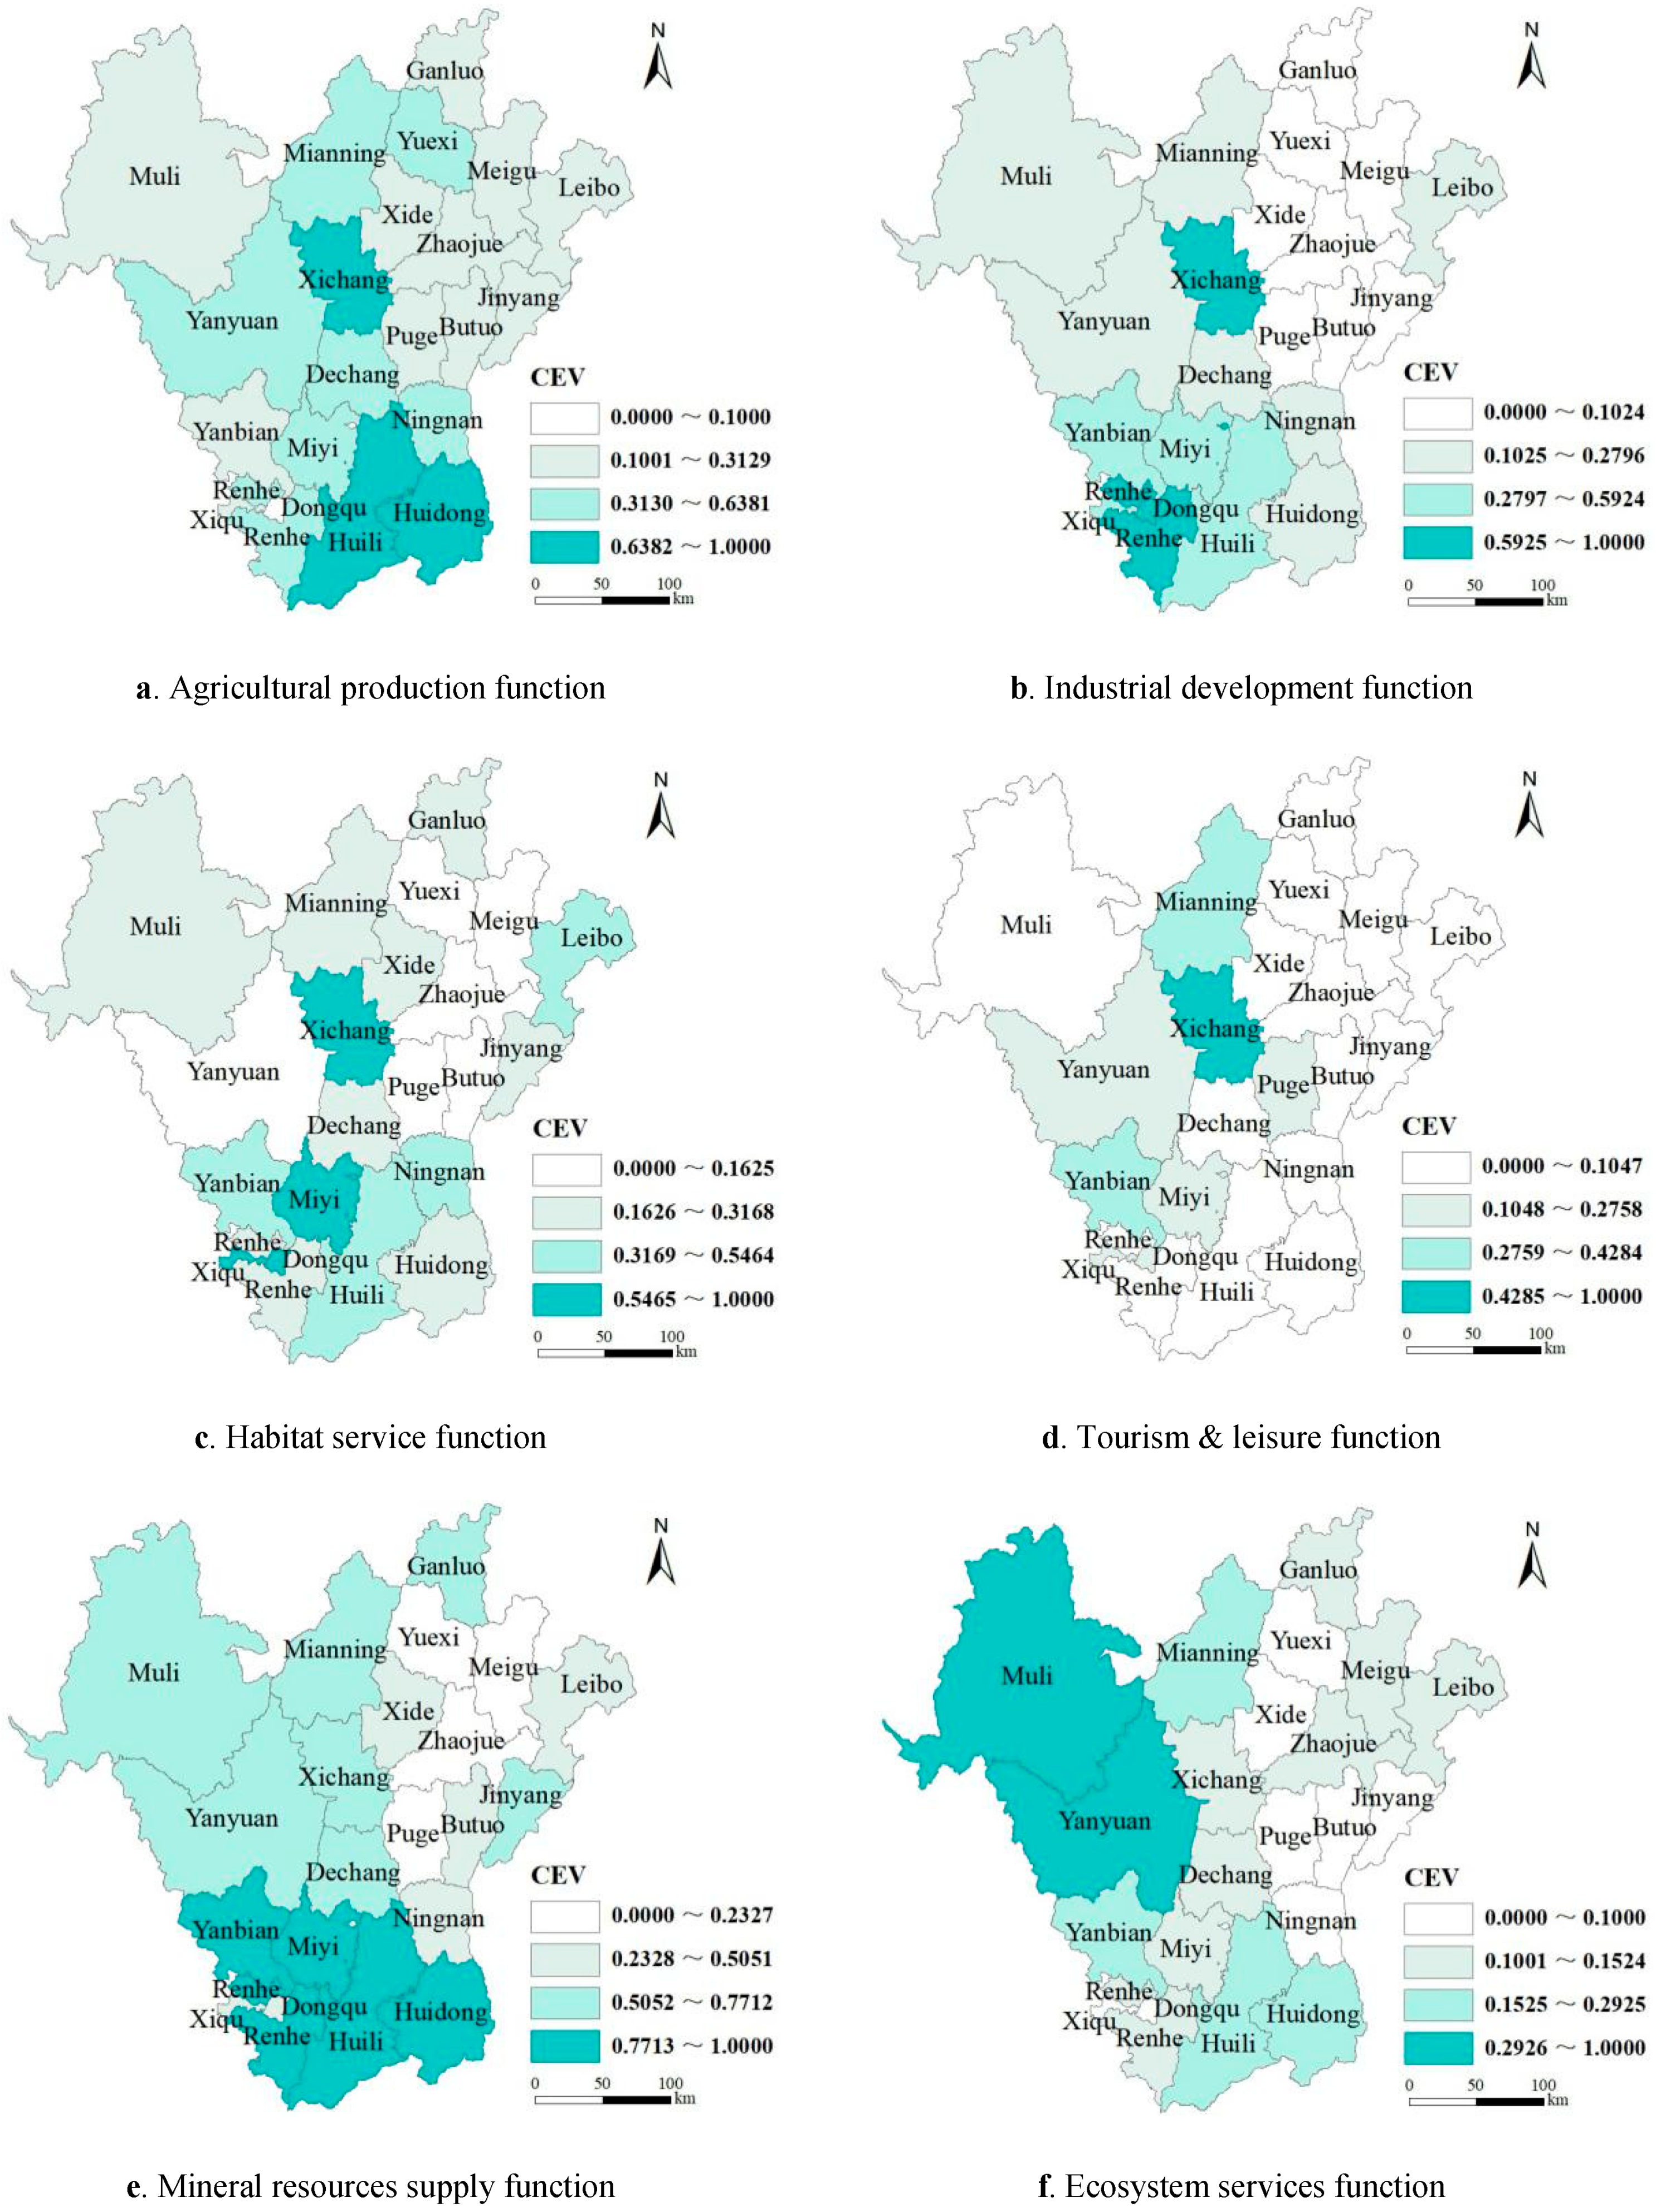
The CEV was obtained by two sorts of grades for FSoTS with equally weighted combination (Table 2) as mentioned previously. From Figure 4, the evaluation units that performed strongly in agricultural production primarily distributed in the central region, highly consistent with the geography of the Anning River Basin (Figure 4a). The unique climate in the Anning Valley provides advantageous natural conditions, with abundant agricultural and biological resources. The evaluation units that performed strongly in industrial development were primarily located in Panzhihua, Xichang, and Huili County (Figure 4b). In Panzhihua and Huili, there are abundant convenient transportation conditions, natural resources, and energy. Xichang is the center of politics, economy, and culture, as well as the transportation hub in Panxi, no doubt having the superior development conditions from various perspectives. These regions have several factors benefiting the secondary and tertiary industries, which also leads to more economic development.
The evaluation units that performed strongly in habitat service are Xichang City, Leibo County, and southwest Panxi (Figure 4c). Xichang is the capital of Liangshan Yi Autonomous Prefecture, as well as an important city that lies at the junction of Sichuan and Yunnan province. For Leibo County, there are two natural plateau freshwater lakes, Ma Lake and Leshui Lake. Ma Lake is China’s famous natural Brasenia schreberi base and the third largest alpine deep lake. Therefore, the overall environment of Leibo is of high quality and beneficial to livability. Dongqu, a district of Panzhihua City, is an important transport hub and distribution center of trade and material on the “Southern Silk Road”, continuously attracting immigrants. Miyi County in Panzhihua City is well known as a “natural oxygen bar”, with more than 60% of its land covered by forest. The habitat service function in the above regions showed high grades. As for the tourism & leisure function, all of the evaluation units were relatively weak (Figure 4d). A few of the units performing well in this function mainly benefited from the national scenic spots.
The Panxi Area has always been an important resource-abundant area in China, with abundant natural and mineral resources. In addition to individual districts of Liangshan, Dongqu, and Xiqu in Panzhihua, most regions were also rich in mineral resources (Figure 4e). The Ecosystem Services function of Muli County and Yanyuan County were most prominent (Figure 4f), indicating their national key ecological function, stronger than other regions.
3.2. The Clustering of the Territorial Space Functions Based on County (District) Level
Sixteen functional zones were preliminarily identified for the 22 administrative units in the Panxi Area (Table 3) employing the “dominant function combination” method. However, the 16-functional zone cannot provide proper policy implication as some specific evaluation units only had a single territorial function, such as Leibo and Yuexi. Therefore, the K-means clustering was used to cluster the functional grades of six functions for each evaluation units, that is, the matrix of 22 evaluation units plus six function types was clustered. Given different clustering numbers between the actual value and the input parameter K, the value of K was input from four to 11 and clustered repeatedly. Each clustering result was analyzed and the F test results were compared. Finally, the best number of functional zones was indicated “seven” (Table 4).
3.3. The Integrated Multifunctional Zoning Scheme (IMFZS) of Territorial Space in the Panxi Area
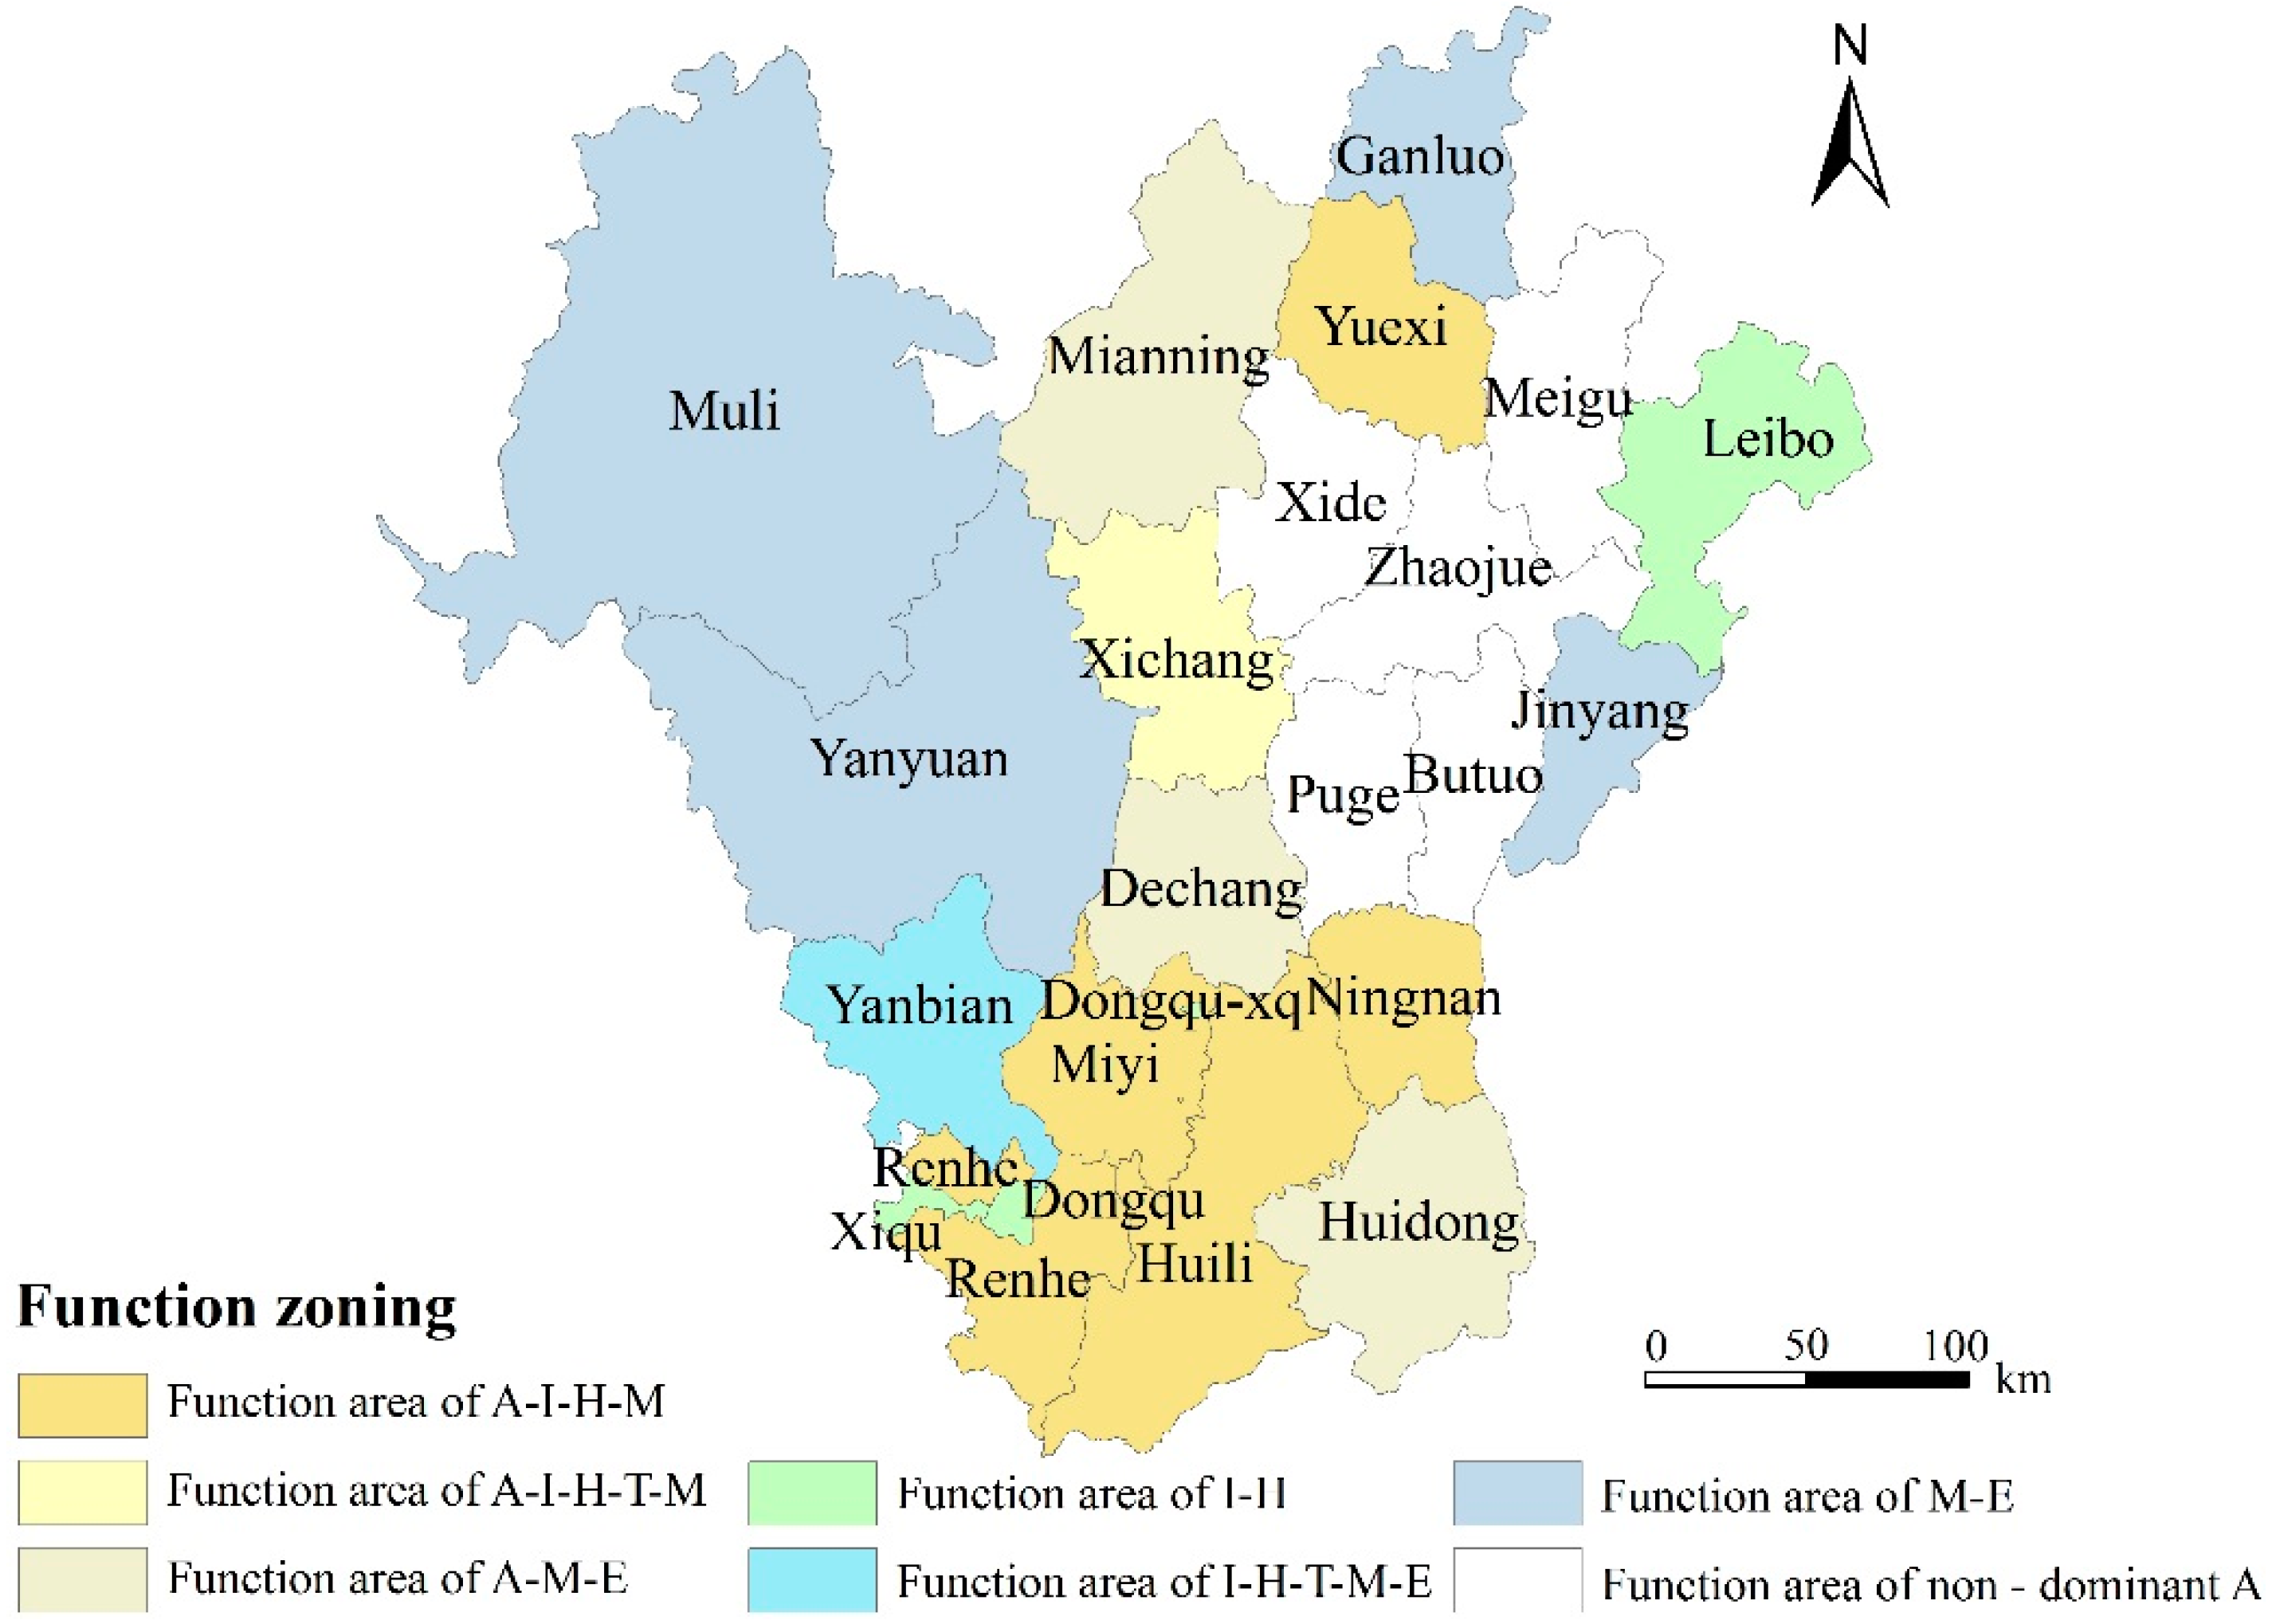
Based on the clustering results in Section 3.2, the seven multifunctional zones were qualitatively adjusted by combining the present situation with the proposed planning and policy for each county (district). This process retained or merged some isolated units without prominent functions, which were included in other prominent functions. Finally, the integrated multifunctional zoning scheme (IMFZS) of territorial space was realized (Table 5), and was illustrated spatially using ArcGIS (Figure 5).
As shown in Figure 5, among all evaluation units, Leibo and Yuexi were unique. In Leibo, there is an excellent ecological environment because of the natural advantages provided by Ma and Leshui Lakes, and was characterized by prominent habitat service function, which makes it a desirable place for people to reside. Yuexi is a traditional agricultural county that grows Dahongpao peppers, southwest sweet cherries, and pollution-free vegetables. The agricultural economy has dominated its economy. The two evaluation units were divided into the corresponding function areas of habitat service or agricultural production. Jinyang and Ganluo were characterized as function areas for mineral resources supply, as they are located in geomorphic transition zones appropriate for developing abundant mineral resources. The evaluation of functional significance in Butuo, Puge, Xide, Meigu, and Zhaojue indicated a broad spectrum of functions, yet all graded between three and four with no dominant ones. According to the optimal output results, these five evaluation units were ultimately classified as function areas of non-dominant agricultural production combined with additional functional types of the same grade. The remaining areas having two or more function types were divided into different multifunctional zones, such as Xichang and Yanbian. Xichang, an important city in the contiguous area of Sichuan Province and Yunnan Province, has functional advantages for all 6 aspects. Yanbian is a part of Panzhihua, which is characterized by more comprehensive development (Table 3 and Table 5, Figure 5), therefore the county shares many of the regional development advantages.
4. Discussion
4.1. The Comparison between the Integrated Multifunctional Zoning Scheme (IMFZS) and Major Spatial Planning Systems in the Panxi Area
In order to test the rationality of the IMFZS, considering the territorial functional attribution as well as the major spatial planning systems existing in the Panxi Area, we conducted the comparison analysis between the IMFZS and two major spatial planning systems of Panxi: the “Thirteen Five” Development Plan for Panxi Economic Zone (DPEZ) and the Major Function Oriented Zoning (MFOZ) of Sichuan Province. These two both took counties (districts or city) as the basic evaluation unit, which was same with the case study.
As for the comparison between IMFZS and DPEZ (Table 6), the Industrial Development Zone or Mineral Resources Supply Zone in the IMFZS, locating in 11 evaluation units, were taken as the National Strategic Resources Innovation Pilot Zone in the DPEZ. Muli County and Yanyuan County, with the highest significance of ecosystem services function, were categorized as the National Ecological Function Zone of Chuan-Dian Forest & Biodiversity. For the Major Planting Base Zone locating in 11 evaluation units of the DPEZ, there were eight same units with high functional significance of agriculture production in the IMFZS. Moreover, for the Health & Wellness Industry of Sunshine Zone including 10 units, there were also eight same units with high functional significance of habitat service and tourism & leisure. However, when we checked the Ecological Function Zone for Soil & Water Conservation and Biodiversity of Daxiao Liangshan, it seemed that only two evaluation units (Jinyang and Ganluo) were consistent with the specific territorial functions (Ecosystem Service) according to the study (Figure 4). Nevertheless, the Ecological Function Zone in the DPEZ mainly emphasized the fragile ecosystem and natural environment due to significant soil erosion in the ten counties (Butuo, Puge, Xide, Meigu, Zhaojue, Leibo, Yuexi, Ningnan, Jinyang, Ganluo), which were just consistent with the same evaluation units in the IMFZS with relatively low significance of Ecosystem Service function.
As compared with the MFOZ of Sichuan Province (Table 7), there were seven evaluation units categorized as Provincial Development-prioritized Zone, which were named Habitat Service Zone, or Industrial Development Zone or Mineral Resource Supply Zone in the IMFZS. The territorial functions of habitat service, industrial development, and mineral resources supply exactly corresponds to the implications of prioritized development in Panxi. For the three evaluation units of National Major Grain Producing Zone in the MFOZ, two of them were listed as Agricultural Production Zone in the IMFZS. Additionally, the two evaluation units in the IMFZS with the highest functional significance of ecosystem services were classified as the National Key Ecological Function Zone in the MFOZ. Same as the explanation for the consistence between DPEZ and IMFZS, the Provincial Key Ecological Function Zone within the MFOZ corresponded well to the evaluation units with relatively low significance of ecosystem service function in IMFZS.
4.2. The Innovation Entailed by the Proposed Methodology
There were ten evaluation units designed as the Ecological Function Zone for Soil & Water Conservation and Biodiversity of Daxiao Liangshan in the DPEZ, as well as the Provincial Key Ecological Function Zone in the MFOZ of Sichuan Province. In this paper, the ten units were identified as low significance of ecosystem services function (Figure 4) due to poor vegetation cover and soil erosion [73]. Among these ten units, five of which showing universally low grade of significance for each territorial function. Furthermore, the five-county is the main habitat of Yi people in China, as well as sitting in the Wumeng Mountain Contiguous Poverty Area. Poverty alleviation for this area has raised high concerns from local to central governments. Many problems, such as fragile ecosystems, geographical remoteness, and poor traffic infrastructure, excessively dependent on traditional agricultural and low-stage industrialization, are believed to obviously hamper its economic development. However, the five counties are locating in the main core area of producing buckwheat (Fagopyrum tataricum) in Liangshan Prefecture, which is regarded as the most important producing base of buckwheat in China [74]. Buckwheat is reportedly a highly nutritional food to provide varied beneficial effects on human health [75], and concern has been raised from local governments, as well as industrial sectors. Considering this area might benefit from agricultural industrialization of buckwheat grain in the future, the five counties were categorized as Non-dominant Agricultural Producing Zone in the IMFZS.
Carrying out the comparison study offered a test, which proved that the IMFZS of the Panxi Area presented an explicitly corresponding to other major existing zoning schemes. From the innovation sense, on the basis of ensuring the established goals of the existing schemes, the IMFZS described more detailed functional possibility in terms of industrial development, human habitat service, tourism & leisure, and mineral resources supply. Furthermore, the results implied that the integrated scheme formed by the proposed methodology displayed an approach to the higher level of understanding the multi-theme realms of the social, economic, ecological, and environmental, as well as resource elements, from which the identification and assessment of the multifunction attached within the geographical spaces will be benefited from. Hence, the IMFZS for territorial space of Panxi Area provided a robust reference frame for the spatial planning with the attribution of macroscopic and comprehensive as well as specific feasibility.
It also needs to be noted that, with the functional niche theory developing, the evaluation index of IMFZS is supposed to be perfected, comprising some specific negative indicators. In addition, with the continued demand of refining land management, investigating the evaluation and zonation at different scales is worth considering in the future, e.g., the administrative village or small watershed scales.
5. Conclusions
To the best of our knowledge, this research is the first systematic report on the multifunctional zoning of territorial space in the Panxi Area. The methodological innovation of this paper was embodied in the combined methodology, i.e., assessing the territorial space functional significance via the niche breadth models accounting, followed by zoning multifunctional clusters with the K-means cluster analysis assisted by the “dominant function combination”. Here, the innovative approach was carried out to finalize the integrated multifunctional zoning scheme (IMZS) in a regional scale with diversified territorial space functions, such as the Panxi Area.
The rationality test of the Panxi Area’s IMZS obtained was carried out through a comparison analysis between the IMFZS and two major existing spatial planning systems in Panxi: the “Thirteen Five” Development Plan for Panxi Economic Zone (DPEZ) and the Major Function Oriented Zoning (MFOZ) of Sichuan Province. The comparison results witnessed that the IMFZS of Panxi displayed a rather convincing correspondence to the existing major spatial planning schemes in terms of most evaluation units’ development orientations. Especially, the IMFZS of Panxi not only ensured the established goals of the existing panning systems, but also portrayed more specific territorial space functions including industrial development, human habitat service, and tourism & leisure, as well as mineral resources supply. This is supposed to much contribute to the precision socioeconomic & spatial planning design for local scales (referring to the county level administrative regions in this case), who need to consider development directions preferentially standing on their own comparative functional advantages, against the background of an upper geographical scopes (referring to Panxi here).
Author Contributions
J.Z. conceived and designed the research; J.Z., C.L. and F.C. collected, processed and analyzed the data. All authors have read and approved the final manuscript.
Funding
This research was funded by the National Key R&D Program of China (No. 2018YFD1100104), the National Science Foundation of China (No. 41301193), and the Youth Innovation Promotion Association of Chinese Academy of Sciences (2018407).
Conflicts of Interest
The authors declare no conflict of interest.
References
- State Council of the People’s Republic of China. The National Main Function Division-Constructing an Efficient, Coordinated and Sustainable Land and Space Development Pattern [EB/OL]. 8 June 2011/28 April 2014. Available online: http://www.gov.cn (accessed on 11 December 2018).
- Bobylev, N. Mainstreaming sustainable development into a city’s Master plan: A case of urban underground space use. Land Use Policy 2009, 26, 1128–1137. [Google Scholar] [CrossRef]
- Campbell, S. Green cities, growing cities, just cities?: Urban planning and the contradictions of sustainable development. J. Am. Plan. Assoc. 1996, 62, 296–312. [Google Scholar] [CrossRef]
- Godschalk, D.R. Land use planning challenges: Coping with conflicts in visions of sustainable development and livable communities. J. Am. Plan. Assoc. 2004, 70, 5–13. [Google Scholar] [CrossRef]
- Persson, C. Deliberation or doctrine? Land use and spatial planning for sustainable development in Sweden. Land Use Policy 2013, 34, 301–313. [Google Scholar] [CrossRef]
- Jane Silberstein, M.A.; Maser, C. Land-Use Planning for Sustainable Development; CRC Press: Boca Raton, FL, USA, 2014. [Google Scholar]
- Albrechts, L. Strategic (spatial) planning reexamined. Environ. Plan. B 2016, 31, 743–758. [Google Scholar] [CrossRef]
- Moilanen, A.; Arponen, A. Administrative regions in conservation: Balancing local priorities with regional to global preferences in spatial planning. Biol. Conserv. 2011, 144, 1719–1725. [Google Scholar] [CrossRef]
- Brown, G.; Glanz, H. Identifying potential NIMBY and YIMBY effects in general land use planning and zoning. Appl. Geogr. 2018, 99, 1–11. [Google Scholar] [CrossRef]
- Gong, J.; Jiang, C.; Chen, W.; Chen, X.; Liu, Y. Spatiotemporal dynamics in the cultivated and built-up land of Guangzhou: Insights from zoning. Habitat Int. 2018, 82, 104–112. [Google Scholar] [CrossRef]
- Shertzer, A.; Twinam, T.; Walsh, R.P. Zoning and the economic geography of cities. J. Urban Econ. 2018, 105, 20–39. [Google Scholar] [CrossRef]
- Hales, R. Land use development planning and the notion of sustainable development: Exploring constraint and facilitation within the English planning system. J. Environ. Plan. Manag. 2000, 43, 99–121. [Google Scholar] [CrossRef]
- Rossi-Hansberg, E. Optimal urban land use and zoning. Rev. Econ. Dyn. 2004, 7, 69–106. [Google Scholar] [CrossRef]
- Talen, E.; Anselin, L.; Lee, S.; Koschinsky, J. Looking for logic: The zoning—Land use mismatch. Landsc. Urban Plan. 2016, 152, 27–38. [Google Scholar] [CrossRef]
- Lu, W.; Liu, J.; Xiang, X.; Song, W.; McIlgorm, A. A comparison of marine spatial planning approaches in China: Marine functional zoning and the marine ecological red line. Mar. Policy 2015, 62, 94–101. [Google Scholar] [CrossRef]
- Gallent, N.; Kim, K.S. Land zoning and local discretion in the Korean planning system. Land Use Policy 2001, 18, 233–243. [Google Scholar] [CrossRef]
- Fan, J.; Li, P. The scientific foundation of Major Function Oriented Zoning in China. J. Geogr. Sci. 2009, 19, 515–531. [Google Scholar] [CrossRef]
- Nel, V. A better zoning system for South Africa? Land Use Policy 2016, 55, 257–264. [Google Scholar] [CrossRef]
- Wiggering, H.; Dalchow, C.; Glemnitz, M.; Helming, K.; Müller, K.; Schultz, A.; Stachow, U.; Zander, P. Indicators for multifunctional land use—Linking socio-economic requirements with landscape potentials. Ecol. Indic. 2006, 6, 238–249. [Google Scholar] [CrossRef]
- Zheng, D.; Ge, Q.; Zhang, X.; He, F.; Wu, S. Regionalization in China: Retrospect and prospect. Geogr. Res. 2005, 24, 330–344. (In Chinese) [Google Scholar]
- Helming, K.; Wiggering, H. Sustainable Development of Multifucntional Landscapes; Springer: Berlin/Heidelberg, Germany, 2003. [Google Scholar]
- Malek, Ž.; Verburg, P.H.; Geijzendorffer, I.R.; Bondeau, A.; Cramer, W. Global change effects on land management in the Mediterranean region. Glob. Environ. Chang. 2018, 50, 238–254. [Google Scholar] [CrossRef]
- Hersperger, A.M.; Langhamer, D.; Dalang, T. Inventorying human-made objects: A step towards better understanding land use for multifunctional planning in a periurban Swiss landscape. Landsc. Urban Plan. 2012, 105, 307–314. [Google Scholar] [CrossRef]
- Ma, W.; Jiang, G.; Li, W.; Zhou, T.; Zhang, R. Multifunctionality assessment of the land use system in rural residential areas: Confronting land use supply with rural sustainability demand. J. Environ. Manag. 2019, 231, 73–85. [Google Scholar] [CrossRef]
- Johansen, P.H.; Ejrnæs, R.; Kronvang, B.; Olsen, J.V.; Præstholm, S.; Schou, J.S. Pursuing collective impact: A novel indicator-based approach to assessment of shared measurements when planning for multifunctional land consolidation. Land Use Policy 2018, 73, 102–114. [Google Scholar] [CrossRef]
- Liu, C.; Xu, Y.; Huang, A.; Liu, Y.; Wang, H.; Lu, L.; Sun, P.; Zheng, W. Spatial identification of land use multifunctionality at grid scale in farming-pastoral area: A case study of Zhangjiakou City, China. Habitat Int. 2018, 76, 48–61. [Google Scholar] [CrossRef]
- Crossman, N.D.; Bryan, B.A. Identifying cost-effective hotspots for restoring natural capital and enhancing landscape multifunctionality. Ecol. Econ. 2009, 68, 654–668. [Google Scholar] [CrossRef]
- Dewi, S.; van Noordwijk, M.; Ekadinata, A.; Pfund, J.-L. Protected areas within multifunctional landscapes: Squeezing out intermediate land use intensities in the tropics? Land Use Policy 2013, 30, 38–56. [Google Scholar] [CrossRef]
- O’Farrell, P.J.; Anderson, P.M.L. Sustainable multifunctional landscapes: A review to implementation. Curr. Opin. Environ. Sustain. 2010, 2, 59–65. [Google Scholar] [CrossRef]
- Marzban, S.; Allahyari, M.S.; Damalas, C.A. Exploring farmers’ orientation towards multifunctional agriculture: Insights from northern Iran. Land Use Policy 2016, 59, 121–129. [Google Scholar] [CrossRef]
- Rossing, W.A.H.; Zander, P.; Josien, E.; Groot, J.C.J.; Meyer, B.C.; Knierim, A. Integrative modelling approaches for analysis of impact of multifunctional agriculture: A review for France, Germany and the Netherlands. Agric. Ecosyst. Environ. 2007, 120, 41–57. [Google Scholar] [CrossRef]
- Groot, J.C.; Rossing, W.A.; Tichit, M.; Turpin, N.; Jellema, A.; Baudry, J.; Verburg, P.H.; Doyen, L.; van de Ven, G.W. On the contribution of modelling to multifunctional agriculture: Learning from comparisons. J. Environ. Manag. 2009, 90 (Suppl. 2), S147–S160. [Google Scholar] [CrossRef] [Green Version]
- Pinto-Correia, T.; Guiomar, N.; Guerra, C.A.; Carvalho-Ribeiro, S. Assessing the ability of rural areas to fulfil multiple societal demands. Land Use Policy 2016, 53, 86–96. [Google Scholar] [CrossRef] [Green Version]
- Holmes, J. Impulses towards a multifunctional transition in rural Australia: Gaps in the research agenda. J. Rural Stud. 2006, 22, 142–160. [Google Scholar] [CrossRef]
- Mouchet, M.A.; Paracchini, M.L.; Schulp, C.J.E.; Stürck, J.; Verkerk, P.J.; Verburg, P.H.; Lavorel, S. Bundles of ecosystem (dis)services and multifunctionality across European landscapes. Ecol. Indic. 2017, 73, 23–28. [Google Scholar] [CrossRef]
- Bomans, K.; Steenberghen, T.; Dewaelheyns, V.; Leinfelder, H.; Gulinck, H. Underrated transformations in the open space—The case of an urbanized and multifunctional area. Landsc. Urban Plan. 2010, 94, 196–205. [Google Scholar] [CrossRef]
- Godoy, O.; Bartomeus, I.; Rohr, R.P.; Saavedra, S. Towards the Integration of Niche and Network Theories. Trends Ecol. Evol. 2018, 33, 287–300. [Google Scholar] [CrossRef] [Green Version]
- Vandermeer, J.H. Niche theory. Annu. Rev. Ecol. Syst. 1972, 3, 107–132. [Google Scholar] [CrossRef]
- Thakur, M.P.; Wright, A.J. Environmental filtering, niche construction, and trait variability: The missing discussion. Trends Ecol. Evol. 2017, 32, 884–886. [Google Scholar] [CrossRef]
- Han, B.; Wang, R.; Tao, Y.; Gao, H. Urban population agglomeration in view of complex ecological niche: A case study on Chinese prefecture cities. Ecol. Indic. 2014, 47, 128–136. [Google Scholar] [CrossRef] [Green Version]
- Susur, E.; Hidalgo, A.; Chiaroni, D. The emergence of regional industrial ecosystem niches: A conceptual framework and a case study. J. Clean. Prod. 2019, 208, 1642–1657. [Google Scholar] [CrossRef]
- Ruggiero, S.; Martiskainen, M.; Onkila, T. Understanding the scaling-up of community energy niches through strategic niche management theory: Insights from Finland. J. Clean. Prod. 2018, 170, 581–590. [Google Scholar] [CrossRef] [Green Version]
- Salvati, L. The ‘niche’ city: A multifactor spatial approach to identify local-scale dimensions of urban complexity. Ecol. Indic. 2018, 94, 62–73. [Google Scholar] [CrossRef]
- Yu, Z.; Xiao, L.; Chen, X.; He, Z.; Guo, Q.; Vejre, H. Spatial restructuring and land consolidation of urban-rural settlement in mountainous areas based on ecological niche perspective. J. Geogr. Sci. 2018, 28, 131–151. [Google Scholar] [CrossRef]
- Bajocco, S.; Ceccarelli, T.; Smiraglia, D.; Salvati, L.; Ricotta, C. Modeling the ecological niche of long-term land use changes: The role of biophysical factors. Ecol. Indic. 2016, 60, 231–236. [Google Scholar] [CrossRef]
- Alahuhta, J.; Virtala, A.; Hjort, J.; Ecke, F.; Johnson, L.B.; Sass, L.; Heino, J. Average niche breadths of species in lake macrophyte communities respond to ecological gradients variably in four regions on two continents. Oecologia 2017, 184, 219–235. [Google Scholar] [CrossRef]
- Qu, Y.; Zhang, F.; Jiang, G.; Guang, X.; Guo, L. Suitability evaluation and subarea control and regulation of rural residential land based on niche. Trans. Chin. Soc. Agric. Eng. 2010, 26, 290–296. (In Chinese) [Google Scholar]
- Peng, Y.; Yan, L. Competition relationship among tourist cities in Zhejiang province based on the niche theories. Acta Ecol. Sin. 2015, 35, 2195–2205. (In Chinese) [Google Scholar]
- Meng, L.; Zheng, X.; Zhao, L.; Deng, J. Land-use functional regionalization based on niche-fitness model. Trans. Chin. Soc. Agric. Eng. 2011, 27, 282–287. (In Chinese) [Google Scholar]
- Wang, W.; Nian, P.; Zhu, D.; Zhang, W. Analysis of regional multifunction evaluation and evolution based on niche breadth model: Taking Beijing as an example. World Reg. Stud. 2016, 25, 66–77. (In Chinese) [Google Scholar]
- Nian, P.; Cai, Y.; Xie, X.; Zhang, W.; Ma, S. Geographical space comprehensive function zoning in Hunan Province based on niche theory. Resour. Sci. 2014, 36, 1958–1968. (In Chinese) [Google Scholar]
- Zhang, B.; Mo, S.; Tan, Y.; Xiao, F.; Wu, H. Urbanization and de–urbanization in mountain regions of China. Mt. Res. Dev. 2004, 24, 206–209. [Google Scholar]
- Liu, H.; Zhou, Z.; Tao, H.; Yu, D. Comprehensive evaluation of mineral resource exploration of Panxi Area based on FAHP. Sci. Technol. Man. Land Resour. 2014, 31, 34–40. (In Chinese) [Google Scholar]
- Wang, J.; Guo, K.; Liu, H.; An, J. Advantages and disadvantages of mineral resources and the level of protection in Panxi region. Geol. Sci. Technol. Inform. 2014, 33, 143–148. (In Chinese) [Google Scholar]
- Râmniceanu, I.; Ackrill, R. EU rural development policy in the new member states: Promoting multifunctionality? J. Rural. Stud. 2007, 23, 416–429. [Google Scholar] [CrossRef] [Green Version]
- Leibold, M.A. The niche concept revisited: Mechanistic models and community context. Ecology 1995, 76, 1371–1382. [Google Scholar] [CrossRef]
- Chen, M.; Liu, W.; Lu, D. Challenges and the way forward in China’s new-type urbanization. Land Use Policy 2016, 55, 334–339. [Google Scholar] [CrossRef] [Green Version]
- Yu, C.; de Jong, M.; Cheng, B. Getting depleted resource-based cities back on their feet again—The example of Yichun in China. J. Clean. Prod. 2016, 134, 42–50. [Google Scholar] [CrossRef]
- Li, Z.; Marinova, D.; Guo, X.; Gao, Y. Evaluating pillar industry’s transformation capability: A case study of two Chinese steel-based cities. PLoS ONE 2015, 10, e0139576. [Google Scholar] [CrossRef]
- Shao, H.; Liu, M.; Shao, Q.; Sun, X.; Wu, J.; Xiang, Z.; Yang, W. Research on eco-environmental vulnerability evaluation of the Anning River Basin in the upper reaches of the Yangtze River. Environ. Earth Sci. 2014, 72, 1555–1568. [Google Scholar] [CrossRef]
- Costanza, R.; d’Arge, R.; De Groot, R.; Farber, S.; Grasso, M.; Hannon, B.; Limburg, K.; Naeem, S.; O’neill, R.V.; Paruelo, J.; et al. The value of the world’s ecosystem services and natural capital. Nature 1997, 387, 8. [Google Scholar] [CrossRef]
- Xie, G.; Zhang, C.; Zhang, L.; Chen, W.; Li, S. Improvement of the evaluation method for ecosystem service value based on per unit area. J. Nat. Resour. 2015, 30, 1243–1254. (In Chinese) [Google Scholar]
- Xie, G.; Zhen, L.; Lu, C.; Xiao, Y.; Chen, C. Expert knowledge based valuation method of ecosystem services in China. J. Nat. Resour. 2008, 23, 911–919. (In Chinese) [Google Scholar]
- Liu, C.; Zhang, J.; Zhao, Y.; Zhu, C. Significance evaluation for territorial functions based on niche theory: A case study on Panxi Area. City Plan. Rev. 2018, 42, 84–93. (In Chinese) [Google Scholar]
- Pérez-Soba, M.; Petit, S.; Jones, L.; Bertrand, N.; Briquel, V.; Omodei-Zorini, L.; Contini, C.; Helming, K.; Farrington, J.; Tinacci Mossello, M.; et al. Land use functions—A multifunctionality approach to assess the impact of land use change on land use sustainability. In Sustainability Impact Assessment of Land Use Changes; Helming, K., Tabbush, P., Pérez–Soba, M., Eds.; Springer: Berlin/Heidelberg, Germany, 2008; pp. 375–404. [Google Scholar]
- Hein, L.; Koppen, K.V.; DE-Groot, R.S.; Van-Ierland, E.C. Spatial scales, stakeholders and the valuation of ecosystem services. Ecol. Econ. 2006, 57, 209–228. [Google Scholar] [CrossRef]
- Smith, E.P. Niche breadth, resource availability, and inference. Ecology 1982, 63, 1675–1681. [Google Scholar] [CrossRef]
- Yu, S. Multivariate measure of niche breadth. Acta Ecol. Sin. 1991, 14, 32–39. (In Chinese) [Google Scholar]
- Luo, X.; Zeng, F. A preliminary research on the use of the ecostate-ecorole theory in the study of urban–rural ecotone: A Case Study of Nanjing. Econ. Geogr. 2000, 20, 55–58. (In Chinese) [Google Scholar]
- Wang, R.; Zhao, G.; Yu, Z.; Zhang, Y.; Zhang, H. Assessmen of land use effects on environmental vulnerability by ecological niche suitability model. T. Chin. Soc. Agric. Eng. 2012, 28, 218–224. (In Chinese) [Google Scholar]
- Kanungo, T.; Mount, D.M.; Netanyahu, N.S.; Piatko, C.D.; Silverman, R.; Wu, A. An efficient k-means clustering algorithm: Analysis and implementation. IEEE. Trans. Pattern Anal. 2002, 24, 881–892. [Google Scholar] [CrossRef]
- Hartigan, J.A.; Wong, M.A. Algorithm AS 136: A k-means clustering algorithm. Appl. Stat. 1979, 28, 100–108. [Google Scholar] [CrossRef]
- Hu, Y.; Liu, B.; Song, C.; He, X. Soil erosion estimation in Liangshan mountain areas of Sichuan Province based on USLE model. Bull. Soil Water Conserv. 2016, 36, 232–236. (In Chinese) [Google Scholar]
- Peng, G.; Cao, Y.; Ruan, J. Adaptability regionalization of spring buckwheat based on weights similarity to climatic factor in Liangshan Prefecture. J. Southwest Univ. 2016, 38, 1–8. (In Chinese) [Google Scholar]
- Giménez-Bastida, J.A.; Zieliński, H. Buckwheat as a functional food and its effects on health. J. Agric. Food Chem. 2015, 63, 7896–7913. [Google Scholar] [CrossRef] [PubMed]
Figure 1.
Location of the study area.

Figure 2.
Flow chart of the methodology.

Figure 3.
Two sorts of grades for functional significance of territorial spaces (FSoTS) in the Panxi Area.
Figure 3.
Two sorts of grades for functional significance of territorial spaces (FSoTS) in the Panxi Area.


Figure 4.
The distribution for Comprehensive Evaluation Value (CEV) of functional significance of territorial spaces (FSoTS) in the Panxi Area.
Figure 4.
The distribution for Comprehensive Evaluation Value (CEV) of functional significance of territorial spaces (FSoTS) in the Panxi Area.

Figure 5.
Integrated multifunctional zoning scheme (IMFZS) of territorial space for the Panxi Area.


Table 1.
The functional classification of territorial space and index system for significance evaluation.
Table 1.
The functional classification of territorial space and index system for significance evaluation.
| Function | Code | Indicator (unit) | Weight | Function | Code | Indicator (unit) | Weight |
|---|---|---|---|---|---|---|---|
| Agricultural production | A1 | Cultivated land area (hm2) | 0.1522 | Habitat service | H1 | Per capita savings of urban residents (CNY) | 0.1364 |
| A2 | Food production (t) | 0.0870 | H2 | Public finance expenditure (CNY) | 0.1592 | ||
| A3 | Cash crop production (t) | 0.1087 | H3 | Number of teachers per 1000 residents (person) | 0.1136 | ||
| A4 | Per capita grain production (kg) | 0.1522 | H4 | Number of hospital beds per 1000 residents (PCS) | 0.0909 | ||
| A5 | Grain yield per unit area (t/hm2) | 0.1739 | H5 | Urbanization rate (%) | 0.2045 | ||
| A6 | Agricultural output value (CNY) | 0.1956 | H6 | Road network density (Dimensionless) | 0.1136 | ||
| A7 | Total power of agricultural machinery (KW) | 0.1304 | H7 | Forest coverage (%) | 0.1818 | ||
| Industrial development | I1 | Secondary and tertiary industrial output value (CNY) | 0.1800 | Tourism & leisure | T1 | Total tourism revenue (CNY) | 0.3138 |
| I2 | GDP proportion of secondary and tertiary industrial output value (%) | 0.1600 | T2 | Number of tourist (PCS) | 0.3464 | ||
| I3 | Number of industrial enterprises (PCS) | 0.1200 | T3 | Number of scenic spots above grade 3A (PCS) | 0.3398 | ||
| I4 | Total investment in fixed assets (CNY) | 0.1000 | Mineral resources supply | M1 | Accounting for distribution area of major mineral resources (%) | 0.4578 | |
| I5 | Industrial output value above the scale (CNY) | 0.1200 | M2 | Major mineral dominance (Dimensionless) | 0.5422 | ||
| I6 | Actual use of foreign capital (dollar) | 0.0800 | Ecosystem services | E1 | Hydrological regulation (Dimensionless) | 0.2500 | |
| I7 | Grade and scale of industrial park (Dimensionless) | 0.1000 | E2 | Soil conservation (Dimensionless) | 0.2500 | ||
| I8 | Secondary and tertiary industries output value per hectare construction land (CNY/hm2) | 0.1400 | E3 | Aesthetic value (Dimensionless) | 0.2500 | ||
| E4 | Biodiversity (Dimensionless) | 0.2500 |
Table 2.
The Comprehensive Evaluation Value (CEV) of functional significance of territorial spaces (FSoTS) and their significance grades in the Panxi Area.
Table 2.
The Comprehensive Evaluation Value (CEV) of functional significance of territorial spaces (FSoTS) and their significance grades in the Panxi Area.
| Evaluation unit | Agricultural Production | Industrial Development | Habitat Service | Tourism & Leisure | Mineral Resources Supply | Ecosystem Services | ||||||
|---|---|---|---|---|---|---|---|---|---|---|---|---|
| CEV | Grades | CEV | Grades | CEV | Grades | CEV | Grades | CEV | Grades | CEV | Grades | |
| Dongqu | 0.0000 | 4 | 1.0000 | 1 | 1.0000 | 1 | 0.1848 | 3 | 0.3435 | 3 | 0.0000 | 4 |
| Xiqu | 0.1270 | 3 | 0.4523 | 2 | 0.7449 | 1 | 0.2363 | 3 | 0.4435 | 3 | 0.0002 | 4 |
| Jinyang | 0.1813 | 3 | 0.0893 | 4 | 0.2123 | 3 | 0.0094 | 4 | 0.6195 | 2 | 0.0644 | 4 |
| Ningnan | 0.3152 | 2 | 0.2010 | 3 | 0.3721 | 2 | 0.0105 | 4 | 0.4493 | 3 | 0.0810 | 4 |
| Butuo | 0.1883 | 3 | 0.0435 | 4 | 0.0000 | 4 | 0.0001 | 4 | 0.3802 | 3 | 0.0709 | 4 |
| Puge | 0.2411 | 3 | 0.0520 | 4 | 0.1108 | 4 | 0.1716 | 3 | 0.1164 | 4 | 0.0832 | 4 |
| Miyi | 0.3347 | 2 | 0.3851 | 2 | 0.5502 | 1 | 0.2401 | 3 | 0.8034 | 1 | 0.1292 | 3 |
| Ganluo | 0.2212 | 3 | 0.0715 | 4 | 0.2544 | 3 | 0.0043 | 4 | 0.7302 | 2 | 0.1102 | 3 |
| Xide | 0.2313 | 3 | 0.0408 | 4 | 0.2019 | 3 | 0.0104 | 4 | 0.3350 | 3 | 0.0904 | 4 |
| Renhe | 0.3159 | 2 | 0.7434 | 2 | 0.3136 | 3 | 0.0874 | 4 | 0.8458 | 1 | 0.1182 | 3 |
| Dechang | 0.3735 | 2 | 0.2004 | 3 | 0.2934 | 3 | 0.0106 | 4 | 0.5861 | 2 | 0.1284 | 3 |
| Yuexi | 0.3333 | 2 | 0.0564 | 4 | 0.1548 | 4 | 0.0112 | 4 | 0.1989 | 4 | 0.0946 | 4 |
| Meigu | 0.1865 | 3 | 0.0712 | 4 | 0.1482 | 4 | 0.0069 | 4 | 0.0000 | 4 | 0.1077 | 3 |
| Xichang | 0.9801 | 1 | 0.9884 | 2 | 0.8428 | 1 | 1.0000 | 1 | 0.7333 | 2 | 0.1505 | 3 |
| Zhaojue | 0.2631 | 3 | 0.0000 | 4 | 0.0162 | 4 | 0.0127 | 4 | 0.0026 | 4 | 0.1058 | 3 |
| Yanbian | 0.2556 | 3 | 0.5486 | 2 | 0.4071 | 2 | 0.3756 | 2 | 0.8162 | 1 | 0.1713 | 2 |
| Leibo | 0.2710 | 3 | 0.1697 | 3 | 0.4248 | 2 | 0.0072 | 4 | 0.4125 | 3 | 0.1496 | 3 |
| Huidong | 0.8174 | 1 | 0.1749 | 3 | 0.2792 | 3 | 0.0000 | 4 | 0.9121 | 1 | 0.1642 | 2 |
| Mianning | 0.4700 | 2 | 0.2510 | 3 | 0.2337 | 3 | 0.3453 | 2 | 0.6501 | 2 | 0.2554 | 2 |
| Huili | 1.0000 | 1 | 0.4641 | 2 | 0.3193 | 2 | 0.0240 | 4 | 1.0000 | 1 | 0.2515 | 2 |
| Yanyuan | 0.5746 | 2 | 0.2100 | 3 | 0.1321 | 4 | 0.1599 | 3 | 0.5612 | 2 | 0.5184 | 1 |
| Muli | 0.1738 | 3 | 0.1379 | 3 | 0.2502 | 3 | 0.0011 | 4 | 0.5698 | 2 | 1.0000 | 1 |
Table 3.
The functional combination for each evaluation unit in the Panxi Area.
| District | Code | Multifunction | District | Code | Multifunction |
|---|---|---|---|---|---|
| Dongqu | I1H1 | Industrial development, Habitat service | Yuexi | A2 | Agricultural production |
| Xiqu | I2H1 | Industrial development, Habitat service | Meigu | N-S | Non-dominant (Agricultural production, Ecosystem services) |
| Jinyang | M2 | Mineral resources supply | Xichang | A1I2H1T1M2 | Agricultural production, Industrial development, Habitat service, Tourism & leisure, Mineral resources supply |
| Ningnan | A2H2 | Agricultural production, Habitat service | Zhaojue | N-S | Non-dominant (Agricultural production, Ecosystem services) |
| Butuo | N-S | Non-dominant (Agricultural production, Mineral resources supply) | Yanbian | I2H2T2M1E2 | Industrial development, Habitat service, Tourism & leisure, Mineral resources supply, Ecosystem services |
| Puge | N-S | Non-dominant (Agricultural production, Tourism & leisure) | Leibo | H2 | Habitat service |
| Miyi | A2I2H1M1 | Agricultural production, Industrial development, Habitat service, Mineral resources supply | Huidong | A1M1E2 | Agricultural production, Mineral resources supply, Ecosystem services |
| Ganluo | M2 | Mineral resources supply | Mian-ning | A2T2M2E2 | Agricultural production, Tourism & leisure, Mineral resources supply, Ecosystem services |
| Xide | N-S | Non-dominant (Agricultural production, Tourism & leisure) | Huili | A1I2H2M1E2 | Agricultural production, Industrial development, Habitat service, Mineral resources supply, Ecosystem services |
| Renhe | A2I2M1 | Agricultural production, Industrial development, Mineral resources supply, | Yanyuan | A2M2E1 | Agricultural production, Mineral resources supply, Ecosystem services |
| De-chang | A2M2 | Agricultural production, Mineral resource supply | Muli | M2E1 | Mineral resources supply, Ecosystem services |
Table 4.
The optimal clustering output from K-Means Clustering for the integrated multifunctional zoning scheme (IMFZS) of the Panxi Area.
Table 4.
The optimal clustering output from K-Means Clustering for the integrated multifunctional zoning scheme (IMFZS) of the Panxi Area.
| Function | 4 Categories | 5 Categories | 6 Categories | 7 Categories | 8 Categories | 9 Categories | 10 Categories | 11 Categories |
|---|---|---|---|---|---|---|---|---|
| F Test | F Test | F Test | F Test | F Test | F Test | F Test | F Test | |
| Agricultural production | 0.008 | 0.010 | 0.017 | 0.004 | 0.005 | 0.009 | 0.001 | 0.001 |
| Industrial development | 0.000 | 0.000 | 0.000 | 0.000 | 0.000 | 0.000 | 0.001 | 0.000 |
| Habitat service | 0.000 | 0.000 | 0.000 | 0.000 | 0.000 | 0.000 | 0.000 | 0.000 |
| Tourism & leisure | 0.003 | 0.000 | 0.000 | 0.000 | 0.000 | 0.000 | 0.000 | 0.000 |
| Mineral resources supply | 0.000 | 0.001 | 0.000 | 0.000 | 0.000 | 0.000 | 0.000 | 0.000 |
| Ecosystem services | 0.000 | 0.001 | 0.001 | 0.000 | 0.001 | 0.000 | 0.001 | 0.002 |
Table 5.
The integrated multifunctional zoning schemes (IMFZS) of territorial space for the Panxi Area.
Table 5.
The integrated multifunctional zoning schemes (IMFZS) of territorial space for the Panxi Area.
| Multifunctional Zone | Evaluation Unit |
|---|---|
| Industrial development-Habitat service | Dongqu, Xiqu, Leibo |
| Agricultural production-Industrial development-Habitat service-Mineral resources supply | Miyi, Renhe, Huili, Yuexi, Ningnan |
| Agricultural production-Mineral resources supply-Ecosystem services | Mianning, Huidong, Dechang |
| Non-dominant (Agricultural Producing) | Butuo, Puge, Xide, Meigu, Zhaojue |
| Mineral resources supply-Ecosystem services | Yanyuan, Muli, Jinyang, Ganluo |
| Agricultural production-Industrial development-Habitat service-Tourism & leisure -Mineral resources supply | Xichang |
| Industrial development-Habitat service-Tourism & leisure-Mineral resources supply-Ecosystem services | Yanbian |
Table 6.
The spatial consistency between integrated multifunctional zoning scheme (IMFZS) and Development Plan for Panxi Economic Zone (DPEZ) in the Panxi Area.
Table 6.
The spatial consistency between integrated multifunctional zoning scheme (IMFZS) and Development Plan for Panxi Economic Zone (DPEZ) in the Panxi Area.
| Zonation of the DPEZ | Number of Evaluation Units | Corresponding Functions in the IMFZS | Number of Consistent Evaluation Units |
|---|---|---|---|
| National Strategic Resources Innovation Pilot | 11 | Mineral resources supply or Industrial development | 11 |
| National Ecological Function Zone of Chuan-Dian Forest & Biodiversity | 2 | Ecosystem services | 2 |
| Ecological Function Zone for Soil & Water Conservation and Biodiversity of Daxiao Liangshan | 10 | Ecosystem services | 10 |
| Major Planting Base | 11 | Agricultural production | 8 |
| Health & Wellness Industry of Sunshine | 10 | Habitat or Tourism & leisure | 8 |
Table 7.
The spatial consistency between integrated multifunctional zoning scheme (IMFZS) and Major Function Oriented Zooming (MFOZ) in the Panxi Area.
Table 7.
The spatial consistency between integrated multifunctional zoning scheme (IMFZS) and Major Function Oriented Zooming (MFOZ) in the Panxi Area.
| Zonation of the MFOZ | Corresponding Functions in the IMFZS | No. of Consistent Evaluation Units | ||
|---|---|---|---|---|
| Name | Level | No. of Evaluation Units | ||
| Development-prioritized | Provincial | 7 | Habitat service, or Industrial development, or Mineral resource supply | 7 |
| Major Grain Producing | National | 3 | Agricultural production | 2 |
| Key Ecological Function | Provincial | 10 | Ecosystem services | 10 |
| National | 2 | Ecosystem services | 2 | |
© 2019 by the authors. Licensee MDPI, Basel, Switzerland. This article is an open access article distributed under the terms and conditions of the Creative Commons Attribution (CC BY) license (http://creativecommons.org/licenses/by/4.0/).
Share and Cite
MDPI and ACS Style
Zhang, J.; Liu, C.; Chang, F. A New Approach for Multifunctional Zoning of Territorial Space: The Panxi Area of the Upper Yangtze River in China Case Study. Sustainability 2019, 11, 2325. https://doi.org/10.3390/su11082325
AMA Style
Zhang J, Liu C, Chang F. A New Approach for Multifunctional Zoning of Territorial Space: The Panxi Area of the Upper Yangtze River in China Case Study. Sustainability. 2019; 11(8):2325. https://doi.org/10.3390/su11082325
Chicago/Turabian StyleZhang, Jifei, Chunyan Liu, and Fei Chang. 2019. "A New Approach for Multifunctional Zoning of Territorial Space: The Panxi Area of the Upper Yangtze River in China Case Study" Sustainability 11, no. 8: 2325. https://doi.org/10.3390/su11082325
Note that from the first issue of 2016, this journal uses article numbers instead of page numbers. See further details here.