Standalone Renewable Energy and Hydrogen in an Agricultural Context: A Demonstrative Case


1
Intergia Energía Sostenible S.L., Av. Cataluña 19, 50014 Zaragoza, Spain
2
Department of Electrical Engineering, University of Zaragoza, Maria de Luna 3, 50018 Zaragoza, Spain
*
Author to whom correspondence should be addressed.
Sustainability 2019, 11(4), 951; https://doi.org/10.3390/su11040951
Submission received: 16 January 2019
/
Revised: 1 February 2019
/
Accepted: 11 February 2019
/
Published: 13 February 2019
(This article belongs to the Section Sustainable Agriculture)
Abstract
:Standalone renewable energy is widely used to power irrigation systems. However, in agricultural facilities, electricity from the grid and diesel are also consumed. The design and sizing of renewable generation involves difficulties derived from the different seasonal profiles of production and demand. If the generation is 100% renewable, a considerable energy surplus is usually included. This paper is focused on a renewable energy system, which has been installed in a vineyard, located in the northeast of Spain. With energy from the photovoltaic fields, the wastewater treatment plant of the winery, a drip irrigation system and other ancillary consumptions are fed. The favourable effect of combining consumptions with different seasonal profiles is shown. The existence of some deferrable loads and the energy management strategy result in an aggregate consumption curve that is well suited to production. Besides, the required energy storage is relatively small. The surplus energy is used for the on-site production of hydrogen by the electrolysis of water. The hydrogen refuels a hybrid fuel cell electric vehicle, used for the mobility of workers in the vineyard. In summary, electricity and hydrogen are produced on-site (to meet the energy needs) from 100% renewable sources and without operating emissions.
1. Introduction
On the one hand, the transition to a low-carbon economy is a process that requires the use of energy produced from renewable resources. In fact, the renewable fraction of the grid’s electricity mix is increasing. On the other hand, the ubiquity of some renewable resources, especially solar irradiation, allows electricity to be generated in any location, that is, the so-called distributed generation (DG). Therefore, renewable generators can be connected to the distribution network, preferably at the points where it provides stability to the network parameters, such as voltage and frequency [1]. Despite these favourable effects, the variability of renewable resources may require measures to improve the behaviour of the generators in the face of instabilities [2].
Instead of grid-connected generation, standalone photovoltaic generation is especially well suited to rural and natural areas, where the costs and environmental impacts of power lines are higher. In this way, the on-site production of renewable energy for agricultural uses is a subject widely studied [3], especially photovoltaics in relation to pumping and irrigation [4]. Regarding off-grid renewable energy systems, the variability of solar and wind resources makes it difficult to ensure the satisfaction of the energy demand. To address this, various techniques can be applied, which mainly incorporate short-term or long-term storage [5], hybridize several energy sources [6], and manage the energy demand in the short term [7] and in the long term [8]. As a result, the sizing of an off-grid renewable generation system is not a trivial matter [9,10]. In fact, the systems usually proposed have high fractions of surplus energy or a non-negligible fraction of non-renewable energy.
A simple application is direct coupled solar pumping [11]. In it, the pump is activated according to the solar radiation incident on the photovoltaic panels. Below a certain irradiation threshold, the pump does not work, and the power is lost. Above this threshold, the speed of the pump is a function of the solar irradiation. Consequently, the flow of water is not constant. The limitations are obvious. On the one hand, there is no guarantee regarding the volume of water that is pumped every hour or every day, since this varies according to the weather. On the other hand, this solution is not suitable for pressurized irrigation systems, which require constant flows and pressures. Consequently, direct solar pumping is adequate in several specific cases, such as the filling of accumulation ponds or reservoirs.
The incorporation of storage in batteries allows some of the aforementioned limitations to be overcome [5]. In this way, a stable supply is obtained, which can meet the demand independently of the instantaneous production of energy. In the systems endowed with renewable generation and storage in batteries, the difficulty is that the variability of the production (and in many cases of the demand) requires oversizing the system, as a greater guarantee of supply is required. Moreover, storage in batteries is only feasible in the short term (several days) due to technical and economic limitations.
Solar and wind resources are not only variable in the short term, but also have a strong seasonal variation. The demand for energy can also have a seasonal profile, especially in agricultural activities. Consequently, if the size of the energy system is adequate for the most unfavourable period, for the rest of the year, there will be a considerable energy surplus [12]. This can be alleviated by the long-term storage (months) of surplus energy, for example, in hydrogen. However, the cost of the long-term storage can exceed the savings obtained by not oversizing the system, even if the surplus energy is lost.
A technique to avoid the generation of energy presenting the same variability as the renewable resource is the hybridization of two or more types of generation [6]. The hybridization of photovoltaic panels with wind turbines has been widely proposed. However, both resources are very variable, and in the case of the wind, it is not very predictable and can present long periods, even weeks, of calm. Therefore, for irrigation in various locations of Mediterranean crops, photovoltaic generation is more suitable than photovoltaic-wind hybridization and much better than wind alone. On the other hand, the hybridization of photovoltaic panels with a diesel generator set obtains excellent results and is frequently the optimal solution from the economic point of view [13]. This is because diesel generation is manageable and can provide the necessary power when the photovoltaic generator cannot do it or the battery is empty. However, the price to pay is that a fraction of the energy comes from a non-renewable origin and the supply of fuel to the system must be maintained, even a relatively small amount.
Beyond the supply of energy for pumping or irrigation, RES (renewable energy systems) can be widely applied in rural areas, livestock farms, agro-food industries, housing, rural hotels or even villages. For the sizing of these standalone systems, it is necessary to know the profile of the demand and that of the renewable resource, which are often not well suited to one another.
For the aforementioned facts, at least three very different options exist for the supply of energy for activities in rural areas: A diesel genset, the construction of a power line to the electric grid, or a standalone renewable energy system. Among these three alternatives, the first intensively uses fossil fuels, and the second presents environmental and landscape impacts. As for its profitability, usually the first has a high operating cost, and the second, a high investment cost. Regarding the third solution, standalone renewable generation systems require a specific dimensioning for each case, which does not allow for prior generalizations about their viability or profitability. For this reason, it is interesting to address different types of activities and study their energy demands and other relevant characteristics in order to design and size their renewable generation systems.
One of the relevant economic activities taking place in rural areas is the production of wine. This combines viniculture and winemaking, including various processes with different energy demands, allowing for a more elaborate approach than, for example, only an irrigation system. That is why, in this work and other related works, the wine sector has been taken as a case study. According to data from the OIV (International Organization of Vine and Wine) [14], in 2017, the total world area under vines was 7.534 million ha, and the production of wine was 248 million hl. Regarding the emissions associated with wine production, a study [15] assigned between 0.41 kg and 1.6 kg of CO2 per bottle of standard wine. According to the Methodological recommendations for accounting for GHG (Greenhouse gases) balance in the vitivinicultural sector [16] (p.47), glass, fuel and electricity are by far the major contributors to GHG emission in a winery. As a result, the substitution of the energies used for others of a renewable origin would considerably reduce the emissions associated with the activity of wine production.
The introduction of renewable energies in the wine sector, as in other sectors of activity, is still relatively slow. To facilitate this, it is necessary to adapt the generation systems to the needs of the activity, as well as to increase the information available to the decision-makers, the suppliers of energy systems and other stakeholders [17]. The European project, LIFE REWIND [18], has addressed the incorporation of renewable energy, generated on-site, in the wine industry. Among other actions, a standalone RES has been installed in a Spanish vineyard. This prototype meets two objectives that are difficult to combine in a standalone RES: all the energy comes from renewable sources, specifically photovoltaics, and all of it is harnessed, that is, there is no surplus energy. The purpose of this article is to show the context, configuration and results of the prototype. Some of its characteristics, such as the EMS (Energy management strategy) and the on-site production of hydrogen for use in an agricultural FCHEV (fuel cell hybrid electric vehicle) in the farm itself, are, to the extent of the knowledge of the authors, completely novel.
2. Materials and Methods
The Viñas del Vero winery is located near the town of Barbastro, in the northeast of Spain. In its vineyard, the European project LIFE REWIND has installed a prototype of RES to comply with a demonstrative function: On the one hand, to show and disseminate innovative applications of renewable energy in the wine sector; on the other hand, to carry out tests and studies, including the environmental impact.
The project has followed a process of building a prototype appropriate to a real case, which could be a representative in the wine sector. For this purpose, a series of data were collected (Table 1), to be used to size and design the prototype and determine the possibilities of replication in other cases.
Two ambits with different energy needs have been identified: vineyard and winery. In the vineyards, energy is used for mobility, agricultural machinery and, if necessary, irrigation pumping. The supply of this energy is usually provided by refuelling diesel and, in some cases, by the power grid. As for wineries, energy is used in many processes, both in winemaking and in the business office, if it is located there. This energy is usually supplied by the power grid, except for thermal processes, which are frequently fed by fuels, such as gas and biomass. The demonstrative scope of the prototype of the LIFE REWIND project is limited to electricity for wineries and electricity and diesel for vineyards. The objective is to introduce renewable energy, replacing non-renewable energy sources. For this reason, the objective is not to design an RES for a specific process that requires energy, but for a whole set of applications in wine production activities. The characterization of the demand in different cases of vineyards (irrigation, agricultural machinery and mobility) and wineries has allowed us to identify their profiles, which have a strong seasonal pattern, related to the seasonality of the cropping and winemaking processes. The purpose chosen for the prototype is to provide renewable energy for three uses: the WWTP (wastewater treatment plant) of the winery, a drip irrigation system that uses purified water and an off-road agricultural vehicle. This mix includes several of the most representative processes of vineyard activity, addressing both electricity and diesel. In order to determine the size of the RES, a series of simulation and optimization processes have been carried out, using the iHOGA (Improved Hybrid Optimization by Genetic Algorithms) software [19]. However, some of the design decisions have been made in a different way, that is, to fulfil the aims of the prototype: demonstration and testing. Among other things, this means that the system has not been designed for the economic optimum. In fact, when the LIFE REWIND project was studied in relation to the profitability of the incorporation of renewable energy, models of RES found to be simpler than the prototype were taken into account. For this reason, the present article does not include an economic study of the prototype. The following subsections describe the existing facilities in the vineyard (Section 2.1), the loads and their energy demands (Section 2.2), the criteria followed to configure the prototype (Section 2.3), and finally, the assembled RES (Section 2.4).
2.1. The Existing Facility
The water used by the Viñas del Vero winery is not discarded. All the water used for the processes taking place in the winery is transferred to a WWTP. Finally, the water is used for irrigation in the vineyard. An aerial view of the facility is shown in Figure 1.
First, the effluent water from the winery is collected in a pond, with a capacity of 10,000 m3, where a biological process, which requires oxygen for its activation, degrades the organic content. Two aerators introduce air into the water to increase its oxygen level. Each of them is driven by an electric motor. The presence of oxygen in the water is measured periodically to prevent it from falling below a certain level. The process produces sludge sediment at the bottom of the pond, which is occasionally evacuated by two small electric pumps.
Secondly, the water is pumped (Pump A) to a sand filter that removes much of the residual suspended matter. The filtration is gradual, and at the outlet of the filter, another pump (Pump B) moves the water to an accumulation pond, with a capacity of 900 m3, for irrigation.
Finally, another pump (Pump C) pressurizes the water from the irrigation pond and supplies it to the drip irrigation system. The total annual volume of purified water used for irrigation is 10,000 m3, with little variations every year. Before the implantation of the prototype of the standalone renewable energy system, the power was supplied from non-renewable sources.
The control of aerators and pumps was conducted manually. The irrigation pump had an irrigation timer, whose programming was manually entered on a daily basis.
Regarding agricultural machinery, in the vineyard, there are some tractors and, during the vintage, some grape-harvesting machines. All-terrain vehicles are used for the mobility of workers in the vineyard and from there to the winery. Both the machinery and existing vehicles are powered by diesel.
2.2. The Energy Consumptions and Their Manageability
To analyse the total electricity consumption of the facility, the loads have been grouped into two sets due to their dependence on the water treatment and irrigation processes. One of them includes the loads whose operation is determined by the irrigation demand. The other set includes the loads that maintain the process that takes place in the aeration pond. In addition, the energy demand of an all-terrain vehicle for mobility in the vineyard is considered.
2.2.1. Irrigation and Pumping Loads
From the aeration pond to the irrigation pond, two pumps drive the water successively: A (from the aeration pond to the sand filter) and B (from the sand filter to the irrigation pond). Finally, Pump C pressurizes the water to the drip irrigation system. Therefore, each of the pumps annually moves 10,000 m3 of water, which comes from the aeration pond to be used in irrigation. The drip irrigation system requires a constant flow and pressure. One of the first decisions was to incorporate frequency converters in the pumps. On the one hand, this avoids the high starting current, which the inverters could not support. On the other hand, this ensures that the pumps work at the desired point of their performance curves. As a result, their water flow and power consumption are constant. Therefore, knowing the annual volume of water, the pumping rate, and the power, the annual energy demand of each pump is easily obtained (Table 2). The total yearly electricity demand for pumping and irrigation is 8473 kWh.
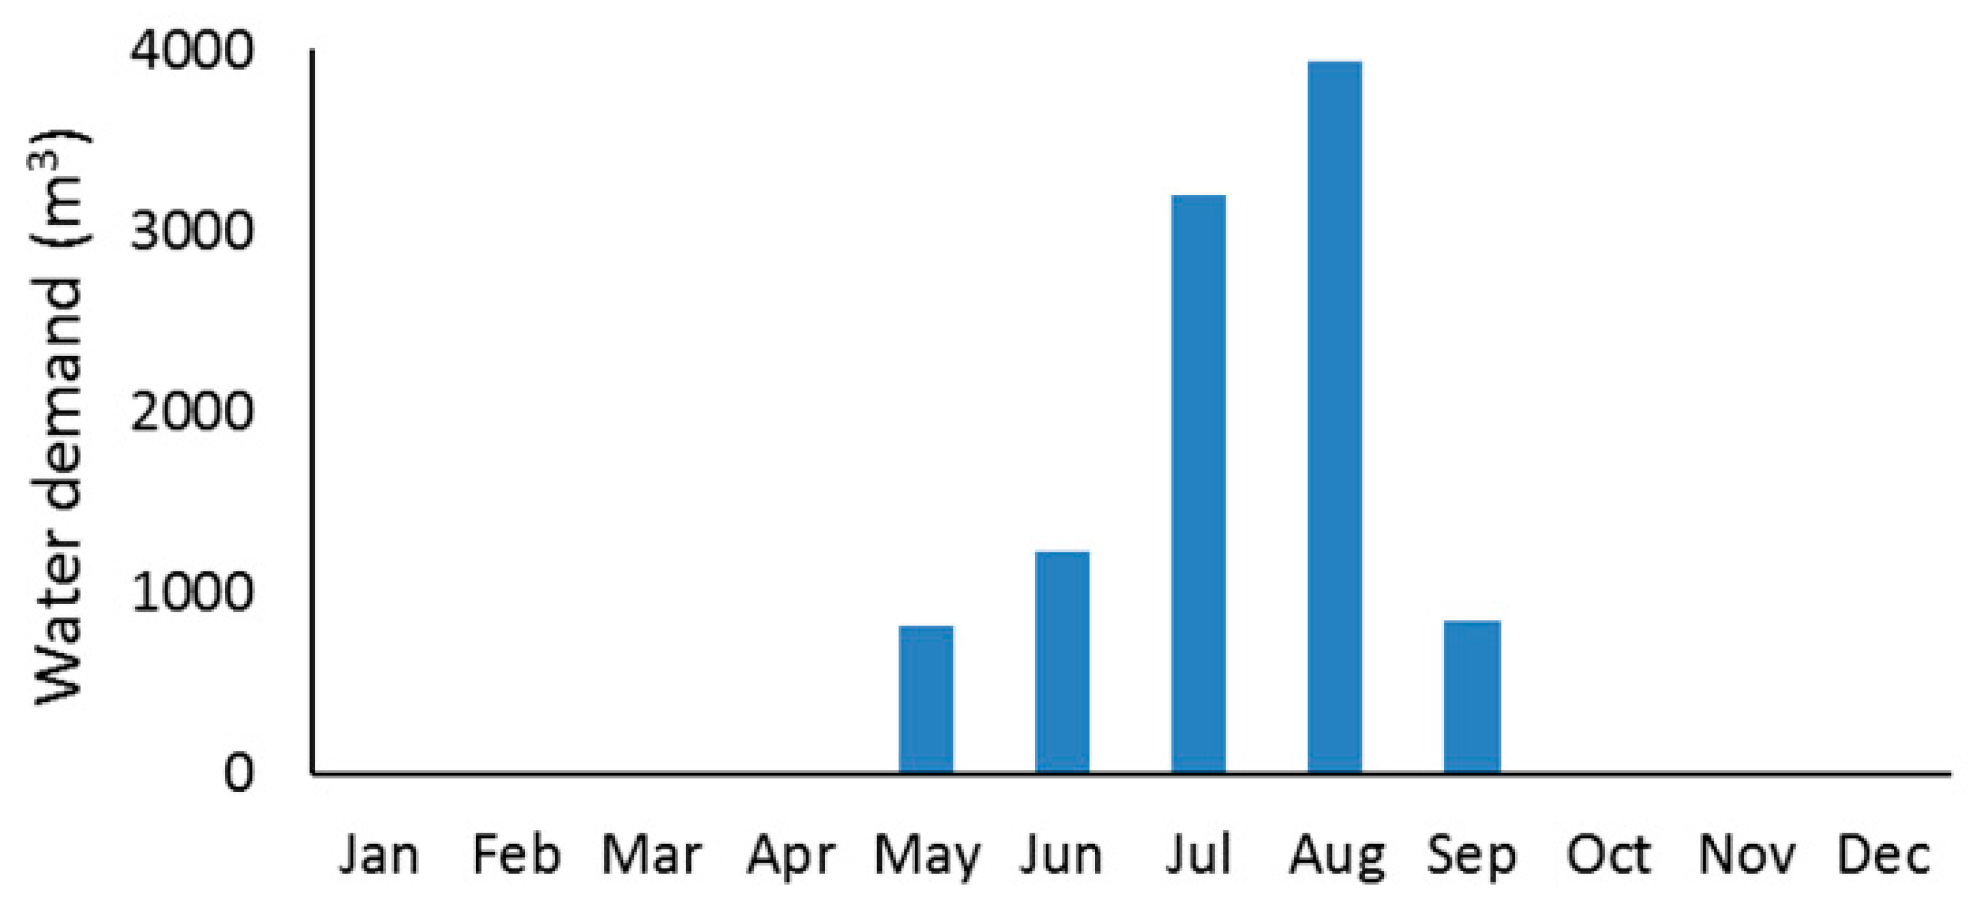
By contrast, the seasonal profile of the demand and its manageability is not so obvious, because of its dependency on agricultural criteria for irrigation. The vine, like other Mediterranean crops, has traditionally been cultivated with rainfall as the only source of water. Some decades ago, drip irrigation was introduced in the vineyards of Spain and other countries. This trend is increasing, partly because the effects of climate change. In the Viñas del Vero vineyard, the volume of water needed is calculated each week, depending on the evolution of the crop, evapotranspiration, rainfall, etc. To know the profile of the irrigation demand throughout the year, historical data were used. The graph of an average year is shown in Figure 2. It is shown that the irrigation season begins in May and ends in September, with its maximum in August. For more than half of the year, the demand is zero.
Regarding demand manageability, since the irrigation decision is made weekly, it is possible to manage it only within this period. That is, the irrigation planned for a week can be divided among the seven days, with some flexibility. In the month of the greatest demand (August), 146 hours of Pump C operation (irrigation) are required, with an average of 4.7 hours a day. Some agricultural studies [20] suggest that, for field crops, such as grapevines, the drip irrigation efficiency is not affected by the time of day of watering, although the manager of the vineyard indicated his preference for operating irrigation at night. Many farmers share this preference, so it is necessary to take it into account.
Pump A is operated to replenish water in the irrigation pond. Therefore, it can be activated at any time while the pond is not full. Pump B is activated automatically when the water driven by Pump A passes through the sand filter.
2.2.2. Aerators and Sludge Pumps
The biological process that takes place in the aeration pond requires the oxygen level in the water to be above a certain limit. Below this level, the process stops. Above this level, the process accelerates to a certain limit. The aerators are responsible for maintaining or increasing the oxygen level. Since the oxygen loss in the pond is relatively slow, the operation of the aerators is not critical. This allows them to be considered deferrable loads, which are not critical in a period of several days, depending on the level of oxygen previously reached. Throughout the day, one or the other, or both, of the aerators can be activated with flexibility. However, according to historical data, to complete the treatment of 10,000 m3 of water, the working time of the aerators must be approximately 3400 h in total. In summary, the annual demand of the aerators is 47,600 kWh, and they can be used with any daily schedule or can even be stopped on some days.
The biological process produces a very slow sedimentation of sludge at the bottom of the aeration pond. During the treatment of 10,000 m3 of water, according to historical data, the working time of the sludge pumps is approximately 150 h each. The evacuation of the sediment is not at all critical, so its activation can be done almost at any time.
The power, operating time and energy demand of each load are shown in Table 3. Regarding the demand manageability, the intra-day flexibility is total. In fact, the aerators are short-term deferrable loads. However, the maintenance of the minimum level of oxygen in the aeration pond limits the long-term deferability. Unfortunately, the available historical data contained only the total number of hours of operation in a year, not on a daily or monthly basis. Consequently, the profile of demand was not available. However, the largest contribution of water from the winery to the aeration pond occurs every year after the vintage, that is, when the irrigation season has ended.
2.2.3. All-Terrain Vehicle
The initial idea of replacing the diesel in mobility by replacing some of the vehicles or agricultural machinery used in the vineyard by others that have electric traction. Because agricultural machinery, such as tractors, is not currently available, an all-terrain diesel car has been chosen, to be replaced by an electric one. After incorporating a fuel cell in order to convert it into a FCHEV, it could be supplied with energy from the RES, either in the form of electricity, or in the form of hydrogen.
In the previous situation, an all-terrain diesel vehicle was being used for the movements of workers from the winery to the vineyard, and within the vineyard. The cycle of operation of the vehicle in a day included short trips at a low or moderate speed and multiple stopping periods. The available historical data only included the refuelling quantities. The users provided additional information to estimate the number of days they use the vehicle. Finally, an average consumption of 6 L of diesel per day and 225 workdays per year was estimated, which totals 1350 L of diesel per year.
2.2.4. Ancillary Loads
In the RES, a lead-acid battery will be in charge of the short-term storage. In addition, there will be a hydrogen production system. Both elements are sensitive to extreme temperatures and especially to freezing. Given its location in a cabin, with a limited thermal insulation, in a countryside where the external temperature varies from −10 °C, on winter nights, to 40 °C in summer, it has been considered necessary to incorporate a heating and cooling system by means of a heat pump. This will prevent the freezing of the water in the electrolyser and will preserve the useful life of the battery and the power electronics. Small water heating resistances will also be incorporated as a safety measure against the risk of freezing in the most critical water pipes. The power of the heat pump is 2 kW. Its estimated energy consumption is 3200 kWh/year, obviously with a very seasonal profile.
The RES will also incorporate a control system. Its functions will be the control of the loads according to the EMS, the control of the system of production of hydrogen, the reception of orders from the operator, the communications, and the storage of data from the sensors. This system will work at all times, with a stable power of approximately 0.22 kW, and therefore, its estimated consumption is 1927 kWh/year.
2.3. Configuration of the Renewable Energy System
The next sub-subsections describe, in a non-exhaustive way, the criteria followed in the configuration and sizing of the RES.
2.3.1. Renewable Resources and Energy Generation
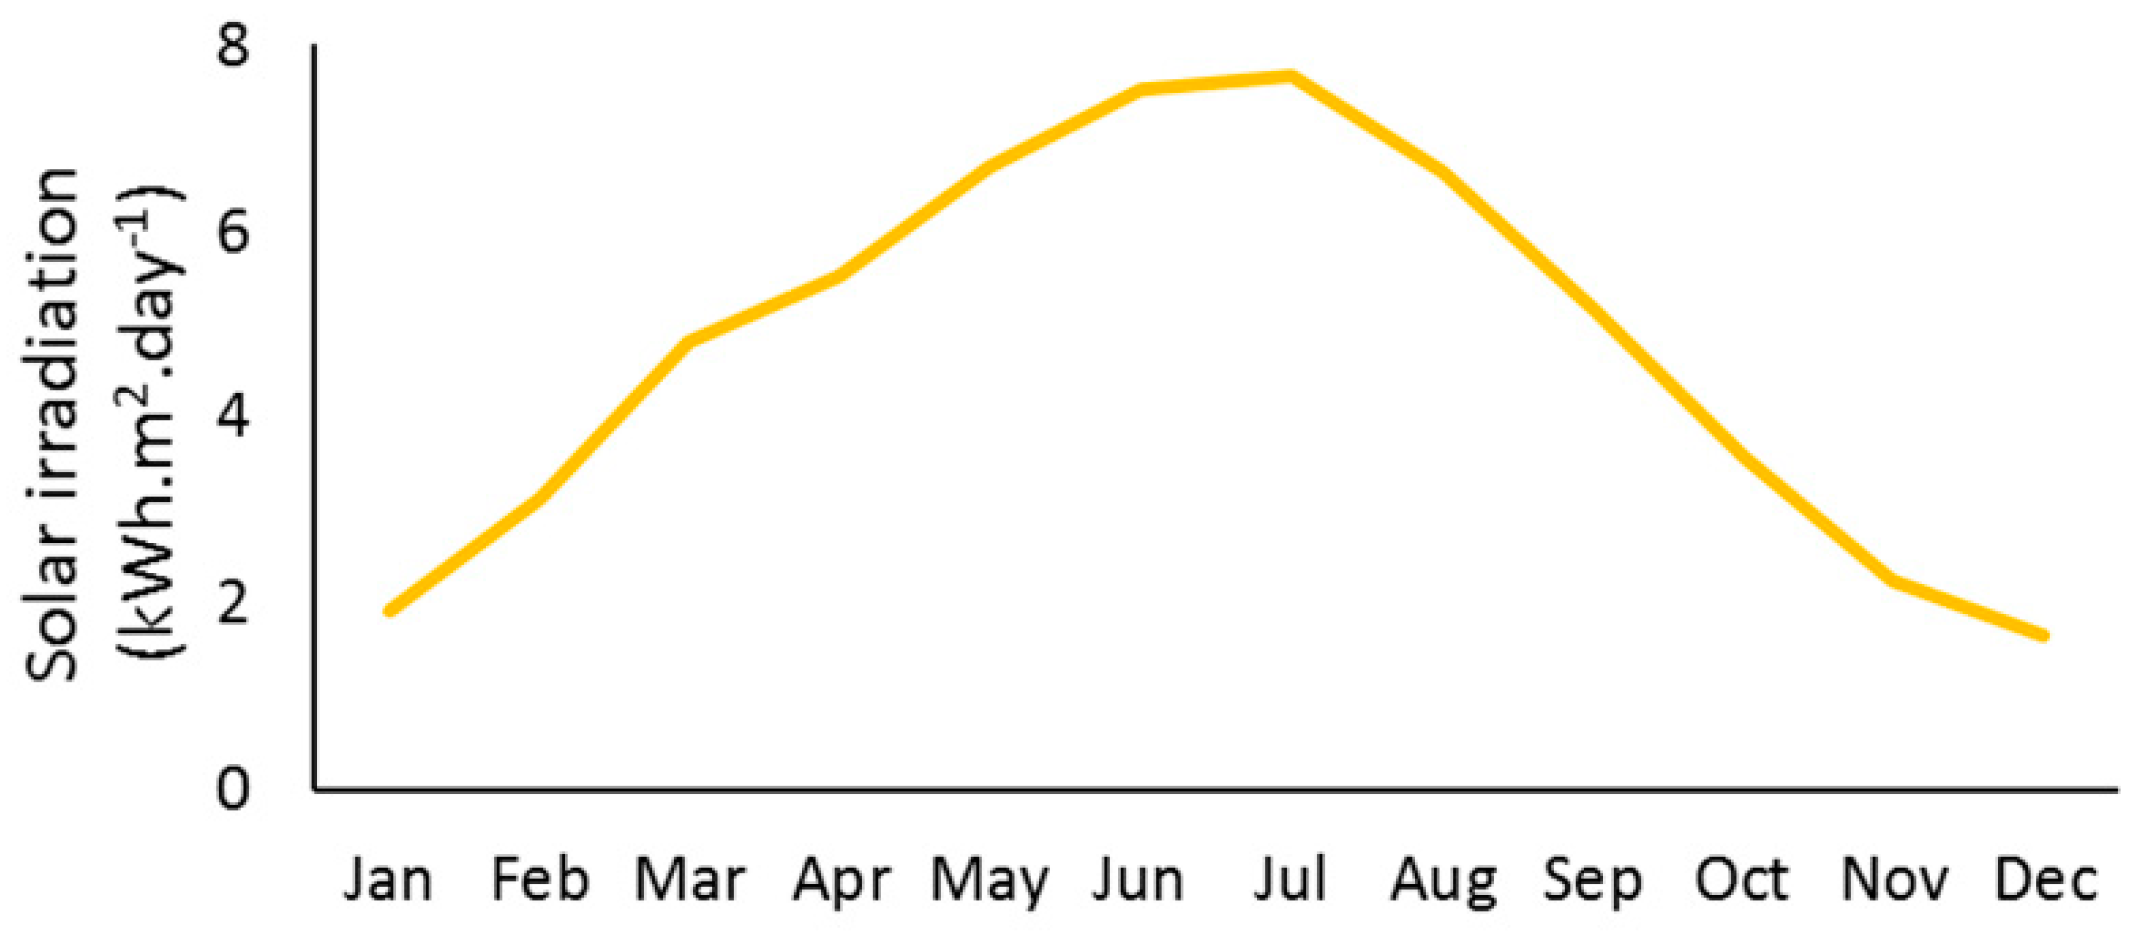
For the seasonal irrigation of Mediterranean crops, previous studies have shown, as in this case, that the ideal renewable generation is photovoltaics [13]. Data of the solar resource at the location (42°03′36″ N 0°05′42″ E) have been obtained from the Photovoltaic Geographical Information System (PVGIS) [21]. In addition, on-site measurements, before and after the installation of the prototypes, have confirmed the validity of these data. The solar irradiation on the horizontal plane is shown in Figure 3. Regarding the wind resource, the available data and measurements showed that it was scarce, with long periods of calm, even during several successive weeks. It also had strong variations from one year to the next. As a result, the solar resource suits the profile of the energy demand a lot better than the wind resource, resulting in a generation mix, with 100% of photovoltaic. For all these reasons, photovoltaics is the only kind of renewable generation used in the standalone RES of the present case study.
2.3.2. Objectives and Sizing Criteria
The role of the prototypes in the whole LIFE REWIND project conditioned the design objectives. For example, its demonstration character is the reason for incorporating three different kinds of photovoltaic assemblies, as explained in Section 2.4.1. Furthermore, in the design of the standalone RES, three main objectives were taken into account:
- (1)
- All the energy coming from renewable sources.
- (2)
- Taking advantage of the synergies that may appear when combining consumptions with different seasonality.
- (3)
- The harnessing of all the energy produced.
The first condition excludes hybridization with diesel and, to obtain a stable supply, requires an oversized generation and storage. The increase in generation produces an excess of energy, which must be used in some way to achieve the third objective. Short-term storage can be achieved simply and efficiently using batteries. On the contrary, long-term storage in a standalone RES requires expensive and inefficient solutions. In both cases, in the short and long term, a large storage capacity can reduce the efficiency of the system, both in relation to the economic costs and the energy losses. Thanks to the fact that several loads are deferrable in the short term, an adequate management strategy can reduce the need for short-term storage, that is, the size of the battery. Regarding long-term storage, the option of producing hydrogen, storing it and then returning the energy to the system through a fuel cell was considered. The use of an alkaline membrane electrolyser [22] and a proton exchange membrane fuel cell (PEMFC) [23] would be indicated, although the efficiency of the electricity-hydrogen-electricity conversion is relatively low. For this reason, it was decided to produce hydrogen in the system and extract it for use in the electric vehicle. In this way, efficiency is not a critical factor, because that of the fuel cell and electric powertrain are equal to or better than that of the diesel powertrain.
Likewise, the production of hydrogen to replace diesel is a way of extracting and subsequently harnessing the energy surplus from the RES. That is why, in relation to the sizing of the RES, no demand for the production of hydrogen has been taken into account. The considered demand (Table 4) includes all the already described loads of water aeration in the WWTP, pumping and irrigation, as well as the auxiliary consumption of the heat pump and the control system.
Multiple simulations have been carried out, with different scenarios of seasonality and manageability, looking for sizes of the photovoltaic generation and the battery that could satisfy the demand. In each of these cases, an amount of surplus energy appeared, which could be used to produce hydrogen. Finally, one of the possible solutions was chosen. In it, the size of the battery only ensured night-time operation and the intraday compensation of consumption and production, thus giving up long-term storage. Under these conditions, the size of photovoltaic generation ensures a supply, in the worst case, on a weekly basis.
2.4. The Standalone RES
The following subsections describe the RES that has been assembled and is working in the vineyard.
2.4.1. The Photovoltaic Field
Three photovoltaic sets in the prototype, mounted on different supports, have been installed in order to show them to the project stakeholders and compare their performances.
A first array is mounted on a fixed metal structure on the ground. It is fixed to the ground by prefabricated counterweights, which are easy to place and remove without leaving residue. This set on a fixed support represents the most common solution for farms due to its simplicity and reliability. The tilt of the panels can be manually adjusted in two positions, one of which is better for the irrigation season and the other for maximizing the annual production. This set includes 40 photovoltaic panels, with a total power of 10.8 kWp.
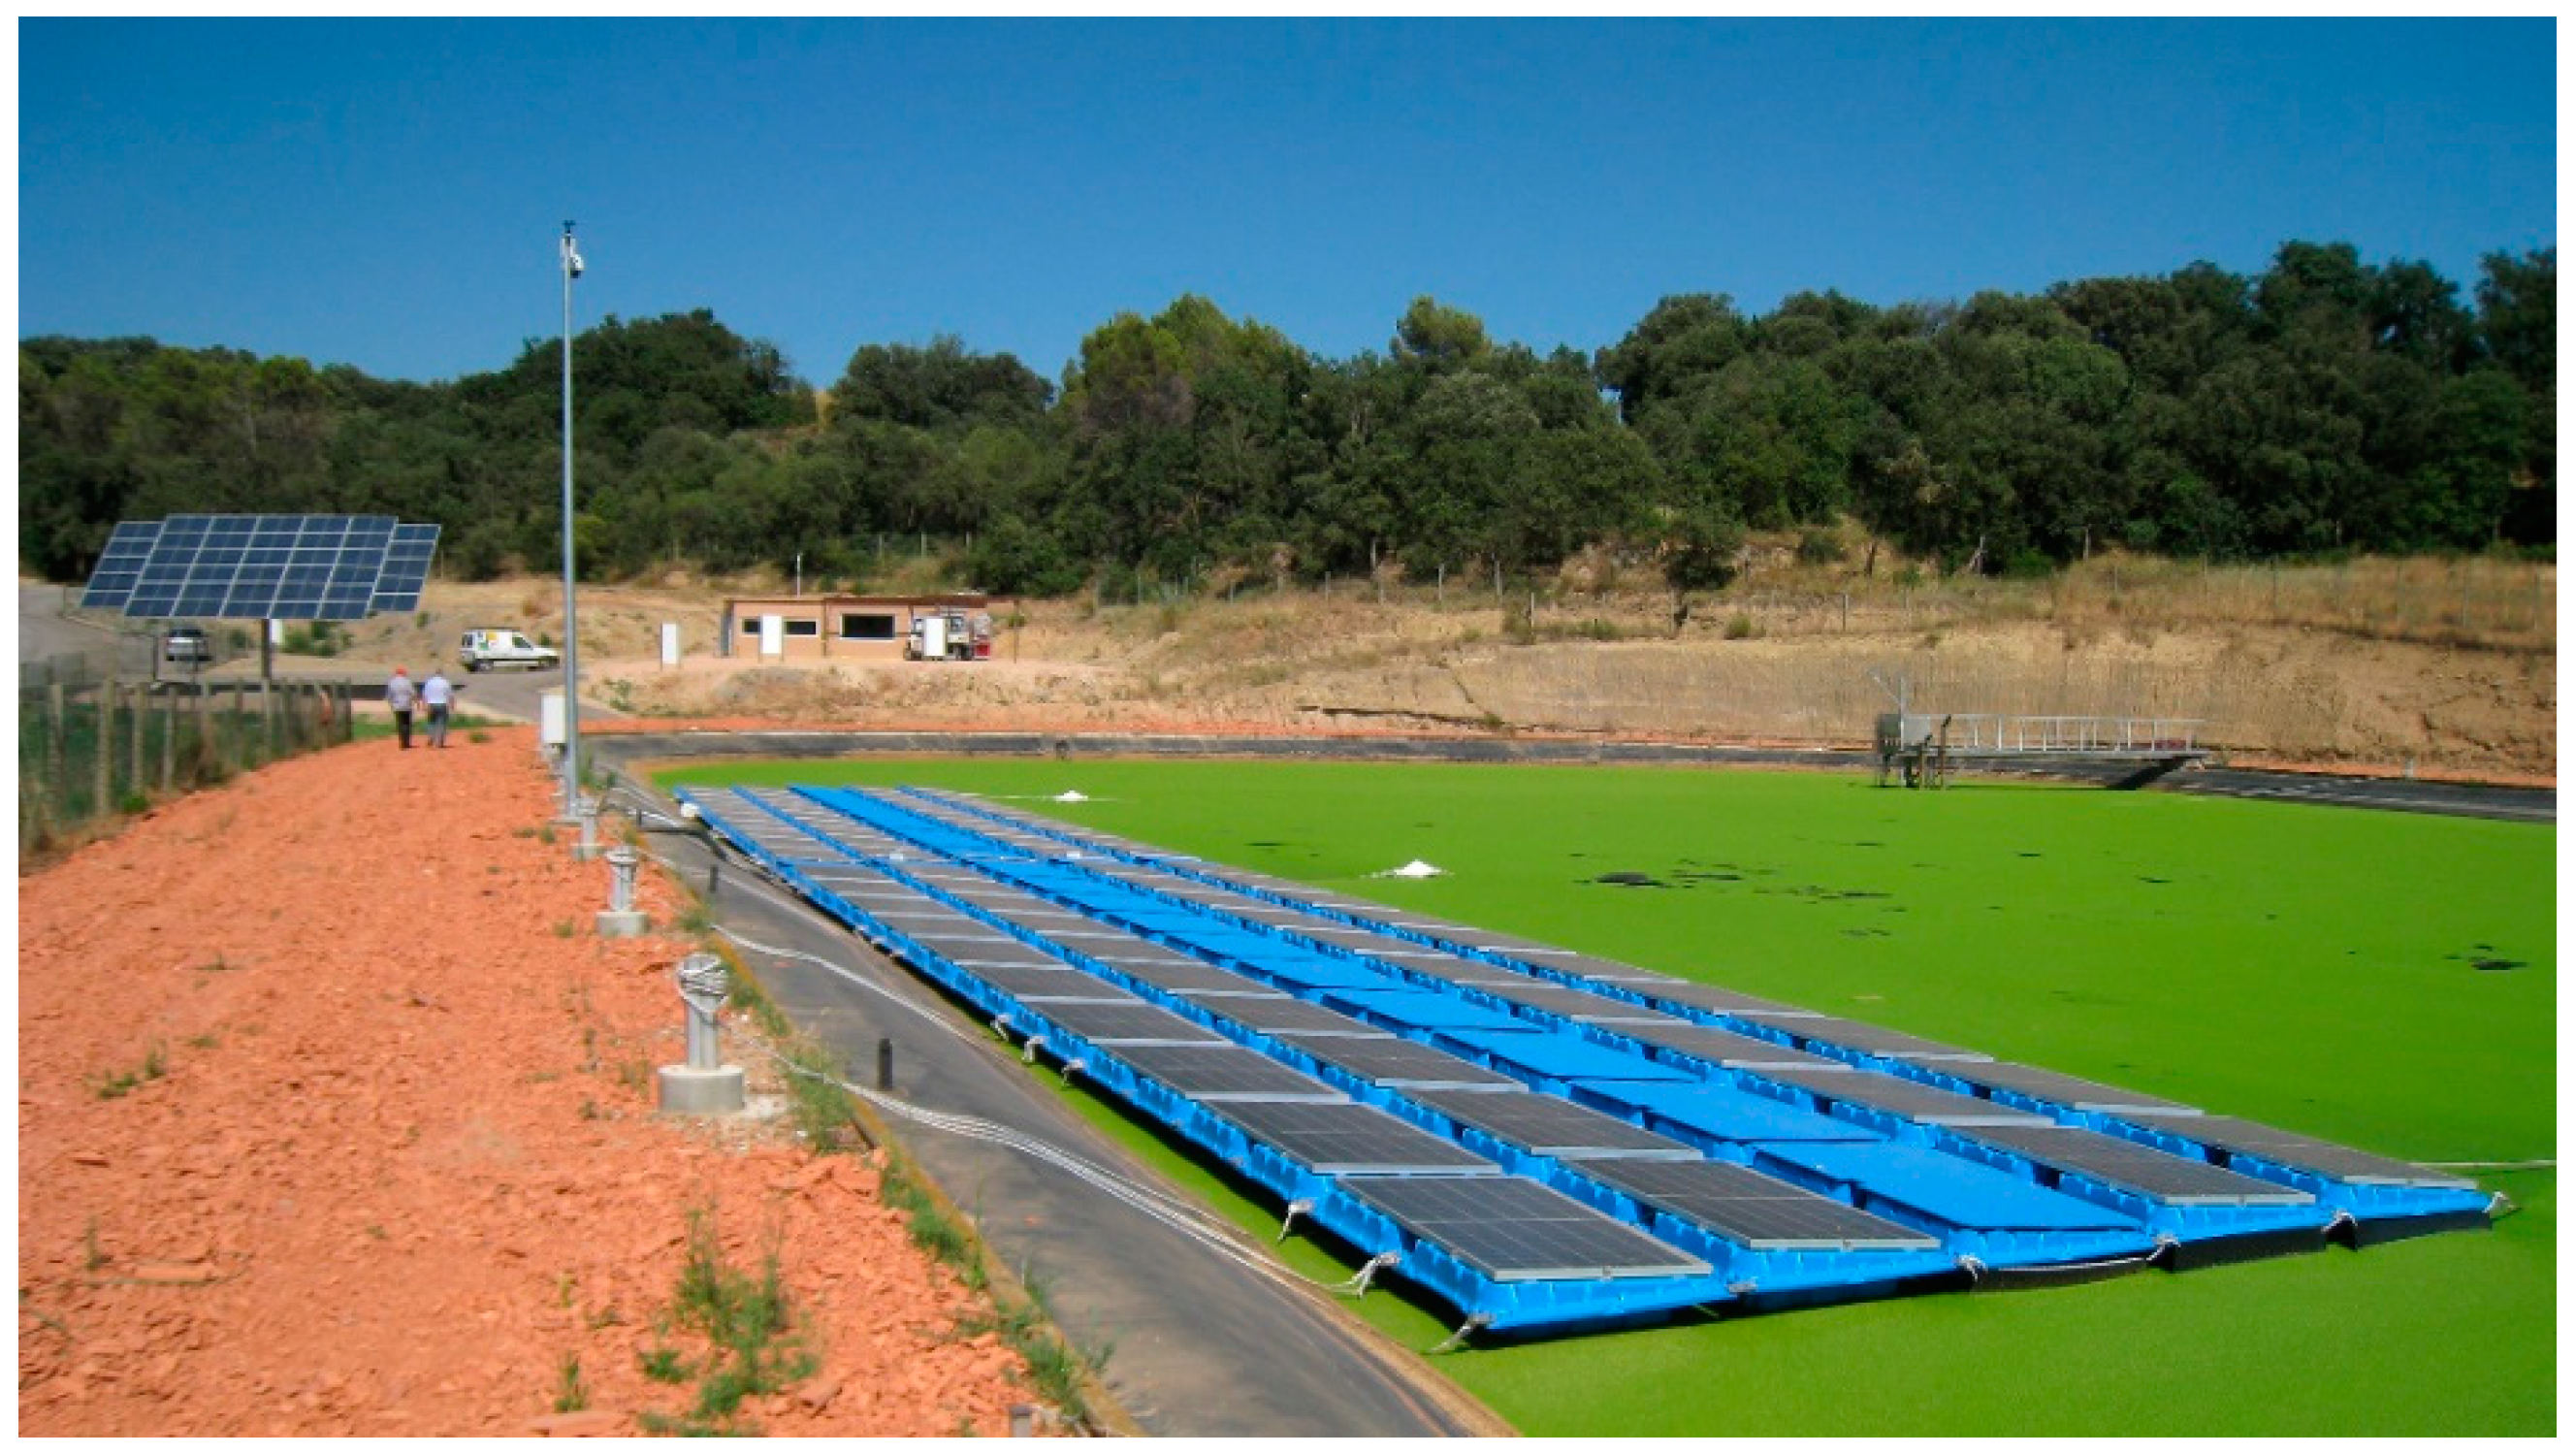
A second array is mounted on a two-axis solar tracker (Figure 4). A set of sensors and two motors allow for the continuous orientation of the panels according to the plane of maximum incident radiation, obtaining more production on any day and season than with any fixed orientation. This set can produce a more stable power throughout the day, and its purpose is to obtain enough power in the first and last diurnal hours. The solar tracker includes 40 photovoltaic panels, with a total nominal power of 10.8 kWp.
The third array is mounted on a floating structure on the aeration pond (Figure 4). The floating system has been designed specifically for its placement in irrigation ponds. Among other things, this includes the ability to adapt to frequent changes in level due to the filling and emptying of the pond. The panel tilt is fixed and is close to the optimum for June, according to the seasonality of irrigation. This floating support is itself a prototype, and its purpose is to offer an innovative solution for irrigation facilities and test its performance. This set includes 80 photovoltaic panels, with a total nominal power of 21.6 kWp.
In summary, the total nominal power of the photovoltaic field is 43.2 kWp, but with different types of azimuth and tilt. Each of the three sets incorporates three sensors: environmental temperature, panel temperature, and irradiation on the plane of the panels. In addition, two other sensors were installed: irradiation on the horizontal plane and wind speed. All of them will be used to study comparatively the three photovoltaic sets.
2.4.2. The Inverters and the Energy Bus
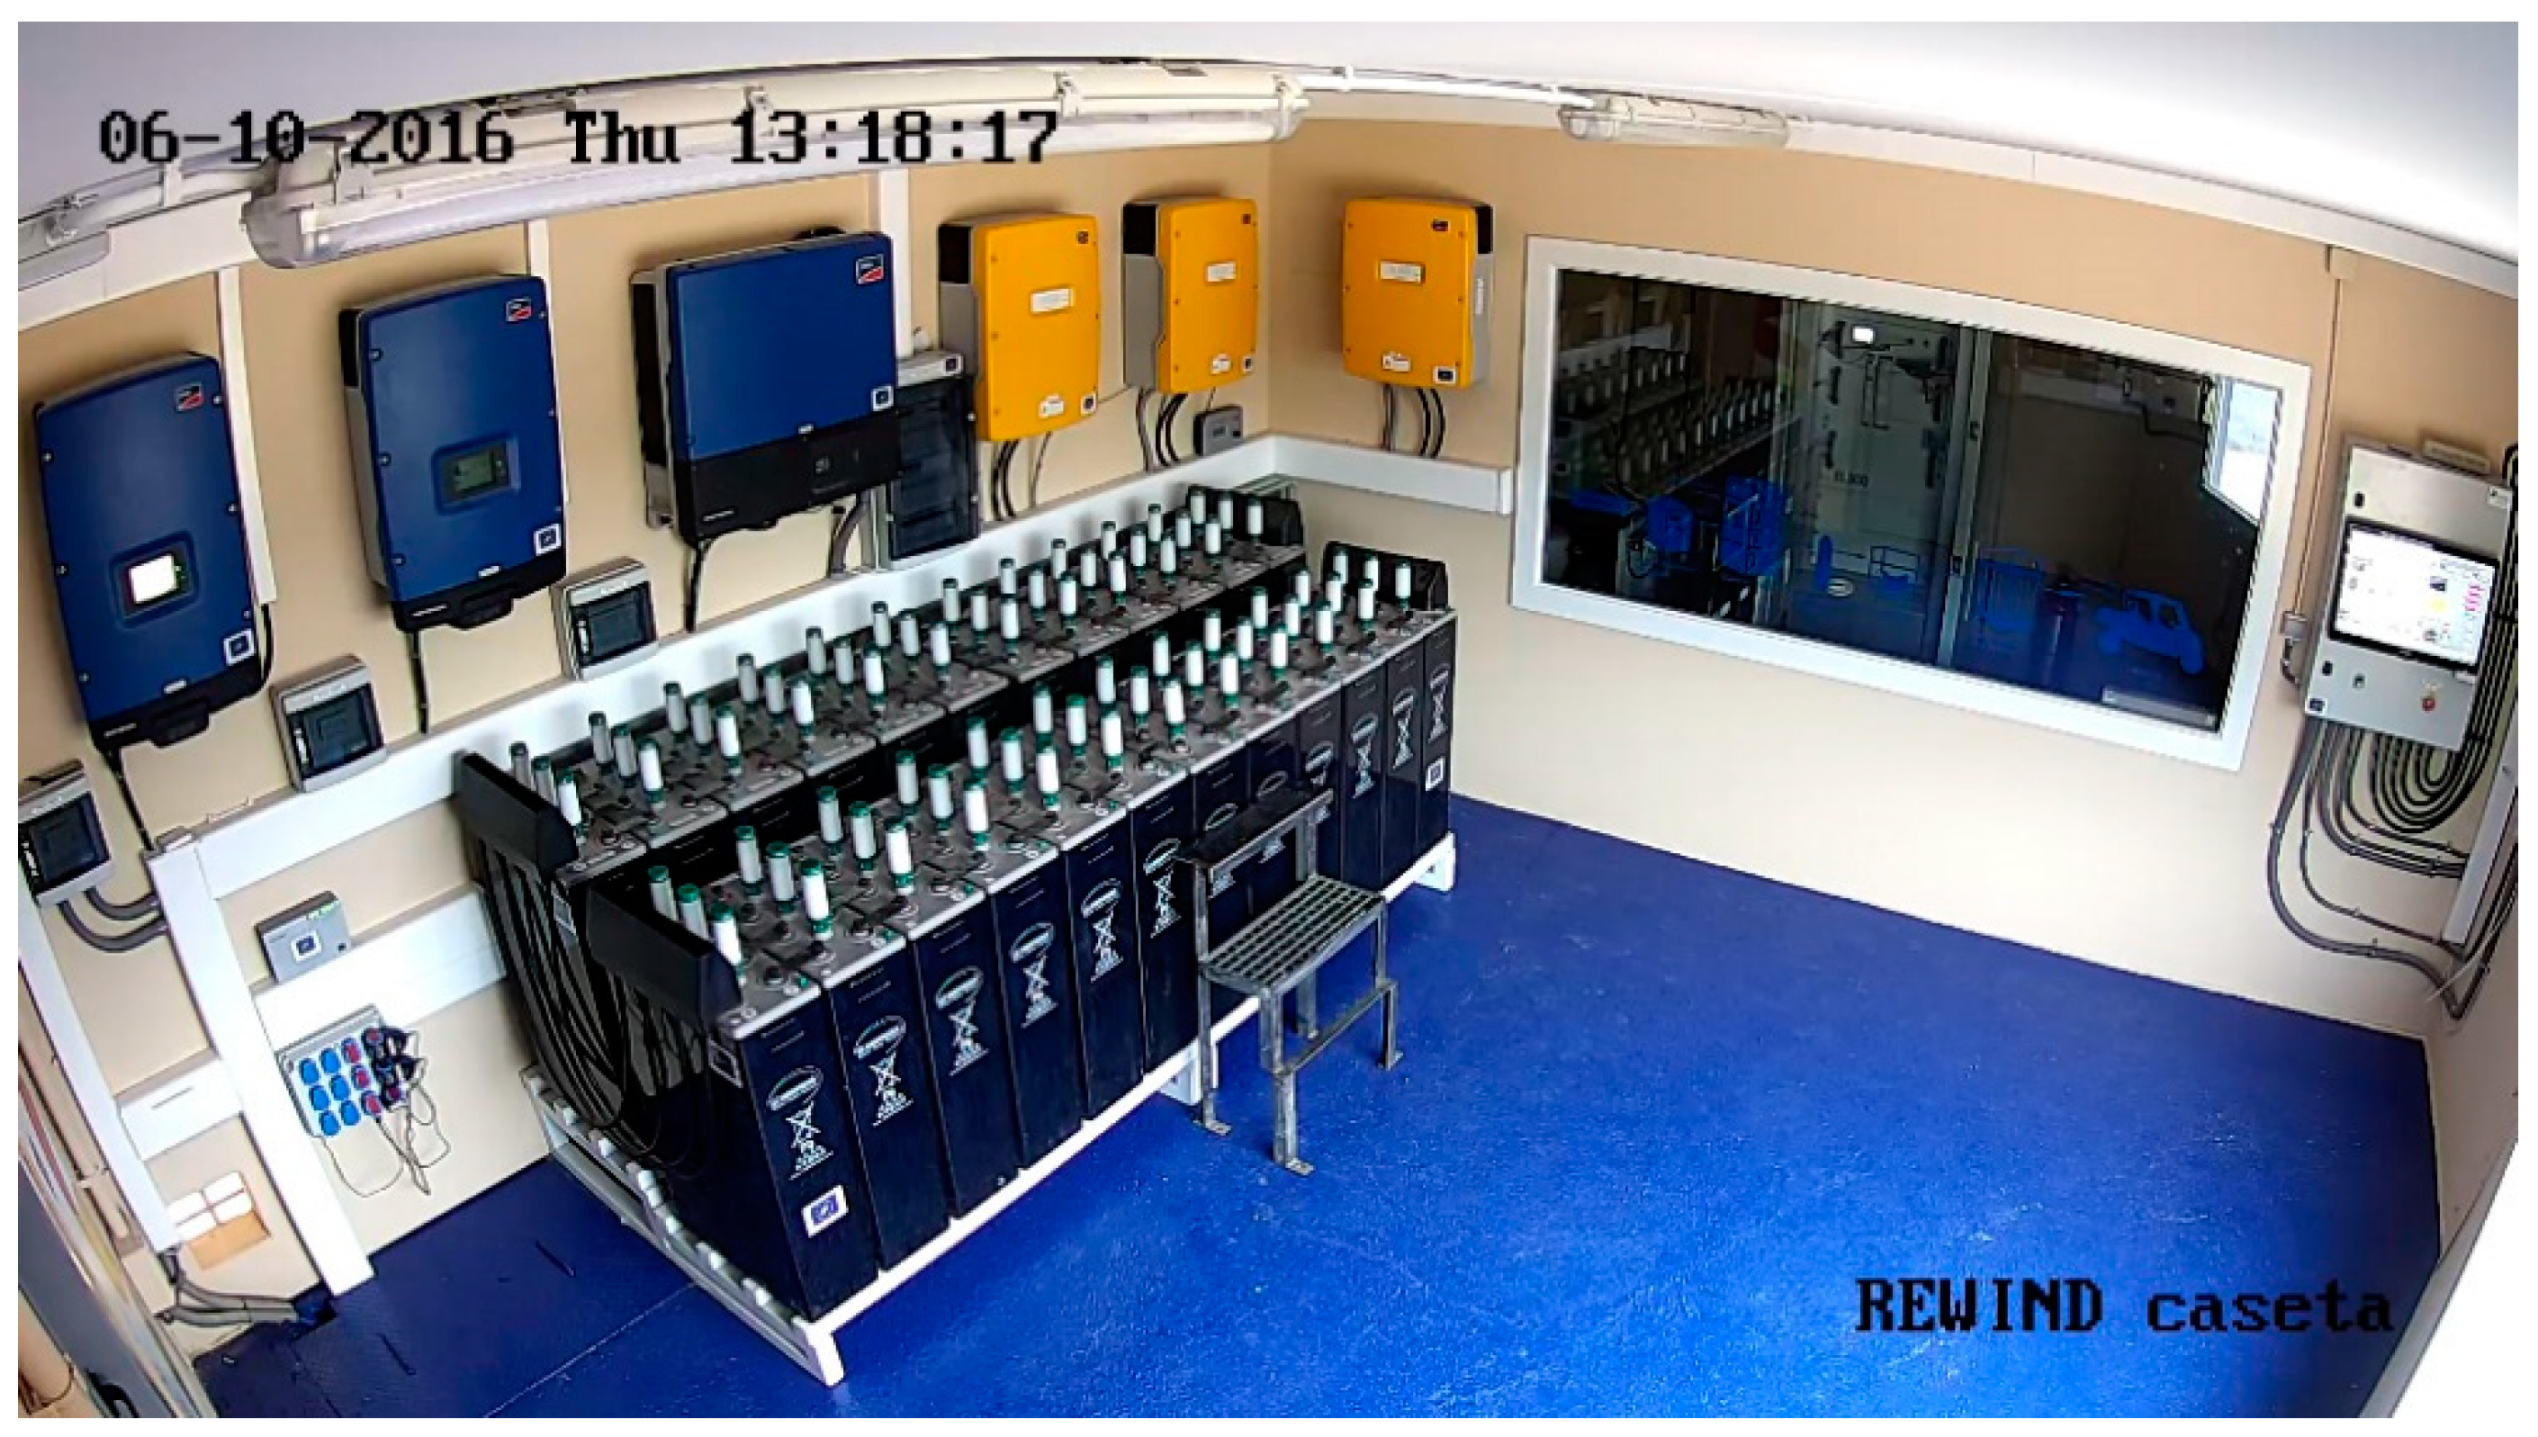
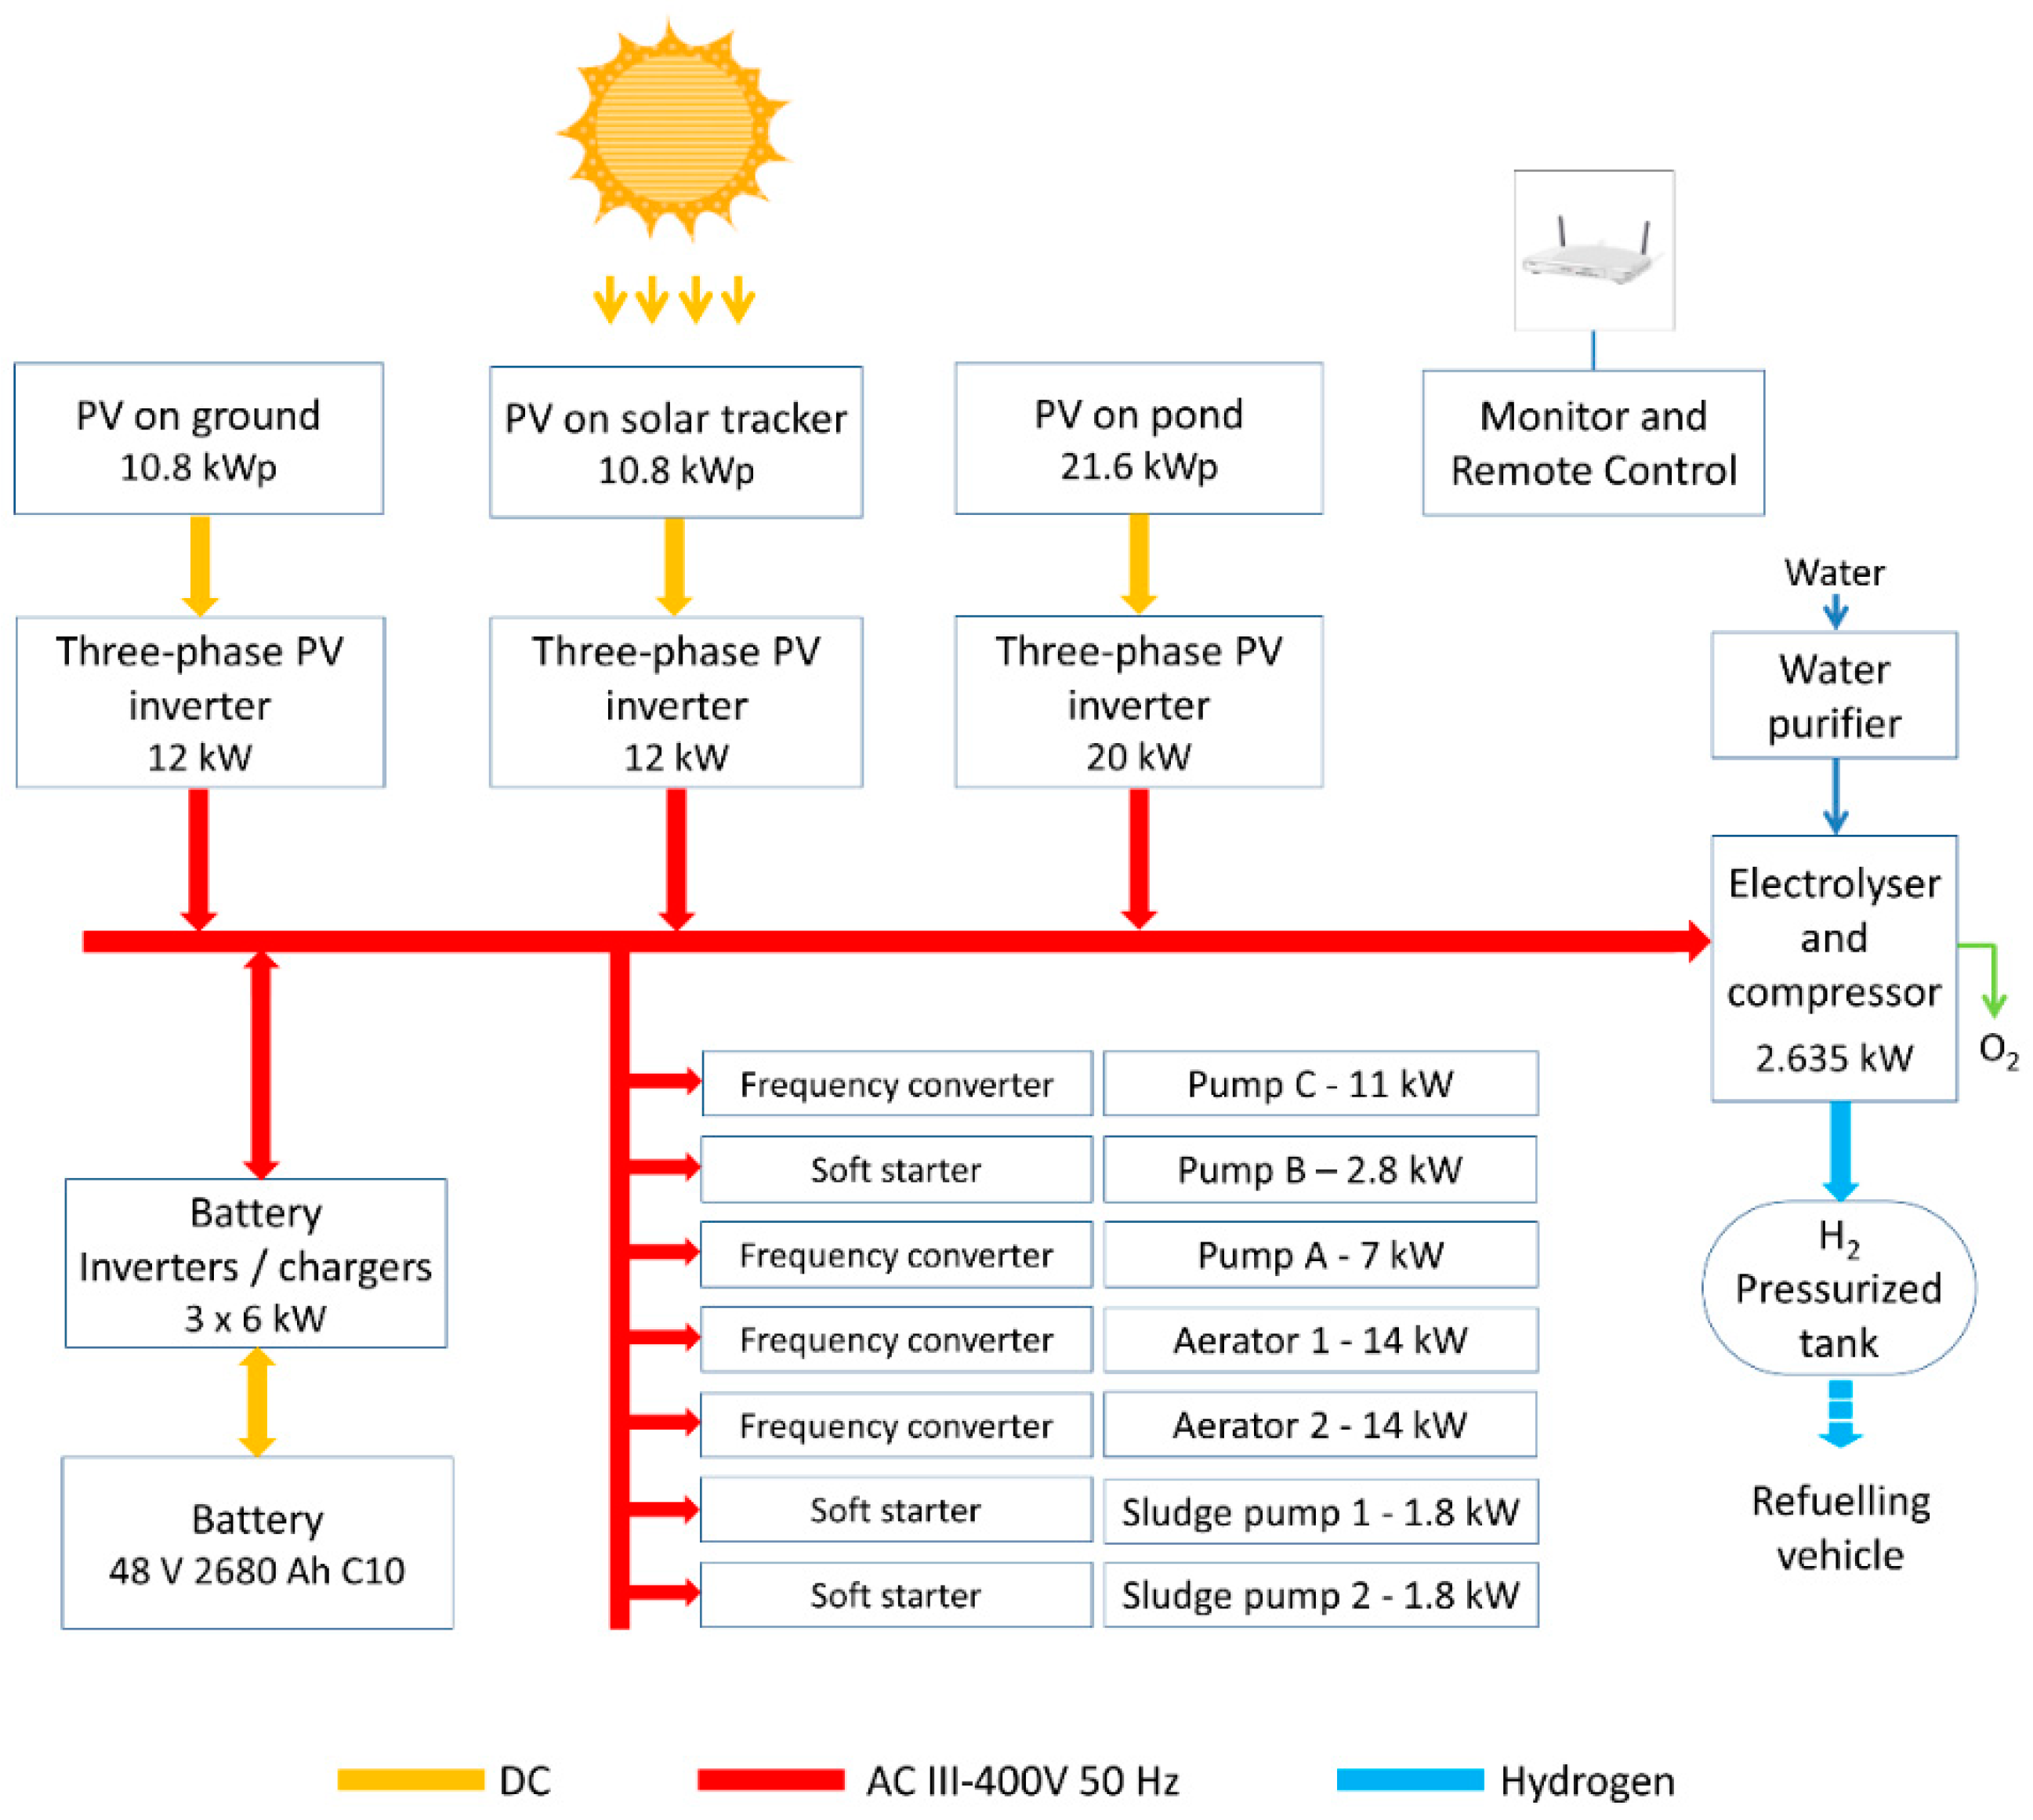
The room of the inverters, batteries and control devices is shown in Figure 5. The pumps and aerators require a supply of three-phase AC 400 V 50 Hz. In addition, one of the design criteria was the use of energy simultaneously with its production, avoiding its storage whenever possible. For these reasons, it was decided to use an AC bus, to which both solar inverters and battery inverters are connected (Figure 6). In this way, the alternating current from the solar inverters can go directly to the loads, reducing conversion losses. Another advantage is that solar inverters have a higher performance than solar chargers. Each of the three photovoltaic assemblies has its own three-phase solar inverter, with a total power of 44 kW.
Regarding the battery inverters, a set of three units maintains the three-phase bus at 400 V 50 Hz. They are also responsible for managing the battery. Its power will determine the loads that can be activated in the absence of photovoltaic production, for example, at night. These are the irrigation pump (Pump C), the heat pump, the control system, and in some instances, Pump B, which totals a maximum of 16.02 kW. The total continuous power of the selected battery inverters is 18 kW, although they can maintain a higher power for a limited time. In the opposite direction, the set of the three battery inverters cannot charge the battery to a power greater than approximately 20 kW. That is, although solar inverters can produce up to 44 kW, no more than 20 kW can be dispatched to charge the battery. This is due to the under sizing of the battery, following the strategy in which the energy goes from the solar inverters to the loads in the largest possible proportion. Consequently, to avoid overcharging the battery inverters, when the solar production rises above 20 kW, one or more loads (for example, an aerator) must be activated to consume this excess. This is one of the criteria incorporated into EMS. In a conventional RES with the same photovoltaic power, it would be appropriate to incorporate a set of battery inverters of more than twice the power chosen here. In fact, the chosen sizing does not respect the recommendations of the manufacturer of the inverters, but this has been done intentionally to show how it is possible to drastically reduce the size and the cost of the short-term storage subsystem.
2.4.3. The Short-Term Storage
Regarding the battery capacity, it should be sufficient to allow for nocturnal irrigation, as well as to maintain the operation of the ancillary loads, especially the control system and the heat pump. In the month of the maximum irrigation demand (August), the irrigation pump is activated for, on average, 4.7 hours a day. If, for some reason, the weekly watering was conducted in just six days, each activation would last 5.5 hours. Since the irrigation pump consumes 11 kW, the energy extracted from the battery is, in the worst case, 60.5 kWh. Adding 3.3 kWh of the nightly consumption of the ancillary loads, the maximum discharge during a night is 63.8 kWh. A battery of twice the capacity of this figure has been chosen, that is, a series of 24 OPzS lead-acid cells of 2 V 2680 Ah C10, which make a total of 48 V and 128.64 kWh. Consequently, the maximum reduction of the SOC (state of charge) during the night is, in worst cases, 50%. Since deep discharges cause damage and shorten the life of lead-acid batteries, a minimum permissible SOC of 20% has been adopted as a design condition. As a result, the SOC level at sunset should be at least 70%. Finally, this figure was increased to 85%, which increases the safety margin for the operation of the system controller, even on days with very low solar radiation.
A battery of this size is relatively small and does not meet the minimum recommended by the inverter manufacturer, which was 100 Ah per kWp of the photovoltaic panels. That is, for the 43.2 kWp of the photovoltaic set, a minimum of 4320 Ah would be appropriate, rather than the 2680 Ah that was chosen. This recommendation seems to be designed to avoid charge rates above C5. However, in the design of the prototype, it was decided not to comply with this manufacturer’s recommendation. That is, the battery incorporated into the prototype is 2680 Ah C10, which corresponds to 128.64 kWh. To limit the charge current of the battery, the difference between the power produced and consumed has been limited as explained in Section 2.4.2.
It is remarkable that the battery was dimensioned to compensate the intra-day deviations of the generation and demand curves, as well as to allow watering at night. It was not designed to provide days of autonomy to the loads.
2.4.4. The Production of Hydrogen
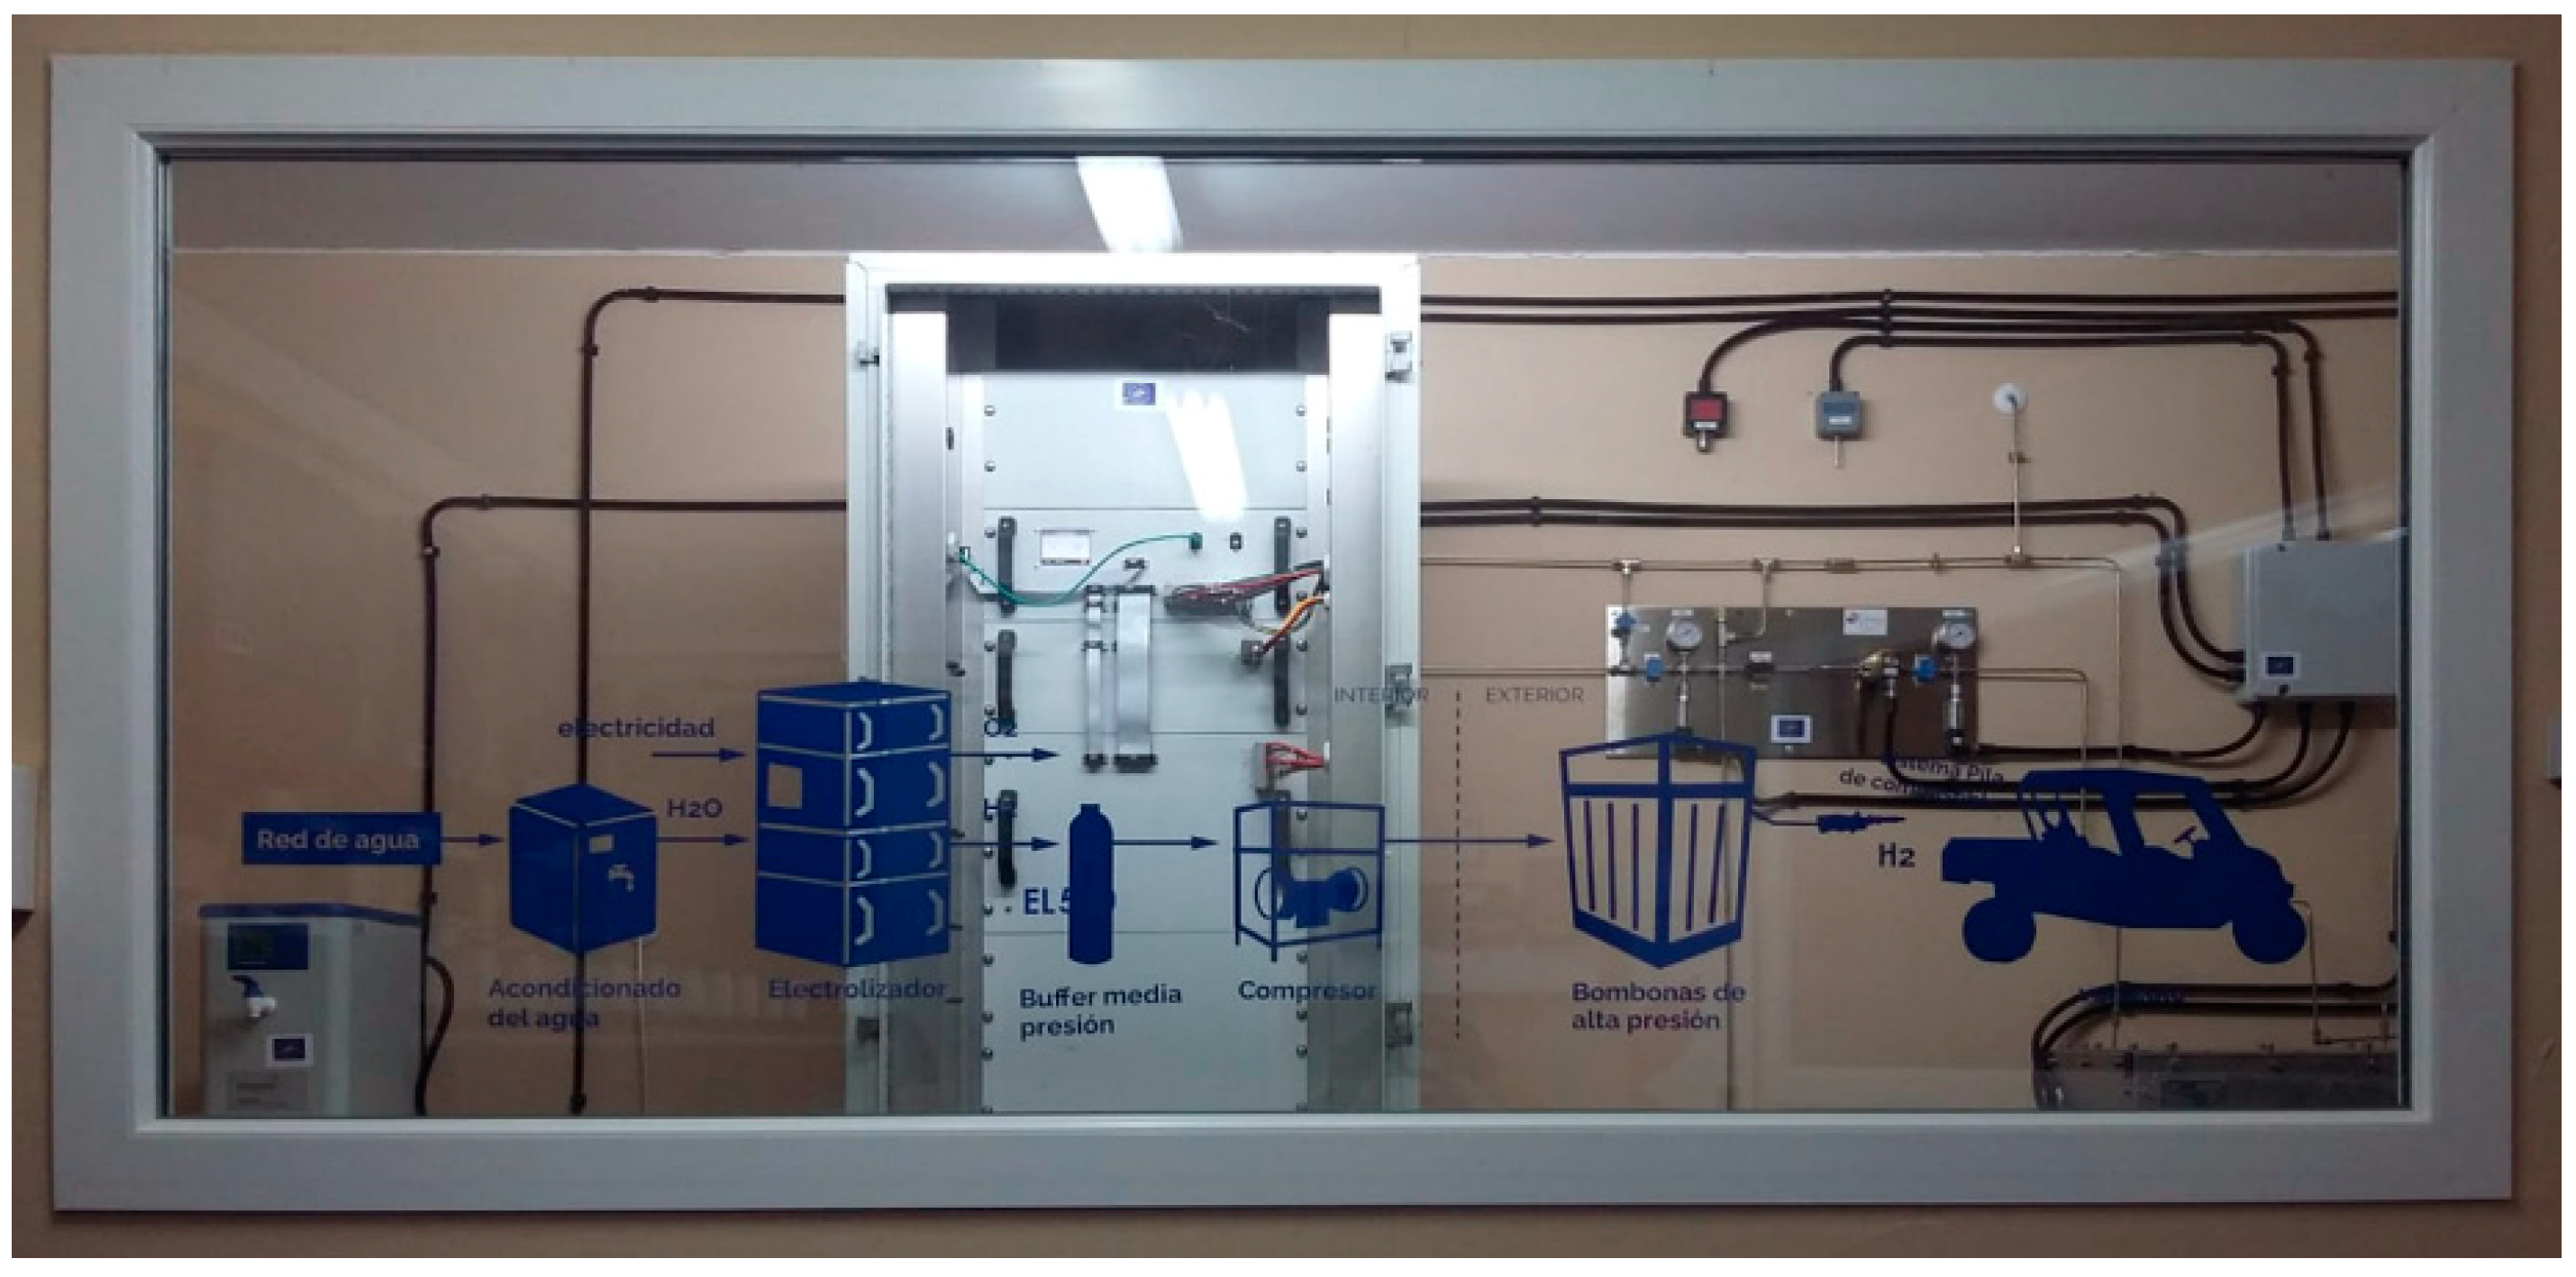
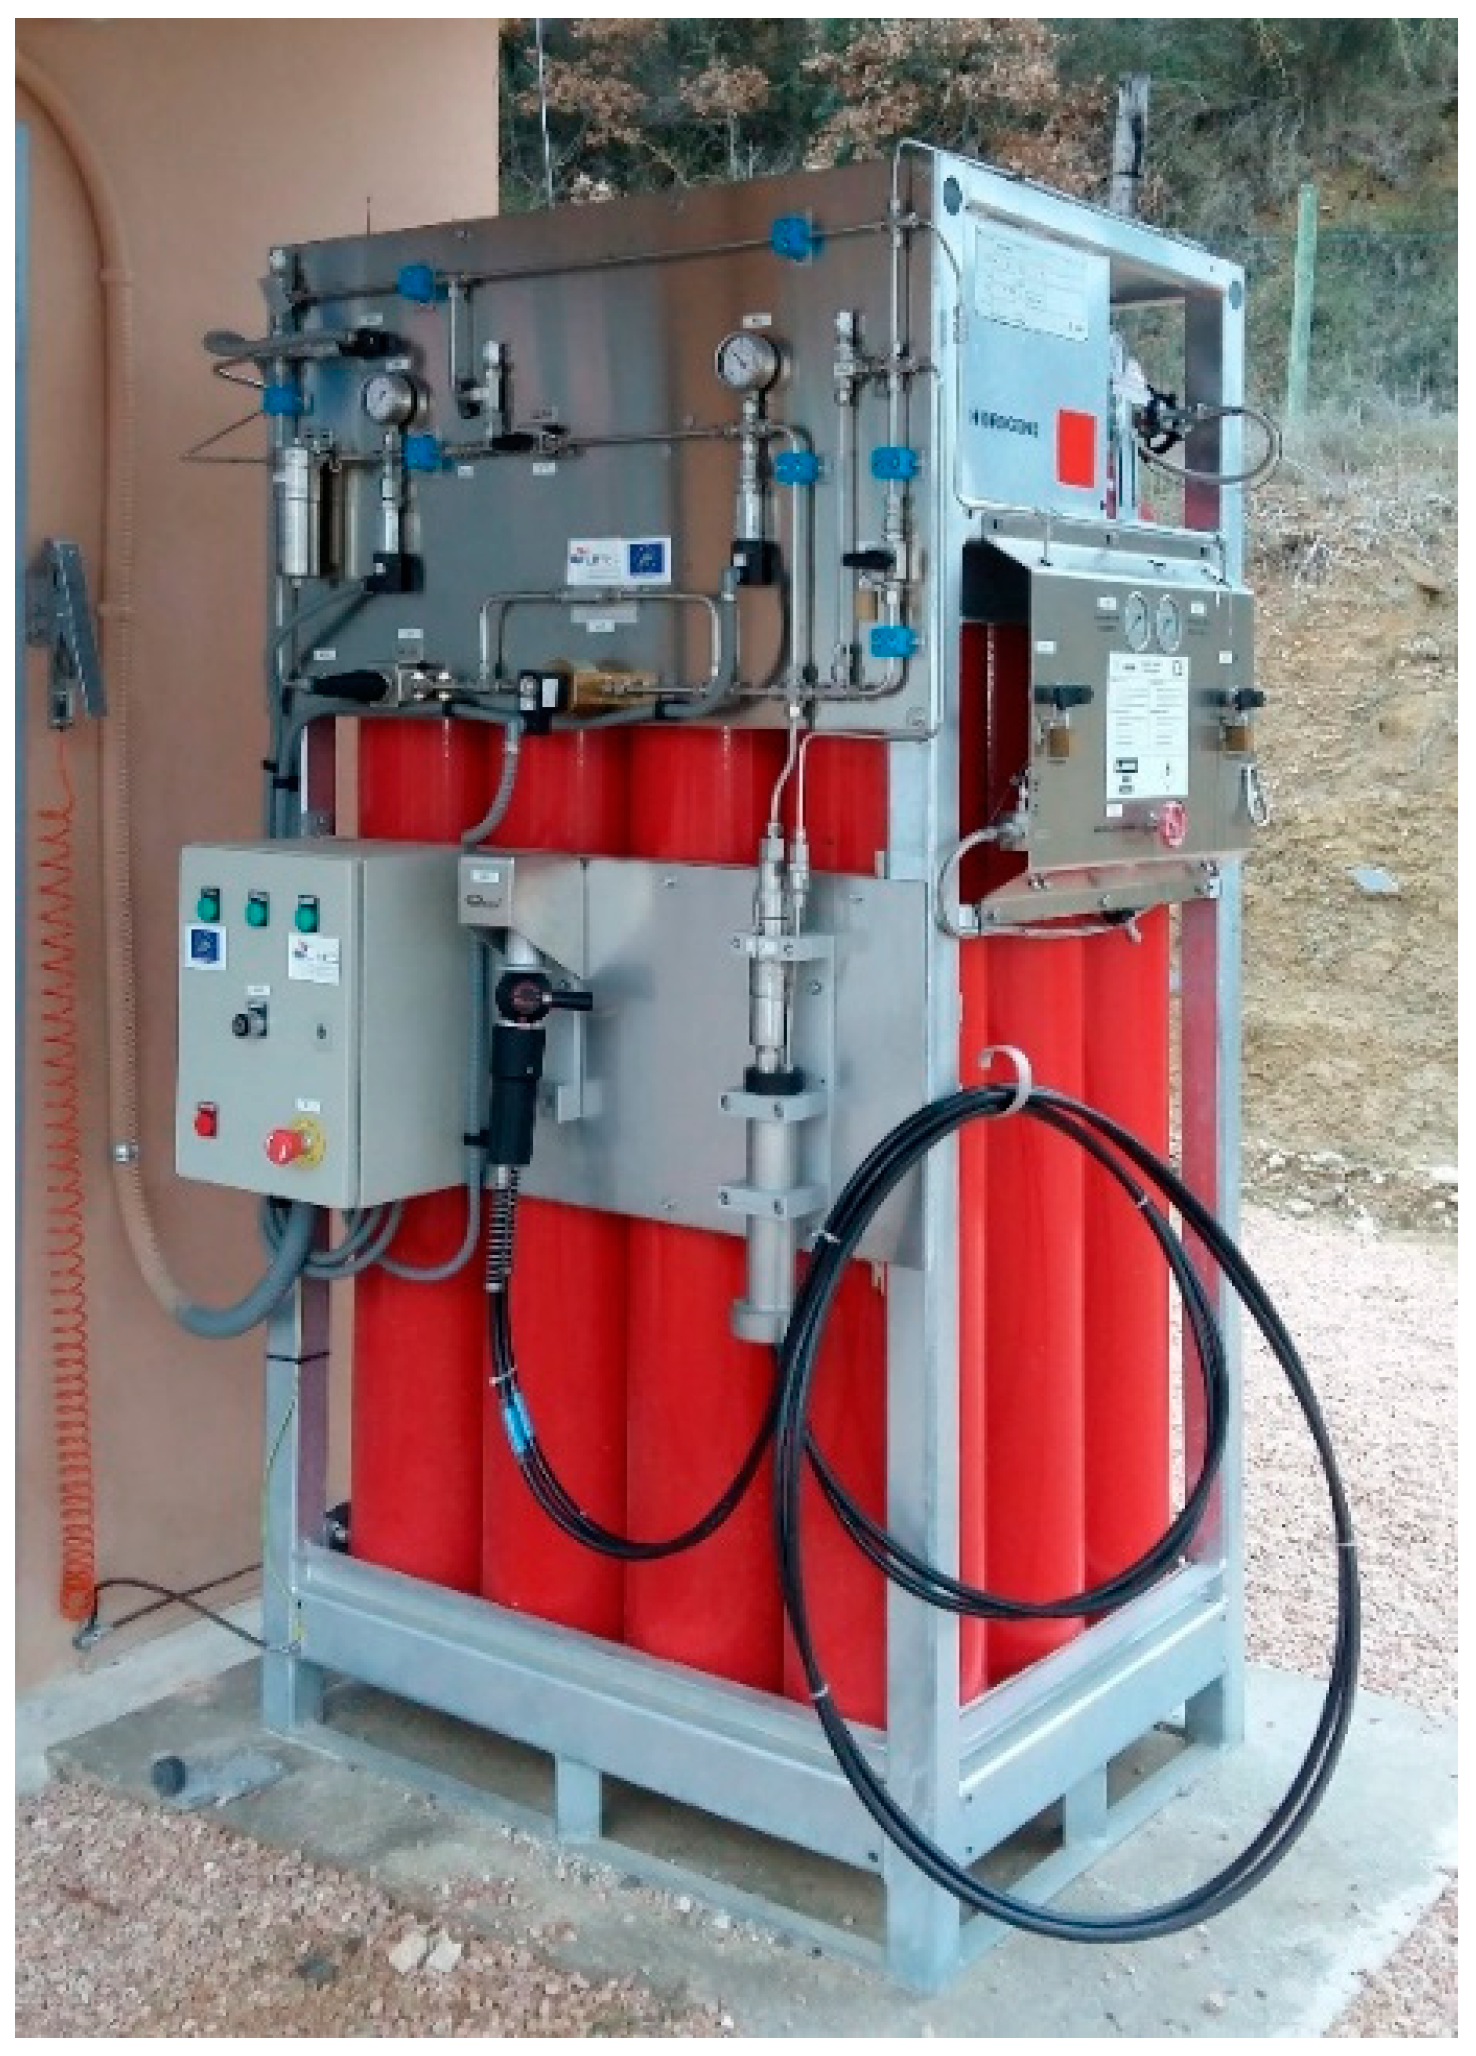
Certainly, one of the main challenges to avoid the use of diesel in agricultural machinery is the limited energy density of the batteries. Taking into account the demonstrative function of the prototypes, it was decided to use not only electricity, but also hydrogen as an energy vector, to extract the surplus energy from the RES and supply it to an off-road vehicle. For this purpose, a hydrogen production system (Figure 7 and Figure 8) was added to the RES, including a water purifier, an electrolyser, a compressor, a storage tank and a refuelling mechanism. A specific article focusses on this system [24].
The electrolyser can produce hydrogen at a pressure of 30 bar. The compressor increases the hydrogen pressure to a maximum of 200 bar and stores it in a 600 litres tank. Every hour of operation of the set, 0.5 Nm3 of hydrogen are produced, consuming 2.635 kWh of electricity. This is a deferrable consumption, to the extent that the hydrogen can be stored in tanks in the production and refuelling system.
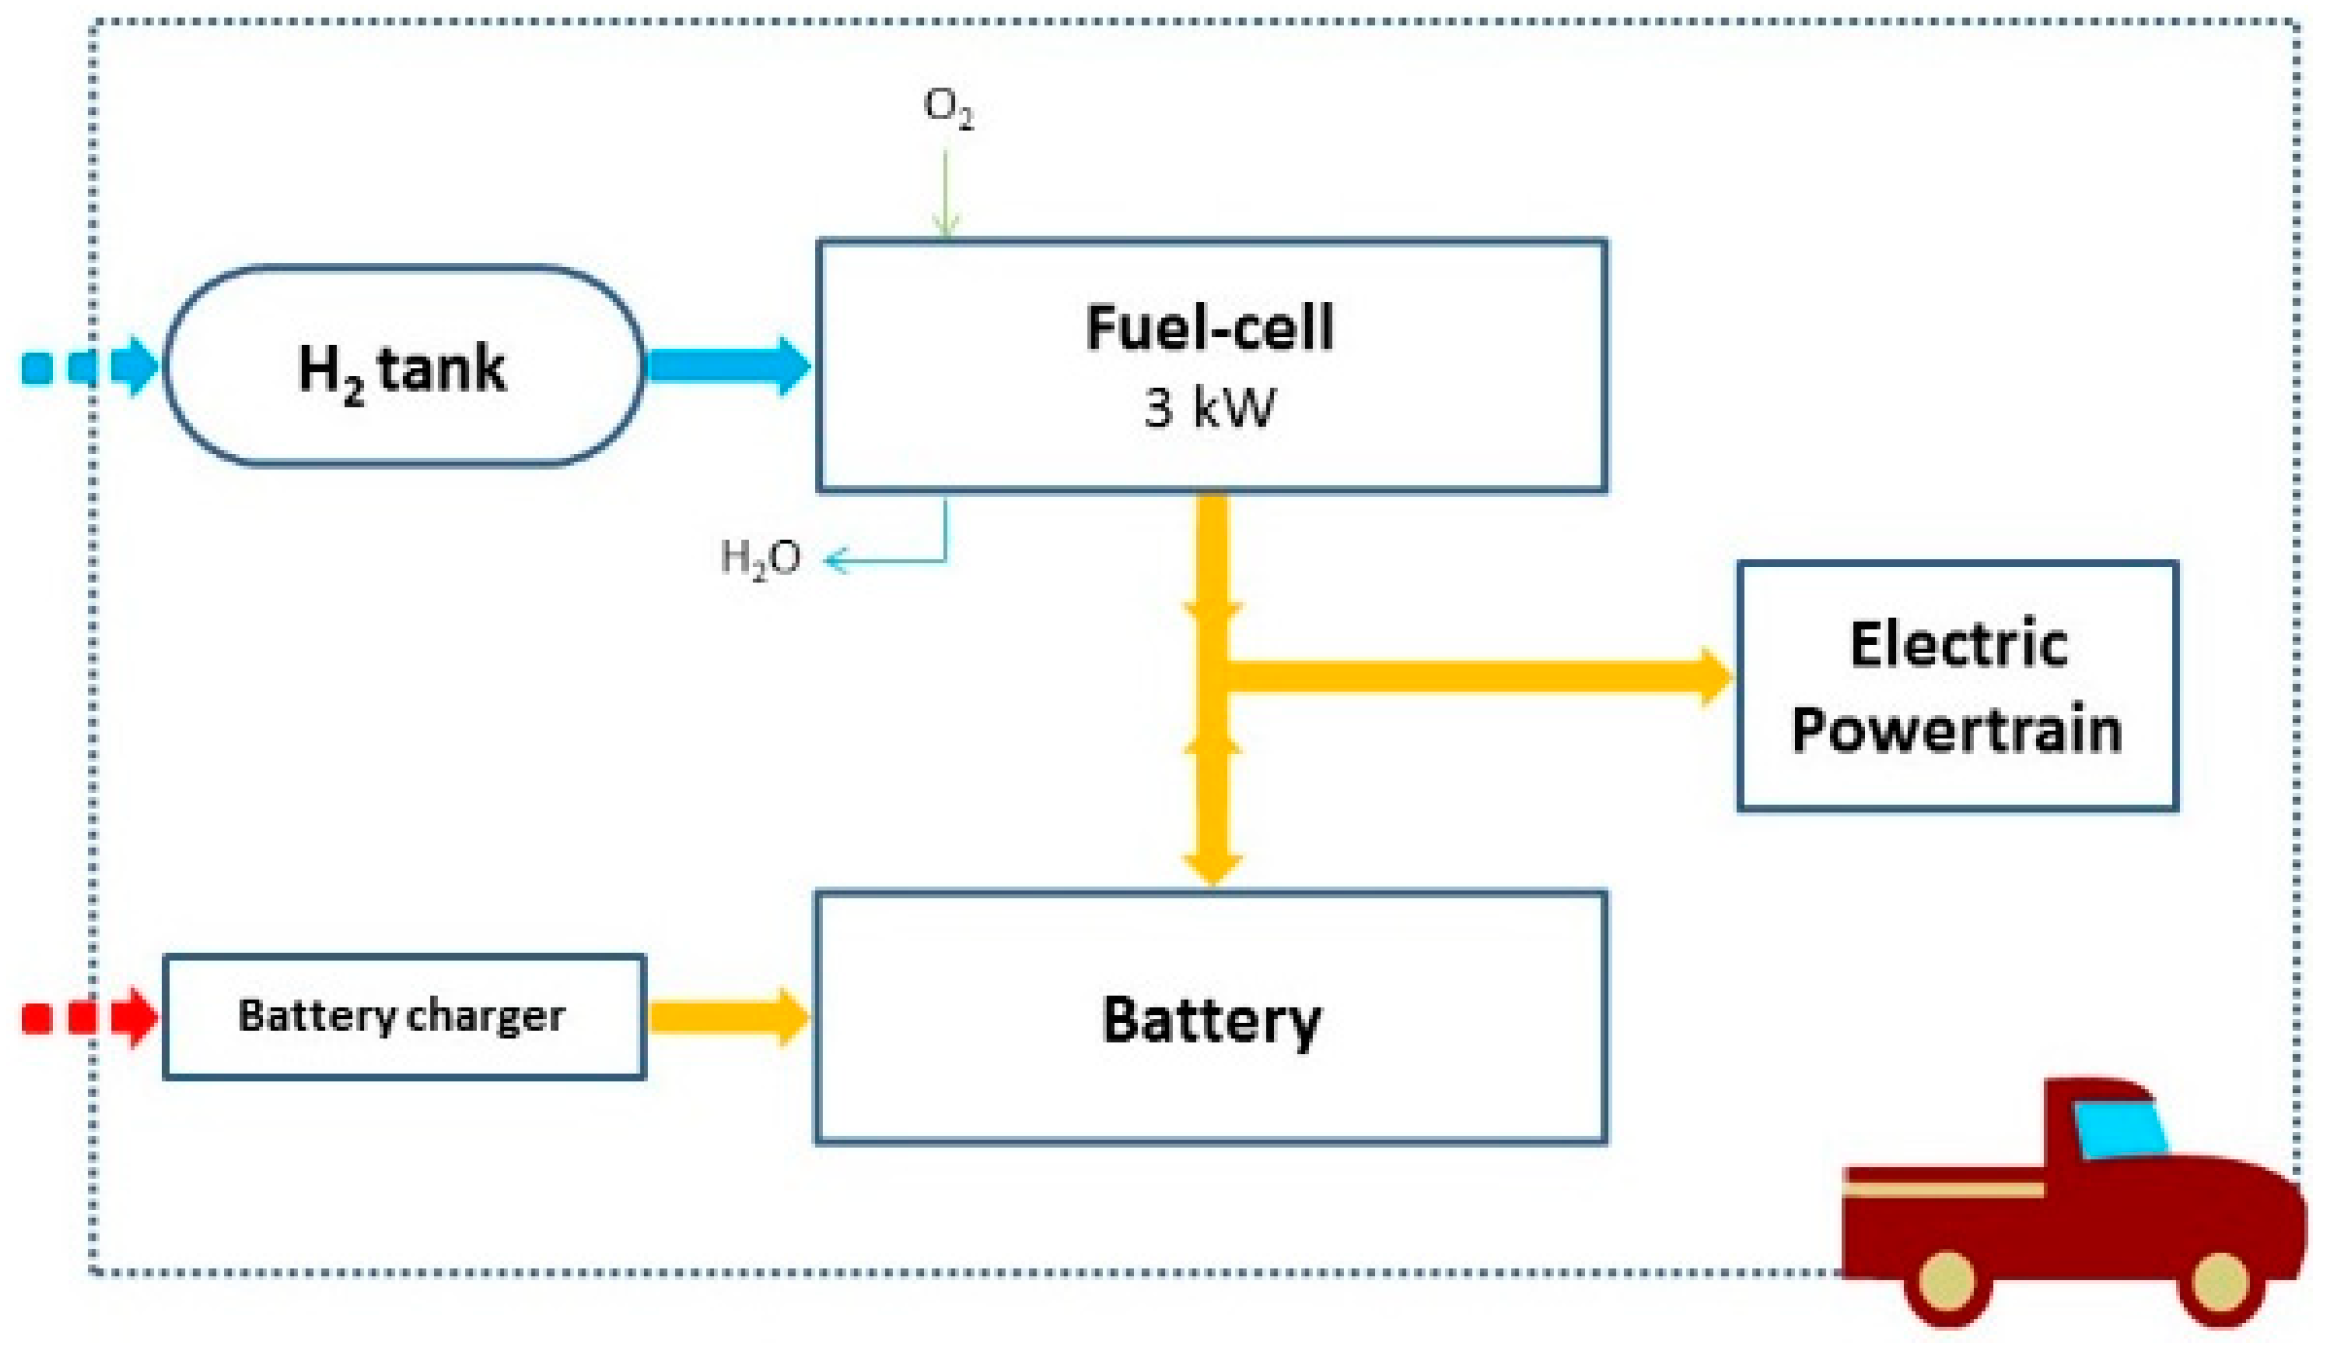
2.4.5. The FCHEV
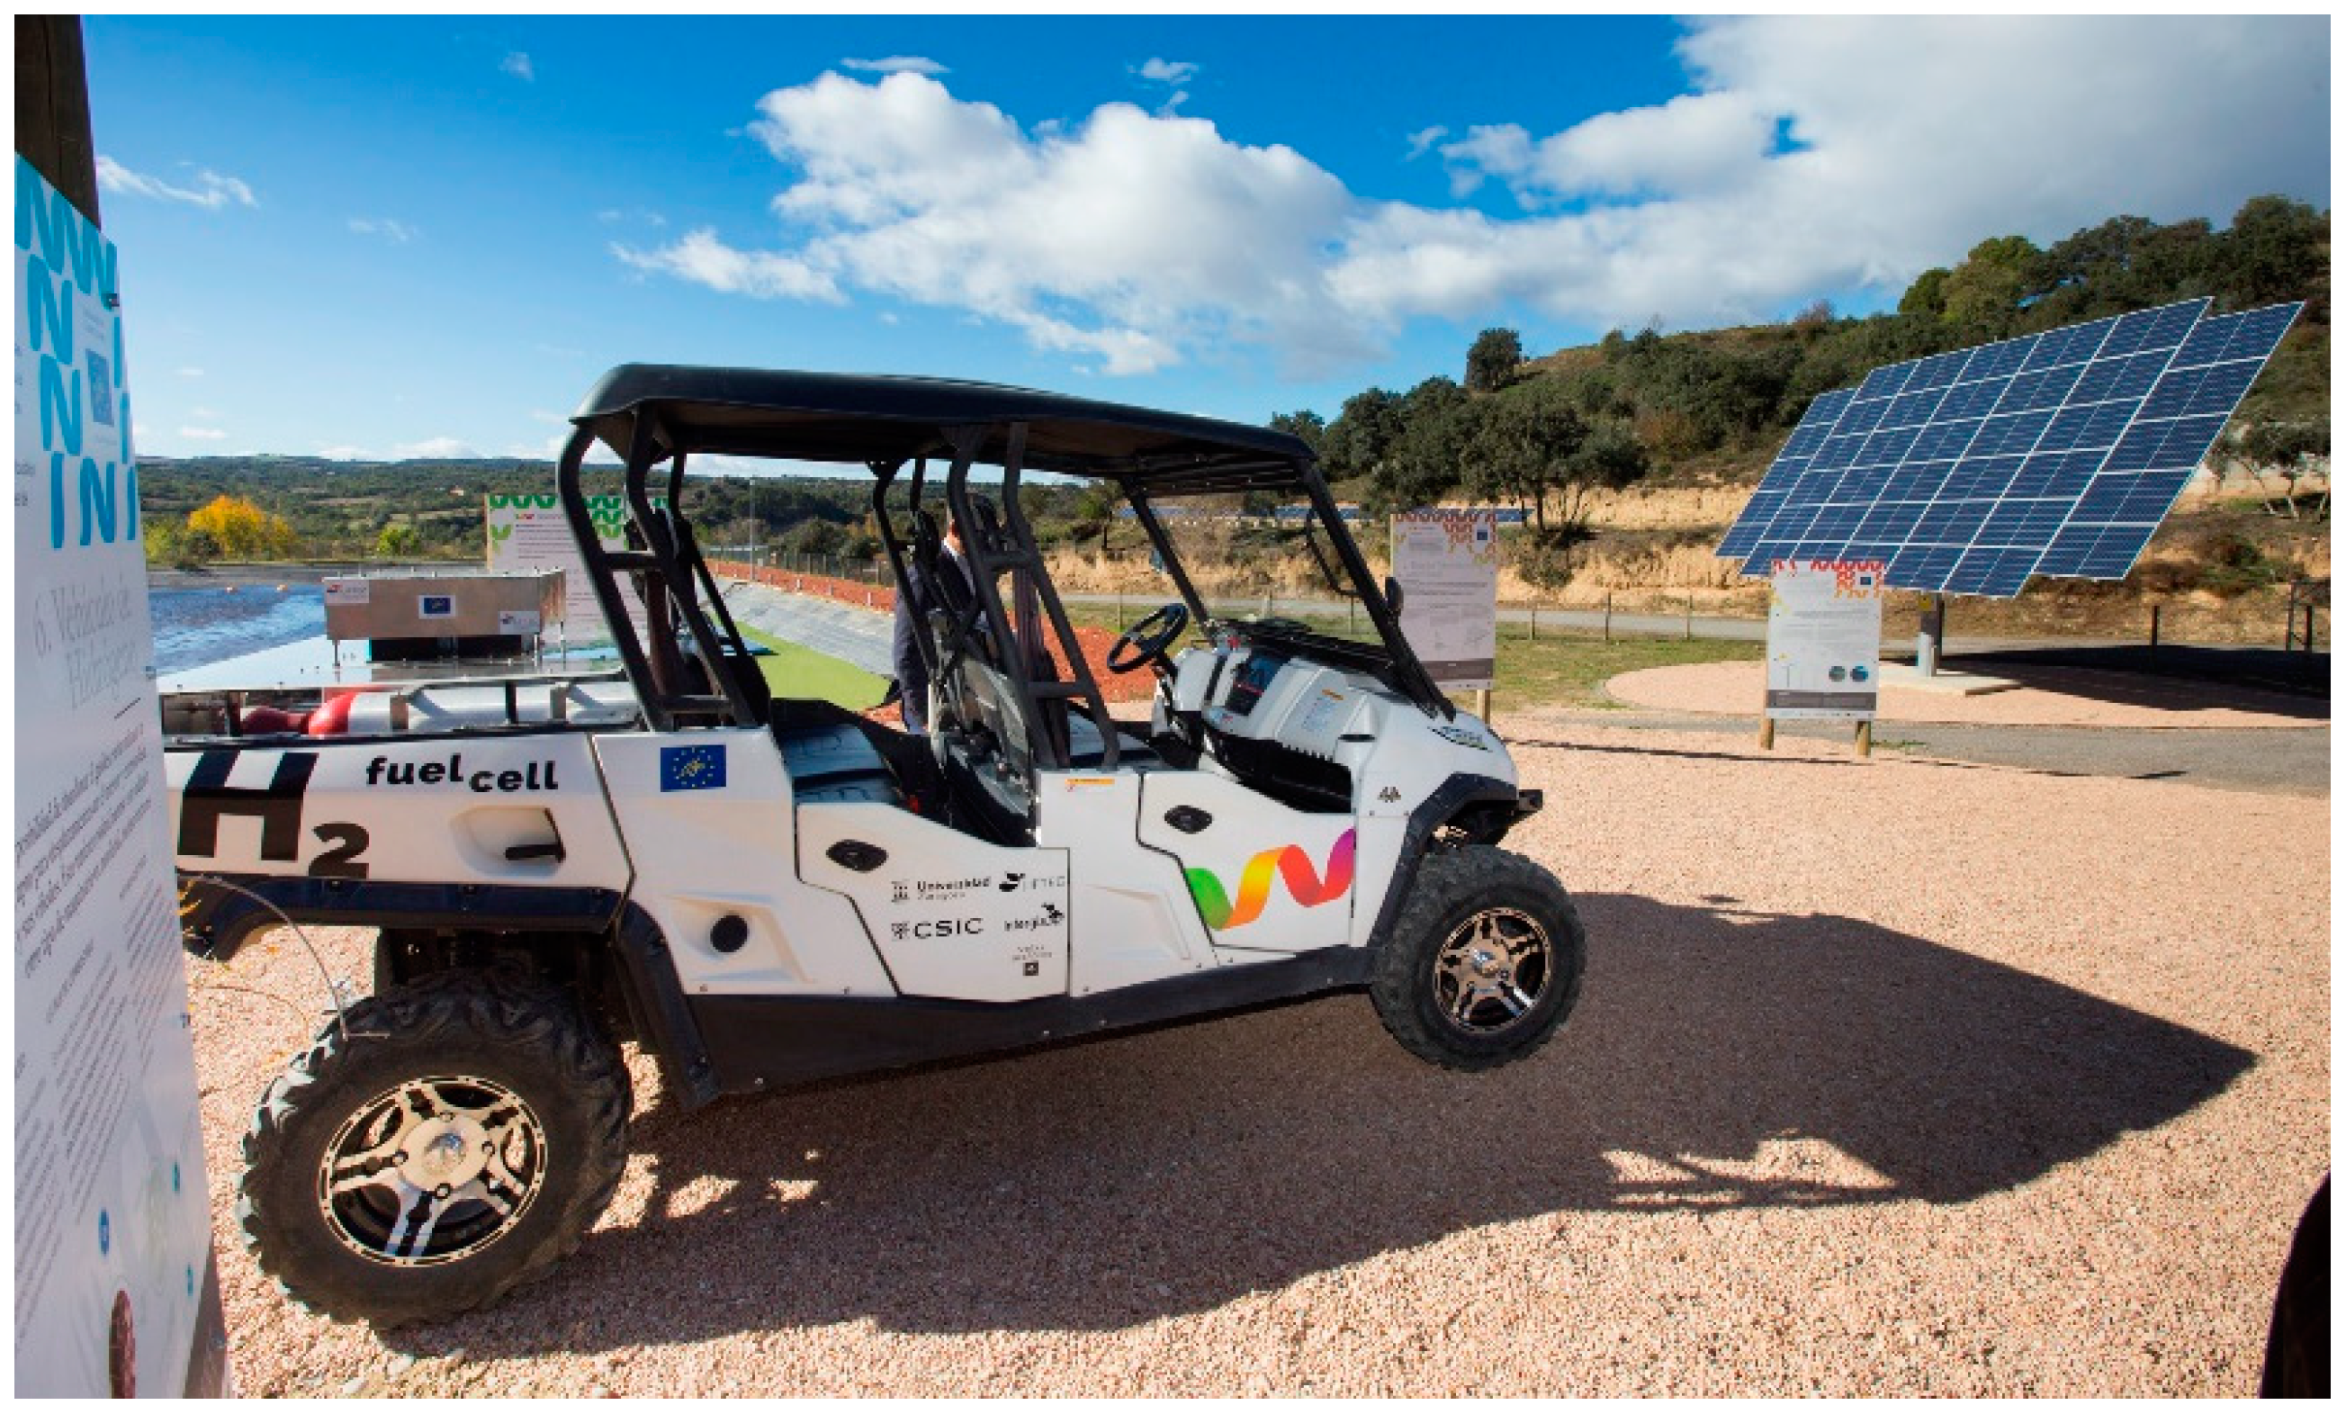
An electric all-terrain vehicle was modified to be an FCHEV (Figure 9), incorporating a fuel cell and the corresponding hydrogen tanks. The whole process is explained in depth in a previous article [25]. This vehicle is refuelled from the prototype’s tank to its own tanks, consisting of four aluminium cylinders, with a volume of 10 L and a weight of 12.75 kg each. Working at 200 bar pressure, the hydrogen that can be stored is 0.64 kg. The fuel cell, a Horizon H-3000 stack, reverses the electrolysis, combining hydrogen with oxygen to form water and produce electricity (Figure 10). This does not mean that the vehicle’s battery cannot also be charged from other sources, such as electricity from the grid in the winery, which is the base of the vehicle when it is not being used. Using 100% renewable energy and 100% clean hydrogen production and use processes, the operation of the vehicle can be classified as zero emissions. The vehicle is used to move around the vineyard and winery, avoiding the use of a conventional vehicle, with an internal combustion engine driven by diesel.
2.4.6. The EMS
The total installed power is the sum of all the loads, that is, 57.255 kW. However, not all of them can work simultaneously. The operation of the aerators clouds the water in the aeration pond. As a consequence, Pump A must not extract water from the start of the aerators until three hours after they stop. This reduces the maximum simultaneous load to 50.255 kW. On the one hand, this power is greater than the maximum output (44 kW) of the solar inverters. On the other hand, it is not necessary to activate all those charges at the same time. Consequently, the management strategy is based on activating the deferrable charges according to the power produced at each moment. In this way, we attempt to make the consumption curve approximate the generation curve. The direct and instantaneous use of the energy produced reduces the losses associated with the cycling of energy in the battery.
However, it was not possible to use photovoltaic production as a control variable. This is because if the system consumption, including the battery charge, exceeds the photovoltaic production, the solar inverters reduce their power to maintain the stability and frequency of the micro-grid. When that happens, the power delivered by the solar inverters is lower than what would correspond to the incident radiation. For this reason, it was decided that the first control variable was solar irradiation, since it is directly related to the power that the inverters can deliver. To do this, the correspondence between the irradiation and the power obtained from the solar inverters was established.
The second control variable is the SOC of the battery. The purpose is that, at the end of the day, the battery has enough energy stored to ensure night-time operation (heat pump, control system and, if applicable, irrigation).
For the purposes of the management strategy, the charges were divided into four groups:
- (1)
- Loads whose operation is permanent: their operation is independent of the EMS. They are the control system and the heat pump. Their operation is guaranteed, except if the battery inverters stop the micro-grid to protect the battery below the minimum allowed SOC.
- (2)
- Loads that the operator of the facility activates directly or by programming: their operation is allowed only above a certain SOC, which is different for each one. They are irrigation (Pump C), water pumping (Pump A), and sludge pumps. Pump B, which is activated automatically, also belongs to this group. Each of these loads has a minimum SOC assigned, below which it cannot be active. The higher priority, the lower the SOC allowed. Therefore, as the stored energy decreases, lower priority loads stop. The parameters, finally adjusted for these loads, are shown in Table 5.
- (3)
- Deferrable loads that are activated depending on the irradiation: the aerators. They also have an assigned minimum SOC, below which they are not activated, irrespective of irradiation. These loads take advantage of the power available at each moment, and its management allows the battery to recharge in the morning and reach the sunset with a level high enough for the maintenance of the system. The parameters, finally adjusted for these loads, are shown in Table 6. It should be noted that the irradiation level for start-up is higher than that for the stop level, which facilitates the recovery of the battery SOC in the morning. This hysteresis also introduces stability into its operation. Moreover, the operator of the installation periodically measures the level of oxygen in the water in the aeration pond to check that it does not fall below the minimum level allowed.
- (4)
- Extraction of surplus energy from the system. This energy drainage from the RES to the FCHEV can be conducted either in the form of hydrogen or by recharging the vehicle’s battery. On the one hand, the production of hydrogen is allowed under the condition that the battery has reached a very high SOC (90%). On the other hand, charging the vehicle’s battery requires the presence of the vehicle parked next to the RES, which is infrequent.
All the aforementioned parameters have previously been estimated and subsequently checked and adjusted during the tests of the RES.
3. Results
The prototypes, once installed, are used in real working conditions. In addition to the observations of and approval by the workers and managers of the winery, a series of data have been collected to carry out various studies. The following subsections present the results of the short-term operation of the RES (Section 3.1), the long-term (a year) operation of the RES (Section 3.2), the hydrogen production (Section 3.3), the FCHEV (Section 3.4), and the avoided emissions (Section 3.5).
3.1. Short-Term Operation
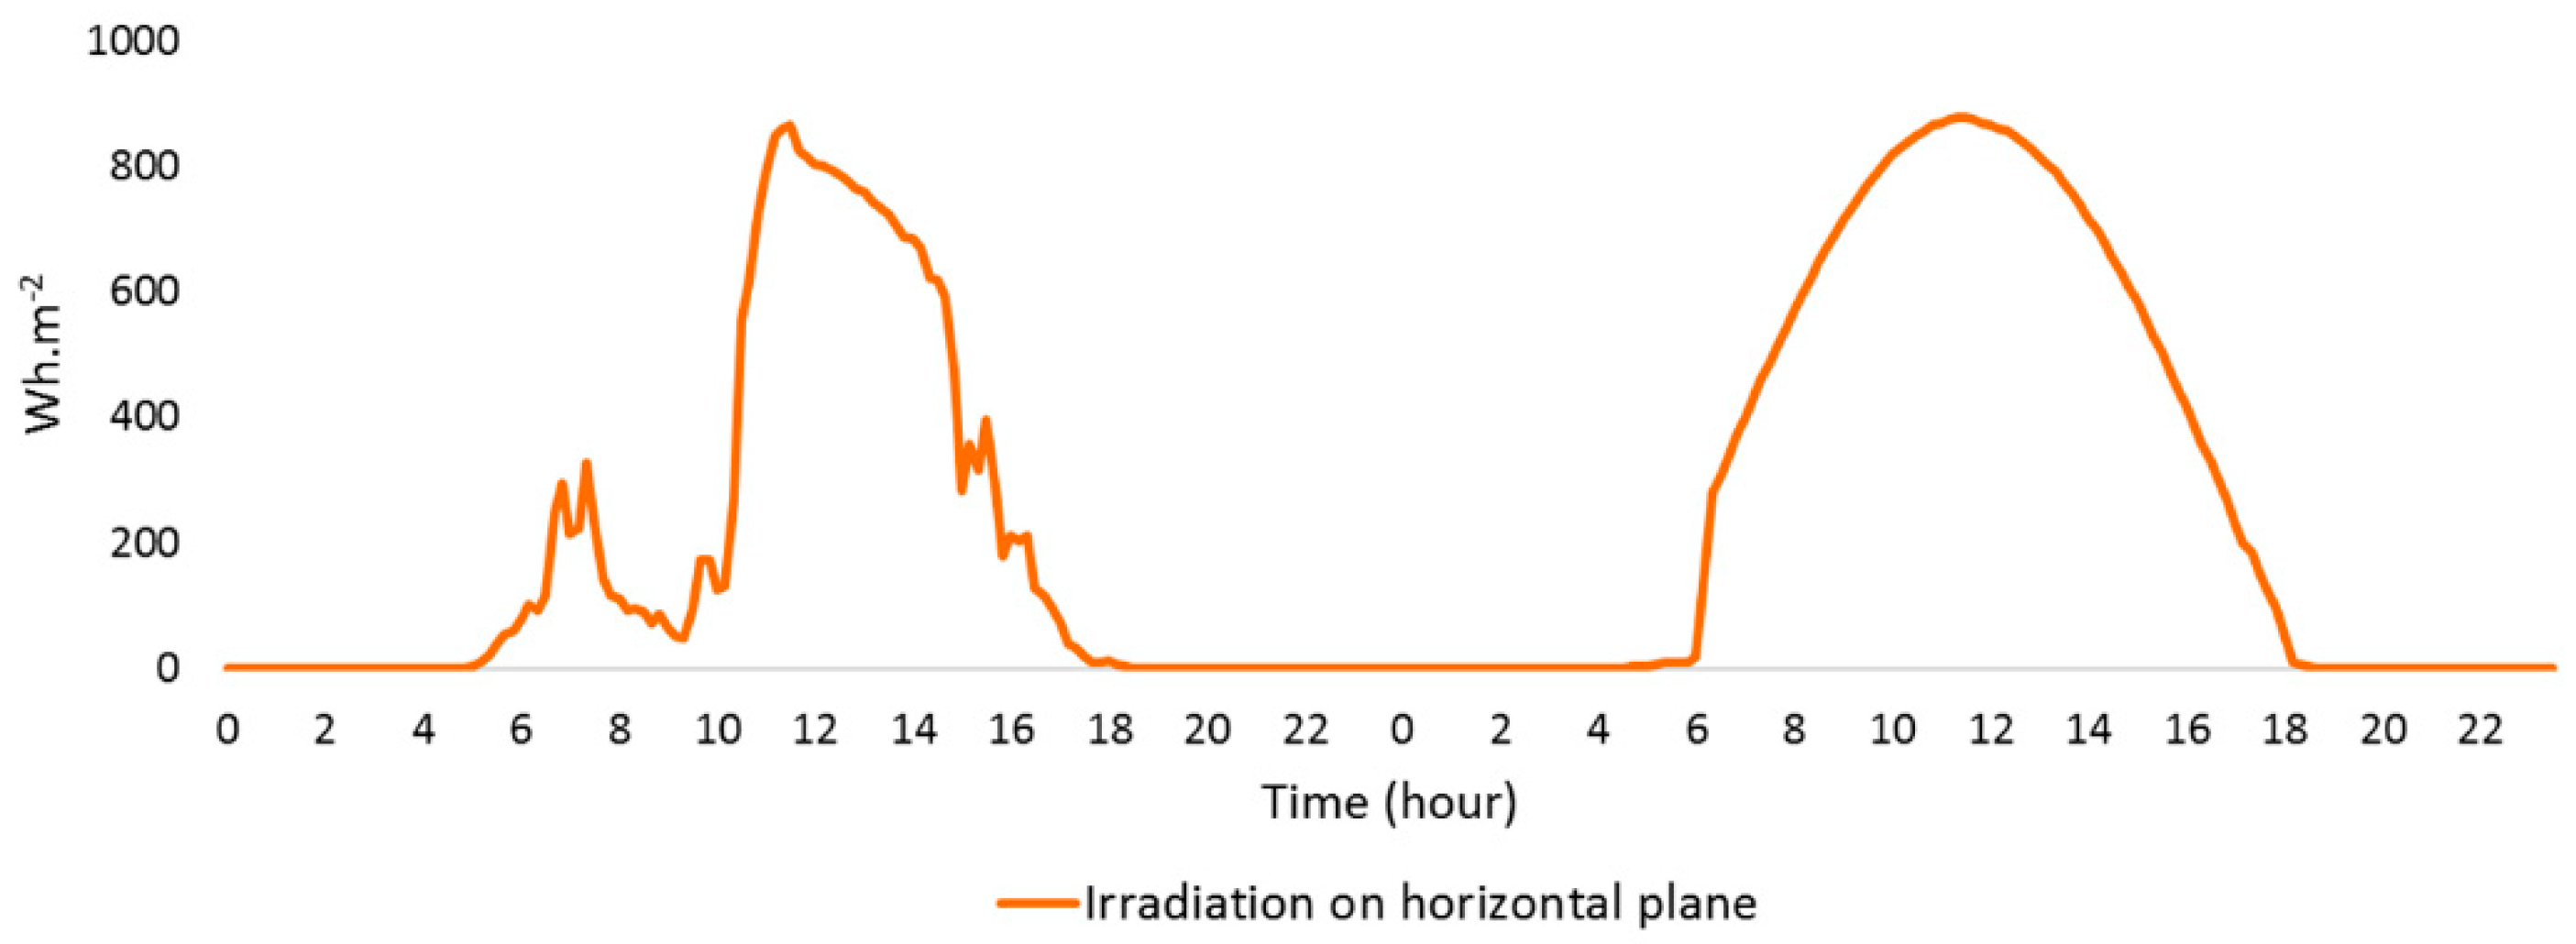
The Figure 11 is the graph of irradiation on horizontal plane, measured at the location, over two consecutive days, specifically 5 and 6 May 2017. The first day the weather was cloudy, while the second day was sunny. This period includes different events, useful in checking the behaviour of the system in various situations.
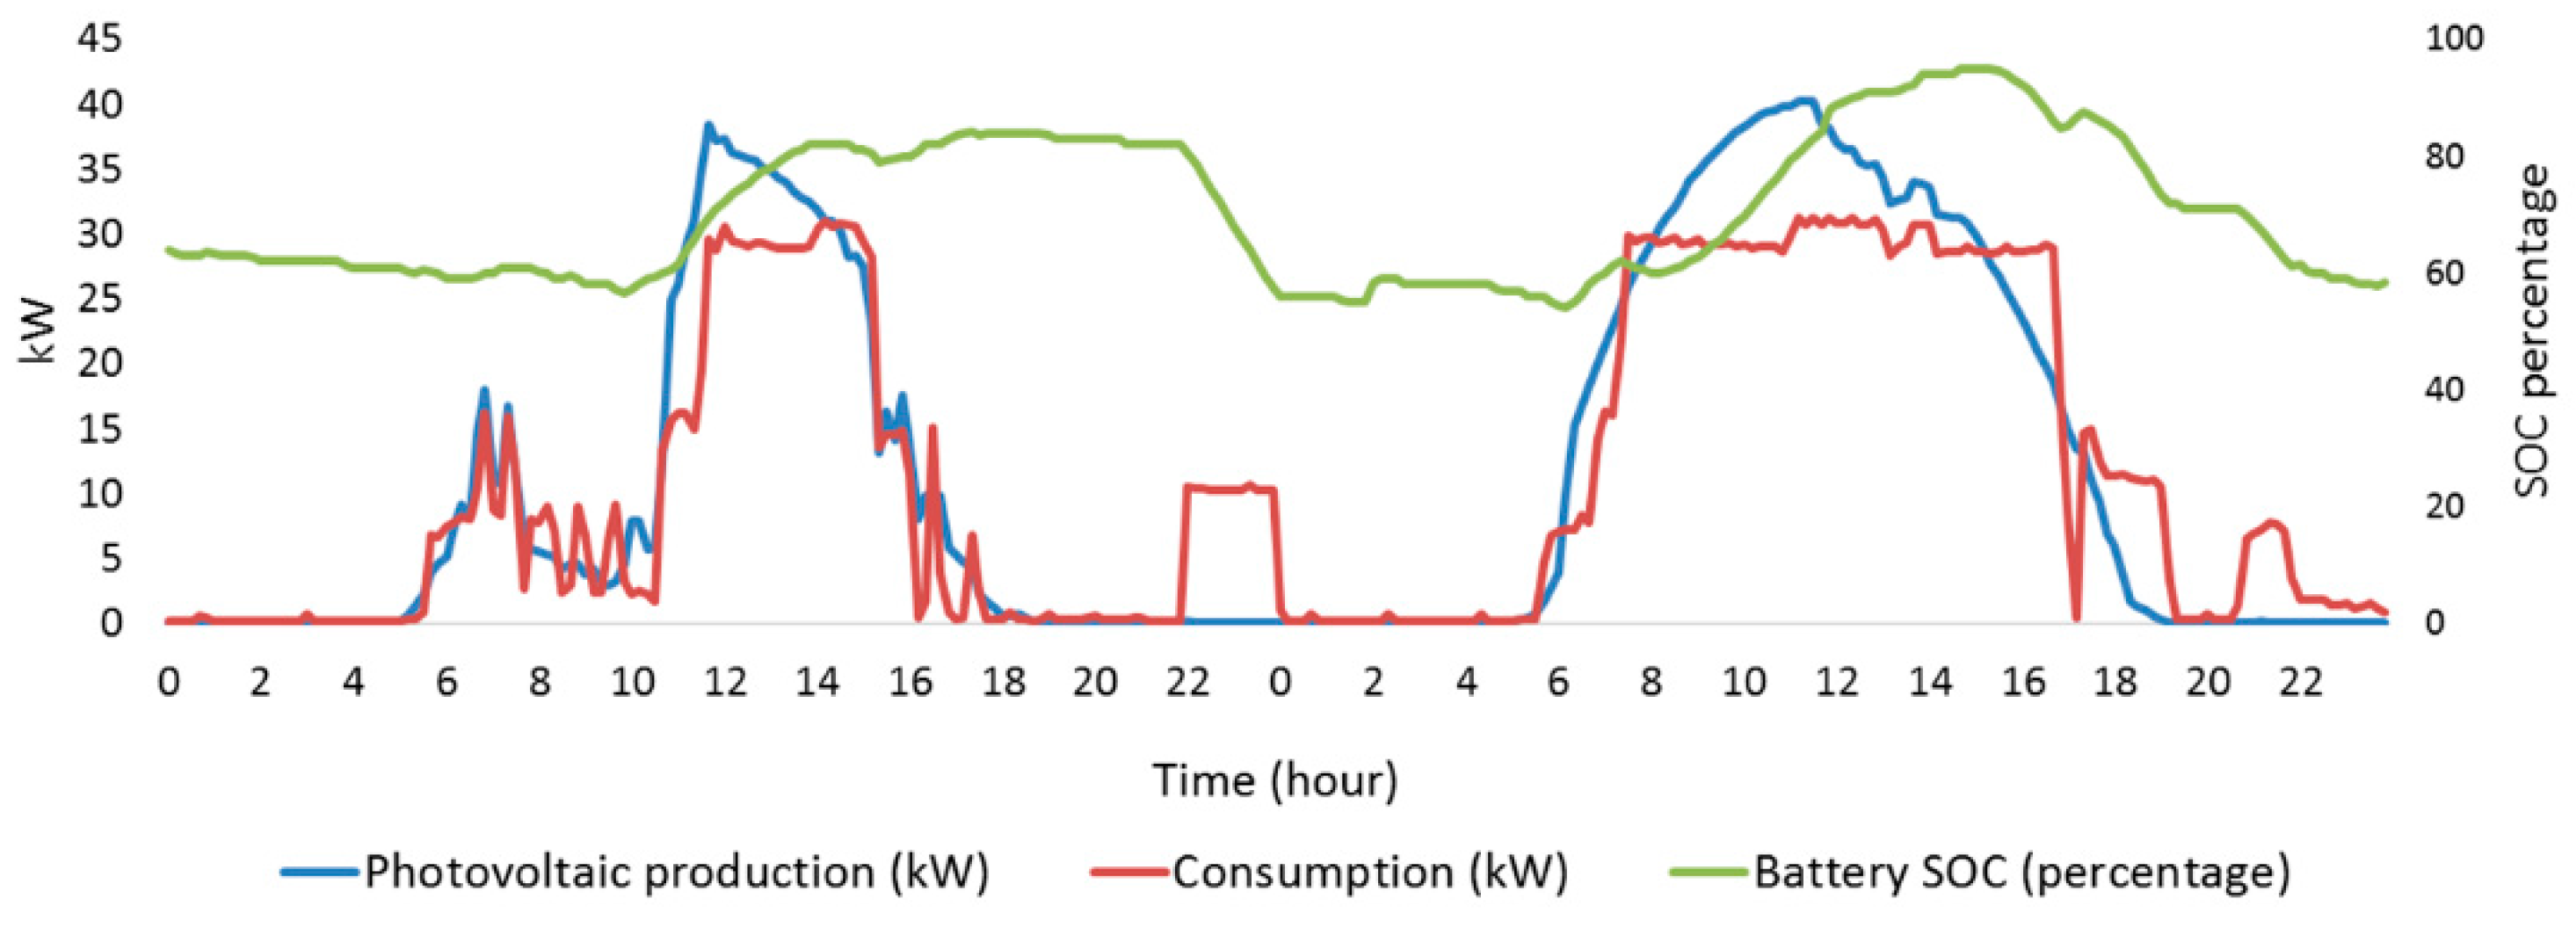
The Figure 12 shows the performance of the RES over the same days. During this period, the production of hydrogen was not allowed, in order to observe the behaviour in the absence of long-term storage.
The first day, the production is irregular due to the cloudy weather in the morning. The EMS operates the loads in such a way that the consumption curve is adjusted according to the available power (as explained in Section 2.4.6). Some of the energy is diverted to the battery to recover its SOC. At night, the irrigation was activated for two hours, fulfilling the schedule programmed by the user. In consequence, the SOC of the battery decreases. The small jump of the SOC around 02:00 h the following night does not correspond to an increase of energy, but to the daily recalibration of the SOC measurement.
The second day, the weather is clear and the production is in accordance with the solar trajectory. However, after 11:40 h, the production is disturbed. This is because there are no more charges available to be activated and the battery is almost fully charged. In this situation, the solar inverters reduce their power output in order to maintain the voltage and frequency of the RES. When this happens, the production follows the variations in the consumption. If the production of hydrogen had not been deactivated, it would not have been necessary to reduce production, because the surplus of energy could have been deviated to long-term storage.
In summary, the EMS worked as desired. The system made moderate use of the battery, cycling a small fraction of the managed energy. As a result, the losses associated with the charge and discharge processes were slight. In addition, the SOC remained at conservative levels, benefiting the health of the battery.
3.2. Long-Term Operation
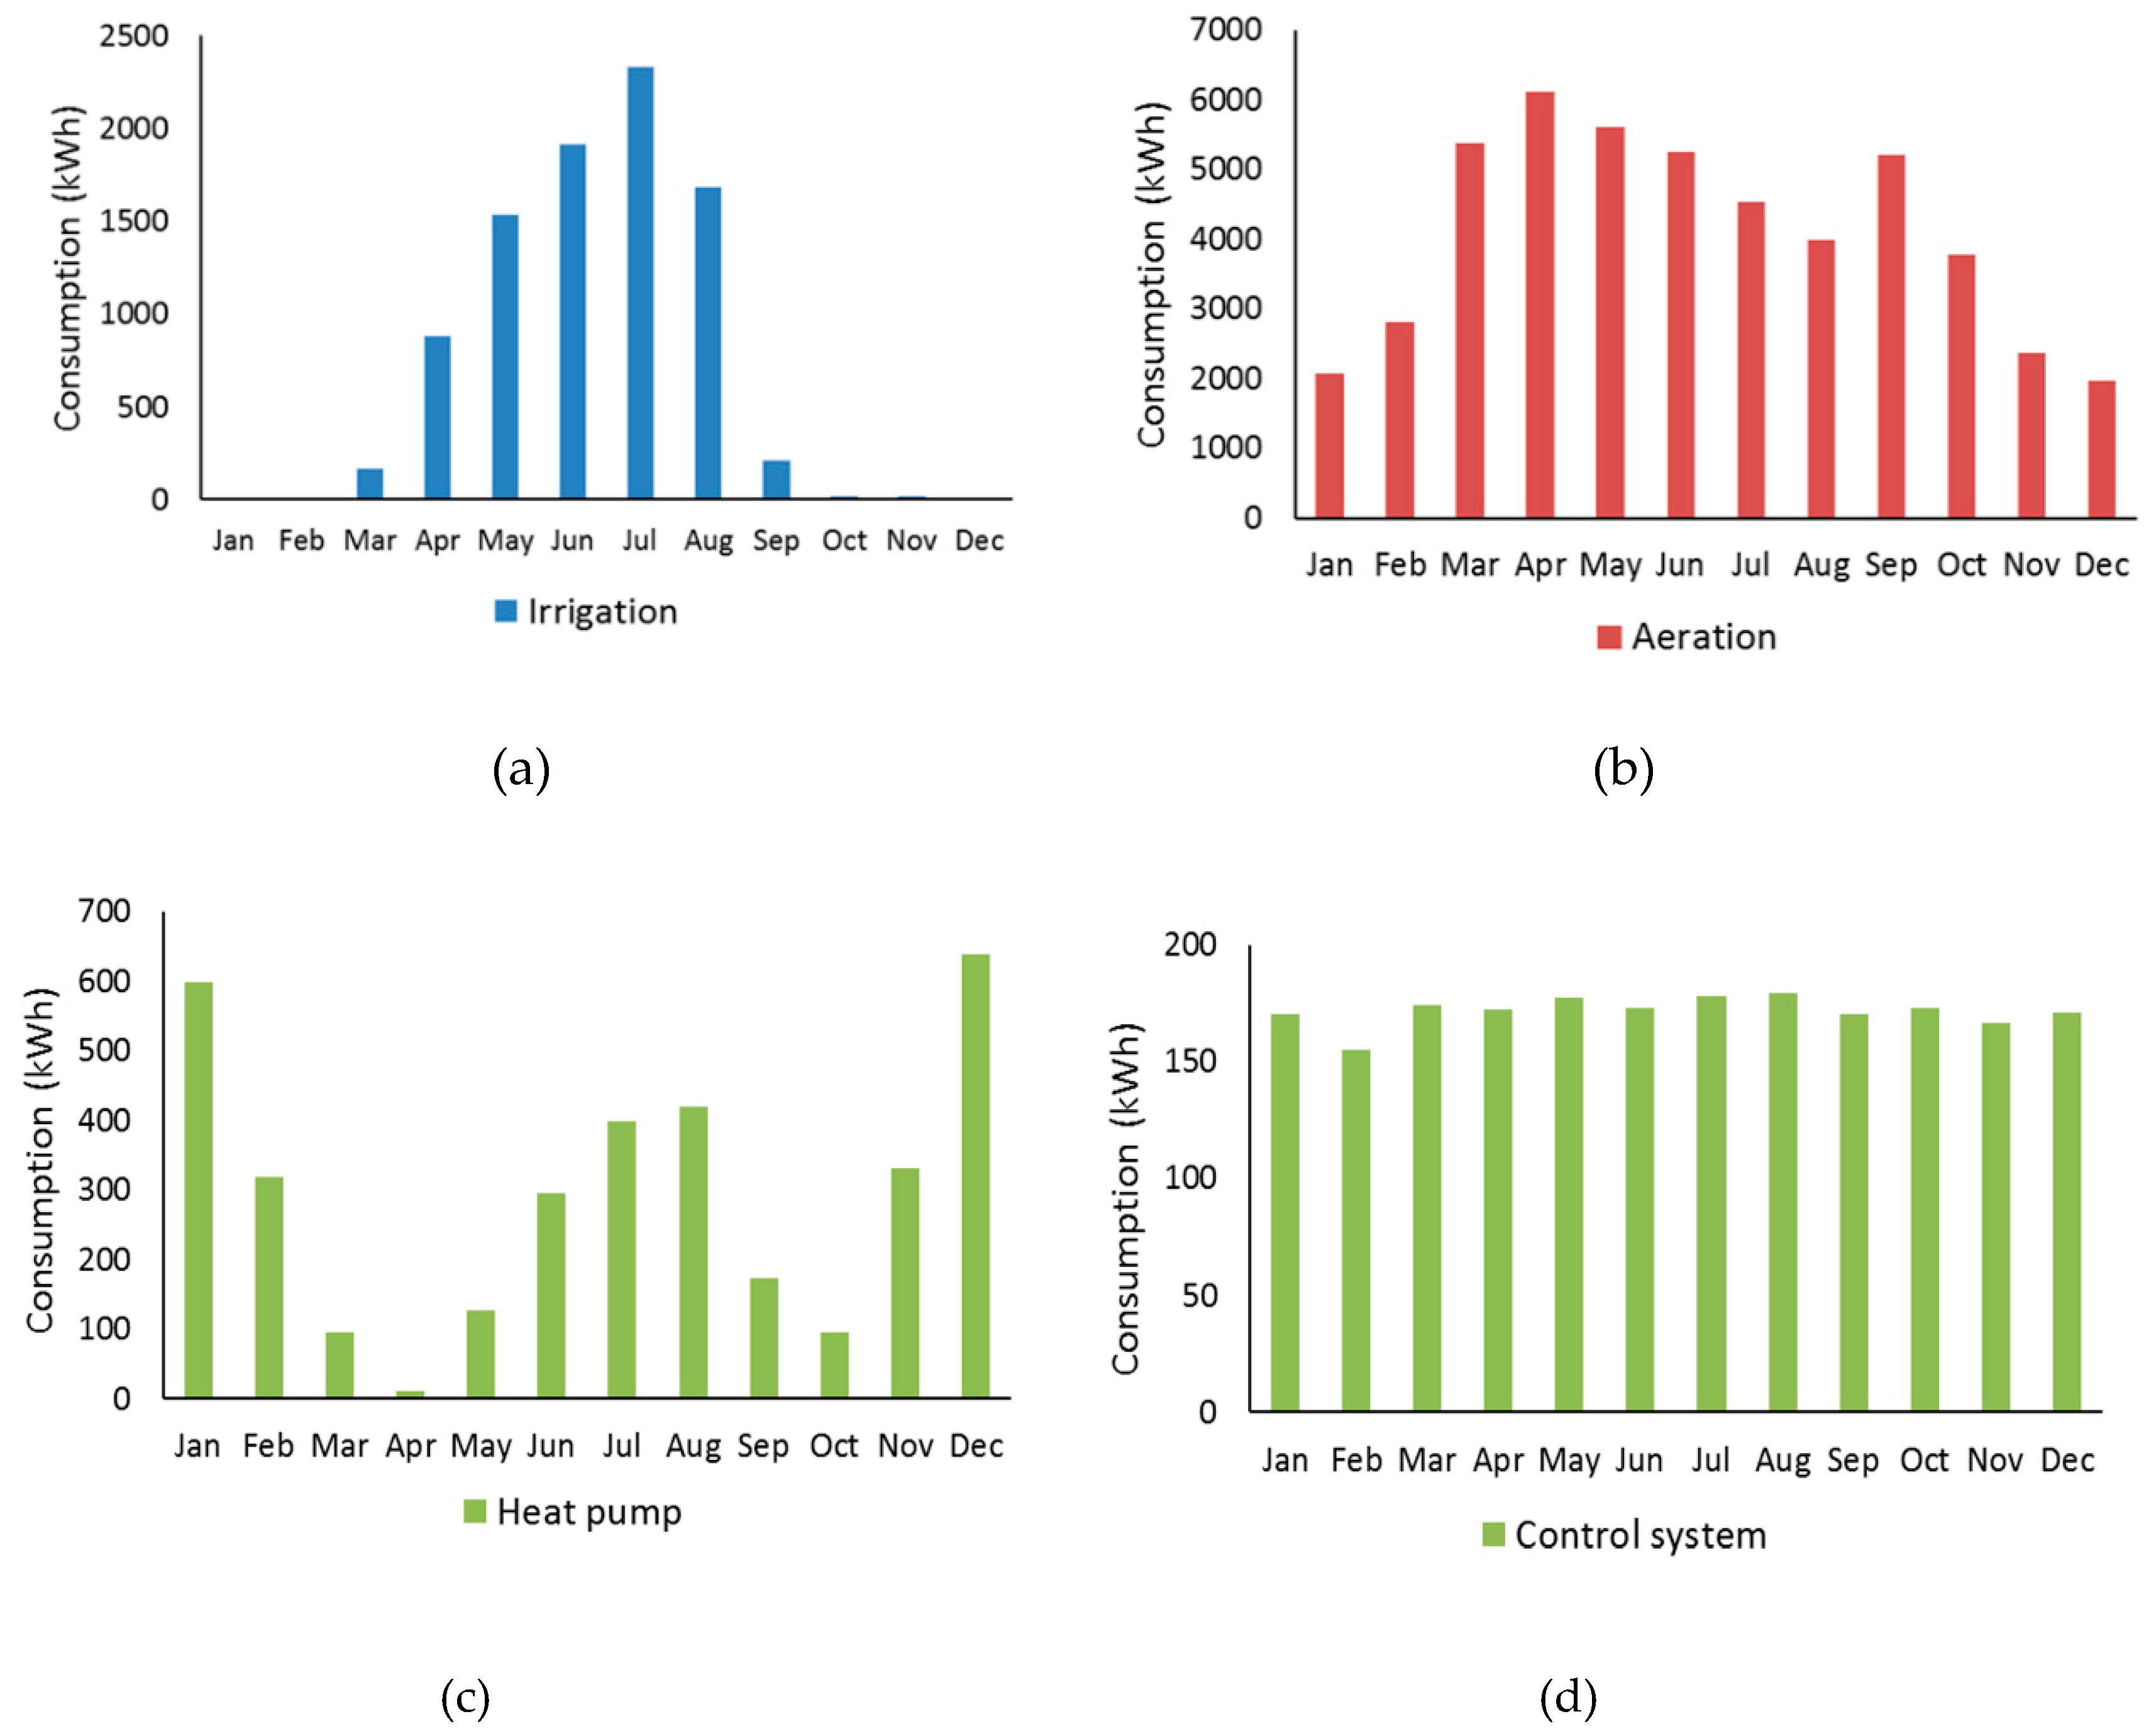
The consumption of the different sets of loads, excluding the hydrogen production, over a year of operation, is shown in Table 7. Their graphs, on a monthly basis, are shown in Figure 11.
3.2.1. Irrigation and Water Pumping
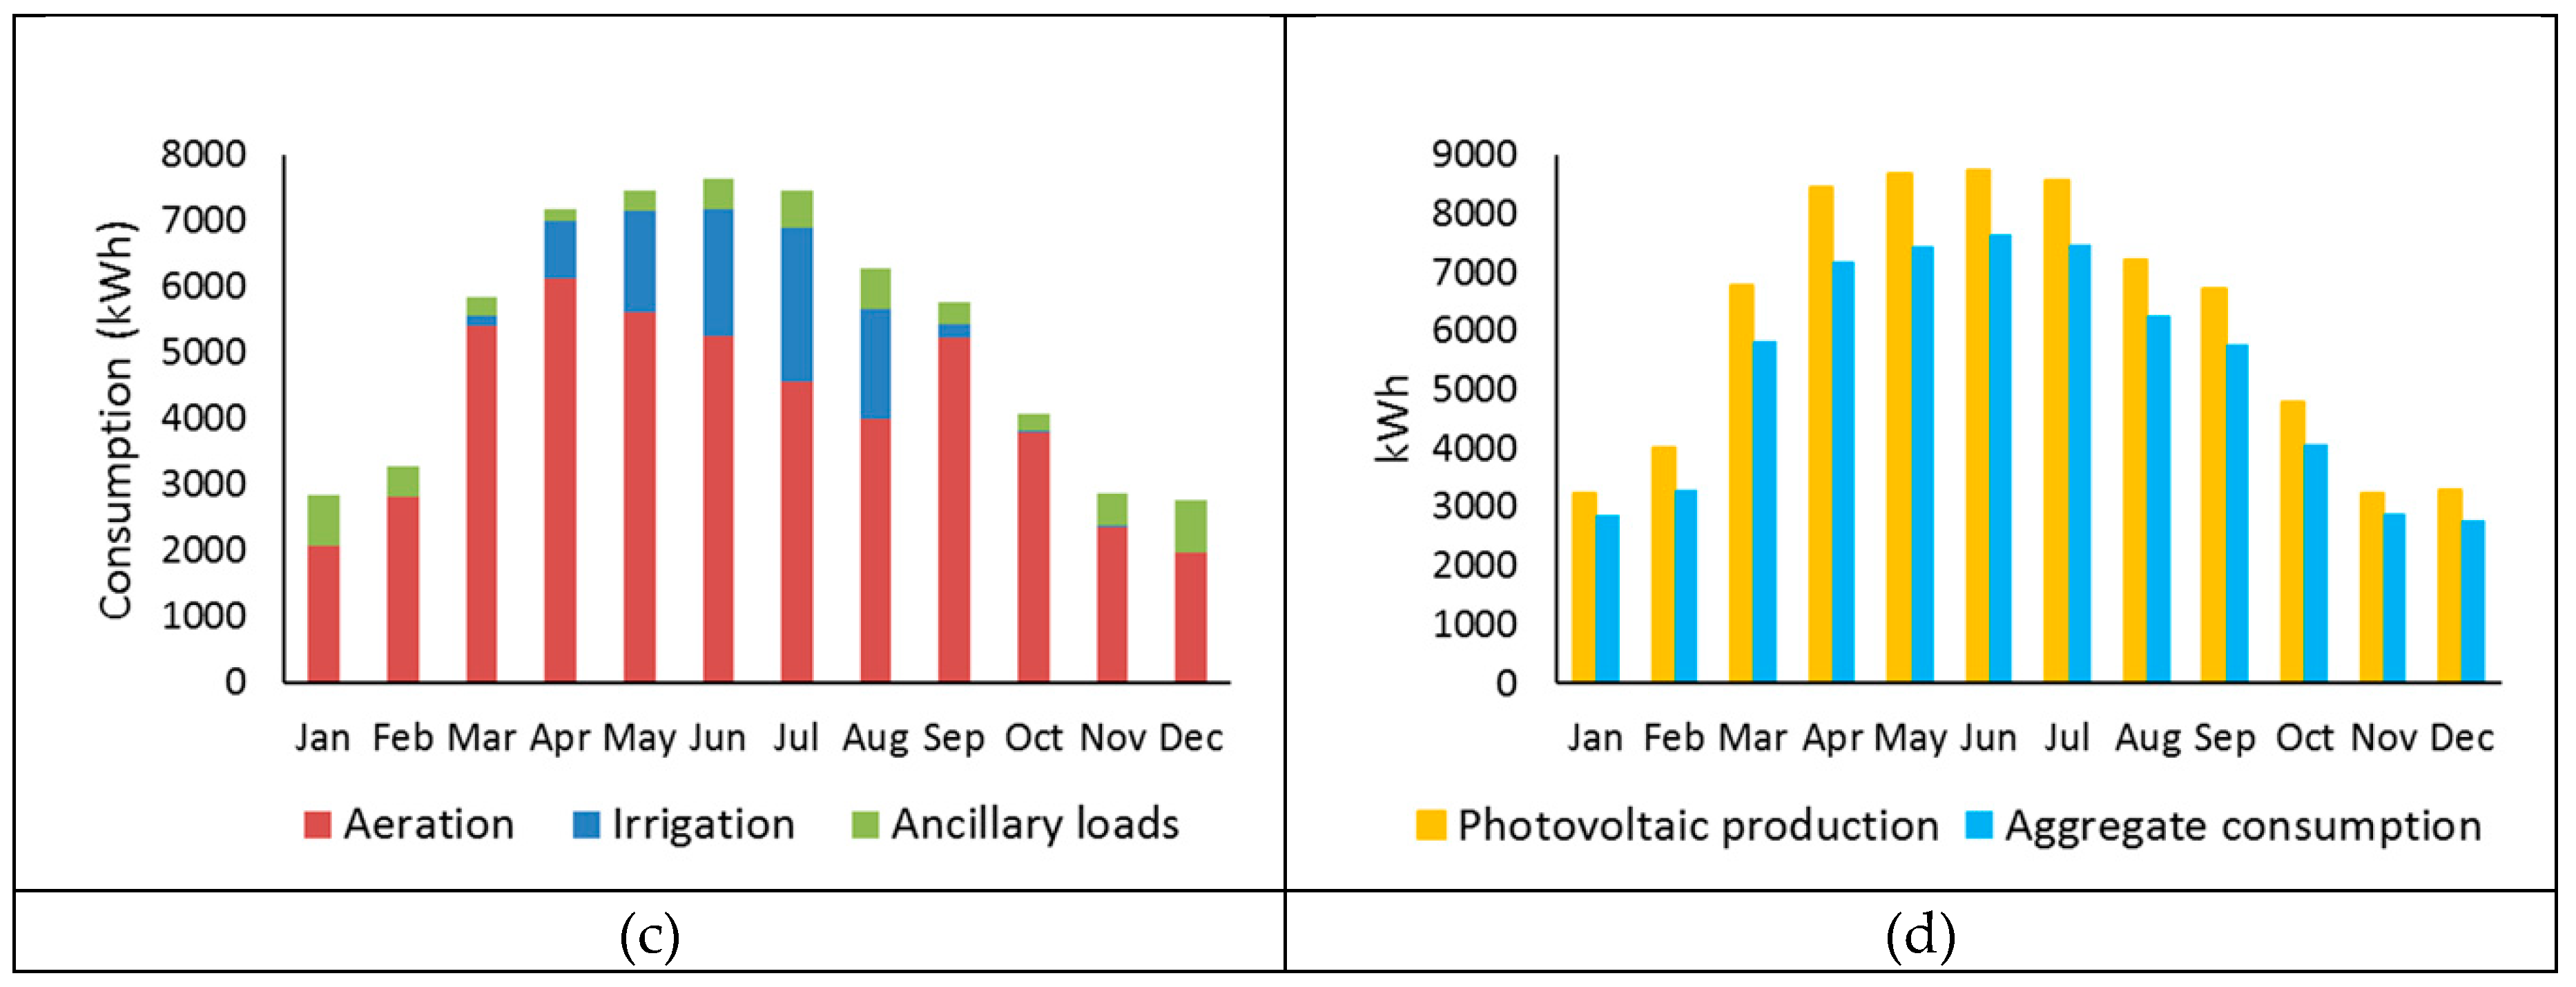
The consumption for irrigation and water pumping, that is, Pumps A, B, and C, is shown in Figure 13a. Its profile is similar to that taken into account during the design phase (Section 2.2.1.), although the irrigation started in March and the maximum has been moved to July, instead of August. Slight variations like this are common, depending on the different evolution of the conditions of the crop from one year to the next. There were very small consumptions, barely visible in the graph, during the months when there was no irrigation, because of the automatic activation of Pump B to drain the rainfall in the sand filter of the WWTP.
As indicated in Section 2.2.1, the manageability of irrigation (Pump C) is limited. If on some days there is not enough energy available for the scheduled irrigation, it can be deferred to the days immediately following. In fact, because the sunny weather during the irrigation season in the Mediterranean climate, this has happened on just a few days. In summary, during the period of operation studied, the irrigation program that was established on a weekly basis has been fulfilled. Regarding the pumping of water by Pumps A and C, the capacity of the irrigation pond (900 m3) allows for a margin of several days of irrigation, so that its refilling has been done without management difficulties.
3.2.2. Aerators and Sludge Pumps
The consumption of the two aerators and the two sludge pumps is shown in Figure 13b. As indicated in Section 2.2.2, the aerators are deferrable loads. Their operation has been controlled according to the EMS, as indicated in Section 2.4.6. The profile of the measured consumption shows a seasonal profile, with maximums in April and September. On the one hand, this profile is partly caused by the availability of energy for the activation of the aerators, that is, by the difference between the energy produced and the consumption of the priority loads. On the other hand, the maximums coincide with the start of the irrigation season (April) and its end (September). In April, the extraction of the water from the aeration basin—to be used in irrigation—begins, so it must be sufficiently purified. In September, the irrigation ends and the vintage begins, and with it, the discharge of the new wastewater from the winery.
Regarding the result of the aeration, the process was correct and all irrigation water was of adequate quality. The oxygen levels in the aeration pond remained above the minimum necessary and increased when more energy was sent to the aerators, accelerating the process.
3.2.3. Ancillary Loads: Heat Pump and Control System
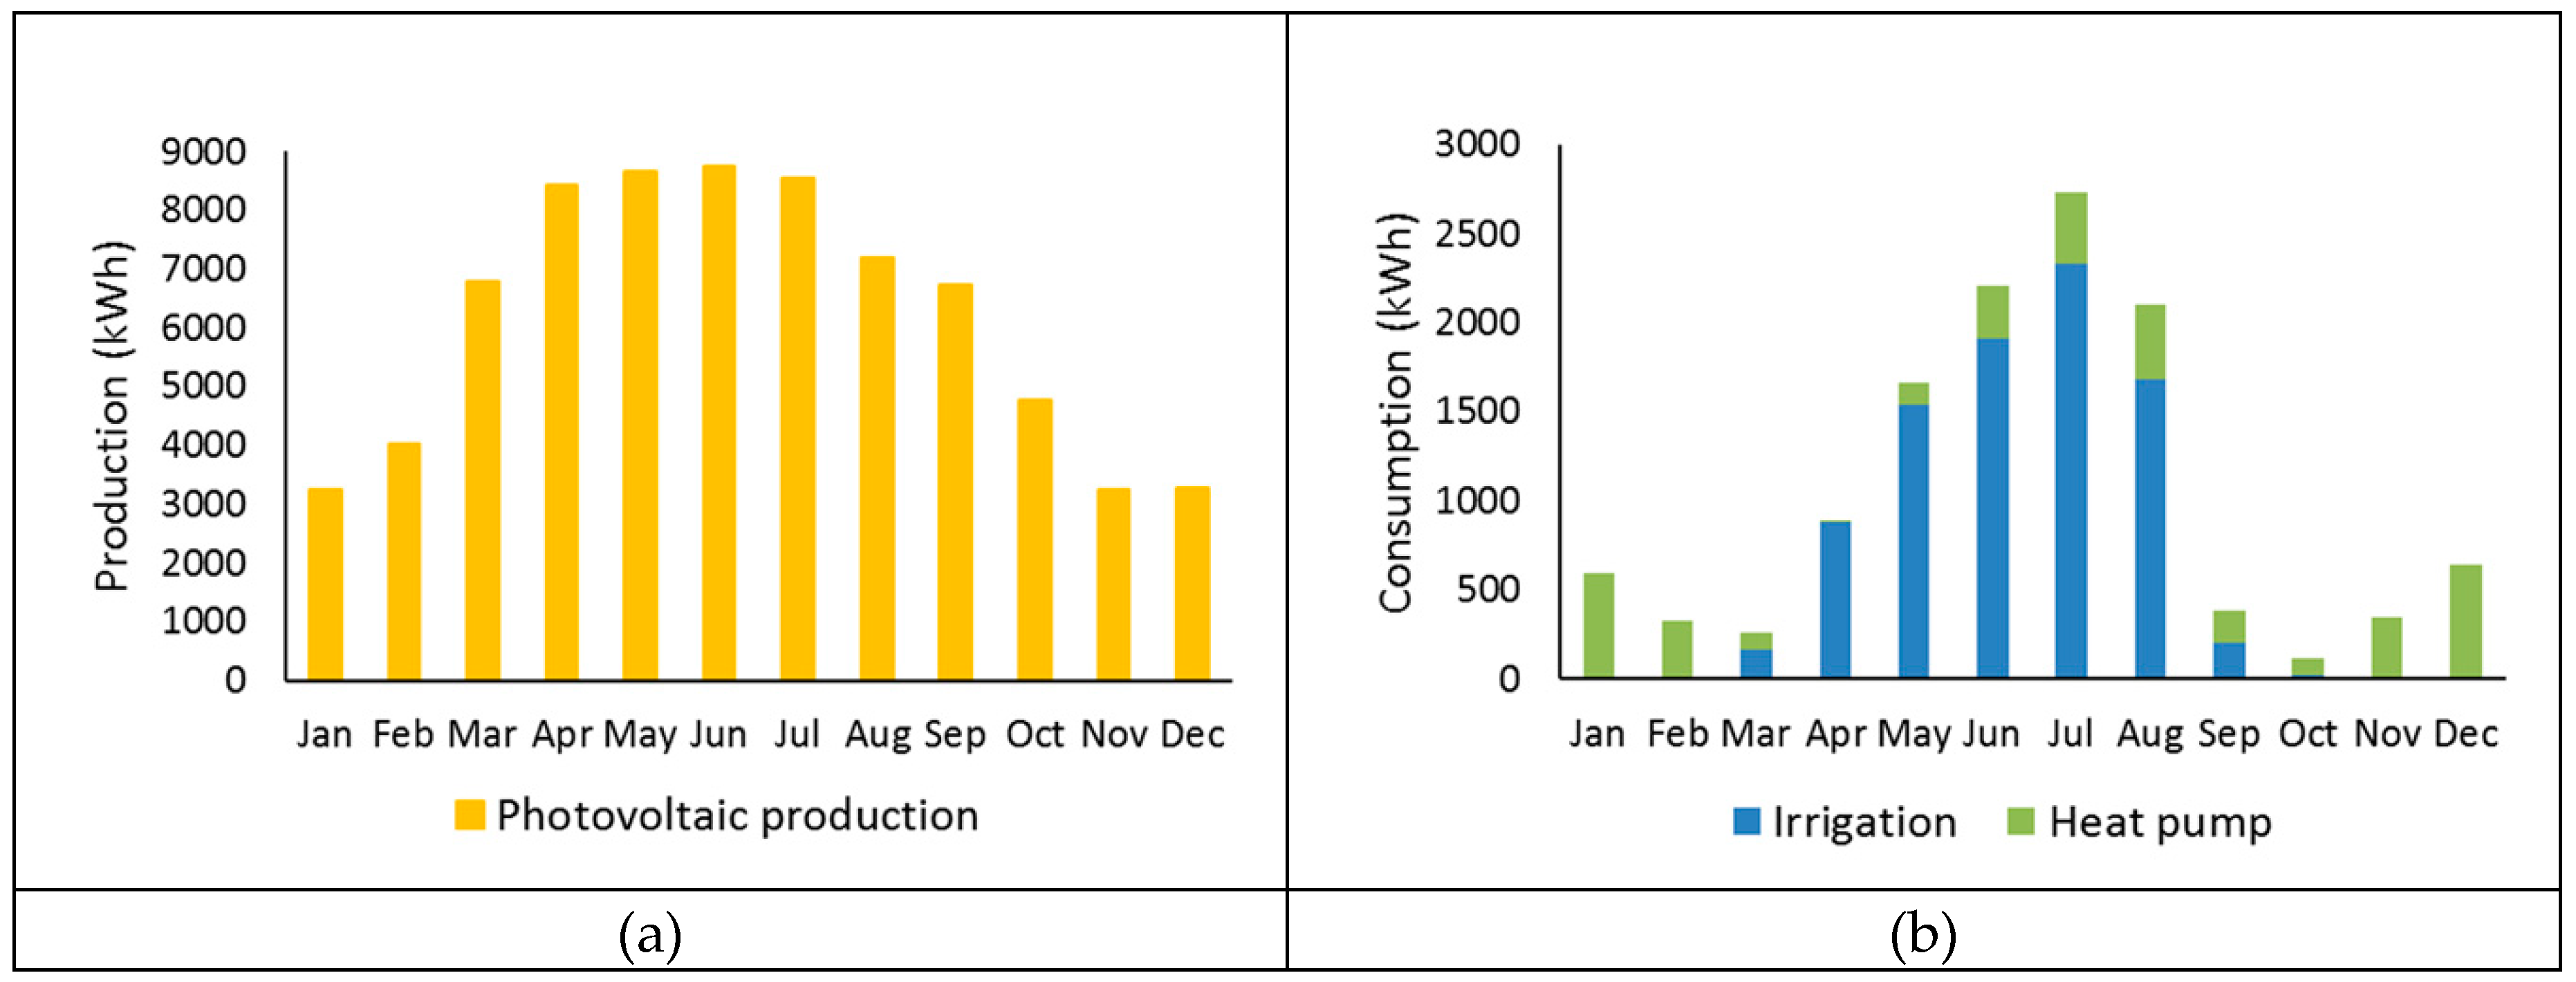
The consumption of the heat pump is shown in Figure 13c. Its maximum consumption occurs in winter and its relative maximum in summer due to the temperatures of the external environment. This seasonality is very different from those of irrigation and aeration. The consumption of the control system, which is practically constant and of a small magnitude, is shown in Figure 13d.
3.2.4. Production Versus Aggregate Consumption
The photovoltaic production over the studied year is shown in Figure 14a. The closer the graph of consumption to production, the lower the surplus energy. None of the individual loads, shown in Figure 13, have a profile similar to those of production.
Graphs of the aggregate consumption of the loads have been obtained, which are to be compared with photovoltaic production. The irrigation and heat pump have different seasonality. Both consumptions are priorities, and none of them has been deferred in the medium or long term. On the one hand, the maximum of the heat pump occurs in winter, when the demand for irrigation is zero. On the other hand, the maximum of the irrigation coincides with a relative maximum of the heat pump, but also with the maximum of photovoltaic production. The aggregate consumption of both is shown in Figure 14b. This combination approaches the profile of production better than the loads considered individually.
The aggregate consumption, including all loads, except the production of hydrogen, which is fed by the surplus energy, is shown in Figure 14c. This presents a very similar profile to that of photovoltaic production. The seasonal profile of the aerators is a consequence of the management carried out by the control system, according to the EMS, as explained in Section 2.4.6, adapting the consumption to the available energy. As a result, the consumption is well suited to the demand, taking advantage of the available energy and adopting a very similar annual profile, as shown in the Figure 14d.
Regarding the annual energy balance, the annual totals of production, consumption, energy used to produce hydrogen, and the electrical losses in the RES, are shown in Table 8. All energy measurements have been made at the connection of each element (solar inverters, loads, battery inverters, hydrogen production, etc.) to the AC bus. As a result, it can be stated that the measured losses occur in the cycling of energy in the battery. This is in the AC-DC and DC-AC conversions as well as in the battery itself. One of the criteria incorporated in the EMS is the reduction of energy cycled in the battery in order to avoid the associated losses. In fact, the measured losses correspond to the cycling of energy for nightly consumption (Pump C, heat pump and control system) and the intraday adjustment of a small portion of the daily consumption. It is remarkable that the lost energy represents 3.4% of the produced energy, which is an excellent figure for an RES with battery storage.
3.3 Hydrogen Production
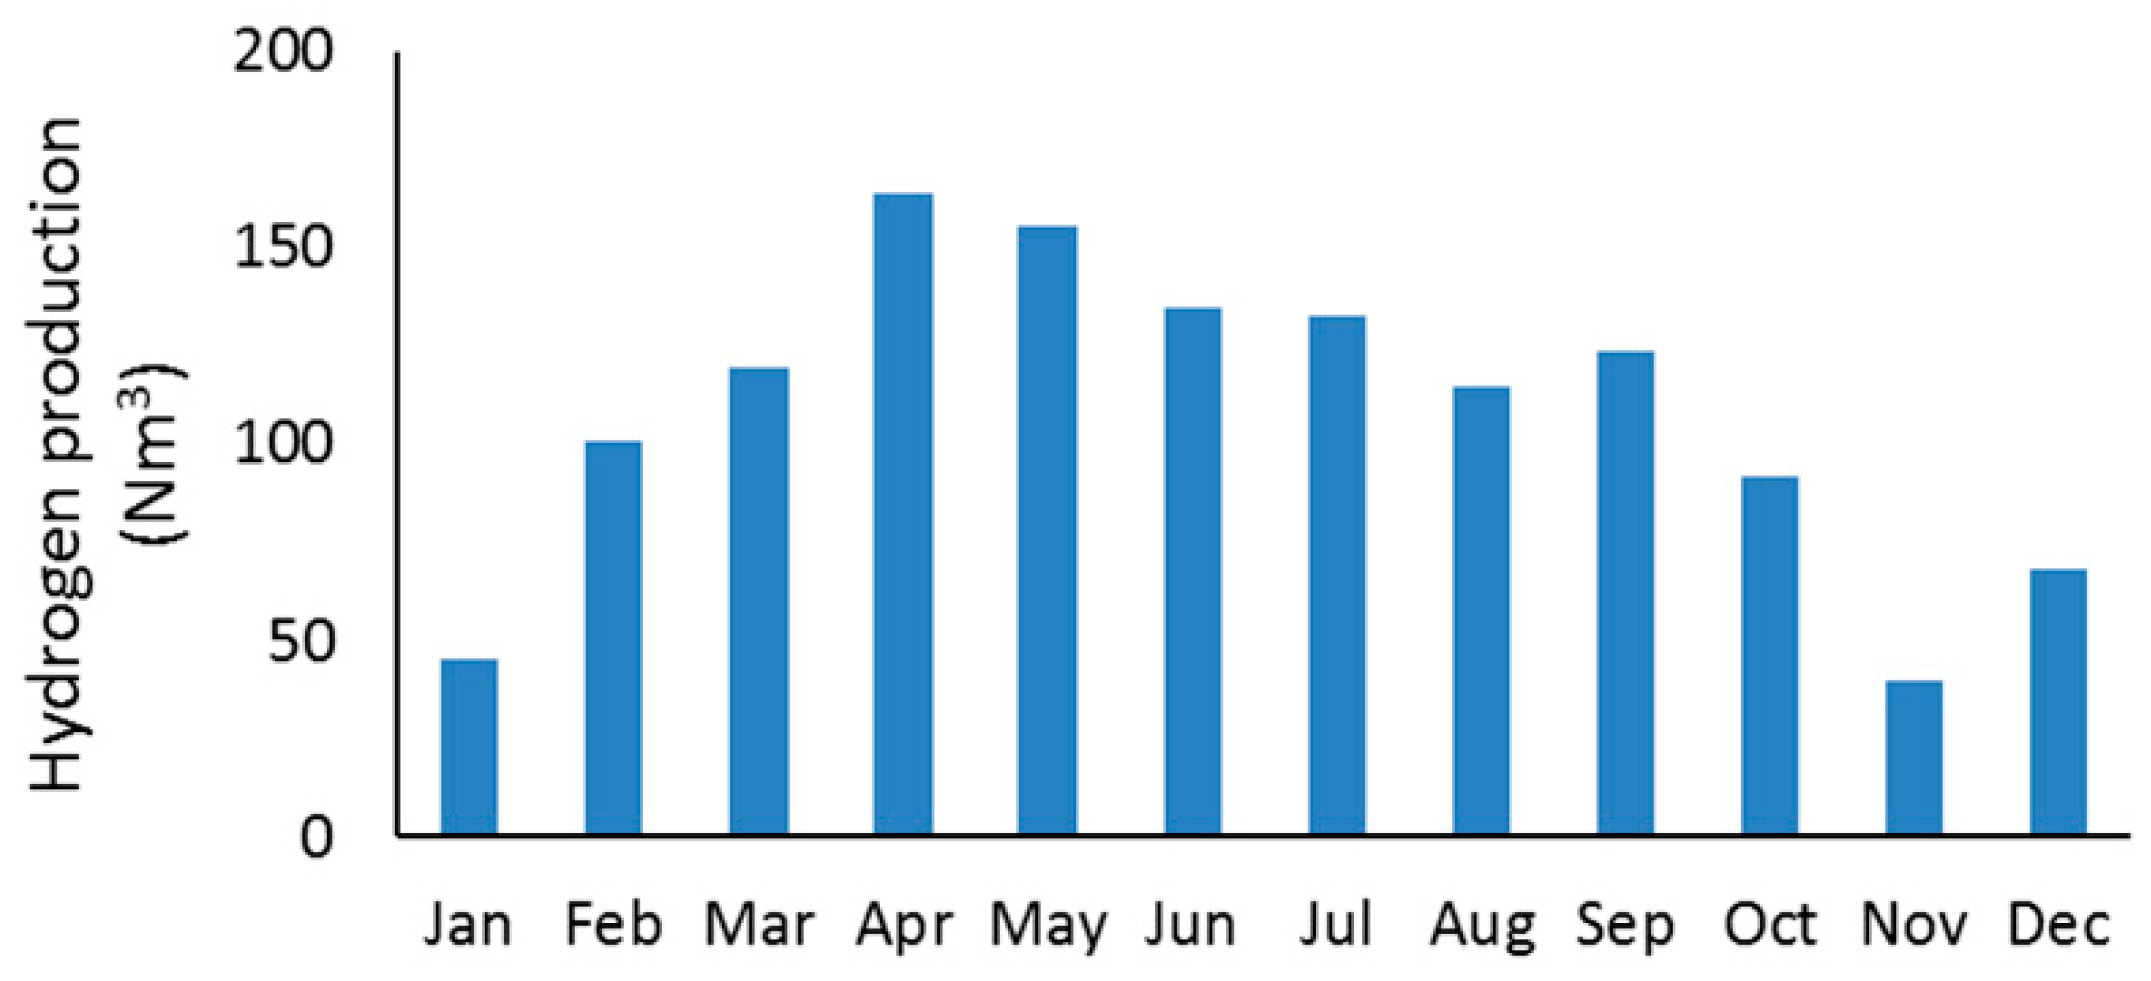
The energy that is not used simultaneously with the production is stored in the battery. Once the SOC is very high, the control system dispatches the surplus energy to produce hydrogen. Some parameters of the hydrogen production system are shown in Table 9. As a result, over the year studied, the system produced 1290 Nm3 of hydrogen, which incorporates 3870 kWh of energy. The volume of hydrogen production, by month, is shown in Figure 15.
3.4. Operation of the FCHEV
The FCHEV can be powered by hydrogen or by charging its battery. In the period studied, the supply from the RES has been made only by refuelling hydrogen. This power supply has been complemented by occasional battery recharges, using electricity from the grid during vehicle stops in the winery. As indicated in Section 2.2.3, the substituted diesel vehicle would have consumed approximately 1350 litres of diesel. Equation (1) obtains the equivalence between the quantity of hydrogen refuelled and the diesel avoided, according to the energy densities of diesel and hydrogen and the efficiencies of the process.
where D is the diesel fuel avoided; H is the volume of hydrogen supplied; ηf is the efficiency of the electricity production in the fuel cell; ηe is the efficiency of the electric vehicle powertrain; and ηd is the efficiency of the diesel vehicle powertrain. The efficiency values obtained during the operation of the prototypes [25] were ηf = 0.48, ηe = 0.90 and ηd =0.15. It is probable that the reduced value of the latter is a consequence of the work cycle of the vehicle, with frequent starts, stops, and standby periods. As a result, 1290 Nm3 H2 have avoided the consumption of 1084 l of diesel. The rest of the diesel fuel can be considered to have been replaced by electricity from the grid. More explanations on the performance of the hydrogen subsystem and the FCHEV are published in previous articles [24,25].
D (l) × 10.28 (kWh/l) × ηd, = H (Nm3) × 3 (kWh/Nm3) × ηf × ηe
3.5. Emmissions Avoided
To analyse the CO2 emissions and high-level radioactive waste prevented by the operation of the prototypes, the initial situation has been compared with the new situation:
- (1)
- The starting situation for the WWTP was grid connected. Once the prototypes were implanted, the WWTP was disconnected from the grid and supplied by photovoltaic generation. According to the emission rates of the generation mix of the Spanish electricity grid in 2017 [26], a savings of 49,100 kWh prevented the emission of 15,221 kg CO2 and 27 g of high-level radioactive waste.
- (2)
- The starting situation considered for irrigation is the supply from a diesel generator set with a consumption of 2621 litres of diesel. According to the emission rates of diesel vehicles [27], the fuel savings has prevented the emission of 7517 kg CO2.
- (3)
- The starting situation for the agricultural off-road vehicle is the use of a conventional model, with a diesel engine. Once implanted, the diesel vehicle has been replaced by an FCHEV, avoiding the consumption of 1084 litres diesel. According to the emission rates of stationary diesel [27], the fuel savings has prevented the emission of 2732 kg CO2. The other 266 litres of diesel has been replaced by electricity from the grid. This change has not been taken into account, because this electricity is not produced by the RES.
In summary, the operation of the RES over a year has prevented the emission of 25,470 kg CO2 and 27 g of high-level radioactive waste.
4. Discussion
The LIFE REWIND project aims to reduce the CO2 emissions from agriculture in general and the wine sector in particular, by replacing the energy they use with another from renewable origin. Modifications of the working processes are intentionally excluded, which is left to other initiatives. This facilitates the adoption of change [28] in existing facilities or in front of professionals reluctant to modify their work criteria. In fact, in winemaking, innovations have to coexist with respect for traditional uses and with subtle personal touches in the preparation of well-differentiated products [17,29]. In order to comply with this principle of non-intervention, in the case of the prototype, it was ruled out to modify the existing WWTP [30,31] or automate the irrigation decisions of the vineyard [7,32]. Therefore, the pumping schedule has been kept in the user’s hands, either by direct or remote activation or by time programming. Consequently, different degrees of priority have been established for the loads. The loads activated by the user have a higher priority than the deferrable loads, but less than the control and communication devices. Besides, unlike the energy management of systems hybridized with diesel [8], in a RES like this, whose only source of energy is photovoltaic, it is also necessary to avoid system crashes due to the lack of energy. To make all this compatible with an off-grid 100% renewable supply, the demand has been studied.
First, some energy demands present high seasonality, because of crop or climate cycles. The energy supply to various loads from the same RES can offer advantages. In this case, both the photovoltaic production and the irrigation consumption present seasonal profiles. In addition, the demand for the heat pump has a very different profile, which contributes to a better suit between the profile of the aggregate demand to that of generation. This opens the possibility of combining two or more loads, whose aggregate demand can be more similar to the profile of the photovoltaic resource, in the same RES. Obviously, this is not always possible, since each case needs a detailed study. A line of possible future work is the study of the consumption of activities that are usually carried out in the same agricultural or industrial context, from the point of view of their seasonal complementarity.
Secondly, deferrable consumption can be managed to follow the variations of available production. This is already widely known, with the name of DSM (demand side management), but it is mainly used in the context of smart grids [33]. The standalone RES prototype has incorporated an EMS to fulfil this function. On the one hand, the annual profile of consumption was well suited to that of production. As a result, long-term storage is unnecessary. On the other hand, the daytime consumption profile has also been adapted to the available production [24] (pp. 258–259), allowing for a small-size short-term storage. To be widely applied in standalone RES, dimensioning tools that take into account load management parameters are necessary. Likewise, the EMS must be considered one of the elements to be designed. Moreover, the incorporation into the EMS of smart energy system techniques could further reduce the cost of irrigation [34]. The team of the authors of this paper is preparing a work on the EMS used in the prototype and on a predictive control.
Finally, a standalone RES usually cannot take advantage of all available production. One solution is that part of the energy comes from non-renewable generation, such as diesel, configuring a hybrid system. In them, the diesel generation is managed to supply more energy when needed. The prototype of the case study shows another strategy, which assumes the existence of surplus energy and extracts it from the system, for use in another application. On the one hand, the sizing of the system has been made, taking into account the most unfavourable periods of the relationship between energy demand and renewable resources. On the other hand, the surplus energy has been transferred to an application that can use it in a flexible way, without needing a supply in rigidly determined quantities and times. In the case study, the FCHEV fulfils this function, since it does not depend exclusively on the energy from the RES. The extraction of surplus energy in the form of electricity requires the presence of the vehicle next to the RES for a relatively long period, as well as an adequate management [35]. By contrast, the use of hydrogen as an energy vector allows the vehicle to be refuelled in only 20 s [24] (p. 260). Besides, the vehicle does not only feed on the surplus energy of the RES. It can be powered by either refuelling hydrogen or charging its batteries. The fraction of the demand that cannot be satisfied by the energy coming from the renewable generation system, which it is usually outside of its service hours, is met by the electric charge in the winery. In this way, the amount of energy transferred from the RES can be matched to the available surplus. The vehicle incorporates a hybrid supply, from the RES and from the grid, but the use of diesel has been completely avoided. If the electricity that is recharged in the winery is of a renewable origin, the condition of a 100% renewable supply is also fulfilled. In the context of the incorporation of hydrogen in agricultural machinery [36], the production and refuelling of hydrogen in the farm itself, coming from renewable sources, can be studied.
One of the distinctive features of the prototype is the incorporation of a hydrogen production subsystem. The hydrogen technologies are candidates to provide long-term storage in standalone photovoltaic systems, avoiding the need for hybridization with diesel [6,37,38]. However, there are relatively few studies proposing specific off-grid applications, for example, remote base stations [39]. With regard to hydrogen, this work proposes some novelties. On the one hand, the production and use of hydrogen take place in an agricultural context, including irrigation and mobility. On the other hand, the hydrogen produced is extracted from the system, avoiding the need for a big hydrogen storage tank. The prototypes, including the FCHEV, have been operating on the farm for more than two years.
As explained in Section 2, the present article does not include an economic study of the prototype. Nevertheless, it is appropriate to make some observations on the current feasibility of replicating the proposed solutions. Given the high cost of the components of the hydrogen technologies [38,39], it is worth asking if this investment is justified, beyond the demonstration prototype presented. In many off-grid cases, the economically optimal solution is a hybrid photovoltaic-diesel system [6,13,37]. In this case, the polluting emissions depend on the fraction of energy supplied by diesel. This impact on some locations in the natural environment may be undesirable. The economic result would depend, among other things, on the cost of fuel throughout the lifecycle of the system, including its transport to the location. Further research is needed that incorporates current costs and future scenarios.
In the prototype, the use of hydrogen is justified. Certainly, in the absence of the hydrogen subsystem, the RES could transfer energy in the form of electricity, by recharging the battery of an electric vehicle. However, the recharge should be allowed only when the surplus occurs. Additionally, in order not to waste a part of the surplus, the supply would be mandatory when the battery of the RES was full. In addition, the demonstration purpose of the prototype is a reason to show both ways to refuel a vehicle with zero emissions, with hydrogen or electricity produced from renewable sources on the farm itself.
Regarding photovoltaics, the prototype collected data that will be the subject of further studies. One of them will focus on the performance of the three types of support for the photovoltaic fields: a floating structure on the pond, fixed structure on the ground, and two-axis solar tracker. Especially, its different thermal behaviour and its effect on production will be taken into account. Since floating photovoltaic plants are expected to offer better thermal performance than other mounting supports [40], this is an opportunity for study. Other research will address the relationship between the daily and seasonal profiles of consumption and the optimal angles of orientation and inclination of the photovoltaic panels.
5. Conclusions
In the context of renewable energies in the wine sector, the LIFE REWIND project has designed and assembled a demonstrative prototype of RES in a Spanish vineyard. It addresses on-site, off-grid renewable generation for the energy supply for water purification and irrigation. The approach includes two objectives that are difficult to combine in a standalone RES: a supply, 100% of which is from renewable sources, and the harnessing of surplus energy. In the prototype, several strategies have been used to achieve these objectives. One of them is an EMS that manages the loads. On the one hand, it operates the deferrable loads, based on the instantaneous production and energy status. As a result, the use of the battery and its associated losses is minimized. On the other hand, an adequate level of the battery is maintained, preventing system crashes.
To harness the energy surplus of the RES, hydrogen is used as an energy vector. For this purpose, a hydrogen production system was added, which includes a water purifier, an electrolyser, a compressor, a storage tank and a refuelling mechanism. An electric all-terrain vehicle was modified to be a FCHEV, incorporating a fuel cell and the corresponding hydrogen tanks. This vehicle is refuelled from the prototype’s tank. Using 100% renewable energy and 100% clean hydrogen, the operation of the vehicle can be classified as zero emissions. The FCHEV is used to move around the vineyard and winery, avoiding the use of a conventional diesel vehicle.
In summary, the prototype of the LIFE REWIND project has shown the technical feasibility of on-site production of photovoltaic energy to supply exclusively various consumptions in the farm. Furthermore, it has shown the possibility to replace diesel with hydrogen produced at the same location.
Author Contributions
Conceptualization, J.C.; methodology, J.C.; software, J.-L.B.-A. and R.D.-L.; validation, J.-L.B.-A. and R.D.-L.; writing—original draft preparation, J.C.; writing—review and editing, J.C.; supervision, J.-L.B.-A. and R.D.-L.; project administration, J.C. and J.-L.B.-A.; funding acquisition, J.C. and J.-L.B.-A.
Funding
This research was funded by the European Commission, through the LIFE program; project REWIND; grant number LIFE 13/ENV/ES/000280.
Acknowledgments
The authors would like to thank all the staff of the LIFE REWIND project and the people, companies and institutions that have collaborated with it.
Conflicts of Interest
The authors declare no conflict of interest. The funders had no role in the design of the study; in the collection, analysis, or interpretation of data; in the writing of the manuscript, and in the decision to publish the results.
Abbreviations
| AC | Alternating current |
| DC | Direct current |
| DG | Distributed generation |
| DSM | Demand side management |
| EMS | Energy management strategy |
| FCHEV | Fuel cell hybrid electric vehicle |
| GHG | Greenhouse gasses |
| iHOGA | Improved Hybrid Optimization by Genetic Algorithms software |
| OIV | International Organization of Vine and Wine |
| PEMFC | Proton exchange membrane fuel cell |
| PVGIS | Photovoltaic Geographical Information System |
| RES | Renewable energy system |
| SOC | State of Charge |
| WWTP | Wastewater treatment plant |
References
- Duong, M.Q.; Pham, T.D.; Nguyen, T.T.; Doan, A.T. Determination of Optimal Location and Sizing of Solar Photovoltaic Distribution Generation Units. Energies 2019, 12, 174. [Google Scholar] [CrossRef]
- Duong, M.Q.; Leva, S.; Mussetta, M.; Le, K.H. A Comparative Study on Controllers for Improving Transient Stability of DFIG Wind Turbines During Large Disturbances. Energies 2018, 11, 480. [Google Scholar] [CrossRef]
- Chel, A.; Kaushik, G. Renewable energy for sustainable agriculture. Agron. Sustain. Dev. 2011, 31, 91–118. [Google Scholar] [CrossRef]
- Guzmán, A.B.; Vicencio, R.B.; Ardila-Rey, J.A.; Ahumada, E.N.; Araya, A.G.; Moreno, G.A.; Barrueto Guzmán, A.; Barraza Vicencio, R.; Ardila-Rey, J.A.; Núñez Ahumada, E.; et al. A Cost-Effective Methodology for Sizing Solar PV Systems for Existing Irrigation Facilities in Chile. Energies 2018, 11, 1853. [Google Scholar] [CrossRef]
- Khatib, T.; Ibrahim, I.A.; Mohamed, A. A review on sizing methodologies of photovoltaic array and storage battery in a standalone photovoltaic system. Energy Convers. Manag. 2016, 120, 430–448. [Google Scholar] [CrossRef]
- Akikur, R.K.; Saidur, R.; Ping, H.W.; Ullah, K.R. Comparative study of stand-alone and hybrid solar energy systems suitable for off-grid rural electrification: A review. Renew. Sustain. Energy Rev. 2013, 27, 738–752. [Google Scholar] [CrossRef]
- Mérida García, A.; Fernández García, I.; Camacho Poyato, E.; Montesinos Barrios, P.; Rodríguez Díaz, J.A. Coupling irrigation scheduling with solar energy production in a smart irrigation management system. J. Clean. Prod. 2018, 175, 670–682. [Google Scholar] [CrossRef]
- Wang, X.; Palazoglu, A.; El-Farra, N.H. Operational optimization and demand response of hybrid renewable energy systems. Appl. Energy 2015, 143, 324–335. [Google Scholar] [CrossRef]
- Muhsen, D.H.; Khatib, T.; Nagi, F. A review of photovoltaic water pumping system designing methods, control strategies and field performance. Renew. Sustain. Energy Rev. 2017, 68, 70–86. [Google Scholar] [CrossRef]
- Gabrielli, P.; Gazzani, M.; Martelli, E.; Mazzotti, M. Optimal design of multi-energy systems with seasonal storage. Appl. Energy 2018, 219, 408–424. [Google Scholar] [CrossRef]
- Chandel, S.S.S.; Naik, M.N.; Chandel, R. Review of Performance Studies of Direct Coupled Photovoltaic Water Pumping Systems and Case Study. Renew. Sustain. Energy Rev. 2017, 76, 163–175. [Google Scholar] [CrossRef]
- Posadillo, R.; López-Luque, R. A sizing method for stand-alone PV installations with variable demand. Renew. Energy 2008, 33, 1049–1055. [Google Scholar] [CrossRef]
- Carroquino, J.; Dufo-López, R.; Bernal-Agustín, J.L. Sizing of off-grid renewable energy systems for drip irrigation in Mediterranean crops. Renew. Energy 2015, 76, 566–574. [Google Scholar] [CrossRef]
- Aurand, J. OIV Statistical Report on World Vitiviniculture. Paris, France, 2018. Available online: http://www.oiv.int/public/medias/6371/oiv-statistical-report-on-world-vitiviniculture-2018.pdf (accessed on 28 November 2018).
- Smyth, M.; Russell, J. ‘From graft to bottle’-Analysis of energy use in viticulture and wine production and the potential for solar renewable technologies. Renew. Sustain. Energy Rev. 2009, 13, 1985–1993. [Google Scholar] [CrossRef]
- Svinartchuk, T.; Hunziker, P. Methodological Recommendations for Accounting for GHG Balance in the Vitivinicultural Sector; OIV-International Organization of Vine and Wine: Paris, France, 2017. [Google Scholar]
- Garcia-Casarejos, N.; Gargallo, P.; Carroquino, J. Introduction of renewable energy in the Spanish wine sector. Sustainability 2018, 10, 3157. [Google Scholar] [CrossRef]
- Website of the LIFE REWIND Project. Available online: http://www.liferewind.eu (accessed on 9 August 2017).
- Dufo-López, R. iHOGA—Simulation and Optimization of Stand-Alone and Grid-Connected Hybrid Renewable Systems. Available online: https://ihoga.unizar.es/en/ (accessed on 28 July 2018).
- Adams, W.R.; Zeleke, K.T. Diurnal effects on the efficiency of drip irrigation. Irrig. Sci. 2017, 35, 141–157. [Google Scholar] [CrossRef]
- Photovoltaic Geographical Information System (PVGIS). Available online: http://re.jrc.ec.europa.eu/pvgis.html (accessed on 20 January 2015).
- Parra, D.; Patel, M.K. Techno-economic implications of the electrolyser technology and size for power-to-gas systems. Int. J. Hydrogen Energy 2016, 41, 3748–3761. [Google Scholar] [CrossRef]
- Mekhilef, S.; Saidur, R.; Safari, A. Comparative study of different fuel cell technologies. Renew. Sustain. Energy Rev. 2012, 16, 981–989. [Google Scholar] [CrossRef]
- Carroquino, J.; Roda, V.; Mustata, R.; Yago, J.; Valiño, L.; Lozano, A.; Barreras, F. Combined production of electricity and hydrogen from solar energy and its use in the wine sector. Renew. Energy 2018, 122, 251–263. [Google Scholar] [CrossRef]
- Roda, V.; Carroquino, J.; Valiño, L.; Lozano, A.; Barreras, F. Remodeling of a commercial plug-in battery electric vehicle to a hybrid configuration with a PEM fuel cell. Int. J. Hydrogen Energy 2018. [Google Scholar] [CrossRef]
- CNMC—Comisión Nacional del Mercado y la Competencia—Informes de Etiquetado de la Electricidad. Available online: https://gdo.cnmc.es/CNE/resumenGdo.do?anio=2017 (accessed on 28 November 2018).
- Ministerio para la Transición Ecológica—Factores de Emisión. Available online: https://www.miteco.gob.es/es/cambio-climatico/temas/mitigacion-politicas-y-medidas/factores_emision_tcm30-446710.pdf (accessed on 28 November 2018).
- Rogers, E.M. Diffusion of Innovations, 4th ed.; Simon and Schuster: New York, NY, USA, 1995; ISBN 0028740742. [Google Scholar]
- Wongprawmas, R.; Spadoni, R. Is innovation needed in the Old World wine market? The perception of Italian stakeholders. Br. Food J. 2018, 120, 1315–1329. [Google Scholar] [CrossRef]
- Hernández-Sancho, F.; Molinos-Senante, M.; Sala-Garrido, R. Energy efficiency in Spanish wastewater treatment plants: A non-radial DEA approach. Sci. Total Environ. 2011, 409, 2693–2699. [Google Scholar] [CrossRef] [PubMed]
- Shen, Y.; Linville, J.L.; Urgun-Demirtas, M.; Mintz, M.M.; Snyder, S.W. An overview of biogas production and utilization at full-scale wastewater treatment plants (WWTPs) in the United States: Challenges and opportunities towards energy-neutral WWTPs. Renew. Sustain. Energy Rev. 2015, 50, 346–362. [Google Scholar] [CrossRef] [Green Version]
- González Perea, R.; Camacho Poyato, E.; Montesinos, P.; Rodríguez Díaz, J.A. Optimization of Irrigation Scheduling Using Soil Water Balance and Genetic Algorithms. Water Resour. Manag. 2016. [Google Scholar] [CrossRef]
- Jabir, H.; Teh, J.; Ishak, D.; Abunima, H.; Jabir, H.J.; Teh, J.; Ishak, D.; Abunima, H. Impacts of Demand-Side Management on Electrical Power Systems: A Review. Energies 2018, 11, 1050. [Google Scholar] [CrossRef]
- Nasiakou, A.; Vavalis, M.; Zimeris, D. Smart energy for smart irrigation. Comput. Electron. Agric. 2016, 129, 74–83. [Google Scholar] [CrossRef]
- Kamal, T.; Karabacak, M.; Hassan, S.Z.; Fernández-Ramírez, L.M.; Riaz, M.H.; Riaz, M.T.; Khan, M.A.; Khan, L. Energy management and switching control of PHEV charging stations in a hybrid smart micro-grid system. Electronics 2018, 7, 156. [Google Scholar] [CrossRef]
- Gonzalez-de-Soto, M.; Emmi, L.; Benavides, C.; Garcia, I.; Gonzalez-de-Santos, P. Reducing air pollution with hybrid-powered robotic tractors for precision agriculture. Biosyst. Eng. 2016, 143, 79–94. [Google Scholar] [CrossRef]
- Tzamalis, G.; Zoulias, E.I.; Stamatakis, E.; Varkaraki, E.; Lois, E.; Zannikos, F. Techno-economic analysis of an autonomous power system integrating hydrogen technology as energy storage medium. Renew. Energy 2011, 36, 118–124. [Google Scholar] [CrossRef]
- Kalinci, Y.; Hepbasli, A. Techno-economic analysis of a stand-alone hybrid renewable energy system with hydrogen production and storage options. Int. J. Hydrogen Energy 2015, 40, 7652–7664. [Google Scholar] [CrossRef]
- Bezmalinović, D.; Barbir, F.; Tolj, I. Techno-economic analysis of PEM fuel cells role in photovoltaic-based systems for the remote base stations. Int. J. Hydrogen Energy 2013, 38, 417–425. [Google Scholar] [CrossRef] [Green Version]
- Sahu, A.; Yadav, N.; Sudhakar, K. Floating photovoltaic power plant: A review. Renew. Sustain. Energy Rev. 2016, 66, 815–824. [Google Scholar] [CrossRef]
Figure 1.
Aerial view of the facility, indicating the aerators and pumping.

Figure 2.
Graph of the irrigation by month over an average year.

Figure 3.
Solar irradiation on horizontal plane.

Figure 4.
View of the floating set and the solar tracker.

Figure 5.
The room of the inverters, batteries and control devices.

Figure 6.
Block diagram of the RES (excluding the ancillary loads).

Figure 7.
The hydrogen production enclosure.

Figure 8.
The hydrogen tank and the refuelling system.

Figure 9.
The fuel cell hybrid electric vehicle (FCHEV).

Figure 10.
Block diagram of the FCHEV.

Figure 11.
Irradiation on horizontal plane over 5 and 6 May 2017.

Figure 12.
Performance of the RES over 5 and 6 May 2017.

Figure 13.
Consumption over a year of operation: (a) Irrigation and water pumps; (b) Aerators and sludge pumps; (c) Heat pump; (d) Control system.
Figure 13.
Consumption over a year of operation: (a) Irrigation and water pumps; (b) Aerators and sludge pumps; (c) Heat pump; (d) Control system.

Figure 14.
Photovoltaic production vs aggregate consumption: (a) Photovoltaic production; (b) Aggregate consumption of the aerators, sludge pumps, and heat pump; (c) Aggregate consumption of all loads, excluding the hydrogen production; (d) Photovoltaic production vs aggregate consumption, excluding the hydrogen production.


Figure 15.
Production of hydrogen.


Table 1.
Types and sources of the data.
| Data Sources | Data Sets |
|---|---|
| Electricity Bills | Historical Electricity Consumption |
| Electricity Prices | |
| Seasonality of the Demand | |
| Fuel delivery Notes and User Annotations | Historical Fuel Consumption |
| Maintenance Costs | |
| Market Prices | Investment Cost |
| Interviews and Surveys | Demand Side Manageability |
| Needs and Criteria for Operation | |
| Attitude about Sustainability | |
| On-Site Measurements | Powers and Consumptions |
| Photovoltaic Geographic Information Systems | Solar Resource |
| Bibliographic Databases | Wind Resource |
| On-Site Measurement Campaigns | Solar Resource |
| Wind Resource | |
| Temperatures |
Table 2.
Operating data of the pumps.
| Pump | Power (kW) | Volume of Water (m3/year) | Pumping Rate (m3/h) | Operating Time (h/year) | Energy Demand (kWh/year) |
|---|---|---|---|---|---|
| A | 7 | 10,000 | 22 | 455 | 3185 |
| B | 2.8 | 10,000 | 23 | 435 | 1218 |
| C | 11 | 10,000 | 27 | 370 | 4070 |
| Sum | 20.8 | - | - | - | 8473 |
Table 3.
Operating data of the aerators and sludge pumps.
| Load | Power (kW) | Volume of Water treated (m3/year) | Operating Time (h/year) | Energy Demand (kWh/year) |
|---|---|---|---|---|
| Aerator 1 | 14 | - | 3400 1 | 47,600 1 |
| Aerator 2 | 14 | |||
| Sludge pump 1 | 1.8 | - | 150 | 270 |
| Sludge pump 2 | 1.8 | - | 150 | 270 |
| Sum | 31.6 | 10,000 | - | 48,140 |
1 Sum of both aerators.
Table 4.
Data of energy demand used for sizing the RES.
| Load | Energy Demand (kWh/year) | Deferrable Load | Seasonality |
|---|---|---|---|
| Aerators and sludge pumps | 48,140 | Yes 1 | Low |
| Water supply pumps 2 | 4403 | Intra-week | High |
| Irrigation pump 3 | 4070 | One day | High |
| Control system | 1927 | No | No |
| Heat pump | 3200 | No | High |
| Sum | 61,740 | - | - |
1 Limited by the minimum level of oxygen in the aeration pond. 2 Pumps A and B. 3 Pump C.
Table 5.
Loads of group 2, in order of priority.
| Load | Minimum SOC |
|---|---|
| Pump B | 30 |
| Pump C (irrigation) | 40 |
| Pump A | 45 |
| Sludge pumps | 50 |
Table 6.
Conditions to enable aerators.
| Load | SOC Minimum (%) | Irradiation to Start (W/m2) | Irradiation to Stop (W/m2) | Hysteresis of Irradiation (W/m2) |
|---|---|---|---|---|
| Aerator 1 | 85 | 150 | 100 | 50 |
| Aerator 2 | 40 | 330 | 290 | 40 |
Table 7.
Yearly consumption by set of loads.
| Set of loads | Consumption (kWh/year) |
|---|---|
| Irrigation (Pumps A, B, and C) | 8759 |
| Aeration (aerators and sludge pumps) | 49,100 |
| Heat pump | 3507 |
| Control system | 2060 |
| Sum | 63,426 |
Table 8.
Energy balance.
| Concept | Energy (kWh/year) |
|---|---|
| Photovoltaic production 1 | 73,648 |
| Consumption of the loads 2 | 63,426 |
| Energy for hydrogen production | 6797 |
| Electrical losses | 3425 |
1 Measured at the output of solar inverters; 2 Excluding hydrogen production.
Table 9.
Hydrogen production system.
| Power consumption 1 | 2.635 kW |
| H2 production rate | 0.5 Nm3/h |
| H2 energy 2 | 3 kWh/Nm3 |
| Energy efficiency | 0.569 |
1 Including average power consumption of the compressor; 2 based on Lower Heating Value.
© 2019 by the authors. Licensee MDPI, Basel, Switzerland. This article is an open access article distributed under the terms and conditions of the Creative Commons Attribution (CC BY) license (http://creativecommons.org/licenses/by/4.0/).
Share and Cite
MDPI and ACS Style
Carroquino, J.; Bernal-Agustín, J.-L.; Dufo-López, R. Standalone Renewable Energy and Hydrogen in an Agricultural Context: A Demonstrative Case. Sustainability 2019, 11, 951. https://doi.org/10.3390/su11040951
AMA Style
Carroquino J, Bernal-Agustín J-L, Dufo-López R. Standalone Renewable Energy and Hydrogen in an Agricultural Context: A Demonstrative Case. Sustainability. 2019; 11(4):951. https://doi.org/10.3390/su11040951
Chicago/Turabian StyleCarroquino, Javier, José-Luis Bernal-Agustín, and Rodolfo Dufo-López. 2019. "Standalone Renewable Energy and Hydrogen in an Agricultural Context: A Demonstrative Case" Sustainability 11, no. 4: 951. https://doi.org/10.3390/su11040951
Note that from the first issue of 2016, this journal uses article numbers instead of page numbers. See further details here.