Simulation-Based Exceedance Probability Curves to Assess the Economic Impact of Storm Surge Inundations due to Climate Change: A Case Study in Ise Bay, Japan


Abstract
:1. Introduction
2. Methods
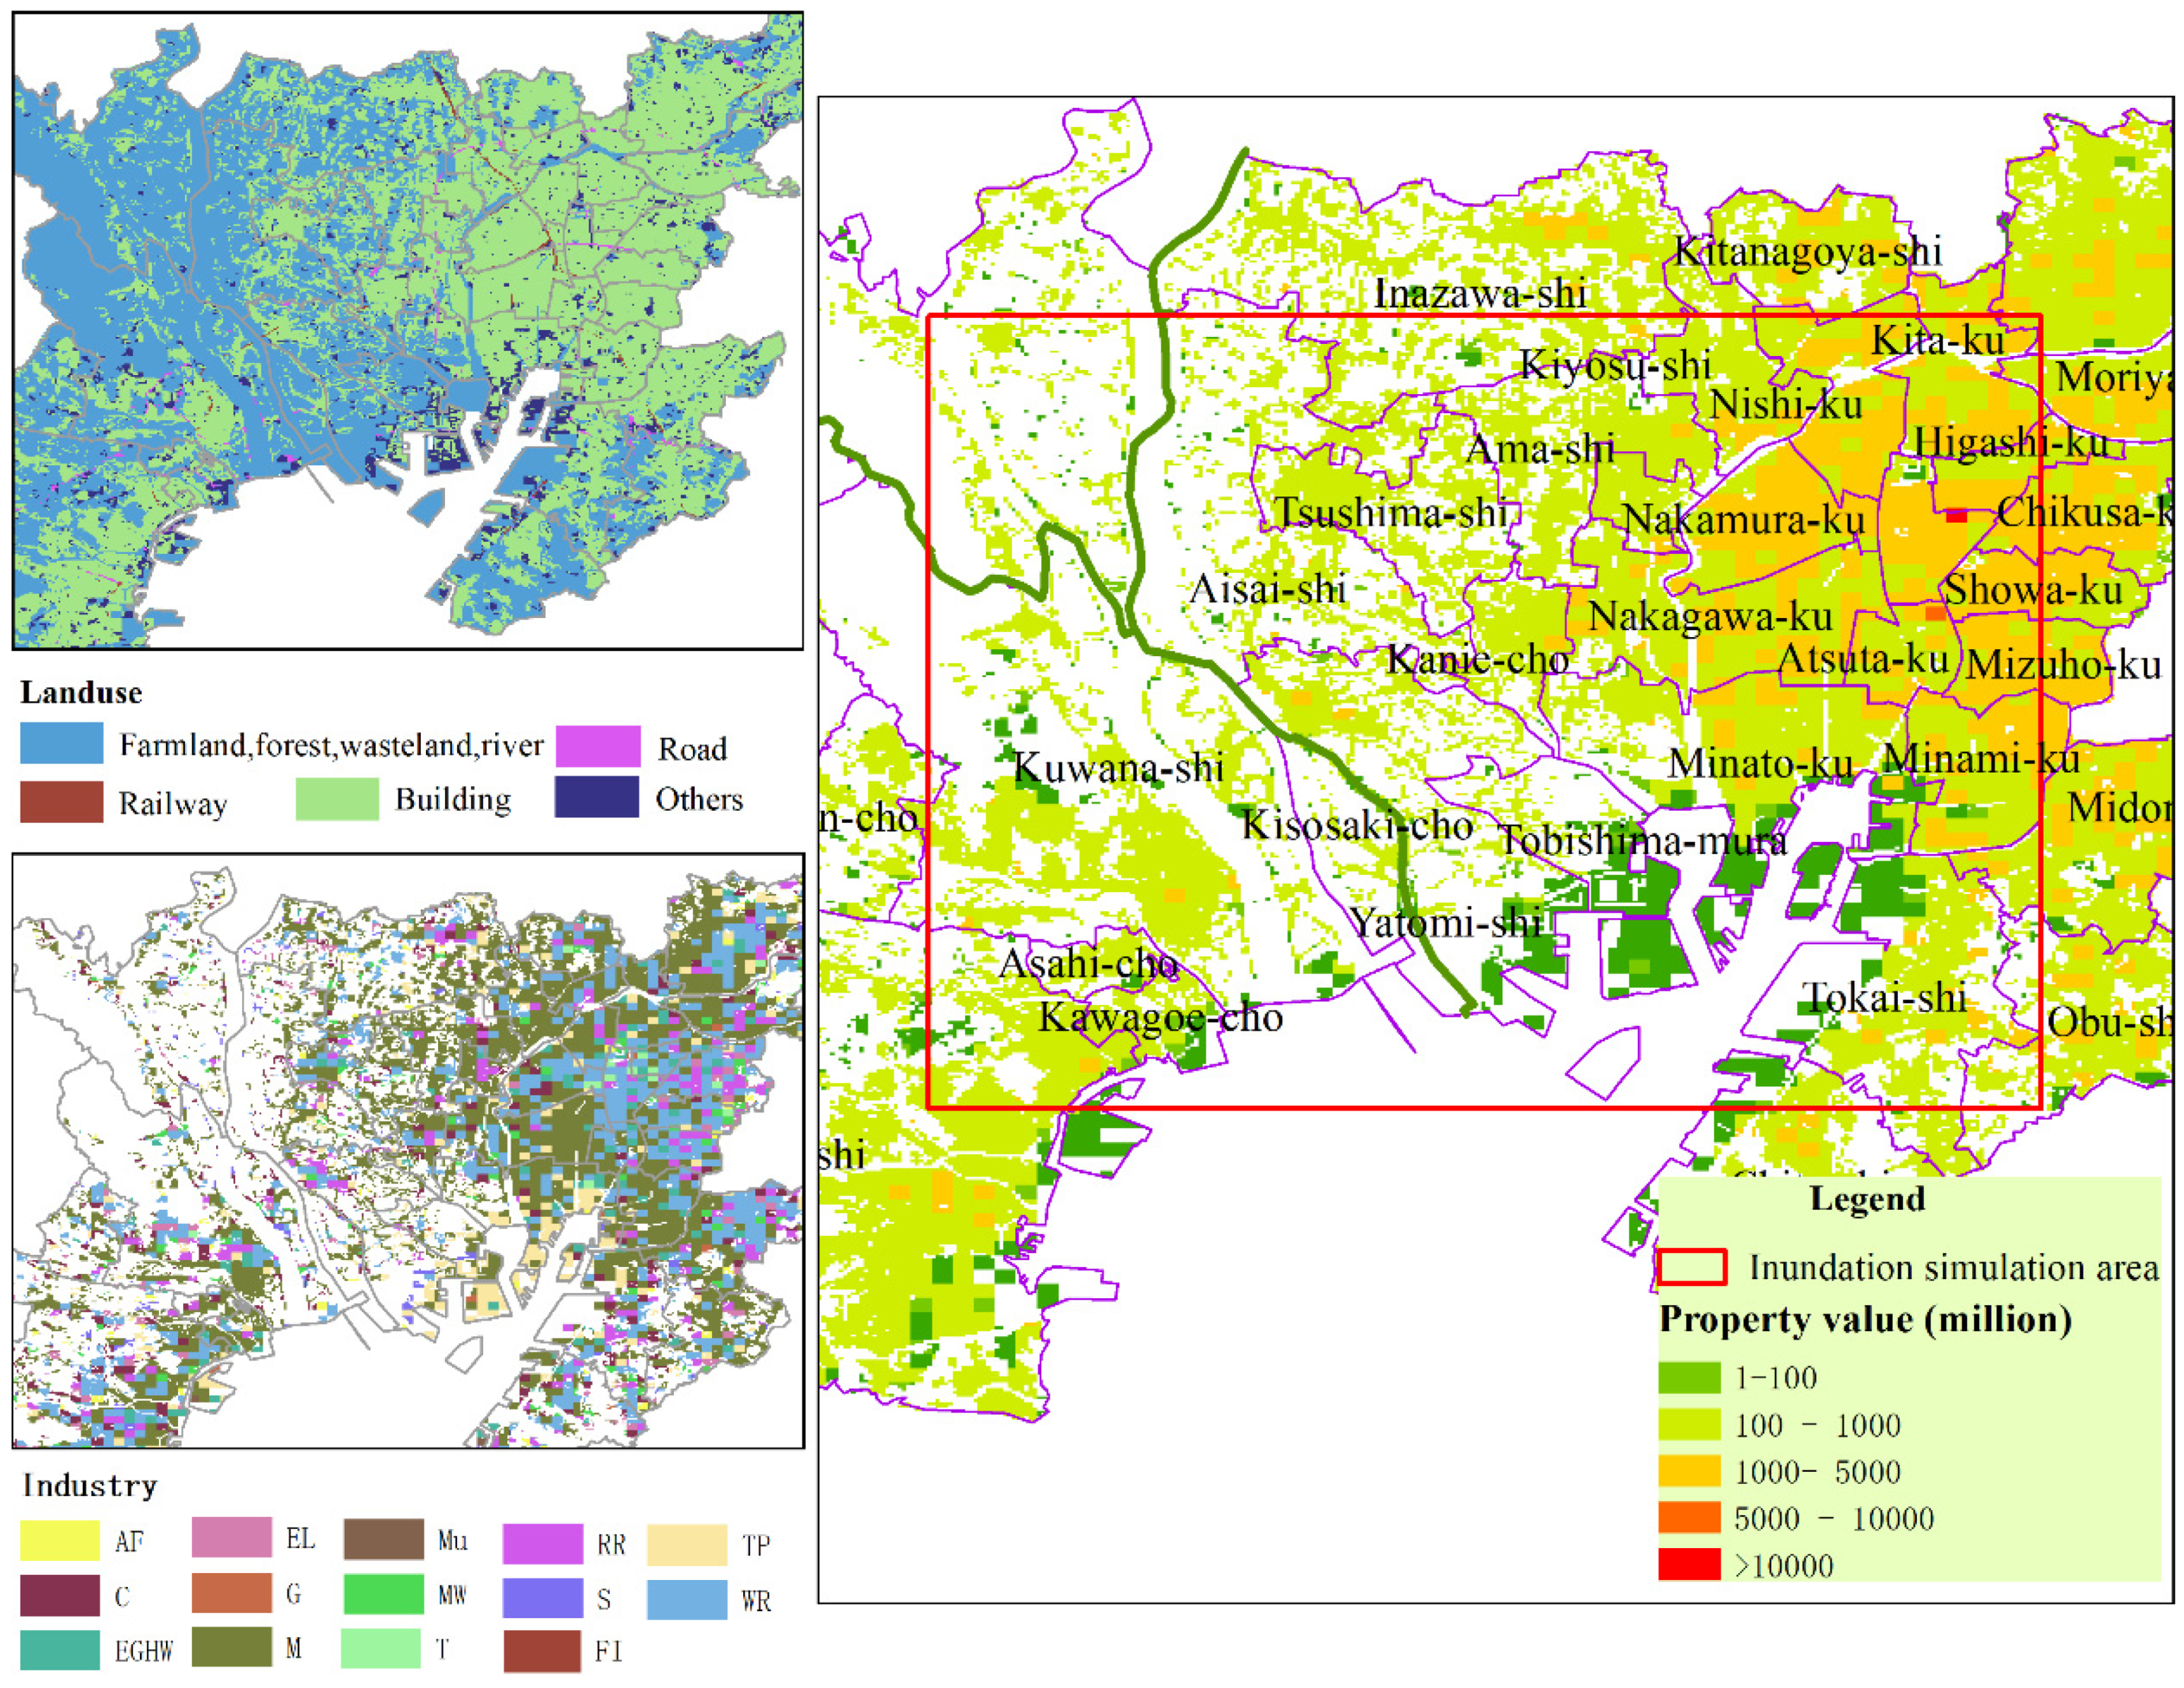
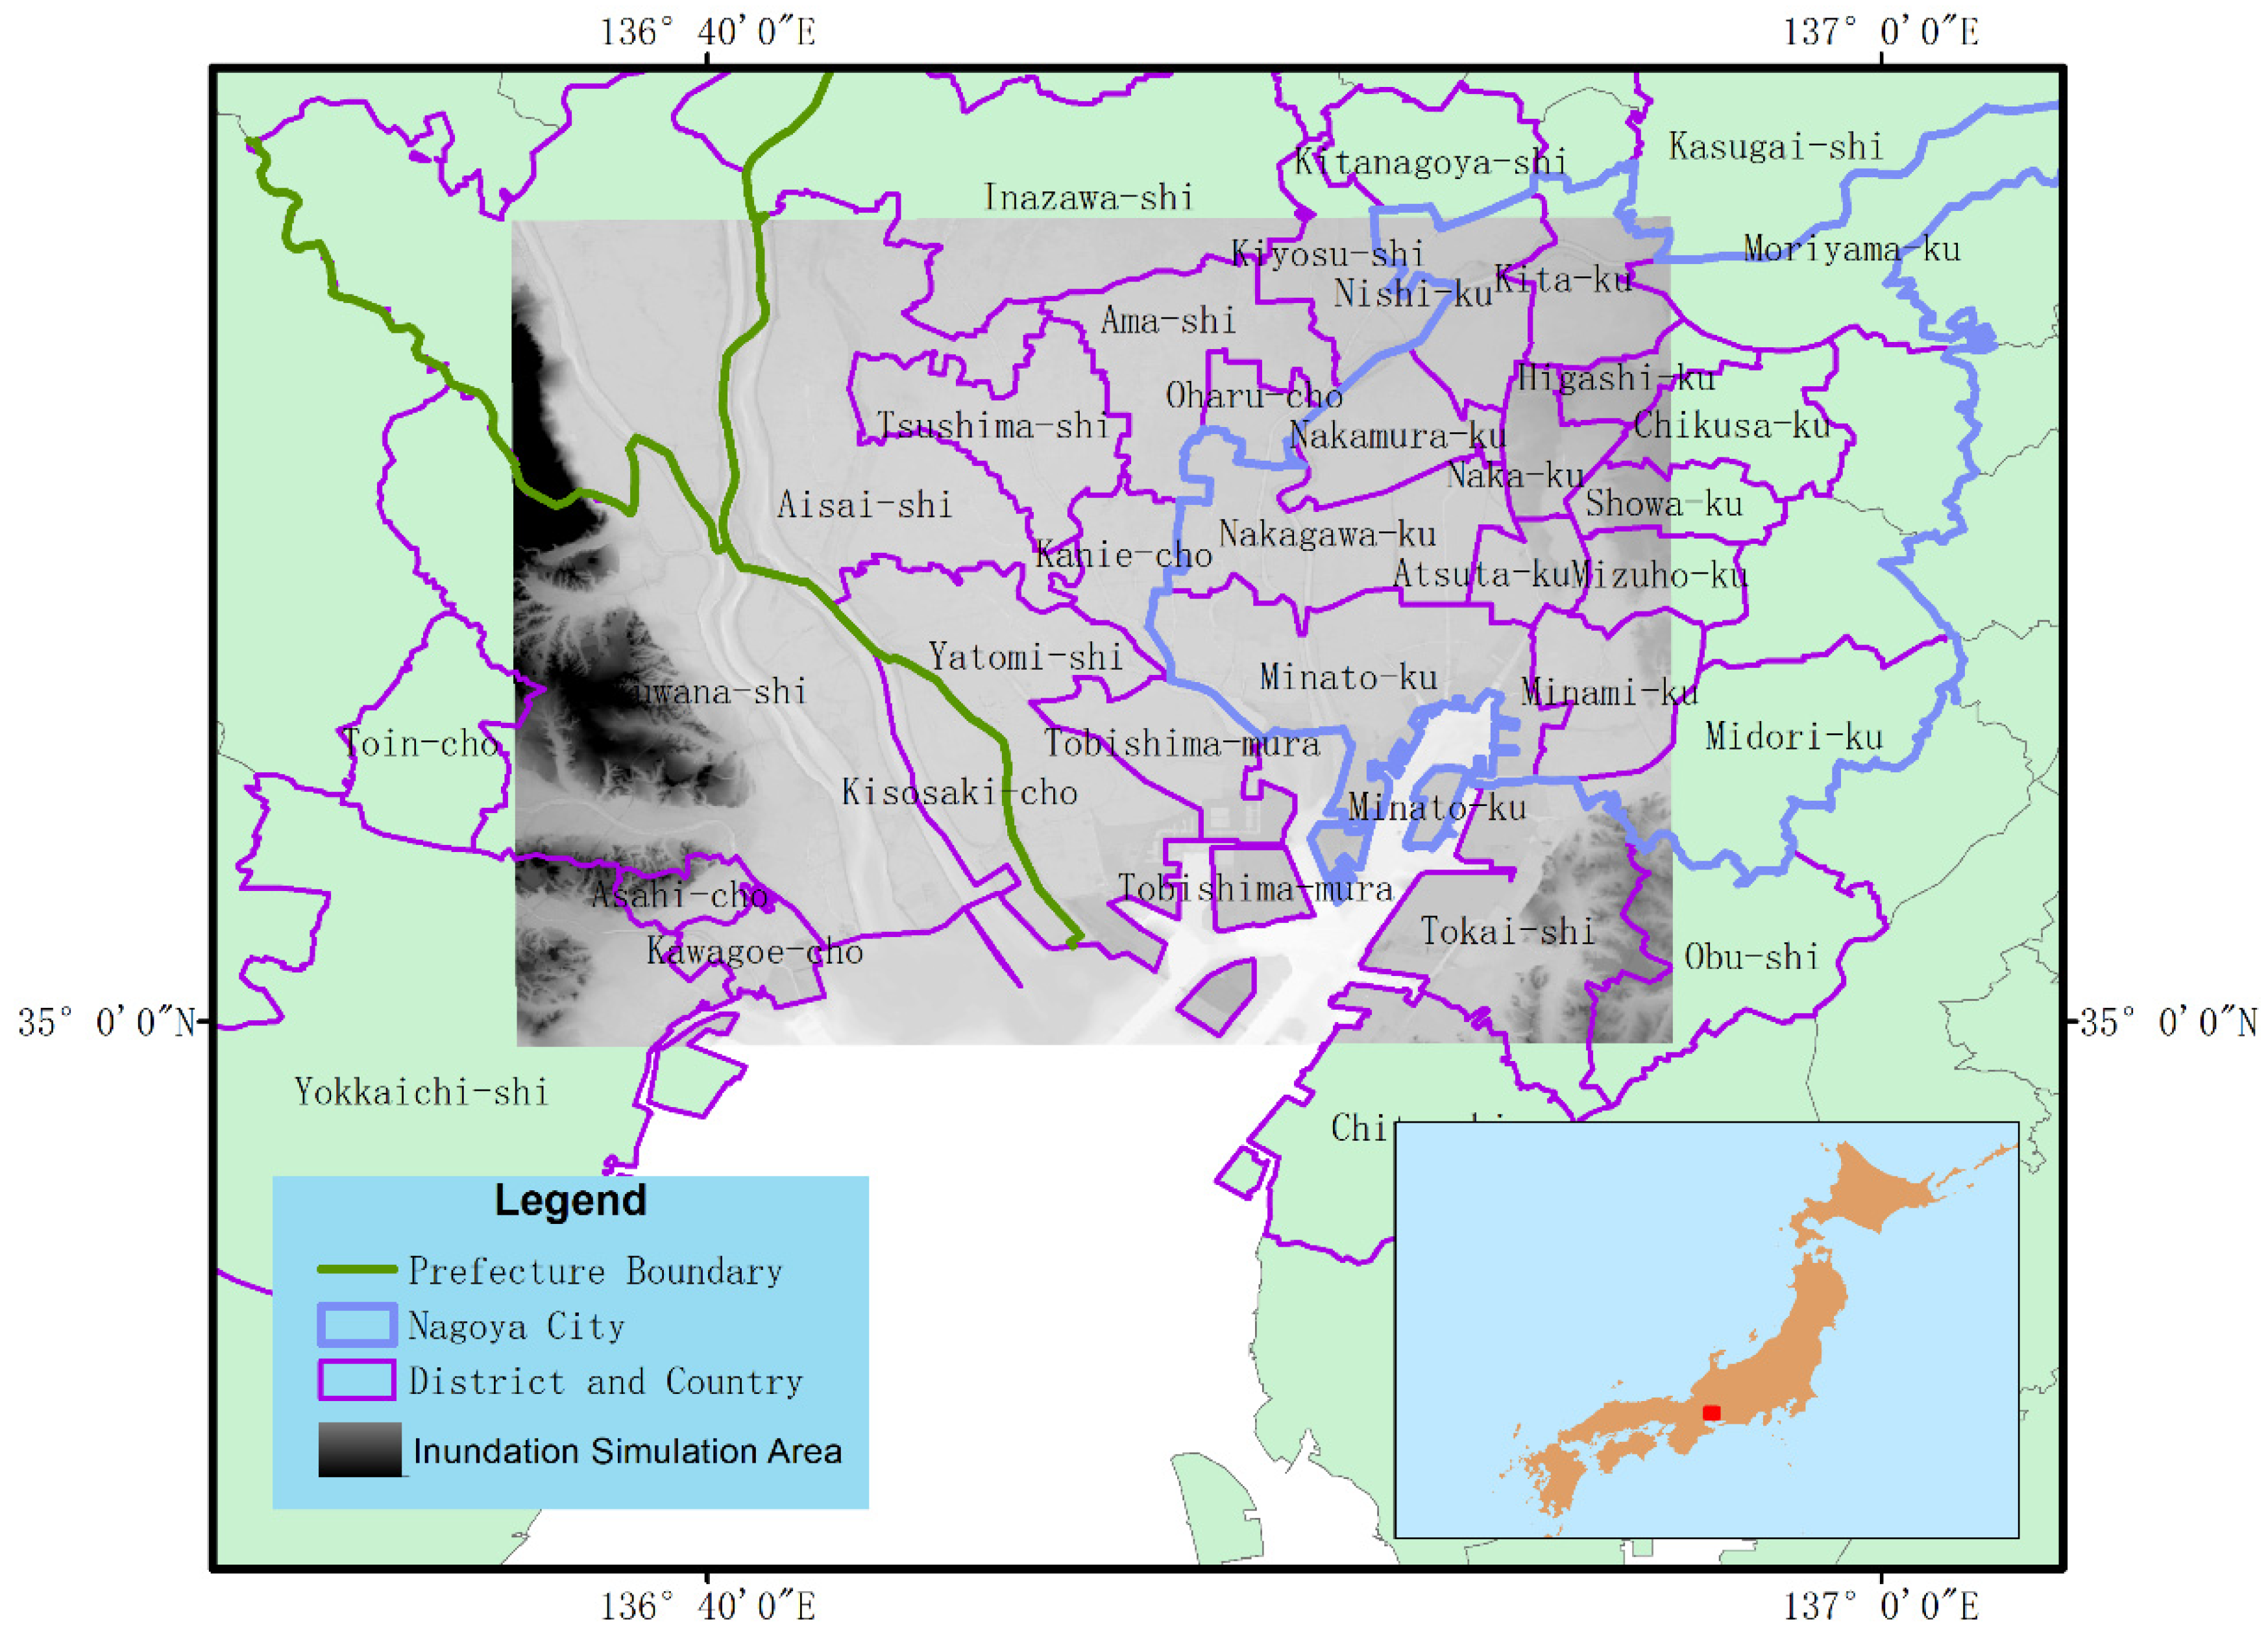
2.1. Study Area
2.2. Methodology
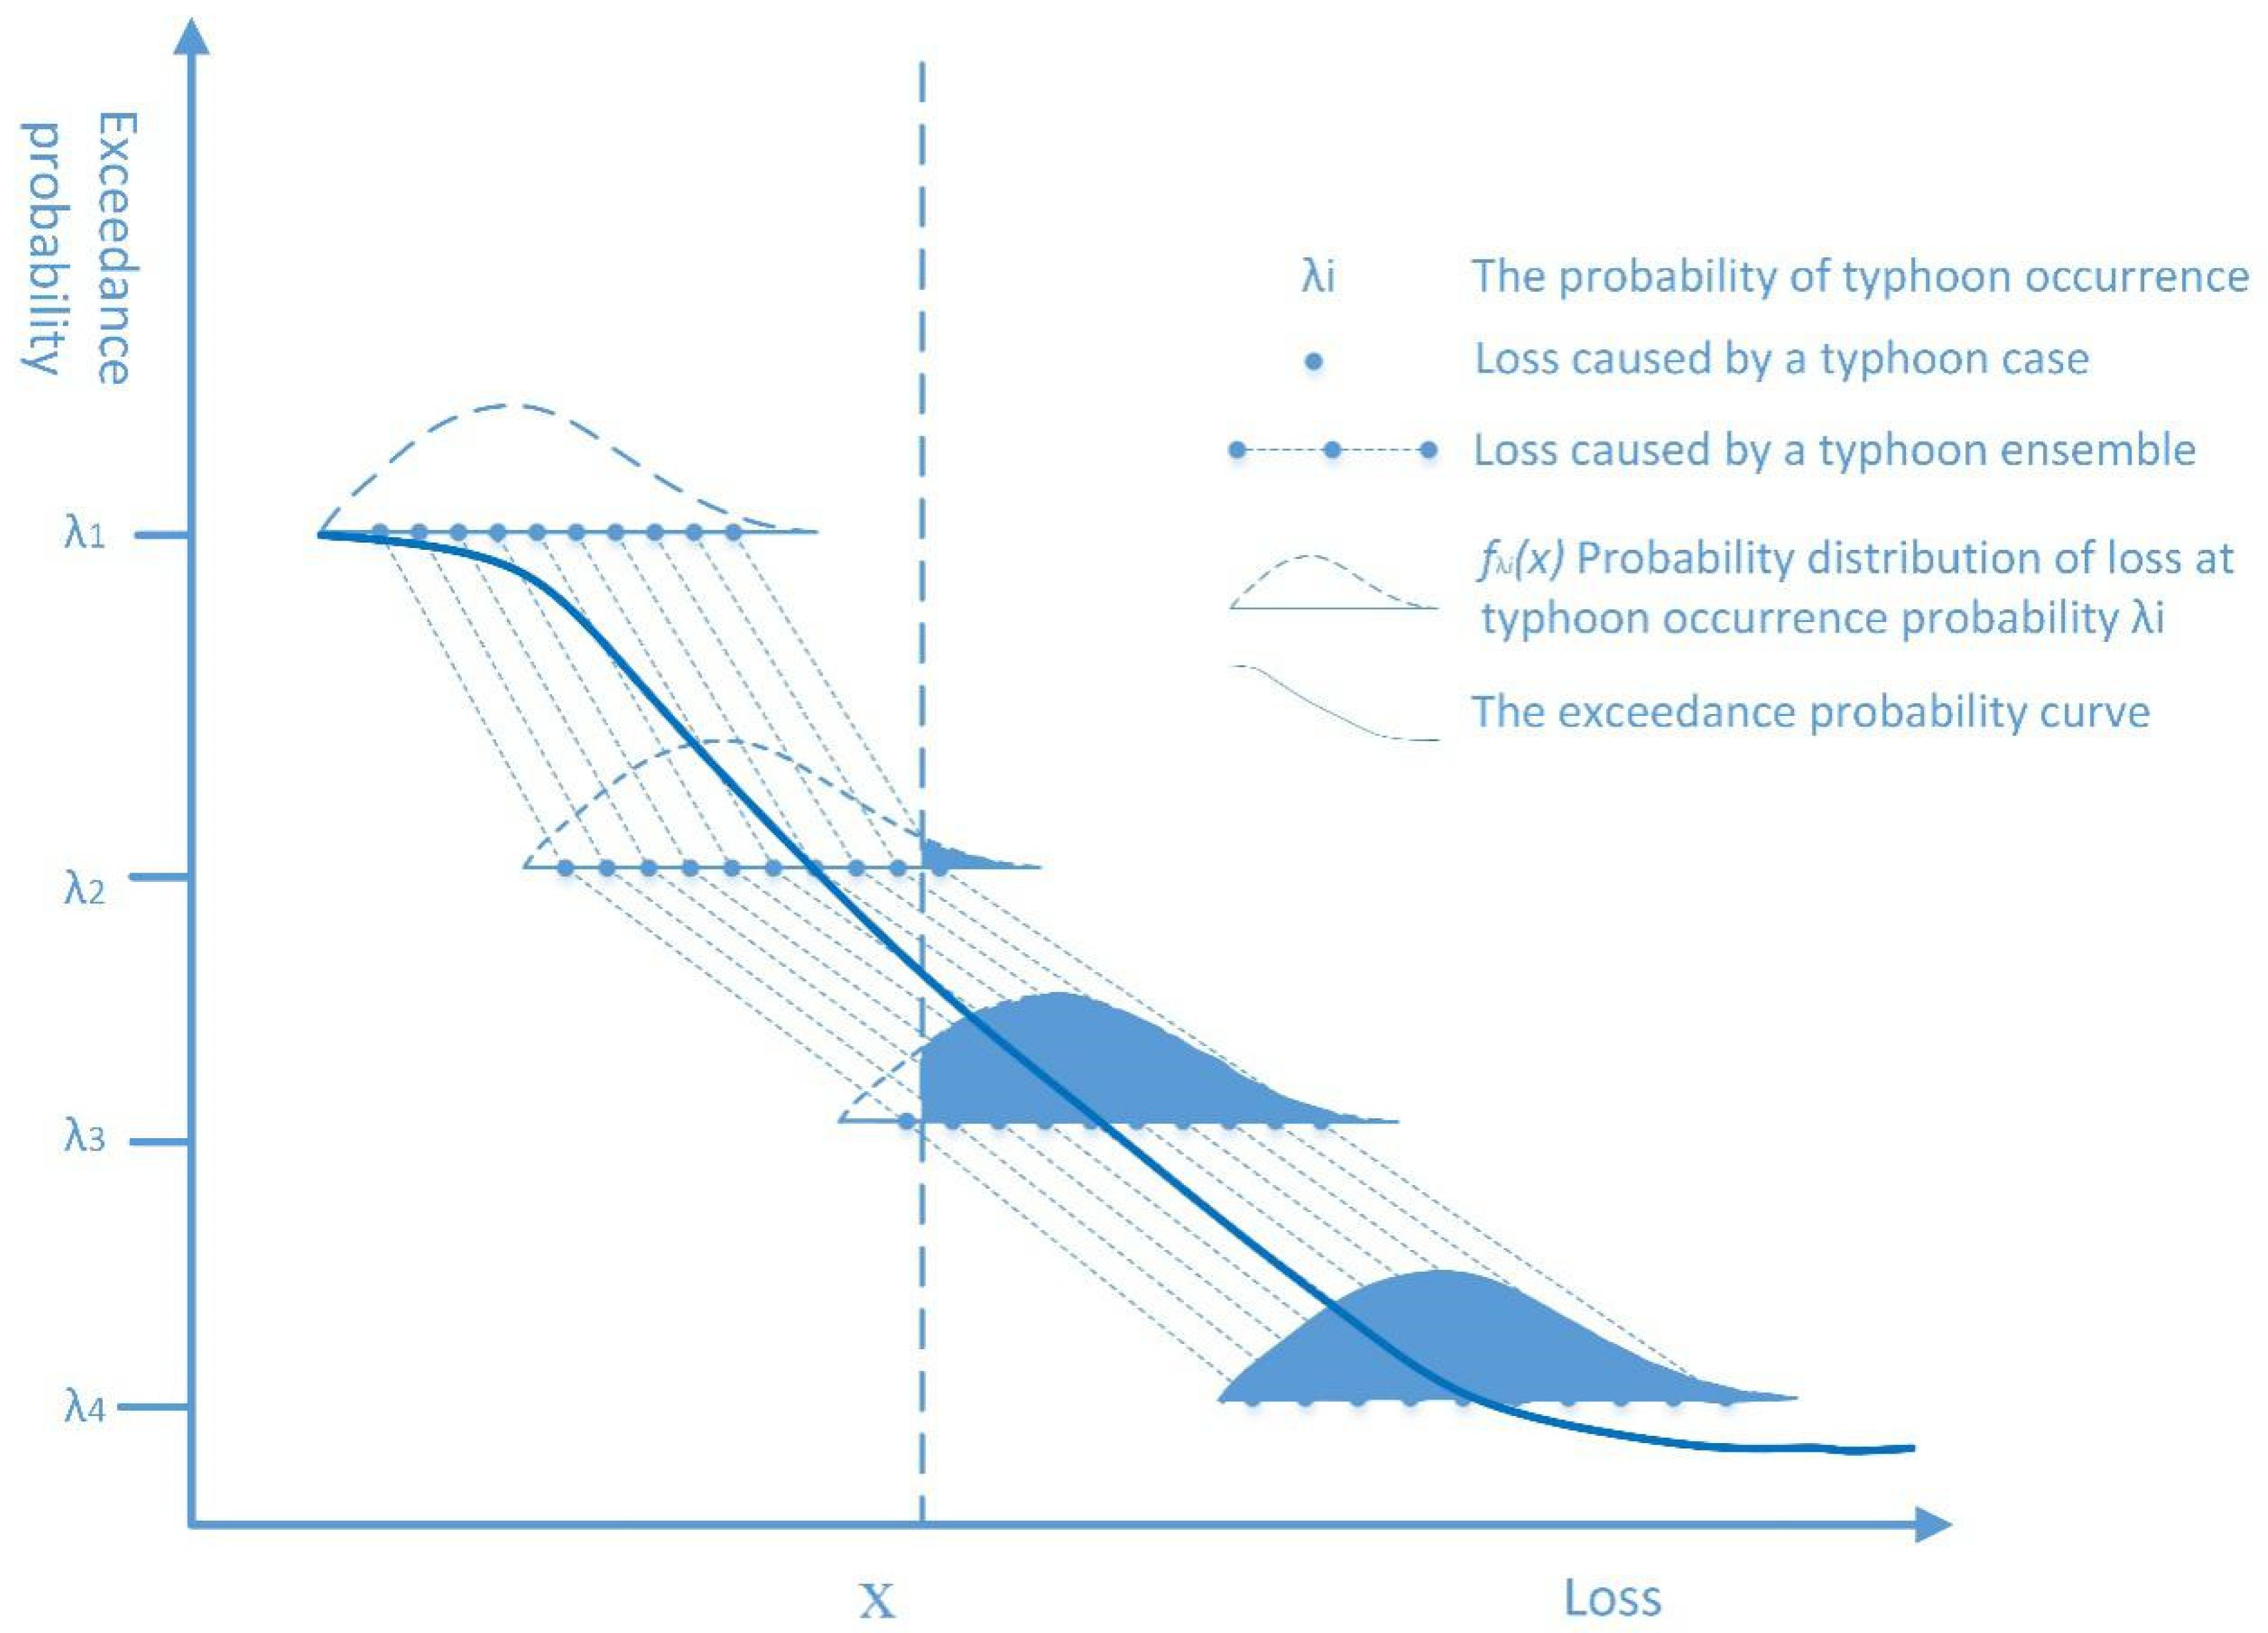
2.2.1. Exceedance Probability Curves
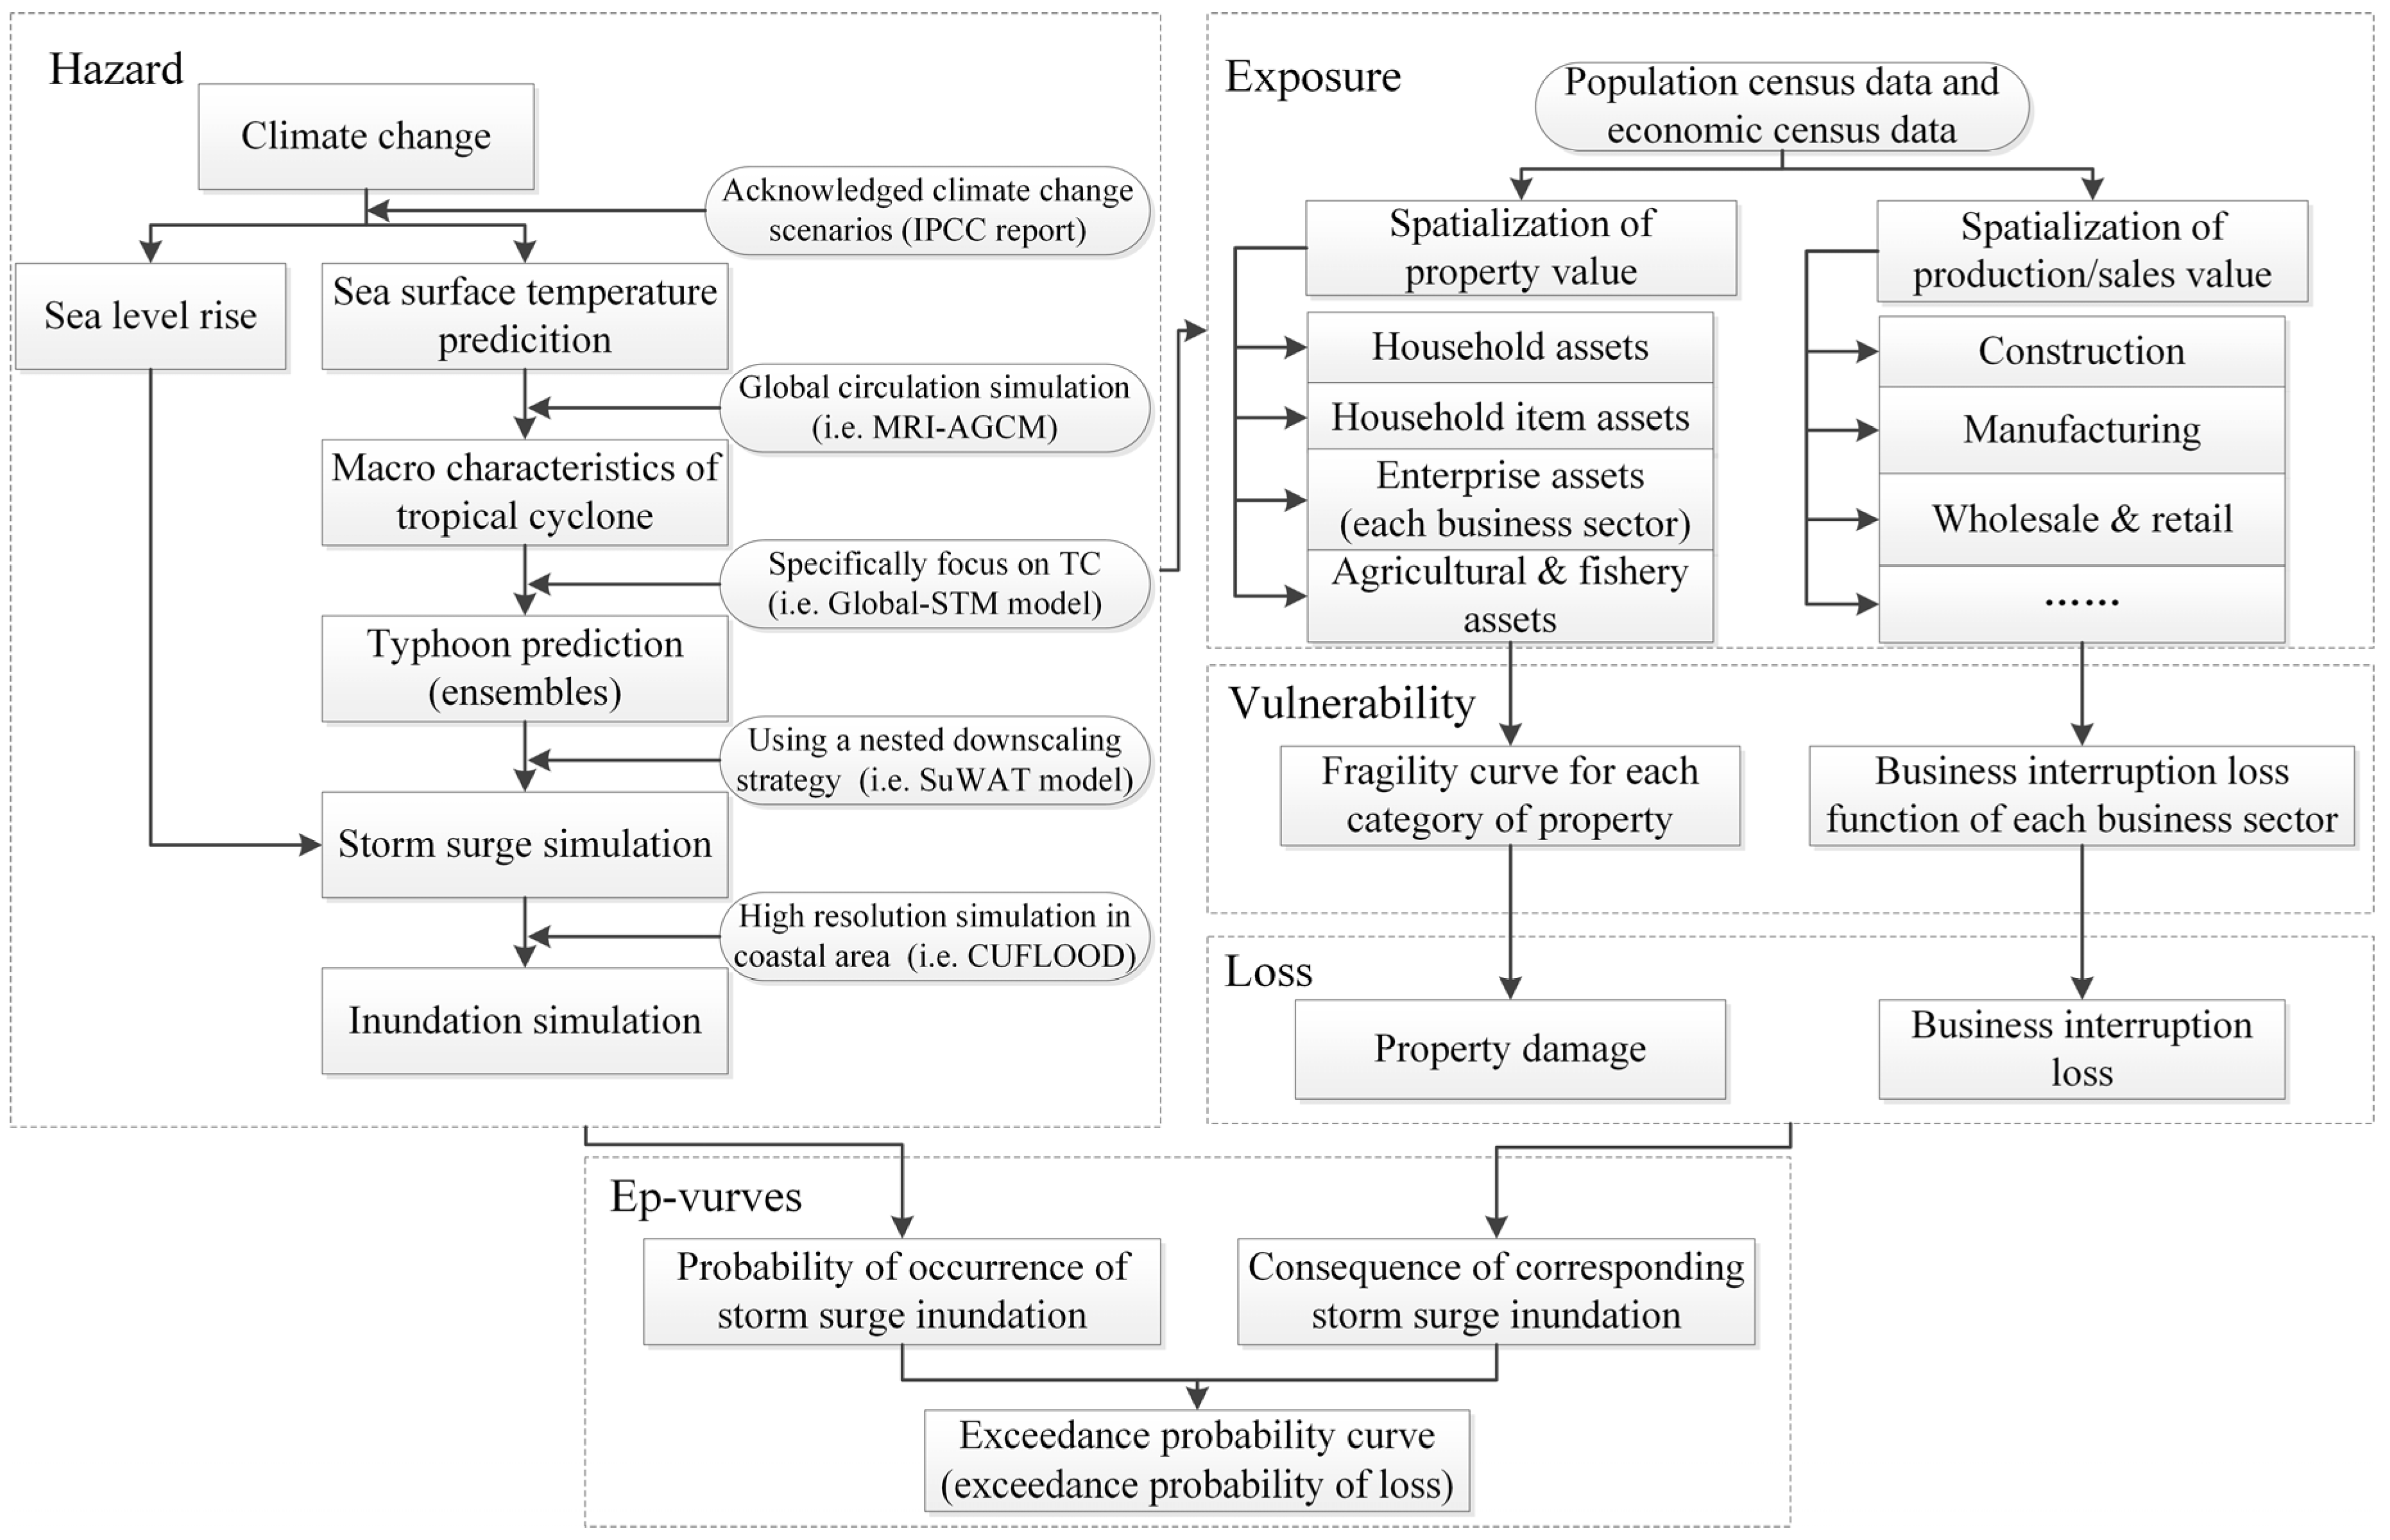
- Hazard simulation. Using a statistical typhoon model to generate a large number of typhoon ensembles considering the characteristics of tropical cyclones captured by global circulation simulation under different climate conditions. Simulate the process of typhoon storm surge inundation for each typhoon case in the ensembles using a nested downscaling strategy and request a high-resolution simulation for inland inundation, as shown in Section 2.2.2.
- Loss estimation. The estimation of losses for each storm surge inundation case with the integration of hazard, exposure, and vulnerability. Exposure can be divided into different categories and vulnerability is represented by the fragility curves of these exposure categories. Loss can be estimated in terms of property damage and business interruption losses, as presented in Section 2.2.3.
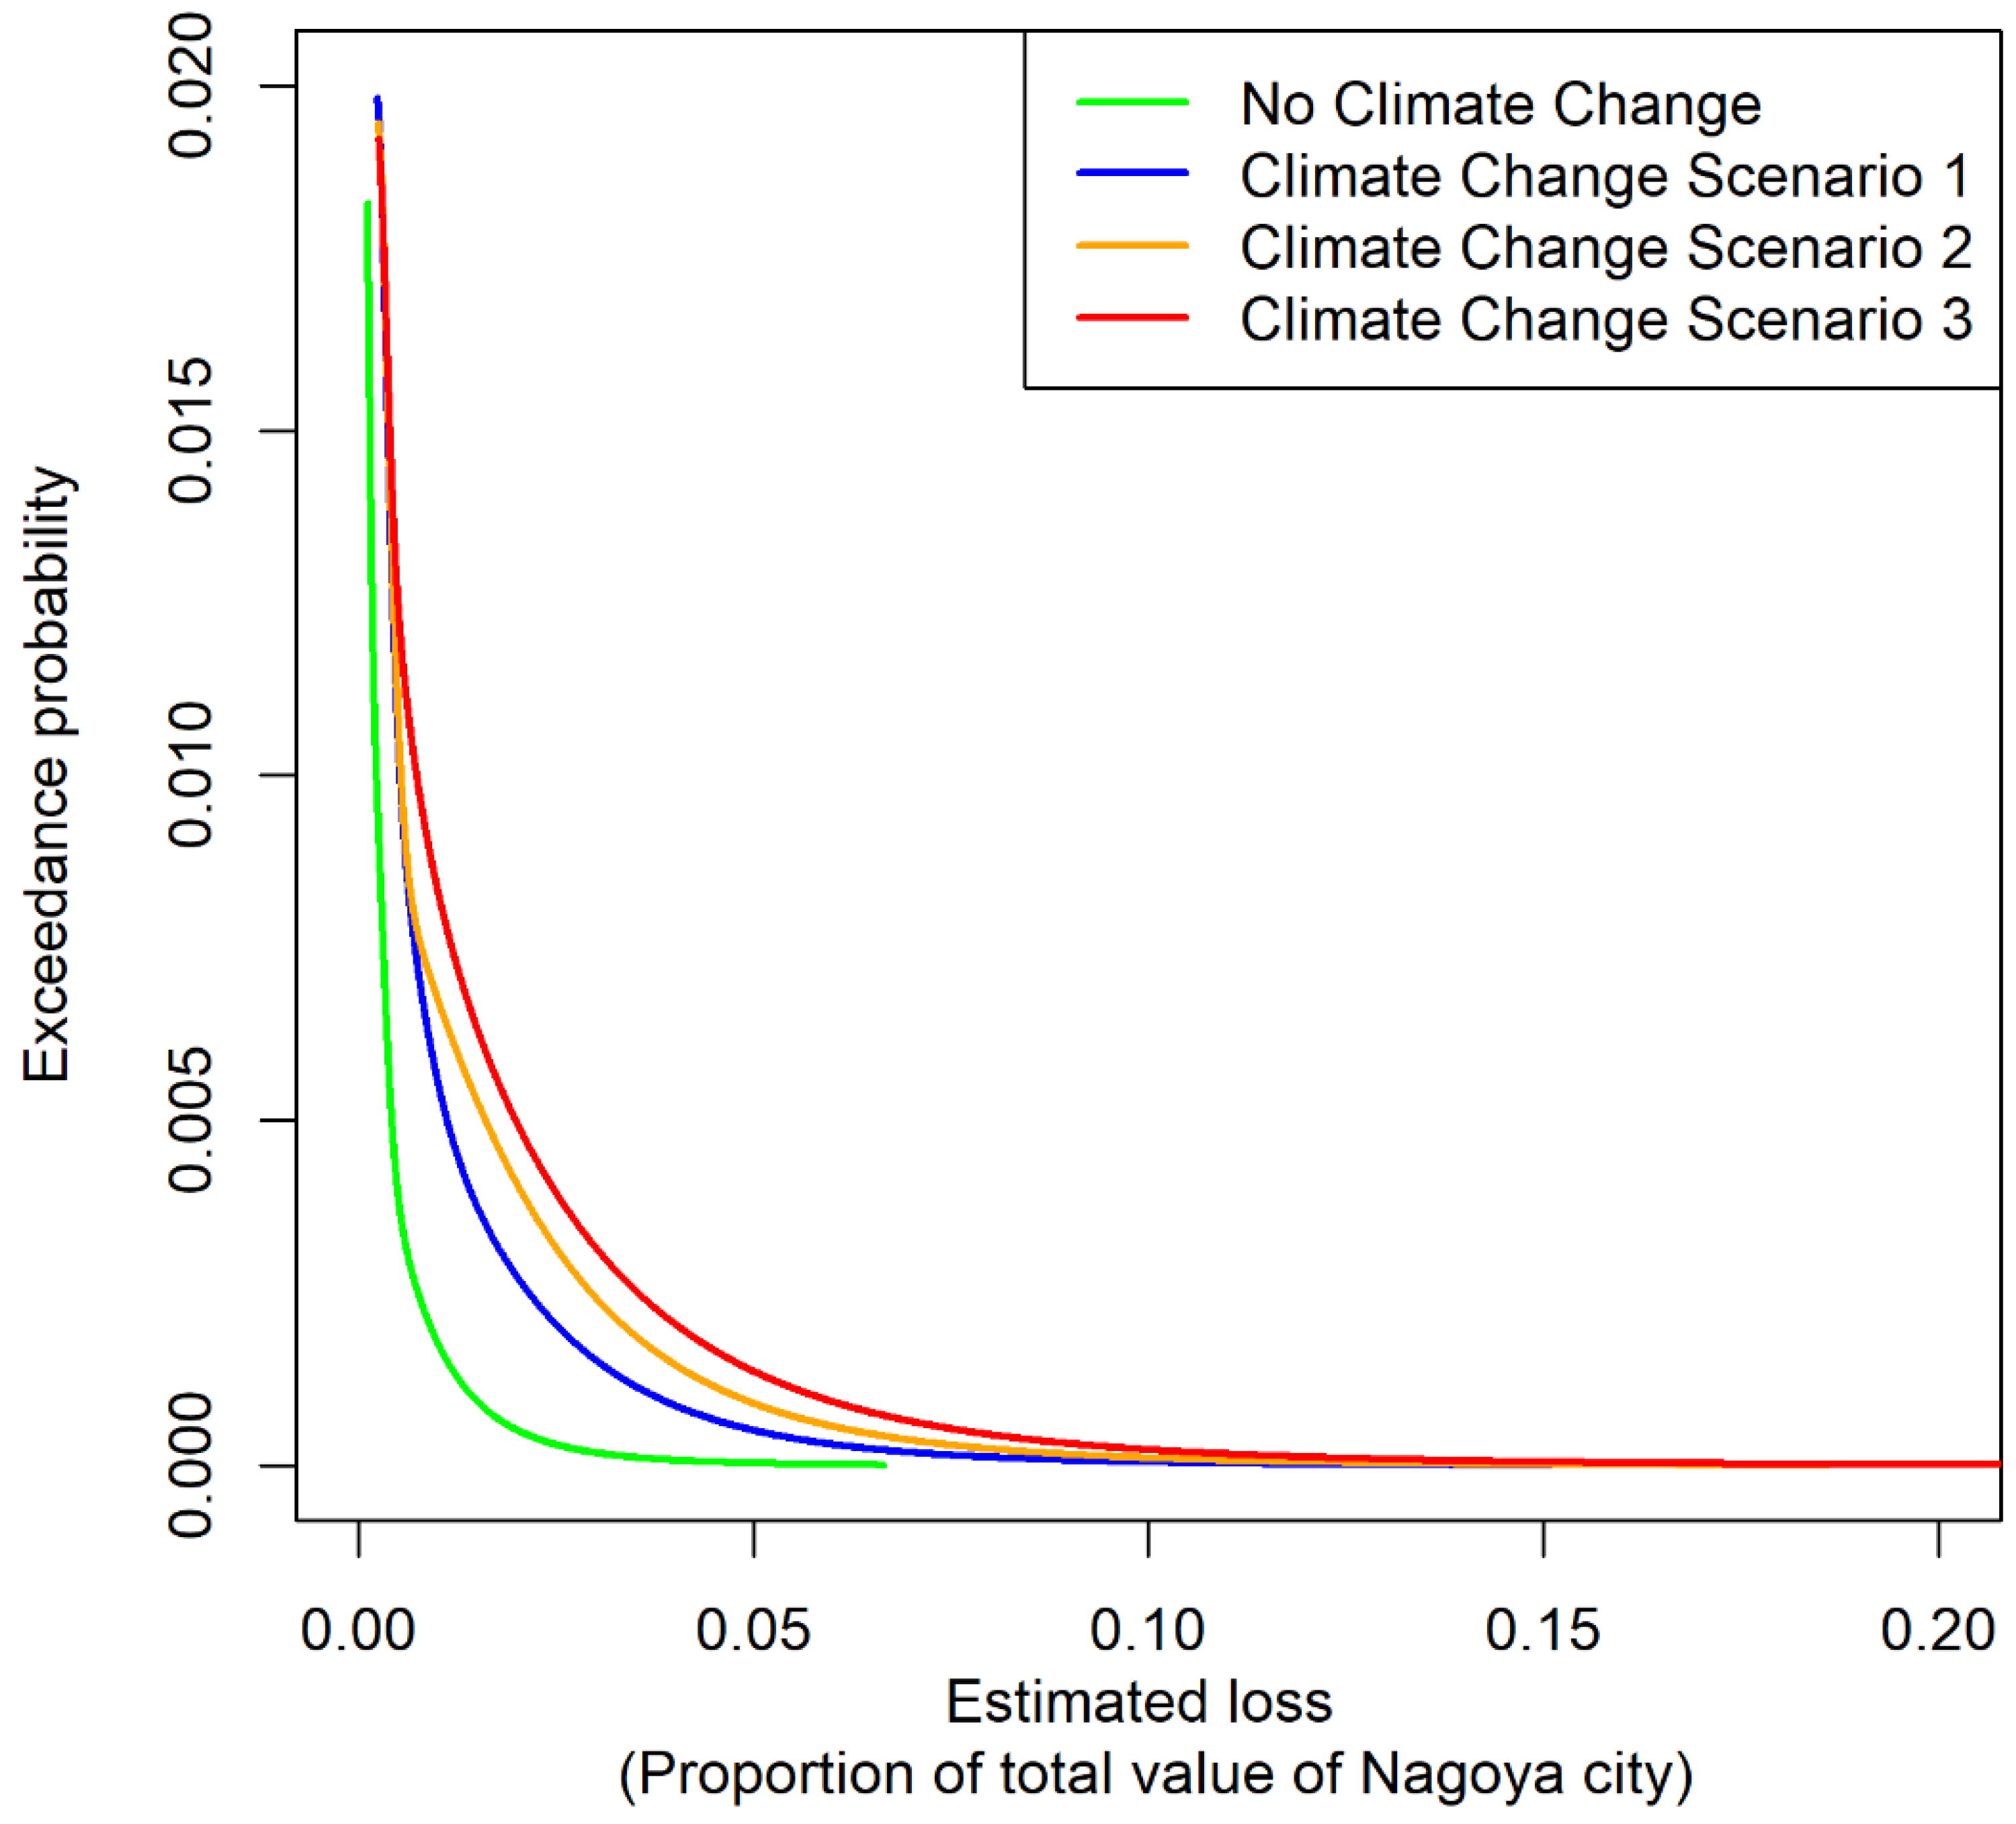
- Estimation of EP curves. Plot the loss data of each ensemble according to the probability of typhoon occurrence and estimate the distribution of loss at each typhoon occurrence probability. Calculate EP curve using Formulas (1) or (2).
2.2.2. Prediction of Hazard under Climate Change
2.2.3. Economic Impact Analysis
3. Results
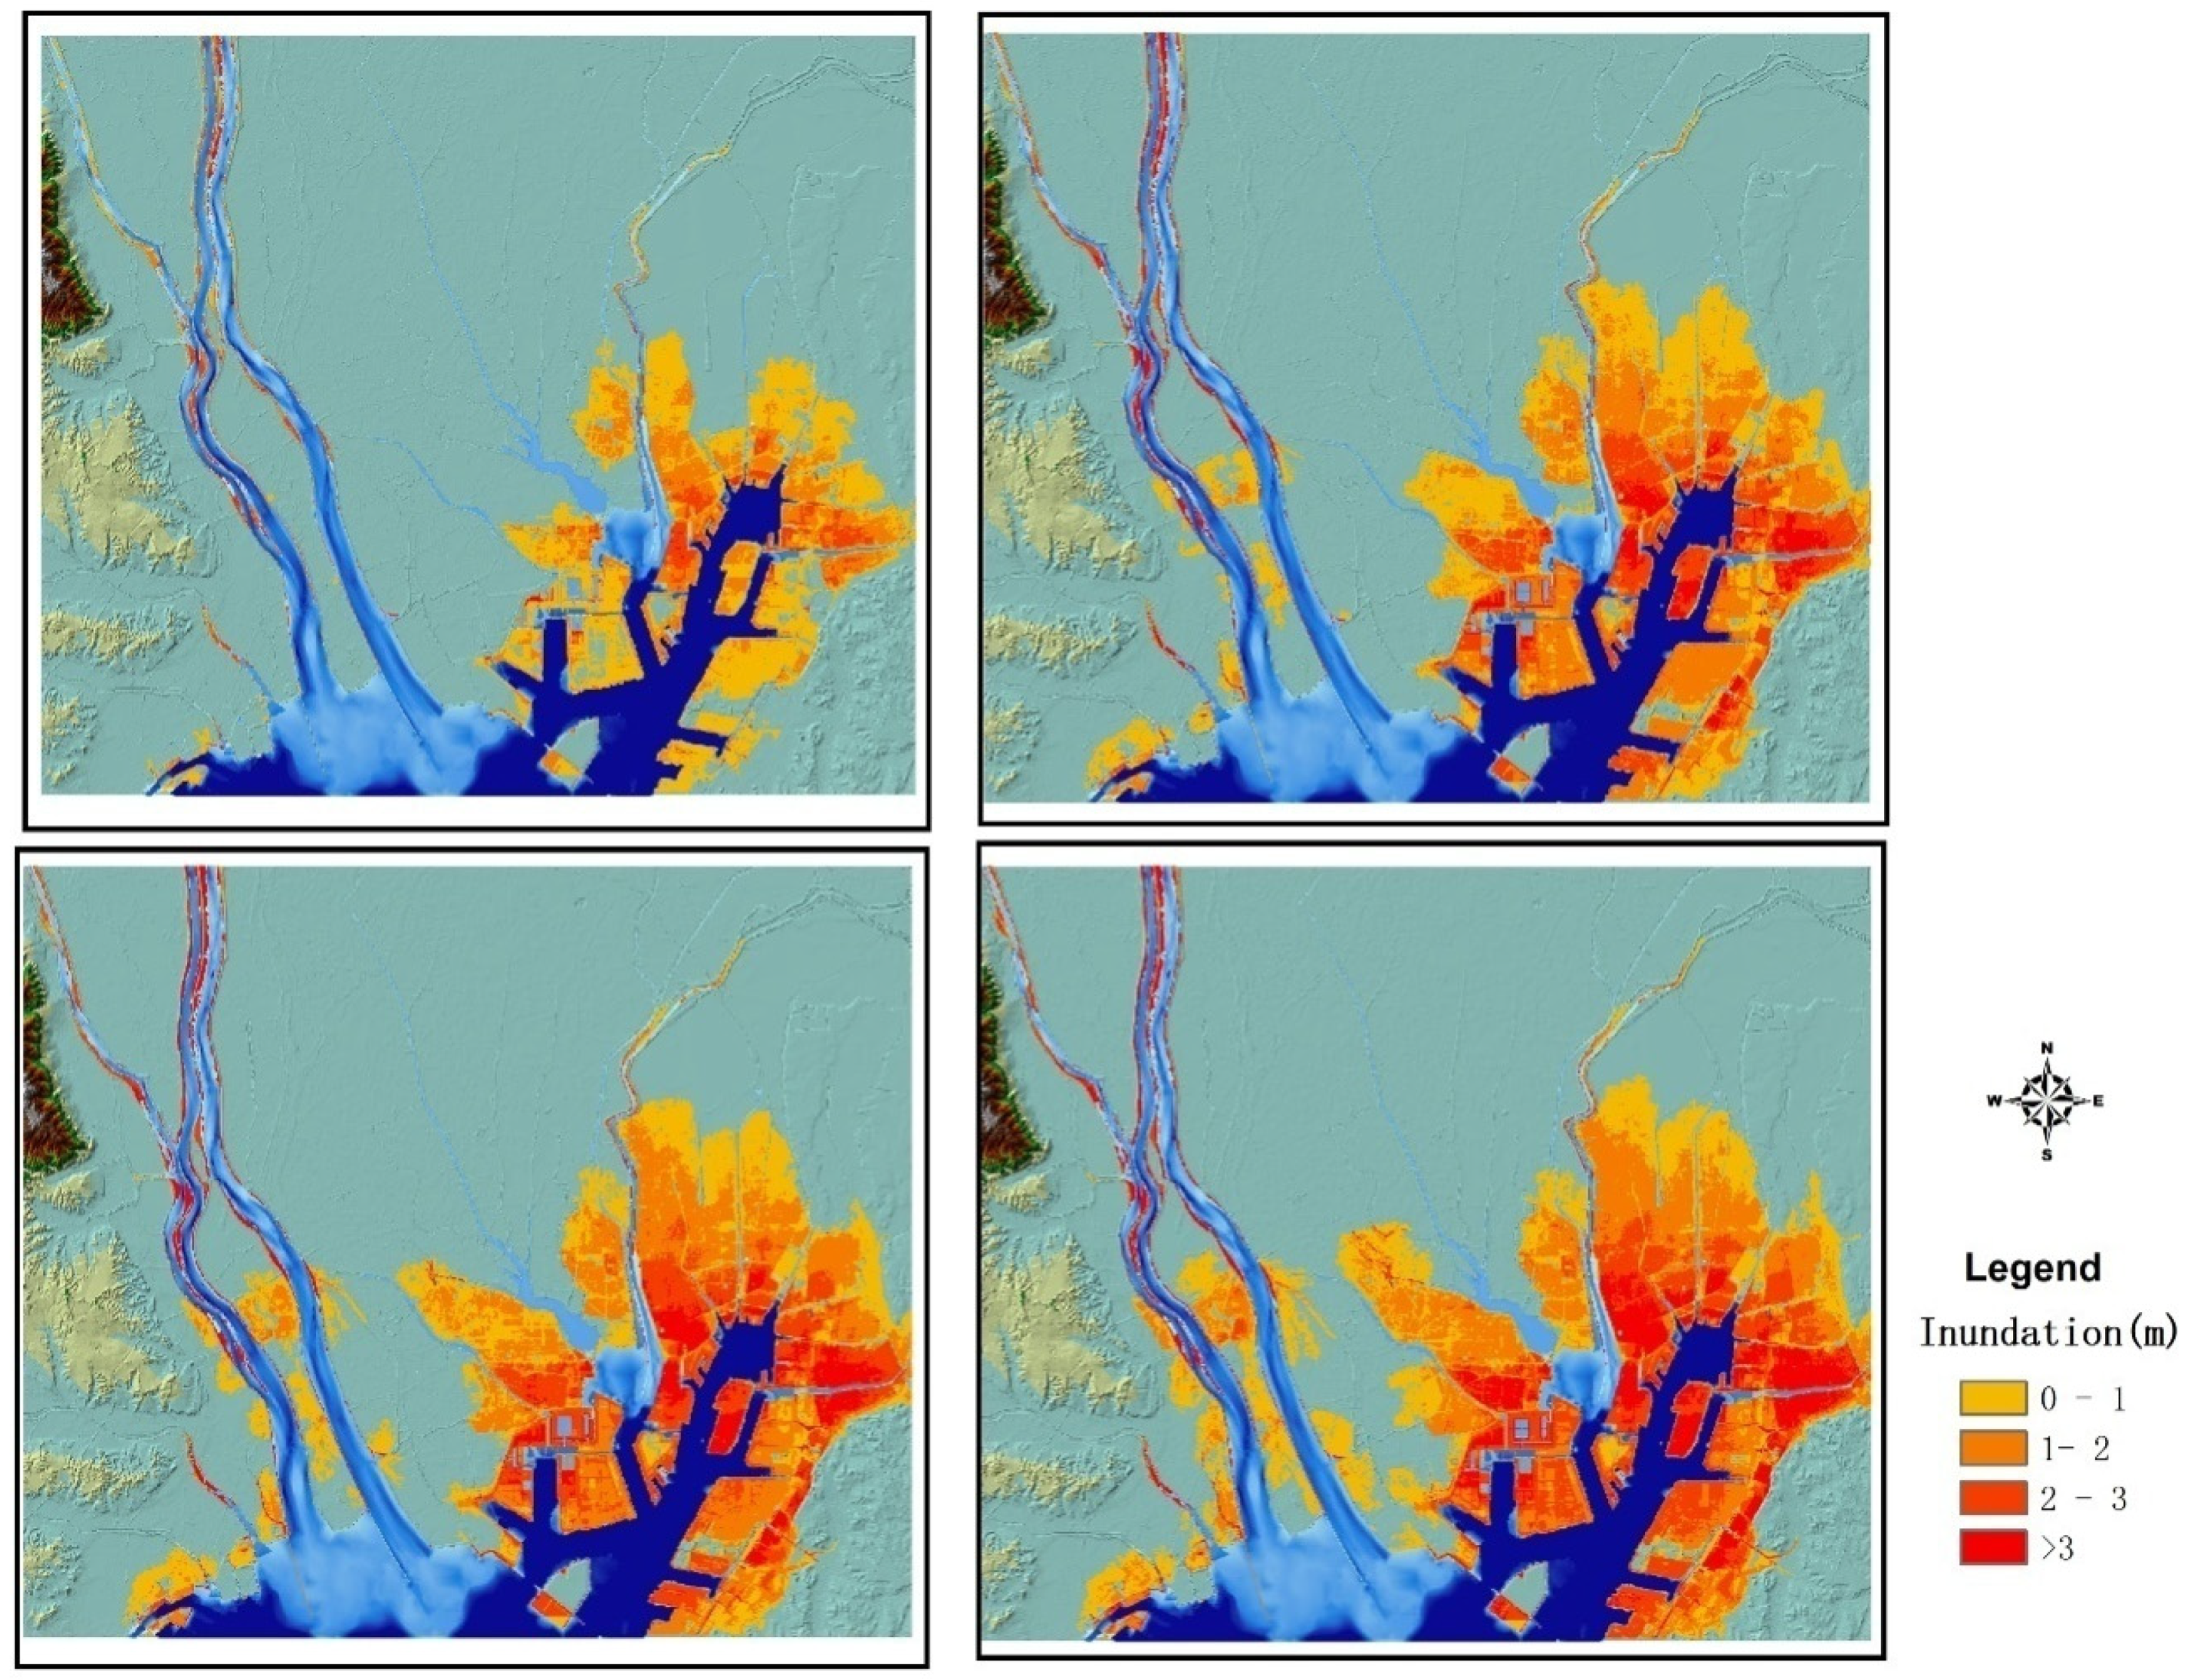
3.1. Hazard Simulation and Exposure Distribution
3.2. Estimation of EP Curves
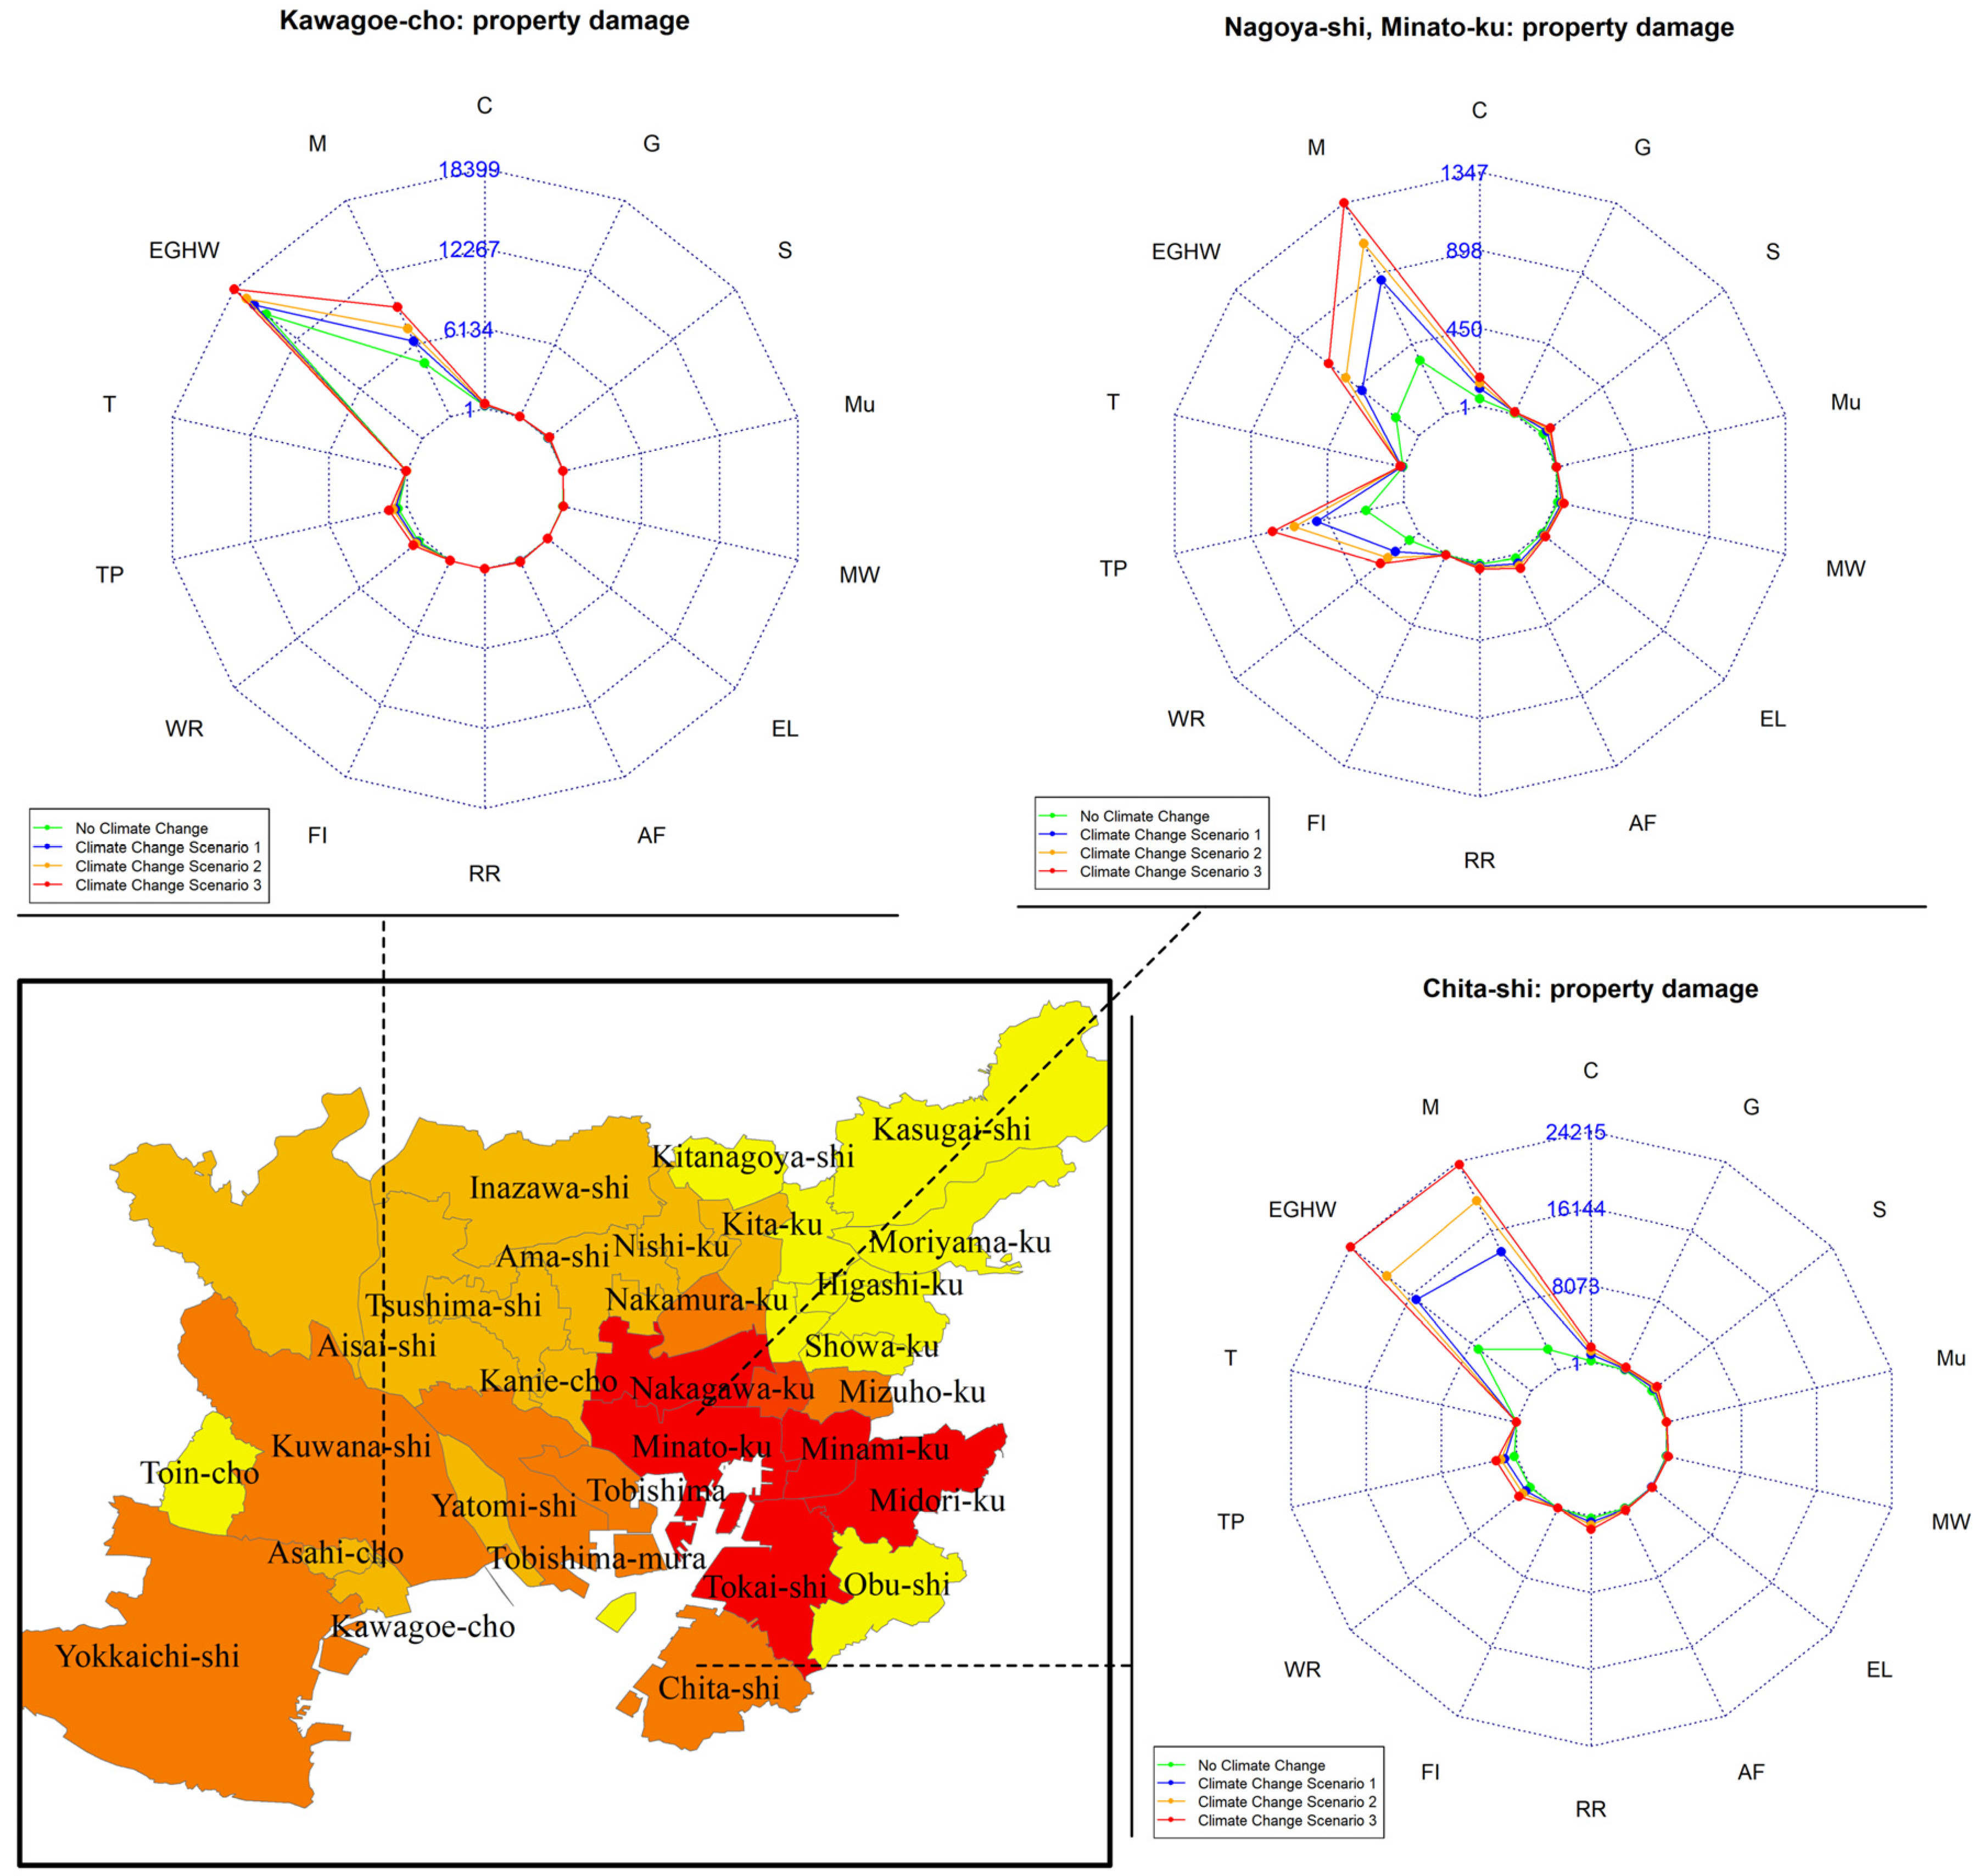
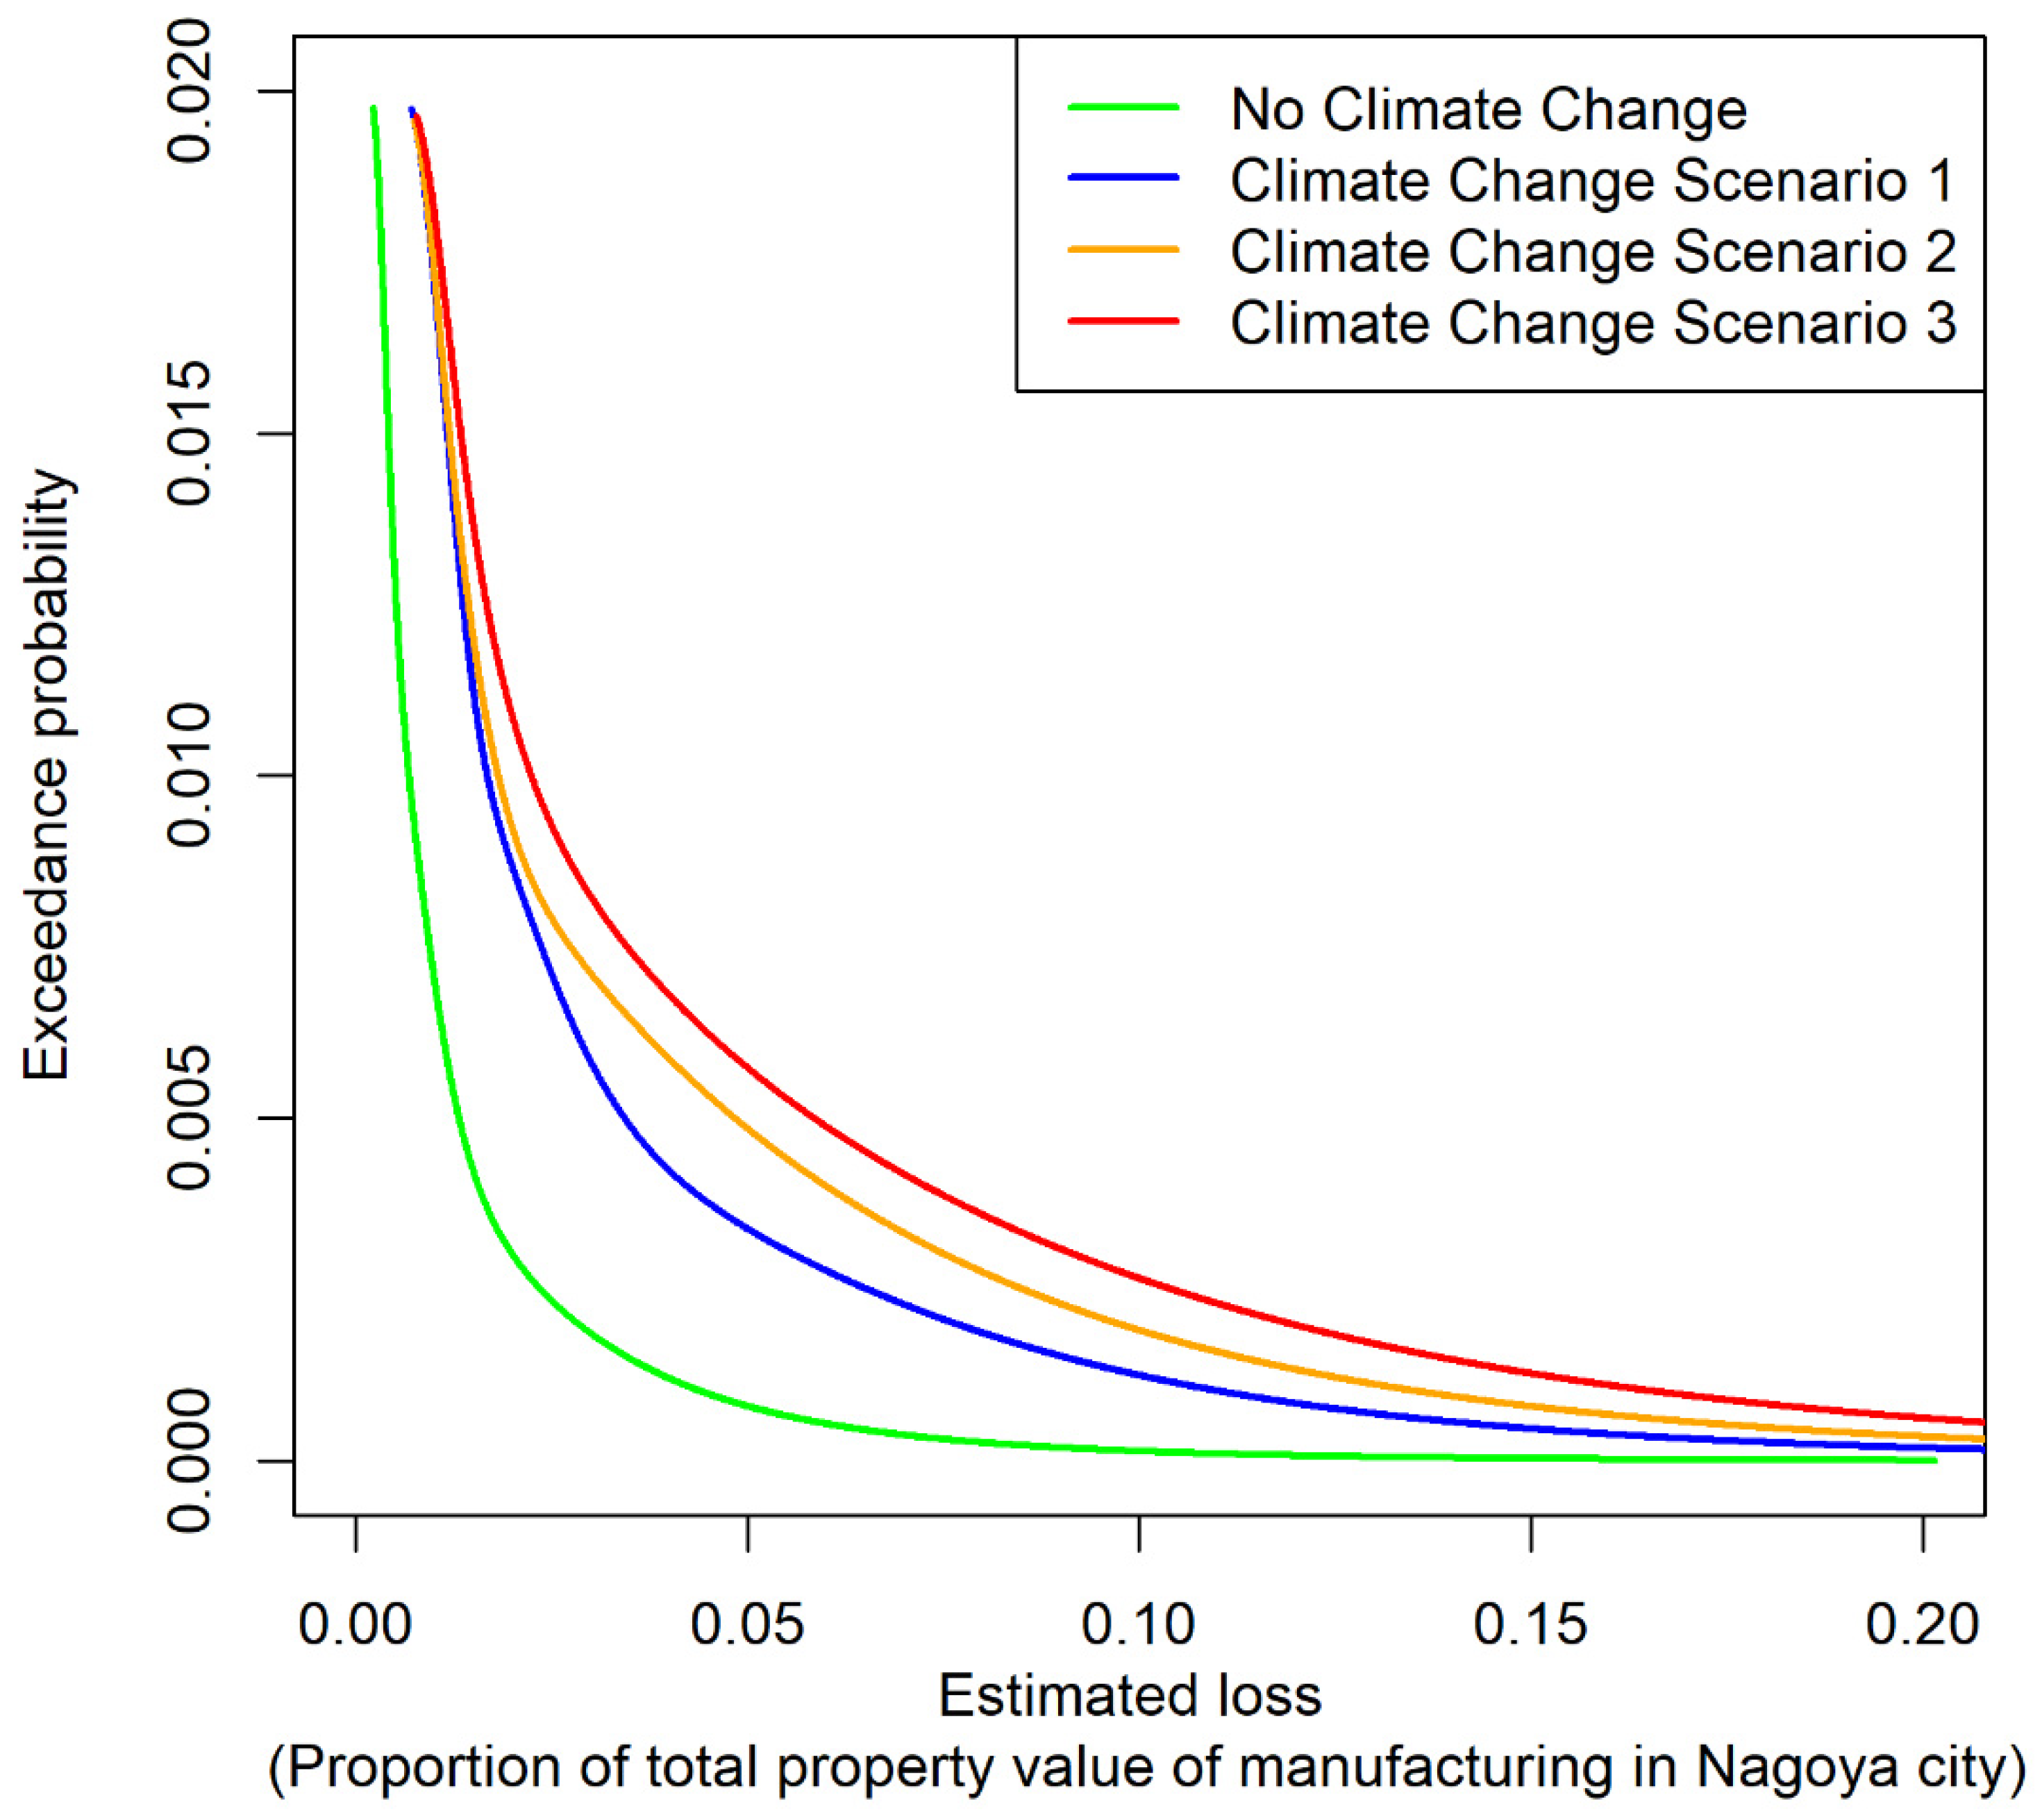
3.2.1. Region-Specific EP Curves
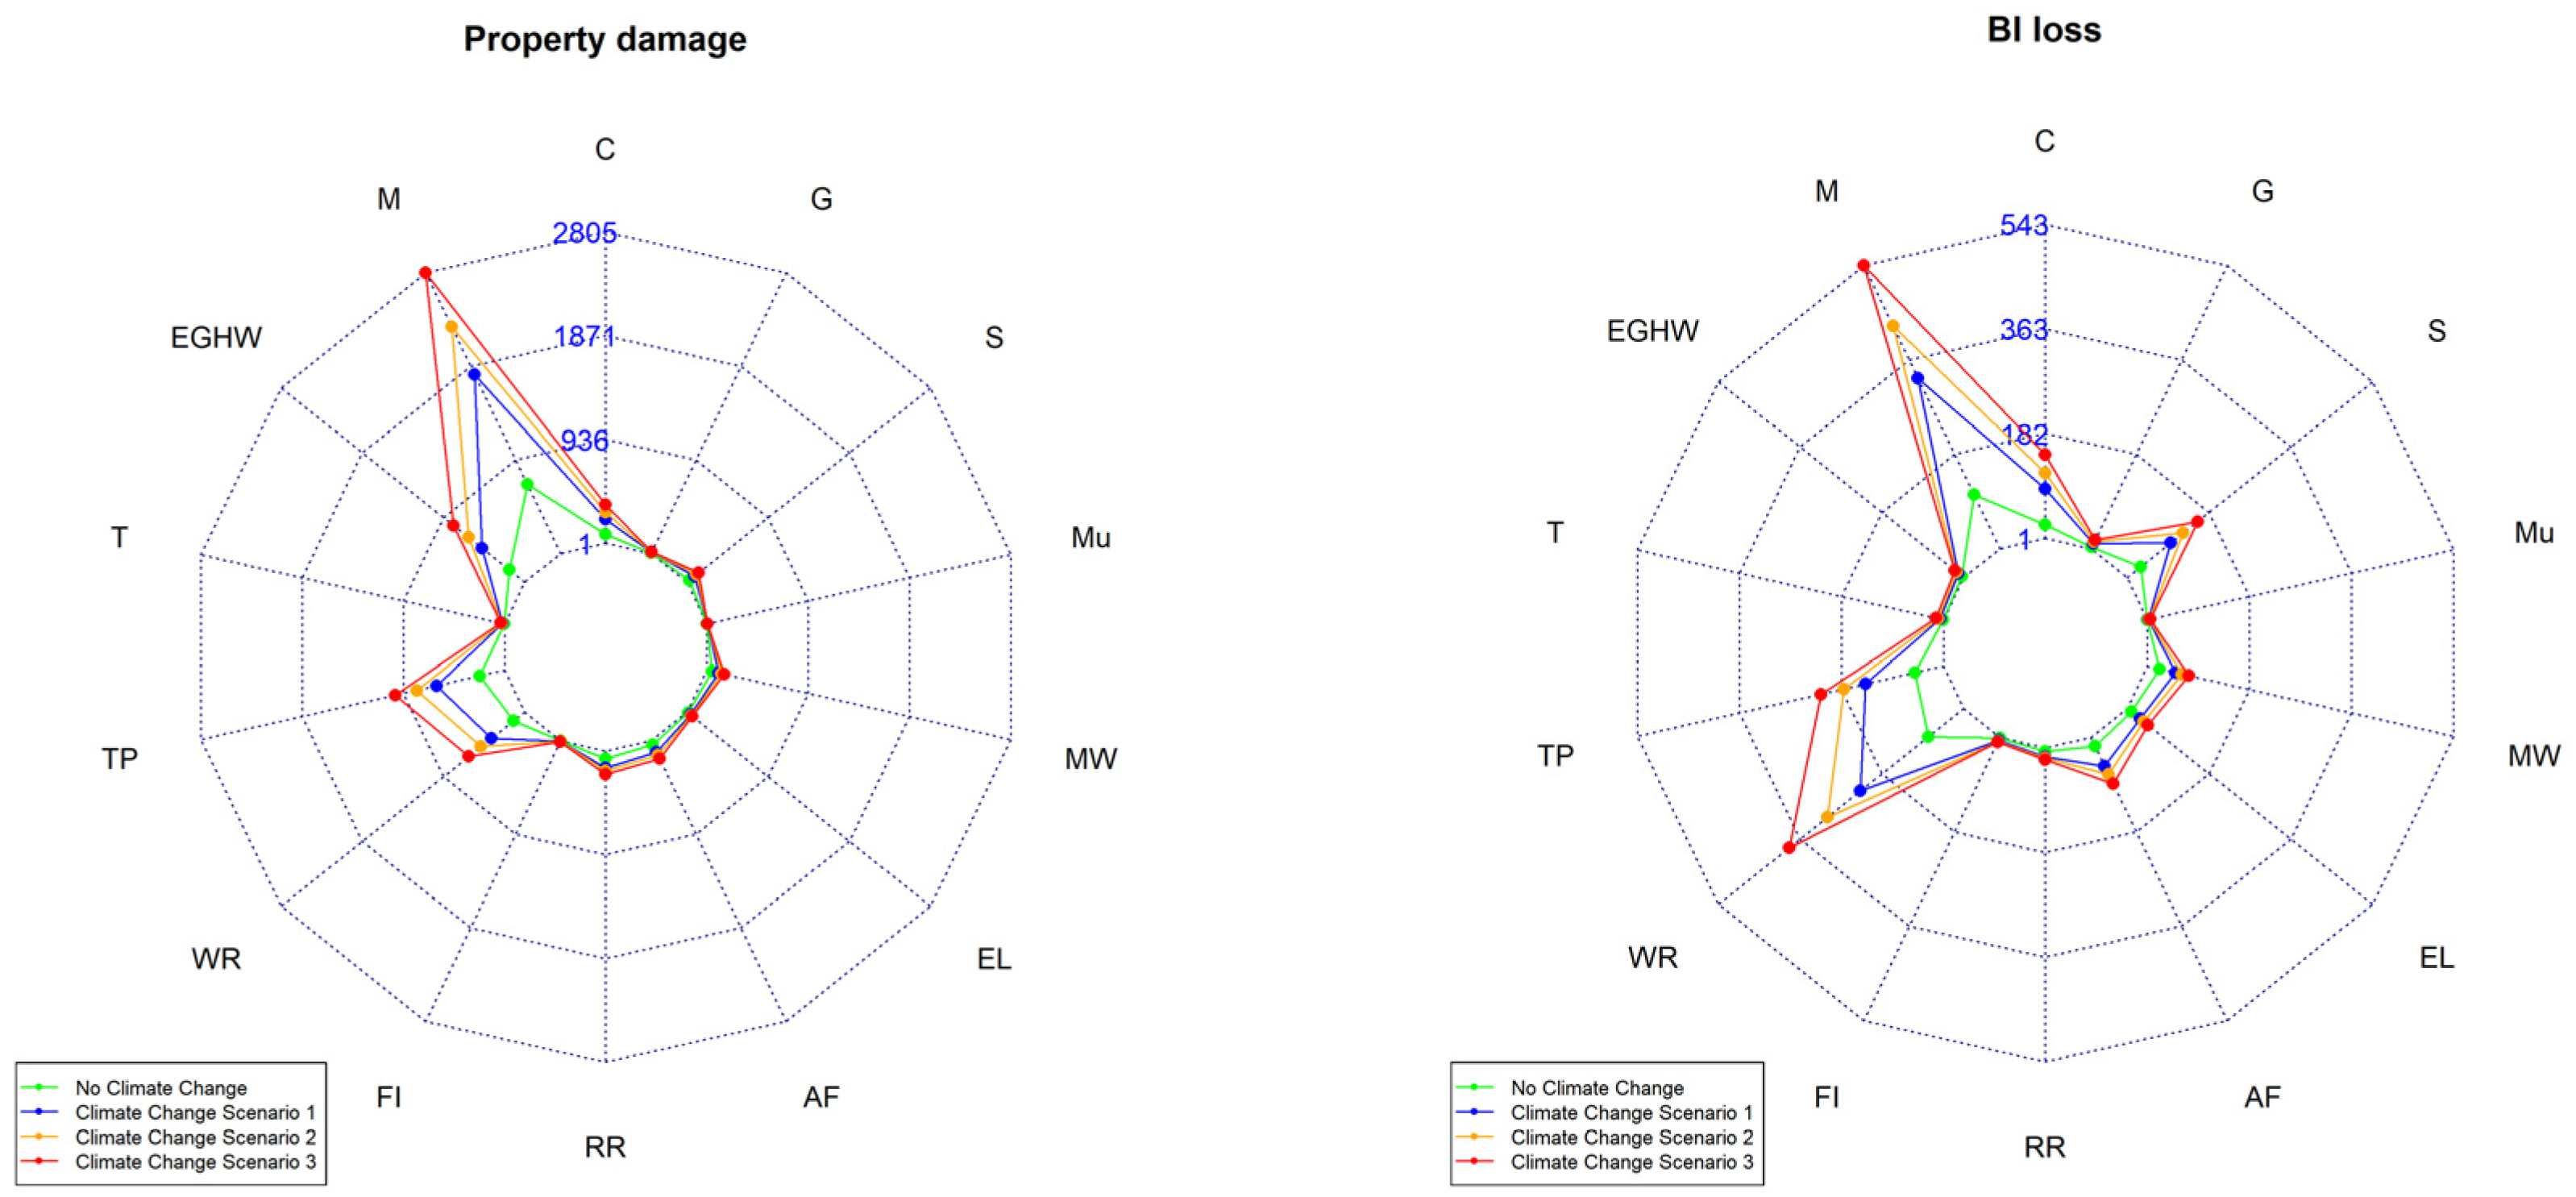
3.2.2. Industry Sector-Specific EP Curves
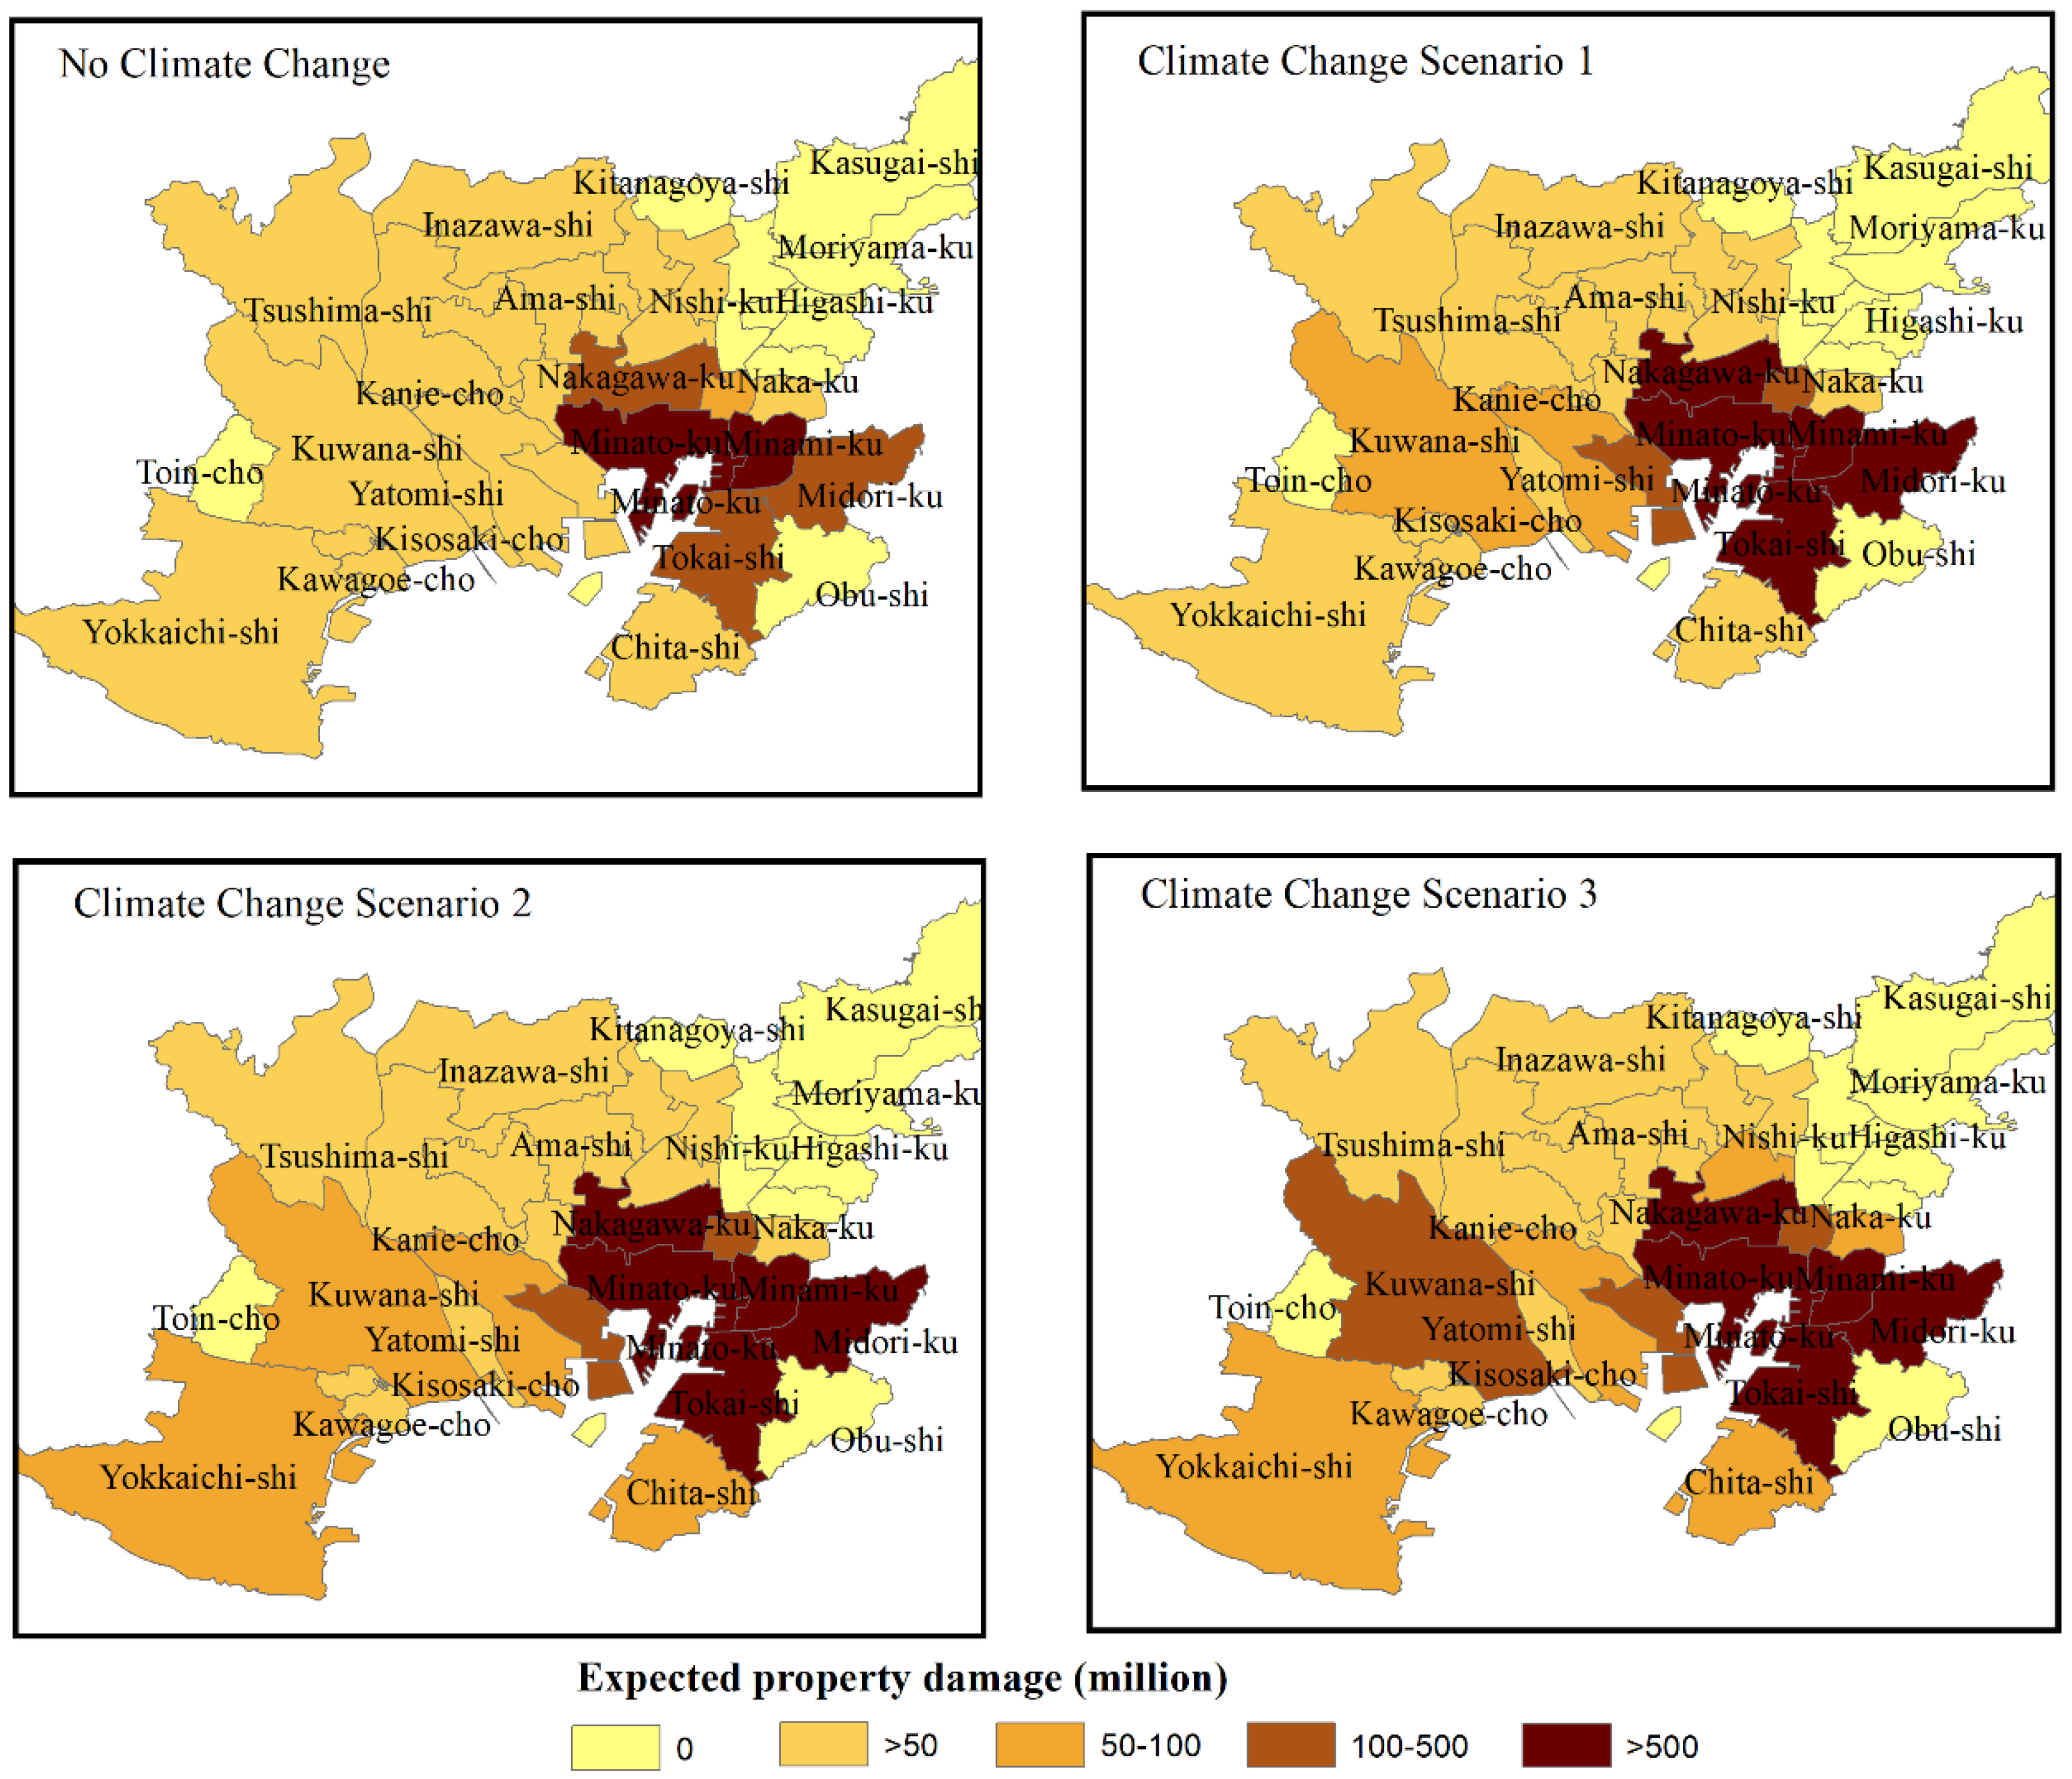
3.3. Application of EP Curves to Assess Economic Impacts
3.3.1. Identification of Risky Areas
3.3.2. Identification of Vulnerable Industry Sectors
3.3.3. Comprehensive Assessment of Vulnerable Industry Sectors in Different Areas
4. Discussions
5. Conclusions
Author Contributions
Funding
Conflicts of Interest
References
- Centre for Research on the Epidemiology of Disasters (CRED) & UN Office for Disaster Risk Reduction (UNISDR). Economic Losses, Poverty and Disasters 1998–2017. 2018. Available online: https://www.unisdr.org/we/inform/publications/61119 (accessed on 1 January 2019).
- Intergovernmental Panel on Climate Change. Climate Change 2013: The Physical Science Basis, Working Group I Contribution to the Fifth Assessment Report of the Intergovernmental Panel on Climate Change; Cambridge University Press: Cambridge, UK, 2014. [Google Scholar]
- Neumann, B.; Vafeidis, A.T.; Zimmermann, J.; Nicholls, R.J. Future coastal population growth and exposure to sea-level rise and coastal flooding-a global assessment. PLoS ONE 2015, 10, e0118571. [Google Scholar] [CrossRef] [PubMed]
- UN Office for Disaster Risk Reduction (UNISDR). Sendai framework for disaster risk reduction 2015–2030. In Proceedings of the 3rd United Nations World Conference on DRR, Sendai, Japan, 18 March 2015. [Google Scholar]
- Tatano, H. Major Characteristics of disaster risk and its management strategies. Sociotechnica 2003, 1, 141–148. [Google Scholar] [CrossRef]
- Wahl, T.; Jain, S.; Bender, J.; Meyers, S.D.; Luther, M.E. Increasing risk of compound flooding from storm surge and rainfall for major US cities. Nat. Clim. Chang. 2015, 5, 1093. [Google Scholar] [CrossRef]
- Kuriqi, A.; Ardiçlioǧlu, M. Investigation of hydraulic regime at middle part of the Loire River in context of floods and low flow events. Pollack Period. 2018, 13, 145–156. [Google Scholar] [CrossRef]
- Kuriqi, A. Assessment and quantification of meteorological data for implementation of weather radar in mountainous regions. Mausam 2016, 67, 789–802. [Google Scholar]
- Zhang, S.; Li, Y.; Ma, M.; Song, T.; Song, R. Storm Water Management and Flood Control in Sponge City Construction of Beijing. Water 2018, 10, 1040. [Google Scholar] [CrossRef]
- Gao, Y.; Wang, H.; Liu, G.M.; Sun, X.Y.; Fei, X.Y.; Wang, P.T.; He, Y.W. Risk assessment of tropical storm surges for coastal regions of China. J. Geophys. Res. Atmos. 2014, 119, 5364–5374. [Google Scholar] [CrossRef] [Green Version]
- Wu, W.; Westra, S.; Leonard, M. A basis function approach for exploring the seasonal and spatial features of storm surge events. Geophys. Res. Lett. 2017, 44, 7356–7365. [Google Scholar] [CrossRef]
- Cid, A.; Menéndez, M.; Castanedo, S.; Abascal, A.J.; Méndez, F.J.; Medina, R. Long-term changes in the frequency, intensity and duration of extreme storm surge events in southern Europe. Clim. Dyn. 2016, 46, 1503–1516. [Google Scholar] [CrossRef]
- Harman, B.P.; Heyenga, S.; Taylor, B.M.; Fletcher, C.S. Global lessons for adapting coastal communities to protect against storm surge inundation. J. Coast. Res. 2013, 31, 790–801. [Google Scholar] [CrossRef]
- Hallegatte, S.; Henriet, F.; Corfee-Morlot, J. The economics of climate change impacts and policy benefits at city scale: A conceptual framework. Clim. Chang. 2011, 104, 51–87. [Google Scholar] [CrossRef]
- Yoon, J.J. Fine-resolution Numerical Simulations to Estimate Storm Surge Height and Inundation Vulnerability Considering Future Climate Change Scenario. J. Coast. Res. 2018, 85, 916–920. [Google Scholar] [CrossRef]
- Mori, N.; Yasuda, T.; Mase, H.; Tom, T.; Oku, Y. Projection of extreme wave climate change under global warming. Hydrol. Res. Lett. 2010, 4, 15–19. [Google Scholar] [CrossRef]
- Yang, Z.; Wang, T.; Leung, R.; Hibbard, K.; Janetos, T.; Kraucunas, I.; Wilbanks, T. A modeling study of coastal inundation induced by storm surge, sea-level rise, and subsidence in the Gulf of Mexico. Nat. Hazards 2014, 71, 1771–1794. [Google Scholar] [CrossRef]
- Sahoo, B.; Bhaskaran, P.K. A comprehensive data set for tropical cyclone storm surge—Induced inundation for the east coast of India. Int. J. Climatol. 2018, 38, 403–419. [Google Scholar] [CrossRef]
- Yin, J.; Lin, N.; Yu, D. Coupled modeling of storm surge and coastal inundation: A case study in New York City during Hurricane Sandy. Water Resour. Res. 2016, 52, 8685–8699. [Google Scholar] [CrossRef] [Green Version]
- Li, N.; Yamazaki, Y.; Roeber, V.; Cheung, K.F.; Chock, G. Probabilistic mapping of storm-induced coastal inundation for climate change adaptation. Coast. Eng. 2018, 133, 126–141. [Google Scholar] [CrossRef]
- Davidson, R.A.; Lambert, K.B. Comparing the hurricane disaster risk of US coastal counties. Nat. Hazards Rev. 2001, 2, 132–142. [Google Scholar] [CrossRef]
- Zhang, J. Risk assessment of drought disaster in the maize-growing region of Songliao Plain, China. Agric. Ecosyst. Environ. 2004, 102, 133–153. [Google Scholar] [CrossRef] [Green Version]
- Balica, S.F.; Wright, N.G.; Vander Meulen, F. A flood vulnerability index for coastal cities and its use in assessing climate change impacts. Nat. Hazards 2012, 64, 73–105. [Google Scholar] [CrossRef] [Green Version]
- Ouma, Y.O.; Tateishi, R. Urban flood vulnerability and risk mapping using integrated multi-parametric AHP and GIS: Methodological overview and case study assessment. Water 2014, 6, 1515–1545. [Google Scholar] [CrossRef]
- Lowrance, W.W. Of Acceptable Risk: Science and the Determination of Safety; William Kaufmann: San Francisco, CA, USA, 1976. [Google Scholar]
- Haimes, Y.Y. On the definition of vulnerabilities in measuring risks to infrastructures. Risk Anal. Int. J. 2006, 26, 293–296. [Google Scholar] [CrossRef] [PubMed]
- Haimes, Y.Y. Systems-based guiding principles for risk modeling, planning, assessment, management, and communication. Risk Anal. Int. 2012, 32, 1451–1467. [Google Scholar] [CrossRef] [PubMed]
- Haimes, Y.Y. Risk Modeling, Assessment, and Management; John Wiley & Sons: Hoboken, NJ, USA, 2015. [Google Scholar]
- Roeckner, E.; Bengtsson, L.; Feichter, J.; Lelieveld, J.; Rodhe, H. Transient climate change simulations with a coupled atmosphere-ocean GCM including the tropospheric sulfur cycle. J. Clim. 1999, 12, 3004–3032. [Google Scholar] [CrossRef]
- Hewitson, B.C.; Crane, R.G. Consensus between GCM climate change projections with empirical downscaling: Precipitation downscaling over South Africa. Int. J. Climatol. 2006, 26, 1315–1337. [Google Scholar] [CrossRef]
- Knutson, T.R.; McBride, J.L.; Chan, J.; Kerry, E.; Holland, G.; Landsea, C.; Held, I.; Kossin, J.P.; Srivastava, A.K.; Sugi, M. Tropical cyclones and climate change. Nat. Geosci. 2010, 3, 157–163. [Google Scholar] [CrossRef] [Green Version]
- Murakami, H.; Wang, Y.; Yoshimura, H.; Mizuta, R.; Sugi, M.; Shindo, E.; Ose, T. Future changes in tropical cyclone activity projected by the new high-resolution MRI-AGCM. J. Clim. 2012, 25, 3237–3260. [Google Scholar] [CrossRef]
- Liu, P.; Kajikawa, Y.; Wang, B.; Kitoh, A.; Yasunari, T.; Li, T.; Rajendran, K. Tropical intraseasonal variability in the MRI-20km60L AGCM. J. Clim. 2009, 22, 2006–2022. [Google Scholar] [CrossRef]
- Yasuda, T.; Nakajo, S.; Kim, S.; Mase, H.; Mori, N.; Horsburgh, K. Evaluation of future storm surge risk in East Asia based on state-of-the-art climate change projection. Coast. Eng. 2014, 83, 65–71. [Google Scholar] [CrossRef]
- Kim, S.Y.; Yasuda, T.; Mase, H. Numerical analysis of effects of tidal variations on storm surges and waves. Appl. Ocean Res. 2008, 30, 311–322. [Google Scholar] [CrossRef]
- Shibutani, Y.; Kim, S.Y.; Yasuda, T.; Mori, N.; Mase, H. Sensitivity of future tropical cyclone changes to storm surge and inundation: Case study in Ise Bay, Japan. Coast. Eng. Proc. 2014, 1, 27. [Google Scholar] [CrossRef]
- Liang, Q. Flood simulation using a well-balanced shallow flow model. J. Hydraul. Eng. 2010, 136, 669–675. [Google Scholar] [CrossRef]
- Jiang, X.; Mori, N.; Tatano, H.; Yang, L.; Shibutani, Y. Estimation of property loss and business interruption loss caused by storm surge inundation due to climate change: A case of Typhoon Vera revisit. Nat. Hazards 2016, 84, 35–49. [Google Scholar] [CrossRef]
- Chang, S.E.; Falit-Baiamonte, A. Disaster vulnerability of businesses in the 2001 Nisqually earthquake. Glob. Environ. Chang. Part B Environ. Hazards 2002, 4, 59–71. [Google Scholar] [CrossRef]
- Rose, A.; Lim, D. Business interruption losses from natural hazards: Conceptual and methodological issues in the case of the Northridge earthquake. Glob. Environ. Chang. Part B Environ. Hazards 2002, 4, 1–14. [Google Scholar] [CrossRef]
- Hallegatte, S.; Hourcade, J.C.; Ambrosi, P. Using climate analogues for assessing climate change economic impacts in urban areas. Clim. Chang. 2007, 82, 47–60. [Google Scholar] [CrossRef]
- Kajitani, Y.; Tatano, H. Estimation of production capacity loss rate after the great East Japan earthquake and tsunami in 2011. Econ. Syst. Res. 2014, 26, 13–38. [Google Scholar] [CrossRef]
- Yang, L.; Kajitani, Y.; Tatano, H.; Jiang, X. A methodology for estimating business interruption loss caused by flood disasters: Insights from business surveys after Tokai Heavy Rain in Japan. Nat. Hazards 2016, 84, 411–430. [Google Scholar] [CrossRef]


| Climate Change Scenarios | Description | Number of Typhoon Ensembles | Years of Simulation |
|---|---|---|---|
| Present climate condition | No central pressure decrease; no sea level rise | 25 | 200 |
| Scenario 1 | Central pressure decrease of 10 hPa; sea level rise of 0.82 m | 25 | 200 |
| Scenario 2 | Central pressure decrease of 20 hPa; sea level rise of 0.82 m | 25 | 200 |
| Scenario 3 | Central pressure decrease of 30 hPa; sea level rise of 0.82 m | 25 | 200 |
© 2019 by the authors. Licensee MDPI, Basel, Switzerland. This article is an open access article distributed under the terms and conditions of the Creative Commons Attribution (CC BY) license (http://creativecommons.org/licenses/by/4.0/).
Share and Cite
Jiang, X.; Mori, N.; Tatano, H.; Yang, L. Simulation-Based Exceedance Probability Curves to Assess the Economic Impact of Storm Surge Inundations due to Climate Change: A Case Study in Ise Bay, Japan. Sustainability 2019, 11, 1090. https://doi.org/10.3390/su11041090
Jiang X, Mori N, Tatano H, Yang L. Simulation-Based Exceedance Probability Curves to Assess the Economic Impact of Storm Surge Inundations due to Climate Change: A Case Study in Ise Bay, Japan. Sustainability. 2019; 11(4):1090. https://doi.org/10.3390/su11041090
Chicago/Turabian StyleJiang, Xinyu, Nobuhito Mori, Hirokazu Tatano, and Lijiao Yang. 2019. "Simulation-Based Exceedance Probability Curves to Assess the Economic Impact of Storm Surge Inundations due to Climate Change: A Case Study in Ise Bay, Japan" Sustainability 11, no. 4: 1090. https://doi.org/10.3390/su11041090